
nayrbryanGaming
967 Beiträge

nayrbryanGaming
Melden
Nutzer blockieren
Content Creator | Trader | Web3 & Crypto | Photographer| CEO @NNG_ESPORT | Esports pioneer est. 2010 | IG/Twitch: @nayrbryan_gaming | TikTok:@nayrbryanGaming

SOL Halter
Regelmäßiger Trader
1.8 Jahre
924 Following
417 Follower
354 Like gegeben
Beiträge
Alle
Zitierungen
·
--
Bullisch
TRADER-MOTIVATION / MINI-EINBLICk
🧠 Erkenntnis des Tages
„Verwechsle keinen Bounce mit einem Ausbruch.“
Warum das wichtig ist
Eine Reaktion von einem Support kann stark aussehen, aber der Markt muss trotzdem erst beweisen, dass Käufer den Widerstand überwinden können.
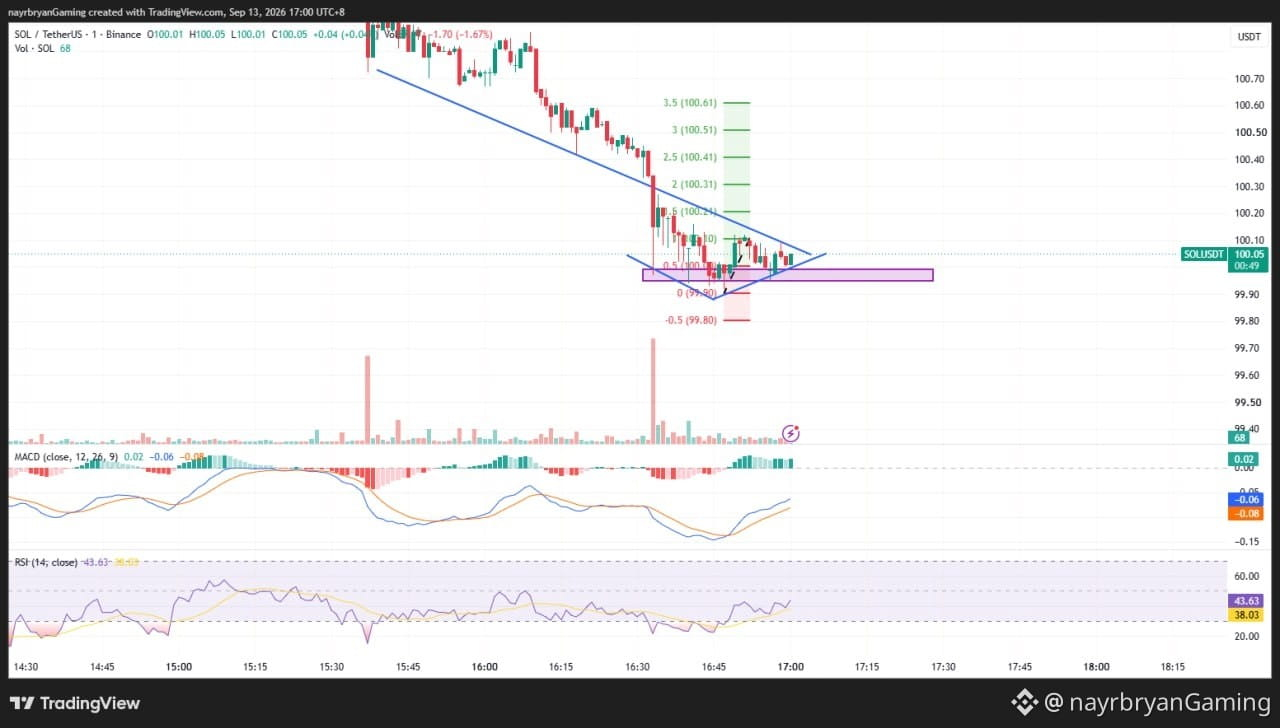
SOL komprimiert derzeit zwischen dem 99,90–100,00 Support-Bereich und der absteigenden Struktur darüber.
Die wichtige Marke ist 100,11.
Solange diese Marke nicht bestätigt ist, zählt mehr Geduld als Vorhersage.
Kluges Vorgehen fokussiert sich auf:
• Support-Reaktion • Ausbruchsbestätigung • Retest • Invalidierung • Risikokontrolle
🎯 Trader-Checkliste
Markiere die Support-Zone 99,90–100,00
Beobachte 100.11 auf Bestätigung
Achte auf die absteigende Trendlinie
Respektiere die Invalidierung bei 99,80
Vermeide das Hinterherjagen der ersten Ausbruchkerze
Schütze das Kapital
🧠 Mini-Challenge
Bevor du einsteigst, frag:
„Hat der Markt den Ausbruch bestätigt — oder gehe ich nur davon aus, dass er passiert?“
— @nayrbryanGaming #TraderMindset #TradingDiscipline #NoFOMO #CryptoMindset #DYOR #PriceAction #SOLUSDT
🔔 Folge meiner Binance Square & X (@nayrbryanGaming), um tägliche Chart-Insights zu erhalten.
TRADER-MOTIVATION / MINI-EINBLICk
🧠 Erkenntnis des Tages
„Verwechsle keinen Bounce mit einem Ausbruch.“
Warum das wichtig ist
Eine Reaktion von einem Support kann stark aussehen, aber der Markt muss trotzdem erst beweisen, dass Käufer den Widerstand überwinden können.
SOL komprimiert derzeit zwischen dem 99,90–100,00 Support-Bereich und der absteigenden Struktur darüber.
Die wichtige Marke ist 100,11.
Solange diese Marke nicht bestätigt ist, zählt mehr Geduld als Vorhersage.
Kluges Vorgehen fokussiert sich auf:
• Support-Reaktion • Ausbruchsbestätigung • Retest • Invalidierung • Risikokontrolle
🎯 Trader-Checkliste
Markiere die Support-Zone 99,90–100,00
Beobachte 100.11 auf Bestätigung
Achte auf die absteigende Trendlinie
Respektiere die Invalidierung bei 99,80
Vermeide das Hinterherjagen der ersten Ausbruchkerze
Schütze das Kapital
🧠 Mini-Challenge
Bevor du einsteigst, frag:
„Hat der Markt den Ausbruch bestätigt — oder gehe ich nur davon aus, dass er passiert?“
— @nayrbryanGaming #TraderMindset #TradingDiscipline #NoFOMO #CryptoMindset #DYOR #PriceAction #SOLUSDT
🔔 Folge meiner Binance Square & X (@nayrbryanGaming), um tägliche Chart-Insights zu erhalten.
🧠 Erkenntnis des Tages
„Verwechsle keinen Bounce mit einem Ausbruch.“
Warum das wichtig ist
Eine Reaktion von einem Support kann stark aussehen, aber der Markt muss trotzdem erst beweisen, dass Käufer den Widerstand überwinden können.
SOL komprimiert derzeit zwischen dem 99,90–100,00 Support-Bereich und der absteigenden Struktur darüber.
Die wichtige Marke ist 100,11.
Solange diese Marke nicht bestätigt ist, zählt mehr Geduld als Vorhersage.
Kluges Vorgehen fokussiert sich auf:
• Support-Reaktion • Ausbruchsbestätigung • Retest • Invalidierung • Risikokontrolle
🎯 Trader-Checkliste
Markiere die Support-Zone 99,90–100,00
Beobachte 100.11 auf Bestätigung
Achte auf die absteigende Trendlinie
Respektiere die Invalidierung bei 99,80
Vermeide das Hinterherjagen der ersten Ausbruchkerze
Schütze das Kapital
🧠 Mini-Challenge
Bevor du einsteigst, frag:
„Hat der Markt den Ausbruch bestätigt — oder gehe ich nur davon aus, dass er passiert?“
— @nayrbryanGaming #TraderMindset #TradingDiscipline #NoFOMO #CryptoMindset #DYOR #PriceAction #SOLUSDT
🔔 Folge meiner Binance Square & X (@nayrbryanGaming), um tägliche Chart-Insights zu erhalten.
60
·
--
Bullisch
Übersetzung ansehen
LIGHT ANALYSIS / CHART SETUP — SOL/USDT
📈 Structure Overview
Market phase: Sell-off → Support reaction → Compression
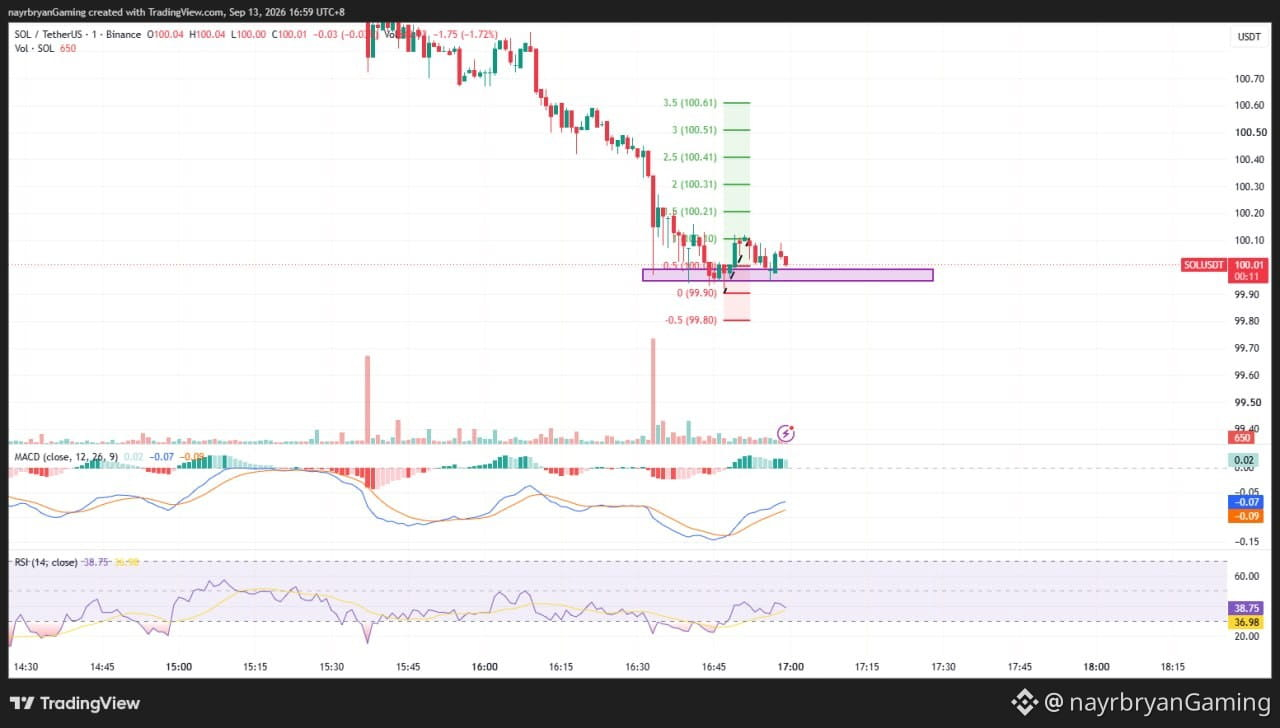
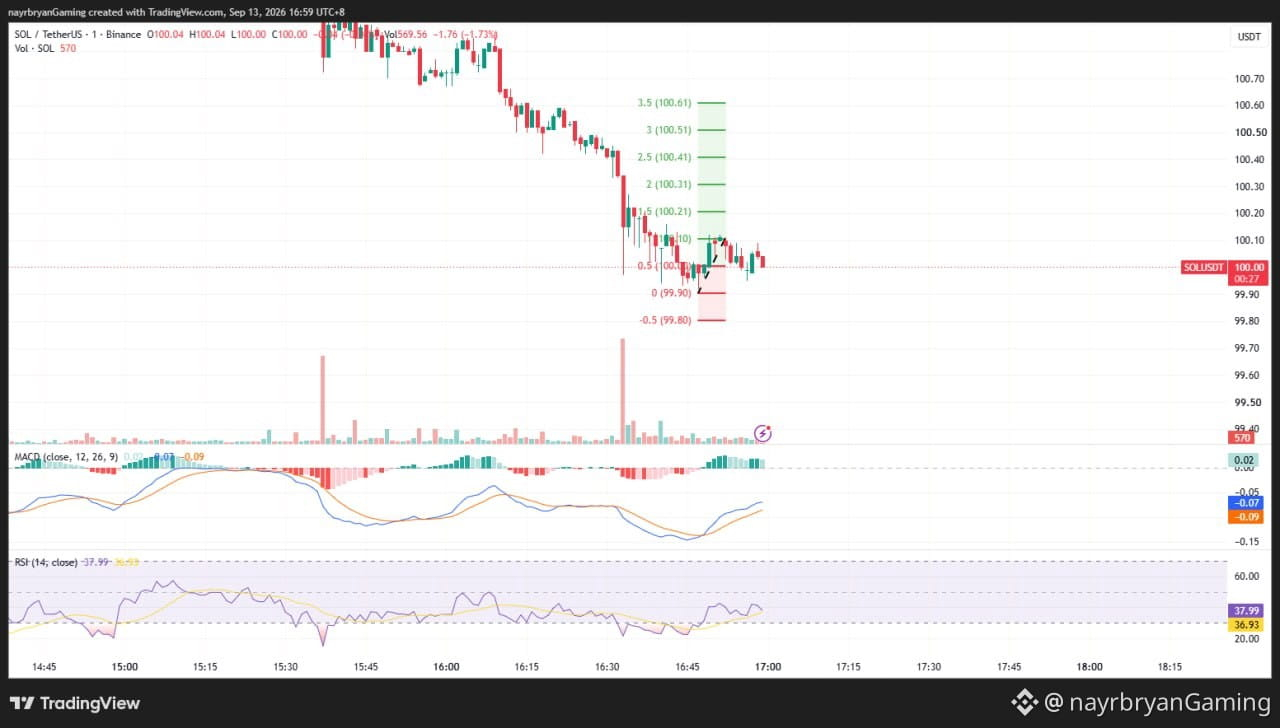
Key support zone: 99.90 – 100.00
Key breakout level: 100.11
Major upside levels: 100.21 → 100.31 → 100.41 → 100.51 → 100.61
Downside invalidation reference: 99.80
📌 What I’m Watching
Scenario A — Bullish Continuation
If SOL holds the 99.90–100.00 support area and breaks above 100.11, price may rotate toward:
100.21 → 100.31 → 100.41 → 100.51 → 100.61
A sustained move above 100.11 would provide stronger confirmation that buyers are regaining short-term control.
Scenario B — Support Failure
If SOL loses 99.90, the current recovery structure weakens.
The next marked downside Fibonacci reference is:
99.80
A move below that level would invalidate the immediate bullish continuation framework and require a fresh structure assessment.
📊 Indicator Check
MACD: Improving → short-term momentum recovering
RSI: 43.63 → weak-to-neutral, recovering
Price Structure: Descending trendline + tightening compression
Key Confirmation: 100.11 breakout / 99.90 support failure
Note: This is a chart framework, not a trade recommendation. Use it to support your own DYOR-based execution plan.
— @nayrbryanGaming #SOLAnalysis #ChartSetup #PriceAction #SmartMoney #Fibonacci #CryptoTrading #DYOR #NFA
LIGHT ANALYSIS / CHART SETUP — SOL/USDT
📈 Structure Overview
Market phase: Sell-off → Support reaction → Compression
Key support zone: 99.90 – 100.00
Key breakout level: 100.11
Major upside levels: 100.21 → 100.31 → 100.41 → 100.51 → 100.61
Downside invalidation reference: 99.80
📌 What I’m Watching
Scenario A — Bullish Continuation
If SOL holds the 99.90–100.00 support area and breaks above 100.11, price may rotate toward:
100.21 → 100.31 → 100.41 → 100.51 → 100.61
A sustained move above 100.11 would provide stronger confirmation that buyers are regaining short-term control.
Scenario B — Support Failure
If SOL loses 99.90, the current recovery structure weakens.
The next marked downside Fibonacci reference is:
99.80
A move below that level would invalidate the immediate bullish continuation framework and require a fresh structure assessment.
📊 Indicator Check
MACD: Improving → short-term momentum recovering
RSI: 43.63 → weak-to-neutral, recovering
Price Structure: Descending trendline + tightening compression
Key Confirmation: 100.11 breakout / 99.90 support failure
Note: This is a chart framework, not a trade recommendation. Use it to support your own DYOR-based execution plan.
— @nayrbryanGaming #SOLAnalysis #ChartSetup #PriceAction #SmartMoney #Fibonacci #CryptoTrading #DYOR #NFA
📈 Structure Overview
Market phase: Sell-off → Support reaction → Compression
Key support zone: 99.90 – 100.00
Key breakout level: 100.11
Major upside levels: 100.21 → 100.31 → 100.41 → 100.51 → 100.61
Downside invalidation reference: 99.80
📌 What I’m Watching
Scenario A — Bullish Continuation
If SOL holds the 99.90–100.00 support area and breaks above 100.11, price may rotate toward:
100.21 → 100.31 → 100.41 → 100.51 → 100.61
A sustained move above 100.11 would provide stronger confirmation that buyers are regaining short-term control.
Scenario B — Support Failure
If SOL loses 99.90, the current recovery structure weakens.
The next marked downside Fibonacci reference is:
99.80
A move below that level would invalidate the immediate bullish continuation framework and require a fresh structure assessment.
📊 Indicator Check
MACD: Improving → short-term momentum recovering
RSI: 43.63 → weak-to-neutral, recovering
Price Structure: Descending trendline + tightening compression
Key Confirmation: 100.11 breakout / 99.90 support failure
Note: This is a chart framework, not a trade recommendation. Use it to support your own DYOR-based execution plan.
— @nayrbryanGaming #SOLAnalysis #ChartSetup #PriceAction #SmartMoney #Fibonacci #CryptoTrading #DYOR #NFA
76
·
--
Bullisch
Übersetzung ansehen
DAILY SIGNAL — SOL/USDT
Date: 13 Sep 2026 Timeframe: 1m Intraday Bias: Support reaction → compression → breakout attempt
📊 Market Bias
SOL is recovering from the recent sell-off and is currently consolidating around the 99.90–100.00 structure zone.
Price reacted from the lower support area and is now forming a tighter structure beneath the descending trendline.
The latest candles are holding above the 99.90 area, while short-term momentum is gradually improving.
A confirmed break above the local resistance around 100.11 would strengthen the bullish continuation scenario.
🔹 Key Levels From Chart
Entry / Reaction Zone: 99.90 → 100.00
Key Support: 99.90
Breakout Confirmation: 100.11
Invalidation Reference: Below 99.80
🎯 Upside Fibonacci Targets
TP1 → 100.11 (1.0 Fib) TP2 → 100.21 (1.5 Fib) TP3 → 100.31 (2.0 Fib) TP4 → 100.41 (2.5 Fib) TP5 → 100.51 (3.0 Fib) TP6 → 100.61 (3.5 Fib)
🔻 Downside Reference
If the support structure fails:
99.80 (-0.5 Fib)
A sustained move below 99.90 would weaken the current recovery structure.
📈 Technical Breakdown
SOL remains within a broader short-term descending structure after the sharp decline from the 100.70+ area.
However, price has reacted from the 99.90 support region and is now compressing near the upper part of the local structure.
MACD momentum is improving, with the histogram turning positive while the MACD lines are recovering from lower levels.
RSI is around 43.63, showing that momentum is still below the bullish midpoint but recovering from weaker conditions.
The key level to watch is 100.11.
A confirmed reclaim above this level could open the path toward:
100.21 → 100.31 → 100.41 → 100.51 → 100.61
🧠 Quick Insight
“Support gives the setup. Confirmation gives the direction.”
⚠️ Disclaimer
This is personal market analysis, not financial advice. This chart framework is for educational purposes only.
Always DYOR / DYODD, manage risk properly, and avoid emotional trading.
— @nayrbryanGaming #SOL #SOLUSDT #Crypto #Trading #TechnicalAnalysis #PriceAction #Fibonacci
DAILY SIGNAL — SOL/USDT
Date: 13 Sep 2026 Timeframe: 1m Intraday Bias: Support reaction → compression → breakout attempt
📊 Market Bias
SOL is recovering from the recent sell-off and is currently consolidating around the 99.90–100.00 structure zone.
Price reacted from the lower support area and is now forming a tighter structure beneath the descending trendline.
The latest candles are holding above the 99.90 area, while short-term momentum is gradually improving.
A confirmed break above the local resistance around 100.11 would strengthen the bullish continuation scenario.
🔹 Key Levels From Chart
Entry / Reaction Zone: 99.90 → 100.00
Key Support: 99.90
Breakout Confirmation: 100.11
Invalidation Reference: Below 99.80
🎯 Upside Fibonacci Targets
TP1 → 100.11 (1.0 Fib) TP2 → 100.21 (1.5 Fib) TP3 → 100.31 (2.0 Fib) TP4 → 100.41 (2.5 Fib) TP5 → 100.51 (3.0 Fib) TP6 → 100.61 (3.5 Fib)
🔻 Downside Reference
If the support structure fails:
99.80 (-0.5 Fib)
A sustained move below 99.90 would weaken the current recovery structure.
📈 Technical Breakdown
SOL remains within a broader short-term descending structure after the sharp decline from the 100.70+ area.
However, price has reacted from the 99.90 support region and is now compressing near the upper part of the local structure.
MACD momentum is improving, with the histogram turning positive while the MACD lines are recovering from lower levels.
RSI is around 43.63, showing that momentum is still below the bullish midpoint but recovering from weaker conditions.
The key level to watch is 100.11.
A confirmed reclaim above this level could open the path toward:
100.21 → 100.31 → 100.41 → 100.51 → 100.61
🧠 Quick Insight
“Support gives the setup. Confirmation gives the direction.”
⚠️ Disclaimer
This is personal market analysis, not financial advice. This chart framework is for educational purposes only.
Always DYOR / DYODD, manage risk properly, and avoid emotional trading.
— @nayrbryanGaming #SOL #SOLUSDT #Crypto #Trading #TechnicalAnalysis #PriceAction #Fibonacci
Date: 13 Sep 2026 Timeframe: 1m Intraday Bias: Support reaction → compression → breakout attempt
📊 Market Bias
SOL is recovering from the recent sell-off and is currently consolidating around the 99.90–100.00 structure zone.
Price reacted from the lower support area and is now forming a tighter structure beneath the descending trendline.
The latest candles are holding above the 99.90 area, while short-term momentum is gradually improving.
A confirmed break above the local resistance around 100.11 would strengthen the bullish continuation scenario.
🔹 Key Levels From Chart
Entry / Reaction Zone: 99.90 → 100.00
Key Support: 99.90
Breakout Confirmation: 100.11
Invalidation Reference: Below 99.80
🎯 Upside Fibonacci Targets
TP1 → 100.11 (1.0 Fib) TP2 → 100.21 (1.5 Fib) TP3 → 100.31 (2.0 Fib) TP4 → 100.41 (2.5 Fib) TP5 → 100.51 (3.0 Fib) TP6 → 100.61 (3.5 Fib)
🔻 Downside Reference
If the support structure fails:
99.80 (-0.5 Fib)
A sustained move below 99.90 would weaken the current recovery structure.
📈 Technical Breakdown
SOL remains within a broader short-term descending structure after the sharp decline from the 100.70+ area.
However, price has reacted from the 99.90 support region and is now compressing near the upper part of the local structure.
MACD momentum is improving, with the histogram turning positive while the MACD lines are recovering from lower levels.
RSI is around 43.63, showing that momentum is still below the bullish midpoint but recovering from weaker conditions.
The key level to watch is 100.11.
A confirmed reclaim above this level could open the path toward:
100.21 → 100.31 → 100.41 → 100.51 → 100.61
🧠 Quick Insight
“Support gives the setup. Confirmation gives the direction.”
⚠️ Disclaimer
This is personal market analysis, not financial advice. This chart framework is for educational purposes only.
Always DYOR / DYODD, manage risk properly, and avoid emotional trading.
— @nayrbryanGaming #SOL #SOLUSDT #Crypto #Trading #TechnicalAnalysis #PriceAction #Fibonacci
1
162
·
--
Bärisch
Übersetzung ansehen
TRADER MOTIVATION / MINI INSIGHT
🧠 Insight of the Day
“Don’t predict the breakout. Let the structure prove it.”
Why This Matters
When price compresses between converging trendlines, both buyers and sellers can become trapped by premature entries.
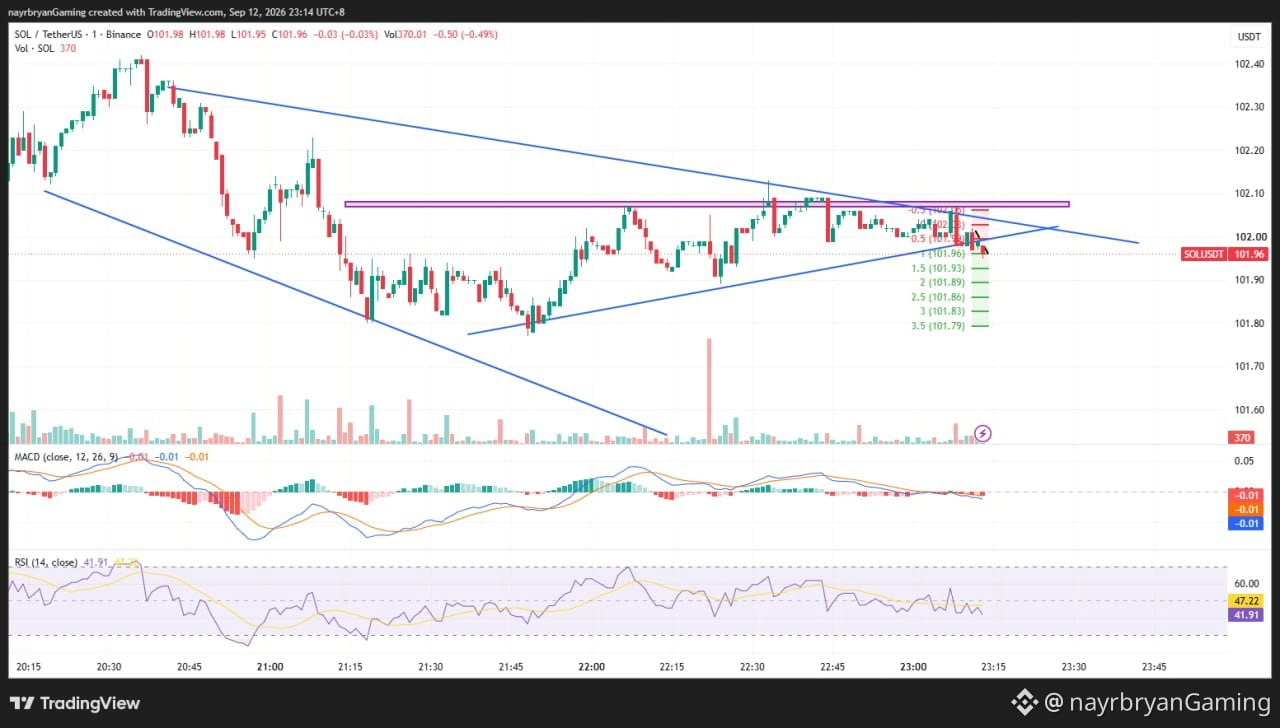
SOL is currently testing the relationship between the 102.04–102.10 resistance zone and the lower structure around 101.96.
The important question is not:
“Will SOL break down?”
The better question is:
“Which side of the structure will actually confirm?”
🎯 Trader Checklist
Mark the 102.04–102.10 resistance
Watch 101.96 structure
Wait for confirmation
Respect invalidation
Monitor the Fibonacci levels
Avoid chasing the candle
Protect capital
🧠 Mini Challenge
Before entering, ask:
“Am I trading confirmed structure — or simply guessing the next candle?”
— @nayrbryanGaming #TraderMindset #TradingDiscipline #NoFOMO #CryptoMindset #DYOR #PriceAction #SOLUSDT
🔔 Follow my Binance Square & X (@nayrbryanGaming) for daily chart insights.
TRADER MOTIVATION / MINI INSIGHT
🧠 Insight of the Day
“Don’t predict the breakout. Let the structure prove it.”
Why This Matters
When price compresses between converging trendlines, both buyers and sellers can become trapped by premature entries.
SOL is currently testing the relationship between the 102.04–102.10 resistance zone and the lower structure around 101.96.
The important question is not:
“Will SOL break down?”
The better question is:
“Which side of the structure will actually confirm?”
🎯 Trader Checklist
Mark the 102.04–102.10 resistance
Watch 101.96 structure
Wait for confirmation
Respect invalidation
Monitor the Fibonacci levels
Avoid chasing the candle
Protect capital
🧠 Mini Challenge
Before entering, ask:
“Am I trading confirmed structure — or simply guessing the next candle?”
— @nayrbryanGaming #TraderMindset #TradingDiscipline #NoFOMO #CryptoMindset #DYOR #PriceAction #SOLUSDT
🔔 Follow my Binance Square & X (@nayrbryanGaming) for daily chart insights.
🧠 Insight of the Day
“Don’t predict the breakout. Let the structure prove it.”
Why This Matters
When price compresses between converging trendlines, both buyers and sellers can become trapped by premature entries.
SOL is currently testing the relationship between the 102.04–102.10 resistance zone and the lower structure around 101.96.
The important question is not:
“Will SOL break down?”
The better question is:
“Which side of the structure will actually confirm?”
🎯 Trader Checklist
Mark the 102.04–102.10 resistance
Watch 101.96 structure
Wait for confirmation
Respect invalidation
Monitor the Fibonacci levels
Avoid chasing the candle
Protect capital
🧠 Mini Challenge
Before entering, ask:
“Am I trading confirmed structure — or simply guessing the next candle?”
— @nayrbryanGaming #TraderMindset #TradingDiscipline #NoFOMO #CryptoMindset #DYOR #PriceAction #SOLUSDT
🔔 Follow my Binance Square & X (@nayrbryanGaming) for daily chart insights.
46
·
--
Bärisch
Übersetzung ansehen
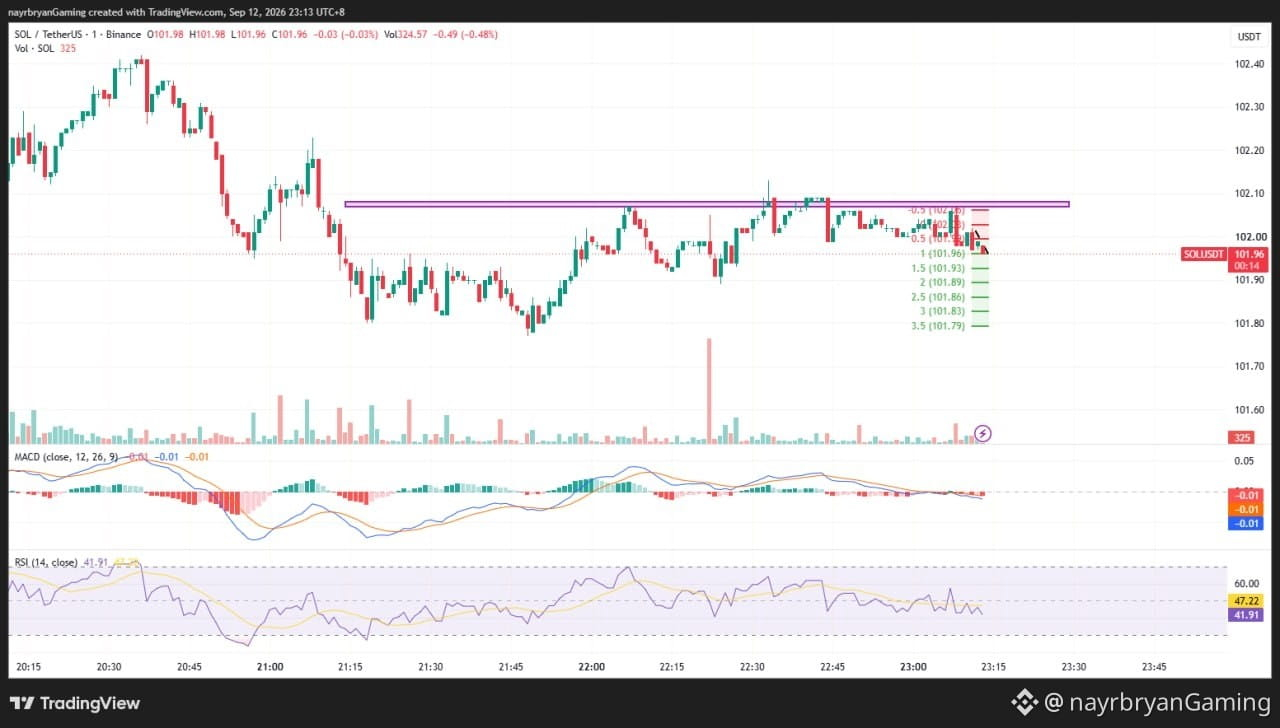
LIGHT ANALYSIS / CHART SETUP — SOL/USDT
📈 Structure Overview
Market phase: Recovery → Compression → Resistance rejection
Converging structure: Lower highs + rising short-term support
Key reaction zone: 102.04 – 102.10
Key Fibonacci reference: 101.96
Downside levels: 101.93 → 101.89 → 101.86 → 101.83 → 101.79
📌 What I’m Watching
Scenario A — Bearish Continuation
If SOL continues rejecting the 102.04–102.10 resistance area and remains below the upper structure, price may rotate toward:
101.93 → 101.89 → 101.86 → 101.83 → 101.79
The first important confirmation area is around 101.96.
Scenario B — Bullish Reclaim
If SOL reclaims 102.04 and successfully breaks through the 102.10 resistance area, the immediate bearish structure weakens.
A sustained breakout would require reassessing the short-term bearish setup.
📊 Indicator Check
MACD: Slightly below zero → bearish momentum remains present
RSI: 41.91 → weak-to-neutral momentum
Price Structure: Converging trendlines + lower highs
Key Confirmation: 101.96 breakdown / 102.10 reclaim
Note: This is a chart framework, not a trade recommendation. Use it to support your own DYOR-based execution plan.
— @nayrbryanGaming #SOLAnalysis #ChartSetup #PriceAction #SmartMoney #Fibonacci #CryptoTrading #DYOR #NFA
LIGHT ANALYSIS / CHART SETUP — SOL/USDT
📈 Structure Overview
Market phase: Recovery → Compression → Resistance rejection
Converging structure: Lower highs + rising short-term support
Key reaction zone: 102.04 – 102.10
Key Fibonacci reference: 101.96
Downside levels: 101.93 → 101.89 → 101.86 → 101.83 → 101.79
📌 What I’m Watching
Scenario A — Bearish Continuation
If SOL continues rejecting the 102.04–102.10 resistance area and remains below the upper structure, price may rotate toward:
101.93 → 101.89 → 101.86 → 101.83 → 101.79
The first important confirmation area is around 101.96.
Scenario B — Bullish Reclaim
If SOL reclaims 102.04 and successfully breaks through the 102.10 resistance area, the immediate bearish structure weakens.
A sustained breakout would require reassessing the short-term bearish setup.
📊 Indicator Check
MACD: Slightly below zero → bearish momentum remains present
RSI: 41.91 → weak-to-neutral momentum
Price Structure: Converging trendlines + lower highs
Key Confirmation: 101.96 breakdown / 102.10 reclaim
Note: This is a chart framework, not a trade recommendation. Use it to support your own DYOR-based execution plan.
— @nayrbryanGaming #SOLAnalysis #ChartSetup #PriceAction #SmartMoney #Fibonacci #CryptoTrading #DYOR #NFA
📈 Structure Overview
Market phase: Recovery → Compression → Resistance rejection
Converging structure: Lower highs + rising short-term support
Key reaction zone: 102.04 – 102.10
Key Fibonacci reference: 101.96
Downside levels: 101.93 → 101.89 → 101.86 → 101.83 → 101.79
📌 What I’m Watching
Scenario A — Bearish Continuation
If SOL continues rejecting the 102.04–102.10 resistance area and remains below the upper structure, price may rotate toward:
101.93 → 101.89 → 101.86 → 101.83 → 101.79
The first important confirmation area is around 101.96.
Scenario B — Bullish Reclaim
If SOL reclaims 102.04 and successfully breaks through the 102.10 resistance area, the immediate bearish structure weakens.
A sustained breakout would require reassessing the short-term bearish setup.
📊 Indicator Check
MACD: Slightly below zero → bearish momentum remains present
RSI: 41.91 → weak-to-neutral momentum
Price Structure: Converging trendlines + lower highs
Key Confirmation: 101.96 breakdown / 102.10 reclaim
Note: This is a chart framework, not a trade recommendation. Use it to support your own DYOR-based execution plan.
— @nayrbryanGaming #SOLAnalysis #ChartSetup #PriceAction #SmartMoney #Fibonacci #CryptoTrading #DYOR #NFA
62
·
--
Bärisch
Übersetzung ansehen
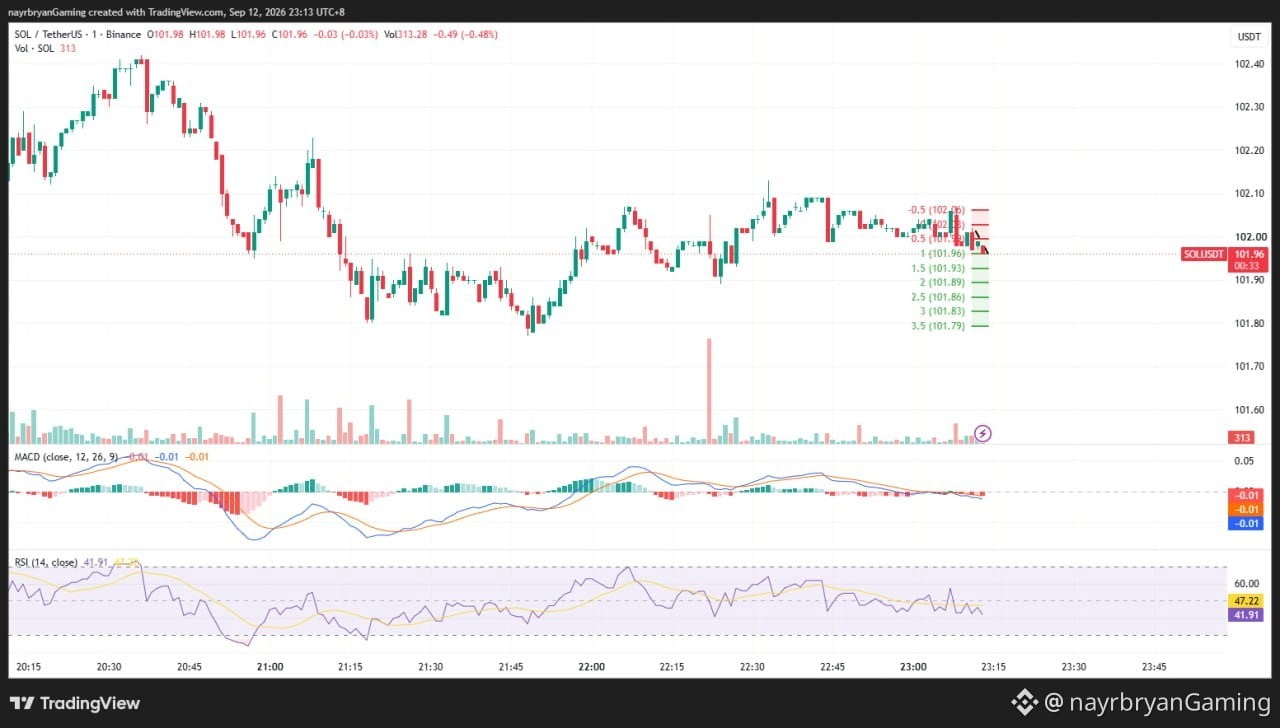
DAILY SIGNAL — SOL/USDT
Date: 12 Sep 2026 Timeframe: 1m Intraday Bias: Resistance rejection → bearish continuation
📊 Market Bias
SOL is consolidating inside a tightening structure after recovering from the previous sell-off.
Price recently tested the upper resistance area around 102.04–102.10 and failed to maintain the breakout.
The latest candles are rotating lower toward the lower side of the structure, keeping short-term momentum cautious-to-bearish.
🔹 Key Levels From Chart
Short Reaction Zone: 102.04 → 102.10
Key Resistance: 102.10
Fibonacci Reference: 101.96
Structure Support: 101.93
🎯 Downside Fibonacci Targets
TP1 → 101.93 (1.5 Fib) TP2 → 101.89 (2.0 Fib) TP3 → 101.86 (2.5 Fib) TP4 → 101.83 (3.0 Fib) TP5 → 101.79 (3.5 Fib)
🔺 Bullish Invalidation / Reclaim
A sustained reclaim above the 102.10 resistance area would weaken the immediate bearish continuation scenario.
📈 Technical Breakdown
SOL has formed a series of lower highs after reaching the upper part of the current structure.
The blue trendlines are converging, showing compression as price approaches the apex.
Price rejected the 102.04–102.10 area and is now moving back toward the lower structure.
MACD is slightly negative, while RSI is around 41.91, showing weakening short-term momentum without being deeply oversold.
A continued rejection below the resistance zone followed by a move through 101.96 would favor a rotation toward the marked downside Fibonacci levels.
🧠 Quick Insight
“Compression creates opportunity, but confirmation decides direction.”
⚠️ Disclaimer
This is personal market analysis, not financial advice. This chart framework is for educational purposes only.
Always DYOR / DYODD, manage risk properly, and avoid emotional trading.
— @nayrbryanGaming #SOL #SOLUSDT #Crypto #Trading #TechnicalAnalysis #PriceAction #Fibonacci #Binance #DYOR #NFA #NoFOMO
DAILY SIGNAL — SOL/USDT
Date: 12 Sep 2026 Timeframe: 1m Intraday Bias: Resistance rejection → bearish continuation
📊 Market Bias
SOL is consolidating inside a tightening structure after recovering from the previous sell-off.
Price recently tested the upper resistance area around 102.04–102.10 and failed to maintain the breakout.
The latest candles are rotating lower toward the lower side of the structure, keeping short-term momentum cautious-to-bearish.
🔹 Key Levels From Chart
Short Reaction Zone: 102.04 → 102.10
Key Resistance: 102.10
Fibonacci Reference: 101.96
Structure Support: 101.93
🎯 Downside Fibonacci Targets
TP1 → 101.93 (1.5 Fib) TP2 → 101.89 (2.0 Fib) TP3 → 101.86 (2.5 Fib) TP4 → 101.83 (3.0 Fib) TP5 → 101.79 (3.5 Fib)
🔺 Bullish Invalidation / Reclaim
A sustained reclaim above the 102.10 resistance area would weaken the immediate bearish continuation scenario.
📈 Technical Breakdown
SOL has formed a series of lower highs after reaching the upper part of the current structure.
The blue trendlines are converging, showing compression as price approaches the apex.
Price rejected the 102.04–102.10 area and is now moving back toward the lower structure.
MACD is slightly negative, while RSI is around 41.91, showing weakening short-term momentum without being deeply oversold.
A continued rejection below the resistance zone followed by a move through 101.96 would favor a rotation toward the marked downside Fibonacci levels.
🧠 Quick Insight
“Compression creates opportunity, but confirmation decides direction.”
⚠️ Disclaimer
This is personal market analysis, not financial advice. This chart framework is for educational purposes only.
Always DYOR / DYODD, manage risk properly, and avoid emotional trading.
— @nayrbryanGaming #SOL #SOLUSDT #Crypto #Trading #TechnicalAnalysis #PriceAction #Fibonacci #Binance #DYOR #NFA #NoFOMO
Date: 12 Sep 2026 Timeframe: 1m Intraday Bias: Resistance rejection → bearish continuation
📊 Market Bias
SOL is consolidating inside a tightening structure after recovering from the previous sell-off.
Price recently tested the upper resistance area around 102.04–102.10 and failed to maintain the breakout.
The latest candles are rotating lower toward the lower side of the structure, keeping short-term momentum cautious-to-bearish.
🔹 Key Levels From Chart
Short Reaction Zone: 102.04 → 102.10
Key Resistance: 102.10
Fibonacci Reference: 101.96
Structure Support: 101.93
🎯 Downside Fibonacci Targets
TP1 → 101.93 (1.5 Fib) TP2 → 101.89 (2.0 Fib) TP3 → 101.86 (2.5 Fib) TP4 → 101.83 (3.0 Fib) TP5 → 101.79 (3.5 Fib)
🔺 Bullish Invalidation / Reclaim
A sustained reclaim above the 102.10 resistance area would weaken the immediate bearish continuation scenario.
📈 Technical Breakdown
SOL has formed a series of lower highs after reaching the upper part of the current structure.
The blue trendlines are converging, showing compression as price approaches the apex.
Price rejected the 102.04–102.10 area and is now moving back toward the lower structure.
MACD is slightly negative, while RSI is around 41.91, showing weakening short-term momentum without being deeply oversold.
A continued rejection below the resistance zone followed by a move through 101.96 would favor a rotation toward the marked downside Fibonacci levels.
🧠 Quick Insight
“Compression creates opportunity, but confirmation decides direction.”
⚠️ Disclaimer
This is personal market analysis, not financial advice. This chart framework is for educational purposes only.
Always DYOR / DYODD, manage risk properly, and avoid emotional trading.
— @nayrbryanGaming #SOL #SOLUSDT #Crypto #Trading #TechnicalAnalysis #PriceAction #Fibonacci #Binance #DYOR #NFA #NoFOMO
1
134
·
--
Bullisch
TRADER-MOTIVATION / MINI-EINBLICK
🧠 Einblick des Tages
„Bestätigung ist mehr wert als Vorhersage.“
Warum das wichtig ist
Eine starke Kerze kann überzeugend wirken, aber eine einzelne Kerze definiert nicht die gesamte Struktur.
SOL hat sich von der unteren Zone erholt und testet nun die nächste Fibonacci-Stufe bei etwa 102,38.
Der bessere Ansatz ist zu beobachten, wie der Kurs sich an den wichtigen Levels verhält, statt dem Momentum hinterherzulaufen.
Smartes Vorgehen konzentriert sich auf:
• Struktur • Bestätigung • Retests • Invalidierung • Risikokontrolle
🎯 Trader-Checkliste
Markiere die Support-Zone 101,18–101,35
Behalte das Level 102,38 im Blick
Warte auf Bestätigung
Halte dich an die Struktur-Invalidierung
Vermeide es, verlängerten Kerzen hinterherzulaufen
Schütze das Kapital
🧠 Mini-Challenge
Frag vor dem Einstieg:
„Hat die Struktur die Bewegung bestätigt – oder reagiere ich nur auf Momentum?“
— @nayrbryanGaming #TraderMindset #TradingDiscipline #NoFOMO #CryptoMindset #DYOR #PriceAction #SOLUSDT
🔔 Folge meinem Binance Square & X (@nayrbryanGaming) für tägliche Chart-Insights.
TRADER-MOTIVATION / MINI-EINBLICK
🧠 Einblick des Tages
„Bestätigung ist mehr wert als Vorhersage.“
Warum das wichtig ist
Eine starke Kerze kann überzeugend wirken, aber eine einzelne Kerze definiert nicht die gesamte Struktur.
SOL hat sich von der unteren Zone erholt und testet nun die nächste Fibonacci-Stufe bei etwa 102,38.
Der bessere Ansatz ist zu beobachten, wie der Kurs sich an den wichtigen Levels verhält, statt dem Momentum hinterherzulaufen.
Smartes Vorgehen konzentriert sich auf:
• Struktur • Bestätigung • Retests • Invalidierung • Risikokontrolle
🎯 Trader-Checkliste
Markiere die Support-Zone 101,18–101,35
Behalte das Level 102,38 im Blick
Warte auf Bestätigung
Halte dich an die Struktur-Invalidierung
Vermeide es, verlängerten Kerzen hinterherzulaufen
Schütze das Kapital
🧠 Mini-Challenge
Frag vor dem Einstieg:
„Hat die Struktur die Bewegung bestätigt – oder reagiere ich nur auf Momentum?“
— @nayrbryanGaming #TraderMindset #TradingDiscipline #NoFOMO #CryptoMindset #DYOR #PriceAction #SOLUSDT
🔔 Folge meinem Binance Square & X (@nayrbryanGaming) für tägliche Chart-Insights.
🧠 Einblick des Tages
„Bestätigung ist mehr wert als Vorhersage.“
Warum das wichtig ist
Eine starke Kerze kann überzeugend wirken, aber eine einzelne Kerze definiert nicht die gesamte Struktur.
SOL hat sich von der unteren Zone erholt und testet nun die nächste Fibonacci-Stufe bei etwa 102,38.
Der bessere Ansatz ist zu beobachten, wie der Kurs sich an den wichtigen Levels verhält, statt dem Momentum hinterherzulaufen.
Smartes Vorgehen konzentriert sich auf:
• Struktur • Bestätigung • Retests • Invalidierung • Risikokontrolle
🎯 Trader-Checkliste
Markiere die Support-Zone 101,18–101,35
Behalte das Level 102,38 im Blick
Warte auf Bestätigung
Halte dich an die Struktur-Invalidierung
Vermeide es, verlängerten Kerzen hinterherzulaufen
Schütze das Kapital
🧠 Mini-Challenge
Frag vor dem Einstieg:
„Hat die Struktur die Bewegung bestätigt – oder reagiere ich nur auf Momentum?“
— @nayrbryanGaming #TraderMindset #TradingDiscipline #NoFOMO #CryptoMindset #DYOR #PriceAction #SOLUSDT
🔔 Folge meinem Binance Square & X (@nayrbryanGaming) für tägliche Chart-Insights.
48
·
--
Bullisch
Übersetzung ansehen
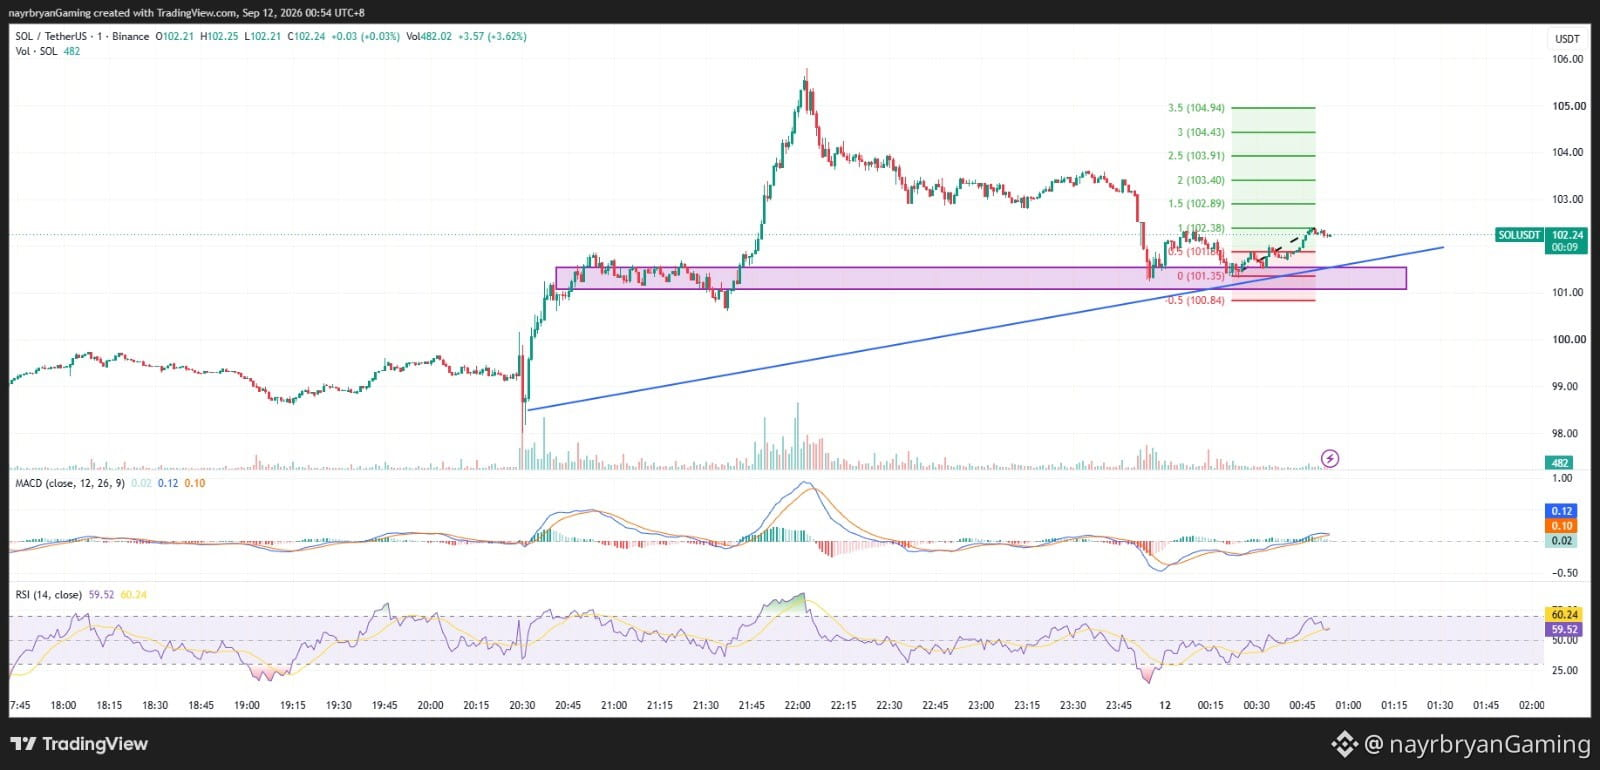
LIGHT ANALYSIS / CHART SETUP — SOL/USDT
📈 Structure Overview
Market phase: Sharp sell-off → Base formation → Recovery → Bullish continuation attempt
Key support: 101.18 – 101.35
Current Fibonacci resistance: 102.38
Next upside levels: 102.89 → 103.40 → 103.91 → 104.43 → 104.94
Major downside reference: 100.84
📌 What I’m Watching
Scenario A — Bullish Continuation
If SOL maintains the current recovery structure and holds above 101.35, price may continue rotating toward:
102.38 → 102.89 → 103.40 → 103.91 → 104.43 → 104.94
A sustained move through 102.38 would provide stronger confirmation of upside continuation.
Scenario B — Support Failure
If SOL loses the 101.18–101.35 structure zone, the current bullish setup weakens.
The chart's marked downside Fibonacci reference is:
100.84
A break of the lower structure would require reassessing the current bullish continuation thesis.
📊 Indicator Check
MACD: Positive → improving short-term momentum
RSI: 59.52 → bullish-leaning, not deeply overbought
Price Structure: Recovery + higher support structure
Key Confirmation: 101.35 hold / 102.38 reclaim
Note: This is a chart framework, not a trade recommendation. Use it to support your own DYOR-based execution plan.
— @nayrbryanGaming #SOLAnalysis #ChartSetup #PriceAction #SmartMoney #Fibonacci #CryptoTrading #DYOR #NFA
LIGHT ANALYSIS / CHART SETUP — SOL/USDT
📈 Structure Overview
Market phase: Sharp sell-off → Base formation → Recovery → Bullish continuation attempt
Key support: 101.18 – 101.35
Current Fibonacci resistance: 102.38
Next upside levels: 102.89 → 103.40 → 103.91 → 104.43 → 104.94
Major downside reference: 100.84
📌 What I’m Watching
Scenario A — Bullish Continuation
If SOL maintains the current recovery structure and holds above 101.35, price may continue rotating toward:
102.38 → 102.89 → 103.40 → 103.91 → 104.43 → 104.94
A sustained move through 102.38 would provide stronger confirmation of upside continuation.
Scenario B — Support Failure
If SOL loses the 101.18–101.35 structure zone, the current bullish setup weakens.
The chart's marked downside Fibonacci reference is:
100.84
A break of the lower structure would require reassessing the current bullish continuation thesis.
📊 Indicator Check
MACD: Positive → improving short-term momentum
RSI: 59.52 → bullish-leaning, not deeply overbought
Price Structure: Recovery + higher support structure
Key Confirmation: 101.35 hold / 102.38 reclaim
Note: This is a chart framework, not a trade recommendation. Use it to support your own DYOR-based execution plan.
— @nayrbryanGaming #SOLAnalysis #ChartSetup #PriceAction #SmartMoney #Fibonacci #CryptoTrading #DYOR #NFA
📈 Structure Overview
Market phase: Sharp sell-off → Base formation → Recovery → Bullish continuation attempt
Key support: 101.18 – 101.35
Current Fibonacci resistance: 102.38
Next upside levels: 102.89 → 103.40 → 103.91 → 104.43 → 104.94
Major downside reference: 100.84
📌 What I’m Watching
Scenario A — Bullish Continuation
If SOL maintains the current recovery structure and holds above 101.35, price may continue rotating toward:
102.38 → 102.89 → 103.40 → 103.91 → 104.43 → 104.94
A sustained move through 102.38 would provide stronger confirmation of upside continuation.
Scenario B — Support Failure
If SOL loses the 101.18–101.35 structure zone, the current bullish setup weakens.
The chart's marked downside Fibonacci reference is:
100.84
A break of the lower structure would require reassessing the current bullish continuation thesis.
📊 Indicator Check
MACD: Positive → improving short-term momentum
RSI: 59.52 → bullish-leaning, not deeply overbought
Price Structure: Recovery + higher support structure
Key Confirmation: 101.35 hold / 102.38 reclaim
Note: This is a chart framework, not a trade recommendation. Use it to support your own DYOR-based execution plan.
— @nayrbryanGaming #SOLAnalysis #ChartSetup #PriceAction #SmartMoney #Fibonacci #CryptoTrading #DYOR #NFA
53
·
--
Bullisch
Übersetzung ansehen
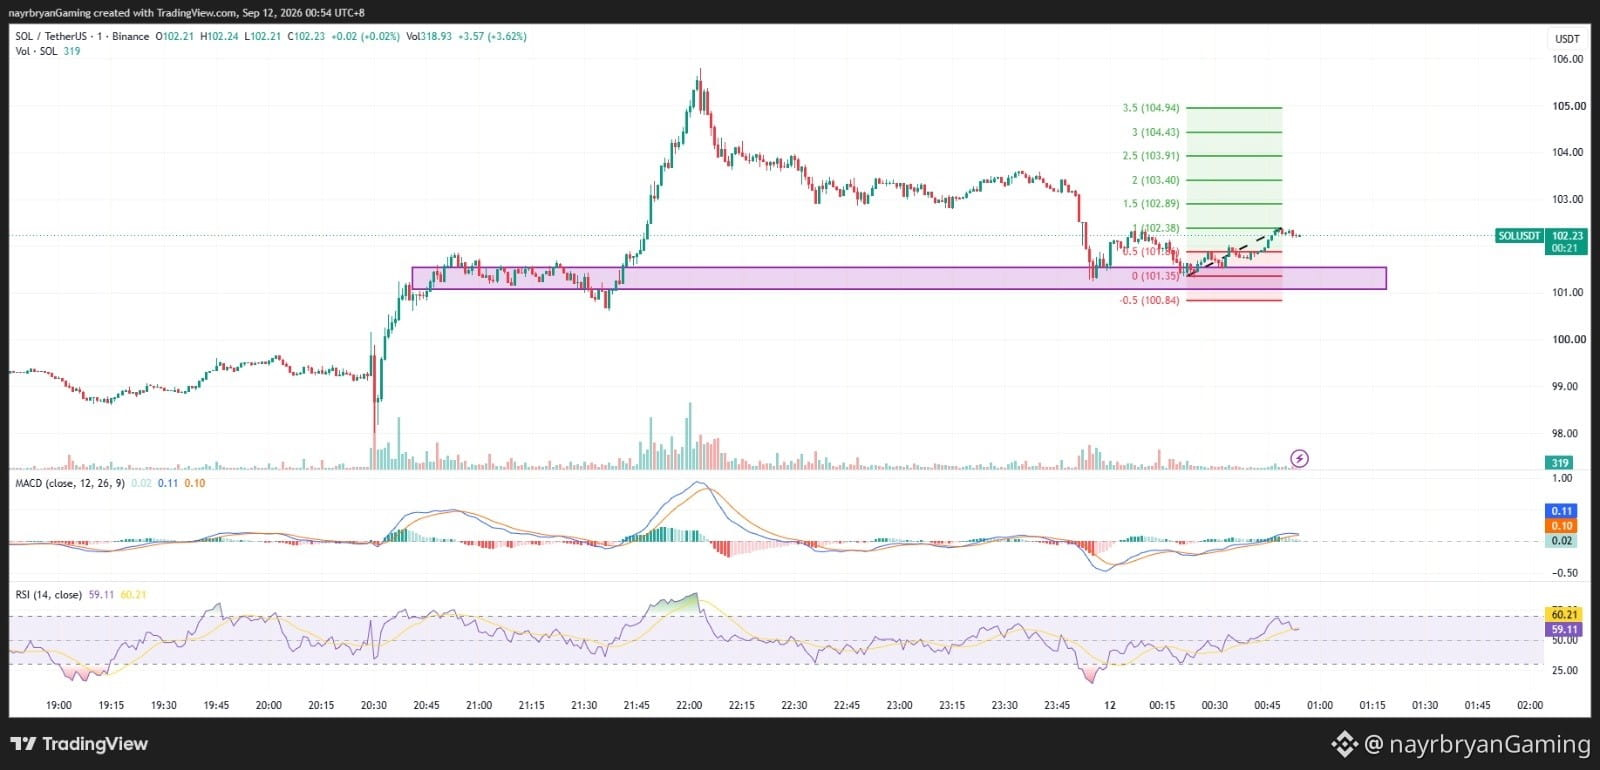
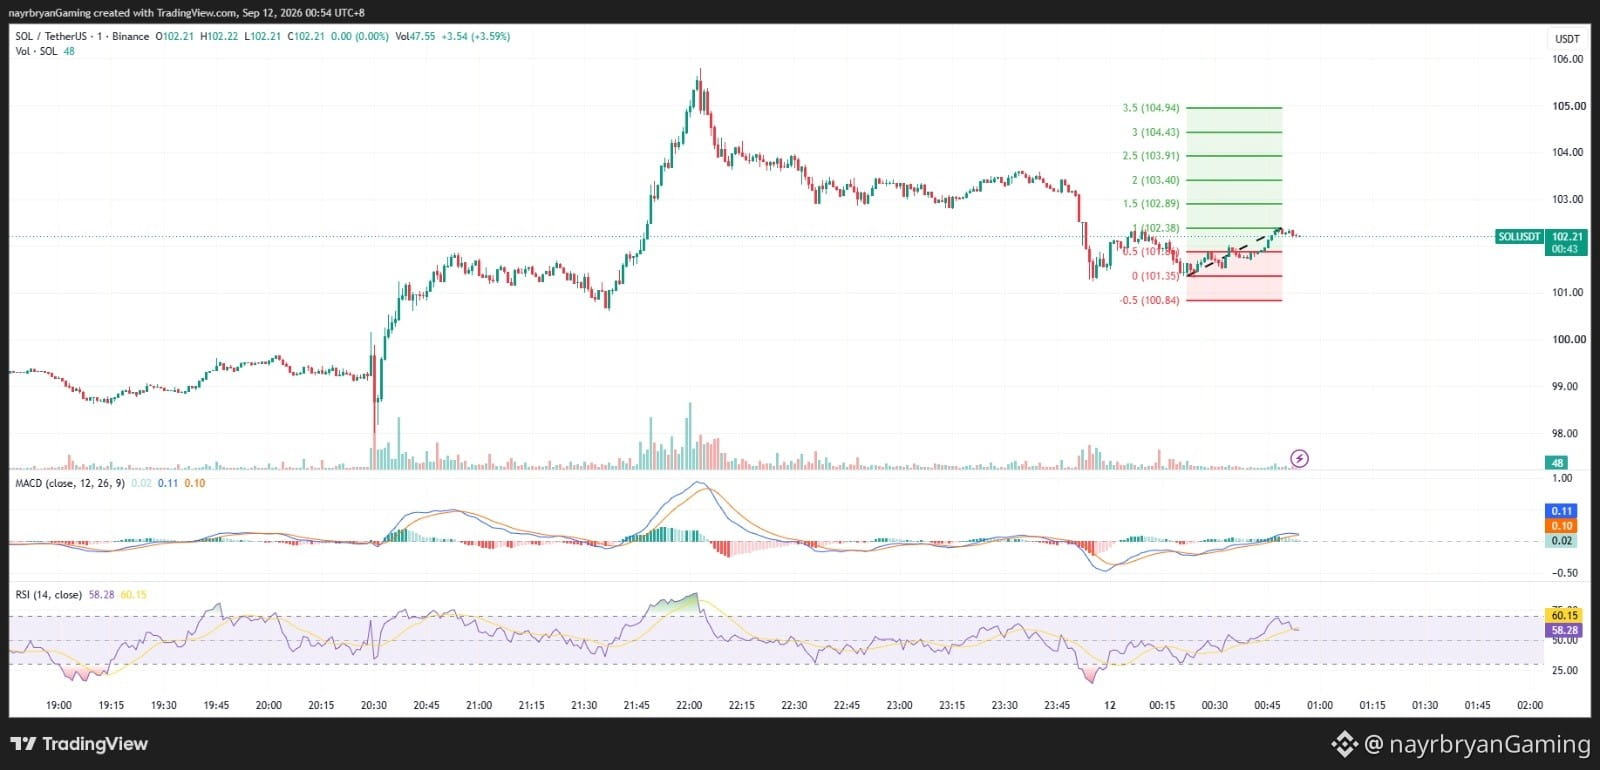
DAILY SIGNAL — SOL/USDT
Date: 12 Sep 2026 Timeframe: 1m Intraday Bias: Support reaction → bullish continuation
📊 Market Bias
SOL has recovered from the recent sell-off and is now trading above the 101.35 Fibonacci 0 level.
Price is holding around 102.24, while the previous structure zone around 101.35 continues to act as an important support area.
The recent recovery has pushed price back above the 101.18–101.35 area, with momentum improving toward the next Fibonacci levels.
🔹 Key Levels From Chart
Key Support Zone: 101.18 → 101.35
Fibonacci 0: 101.35
Key Reclaim / Mid Level: 101.18
Current Price: 102.24
🎯 Upside Fibonacci Targets
TP1 → 102.38 (1.0 Fib) TP2 → 102.89 (1.5 Fib) TP3 → 103.40 (2.0 Fib) TP4 → 103.91 (2.5 Fib) TP5 → 104.43 (3.0 Fib) TP6 → 104.94 (3.5 Fib)
🔻 Downside Reference
If the current structure fails, the chart marks:
100.84 (-0.5 Fib)
A sustained move below the 101.18–101.35 support area would weaken the bullish continuation scenario.
📈 Technical Breakdown
SOL previously established a strong base around the 101.00–101.35 region after the sharp rejection from higher levels.
Price then recovered and reclaimed the Fibonacci 0 level at 101.35.
The current price around 102.24 is approaching the marked 102.38 Fibonacci target.
MACD is positive and turning upward, while RSI is around 59.52, showing improving momentum without being deeply overbought.
The key observation is whether buyers can maintain price above the 101.35 structure.
A sustained reclaim of 102.38 would strengthen the continuation case toward:
102.89 → 103.40 → 103.91
🧠 Quick Insight
“After a strong recovery, the retest often tells you whether the breakout has real structure behind it.”
⚠️ Disclaimer
This is personal market analysis, not financial advice. This chart framework is for educational purposes only.
Always DYOR / DYODD, manage risk properly, and avoid emotional trading.
— @nayrbryanGaming #SOL #SOLUSDT #Crypto #Trading #TechnicalAnalysis #PriceAction #Fibonacci #Binance #DYOR #NFA #NoFOMO
DAILY SIGNAL — SOL/USDT
Date: 12 Sep 2026 Timeframe: 1m Intraday Bias: Support reaction → bullish continuation
📊 Market Bias
SOL has recovered from the recent sell-off and is now trading above the 101.35 Fibonacci 0 level.
Price is holding around 102.24, while the previous structure zone around 101.35 continues to act as an important support area.
The recent recovery has pushed price back above the 101.18–101.35 area, with momentum improving toward the next Fibonacci levels.
🔹 Key Levels From Chart
Key Support Zone: 101.18 → 101.35
Fibonacci 0: 101.35
Key Reclaim / Mid Level: 101.18
Current Price: 102.24
🎯 Upside Fibonacci Targets
TP1 → 102.38 (1.0 Fib) TP2 → 102.89 (1.5 Fib) TP3 → 103.40 (2.0 Fib) TP4 → 103.91 (2.5 Fib) TP5 → 104.43 (3.0 Fib) TP6 → 104.94 (3.5 Fib)
🔻 Downside Reference
If the current structure fails, the chart marks:
100.84 (-0.5 Fib)
A sustained move below the 101.18–101.35 support area would weaken the bullish continuation scenario.
📈 Technical Breakdown
SOL previously established a strong base around the 101.00–101.35 region after the sharp rejection from higher levels.
Price then recovered and reclaimed the Fibonacci 0 level at 101.35.
The current price around 102.24 is approaching the marked 102.38 Fibonacci target.
MACD is positive and turning upward, while RSI is around 59.52, showing improving momentum without being deeply overbought.
The key observation is whether buyers can maintain price above the 101.35 structure.
A sustained reclaim of 102.38 would strengthen the continuation case toward:
102.89 → 103.40 → 103.91
🧠 Quick Insight
“After a strong recovery, the retest often tells you whether the breakout has real structure behind it.”
⚠️ Disclaimer
This is personal market analysis, not financial advice. This chart framework is for educational purposes only.
Always DYOR / DYODD, manage risk properly, and avoid emotional trading.
— @nayrbryanGaming #SOL #SOLUSDT #Crypto #Trading #TechnicalAnalysis #PriceAction #Fibonacci #Binance #DYOR #NFA #NoFOMO
Date: 12 Sep 2026 Timeframe: 1m Intraday Bias: Support reaction → bullish continuation
📊 Market Bias
SOL has recovered from the recent sell-off and is now trading above the 101.35 Fibonacci 0 level.
Price is holding around 102.24, while the previous structure zone around 101.35 continues to act as an important support area.
The recent recovery has pushed price back above the 101.18–101.35 area, with momentum improving toward the next Fibonacci levels.
🔹 Key Levels From Chart
Key Support Zone: 101.18 → 101.35
Fibonacci 0: 101.35
Key Reclaim / Mid Level: 101.18
Current Price: 102.24
🎯 Upside Fibonacci Targets
TP1 → 102.38 (1.0 Fib) TP2 → 102.89 (1.5 Fib) TP3 → 103.40 (2.0 Fib) TP4 → 103.91 (2.5 Fib) TP5 → 104.43 (3.0 Fib) TP6 → 104.94 (3.5 Fib)
🔻 Downside Reference
If the current structure fails, the chart marks:
100.84 (-0.5 Fib)
A sustained move below the 101.18–101.35 support area would weaken the bullish continuation scenario.
📈 Technical Breakdown
SOL previously established a strong base around the 101.00–101.35 region after the sharp rejection from higher levels.
Price then recovered and reclaimed the Fibonacci 0 level at 101.35.
The current price around 102.24 is approaching the marked 102.38 Fibonacci target.
MACD is positive and turning upward, while RSI is around 59.52, showing improving momentum without being deeply overbought.
The key observation is whether buyers can maintain price above the 101.35 structure.
A sustained reclaim of 102.38 would strengthen the continuation case toward:
102.89 → 103.40 → 103.91
🧠 Quick Insight
“After a strong recovery, the retest often tells you whether the breakout has real structure behind it.”
⚠️ Disclaimer
This is personal market analysis, not financial advice. This chart framework is for educational purposes only.
Always DYOR / DYODD, manage risk properly, and avoid emotional trading.
— @nayrbryanGaming #SOL #SOLUSDT #Crypto #Trading #TechnicalAnalysis #PriceAction #Fibonacci #Binance #DYOR #NFA #NoFOMO
134
·
--
Bullisch
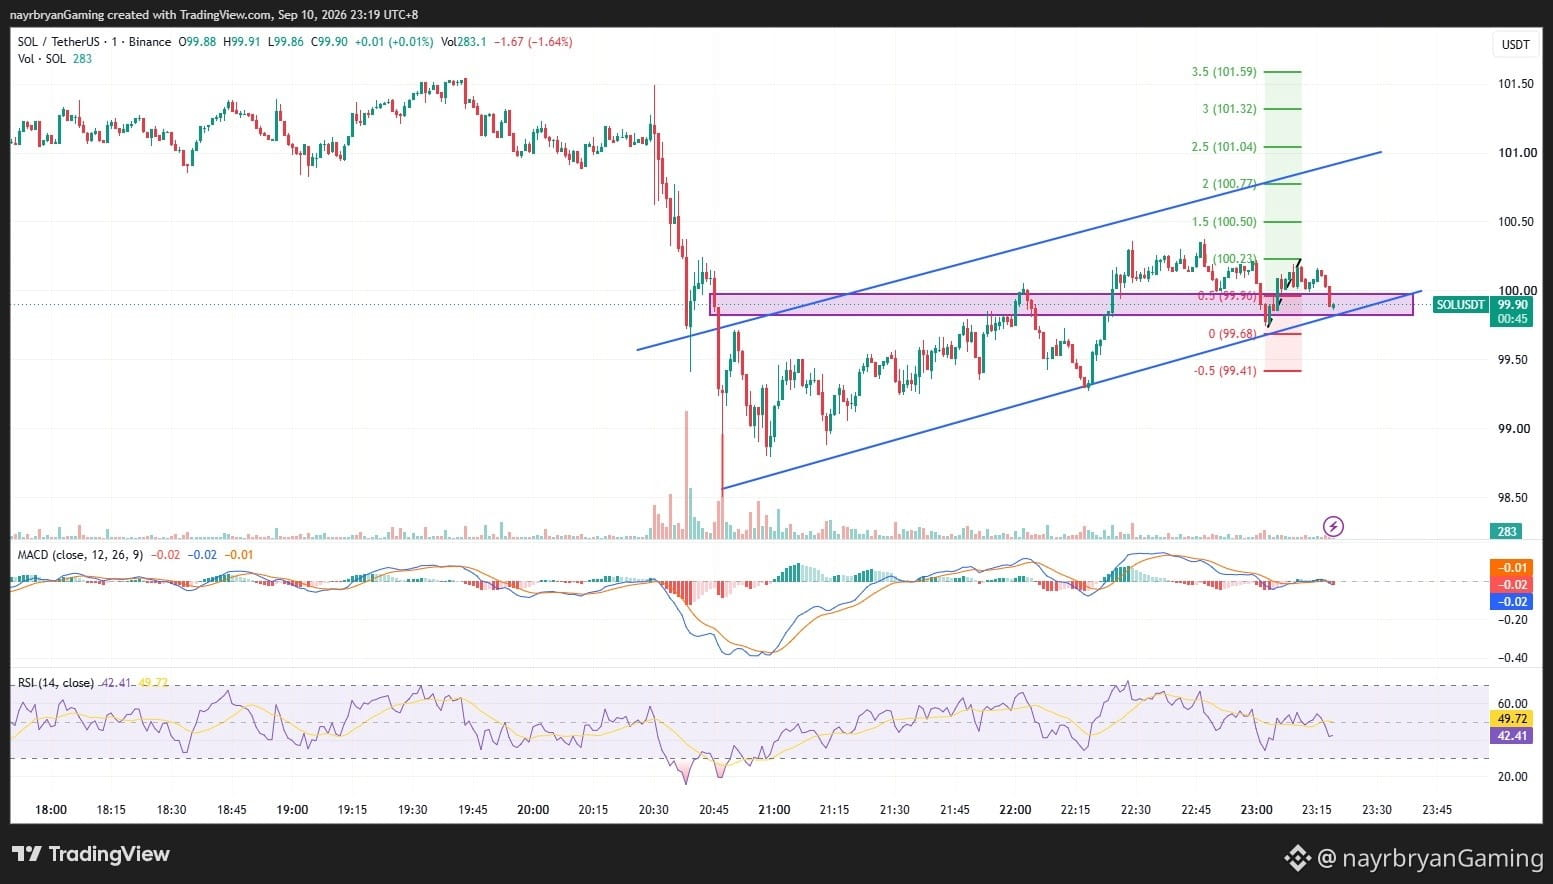
TRADER-MOTIVATION / MINI-EINBLICK
🧠 Einblick des Tages
„Geduld beginnt dort, wo dein Key Level anfängt.“
Warum das wichtig ist
Nach einer starken Erholung kann der Preis frühere Strukturen erneut ansteuern, bevor er über seine nächste Richtung entscheidet.
SOL testet derzeit die Zone 99.68–99.90.
Statt jeder Kerze hinterherzulaufen, konzentriere dich auf die Reaktion rund um das Level.
Smartes Ausführen bedeutet, auf Folgendes zu achten:
• Reaktion am Support • Strukturbestätigung • Resistance-Reclaim • Invalidierung • Risikokontrolle
🎯 Trader-Checkliste
Markiere die Zone 99.68–99.90
Warte auf Bestätigung
Beobachte die Resistance bei 100.22
Respektiere den Support der Struktur bei 99.68
Überwache 99.41, falls der Support ausfällt
Vermeide emotionale Einstiege
Schütze dein Kapital
🧠 Mini-Challenge
Bevor du einsteigst, frage:
„Folge ich bestätigter Struktur – oder reagiere ich nur auf die letzte Kerze?“
— @nayrbryanGaming #TraderMindset #TradingDiscipline #NoFOMO #CryptoMindset #DYOR #PriceAction #SOLUSDT
🔔 Folge mir auf Binance Square & X (@nayrbryanGaming) für tägliche Chart-Einblicke.
TRADER-MOTIVATION / MINI-EINBLICK
🧠 Einblick des Tages
„Geduld beginnt dort, wo dein Key Level anfängt.“
Warum das wichtig ist
Nach einer starken Erholung kann der Preis frühere Strukturen erneut ansteuern, bevor er über seine nächste Richtung entscheidet.
SOL testet derzeit die Zone 99.68–99.90.
Statt jeder Kerze hinterherzulaufen, konzentriere dich auf die Reaktion rund um das Level.
Smartes Ausführen bedeutet, auf Folgendes zu achten:
• Reaktion am Support • Strukturbestätigung • Resistance-Reclaim • Invalidierung • Risikokontrolle
🎯 Trader-Checkliste
Markiere die Zone 99.68–99.90
Warte auf Bestätigung
Beobachte die Resistance bei 100.22
Respektiere den Support der Struktur bei 99.68
Überwache 99.41, falls der Support ausfällt
Vermeide emotionale Einstiege
Schütze dein Kapital
🧠 Mini-Challenge
Bevor du einsteigst, frage:
„Folge ich bestätigter Struktur – oder reagiere ich nur auf die letzte Kerze?“
— @nayrbryanGaming #TraderMindset #TradingDiscipline #NoFOMO #CryptoMindset #DYOR #PriceAction #SOLUSDT
🔔 Folge mir auf Binance Square & X (@nayrbryanGaming) für tägliche Chart-Einblicke.
🧠 Einblick des Tages
„Geduld beginnt dort, wo dein Key Level anfängt.“
Warum das wichtig ist
Nach einer starken Erholung kann der Preis frühere Strukturen erneut ansteuern, bevor er über seine nächste Richtung entscheidet.
SOL testet derzeit die Zone 99.68–99.90.
Statt jeder Kerze hinterherzulaufen, konzentriere dich auf die Reaktion rund um das Level.
Smartes Ausführen bedeutet, auf Folgendes zu achten:
• Reaktion am Support • Strukturbestätigung • Resistance-Reclaim • Invalidierung • Risikokontrolle
🎯 Trader-Checkliste
Markiere die Zone 99.68–99.90
Warte auf Bestätigung
Beobachte die Resistance bei 100.22
Respektiere den Support der Struktur bei 99.68
Überwache 99.41, falls der Support ausfällt
Vermeide emotionale Einstiege
Schütze dein Kapital
🧠 Mini-Challenge
Bevor du einsteigst, frage:
„Folge ich bestätigter Struktur – oder reagiere ich nur auf die letzte Kerze?“
— @nayrbryanGaming #TraderMindset #TradingDiscipline #NoFOMO #CryptoMindset #DYOR #PriceAction #SOLUSDT
🔔 Folge mir auf Binance Square & X (@nayrbryanGaming) für tägliche Chart-Einblicke.
46
·
--
Bullisch
Übersetzung ansehen
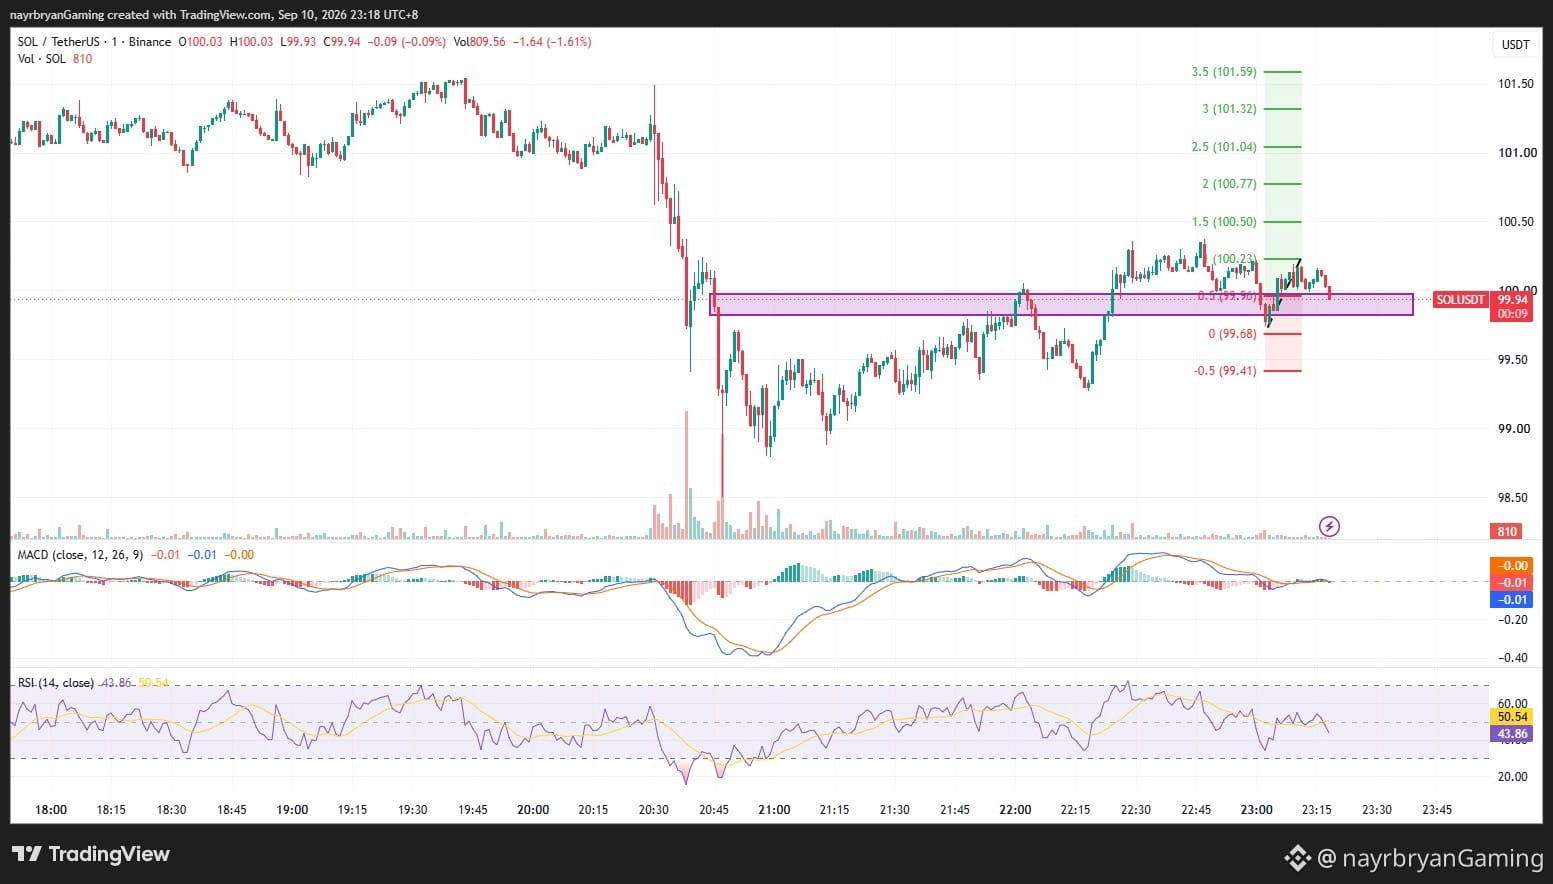
LIGHT ANALYSIS / CHART SETUP — SOL/USDT
📈 Structure Overview
Market phase: Sharp sell-off → Recovery → Ascending-channel consolidation
Current structure: Higher lows + rising channel support
Key reaction zone: 99.68 – 99.90
First upside resistance: 100.22
Major upside levels: 100.50 → 100.77 → 101.04 → 101.32 → 101.59
Structure failure level: 99.41
📌 What I’m Watching
Scenario A — Bullish Continuation
If SOL holds the 99.68–99.90 zone and buyers regain control, price may rotate toward:
100.22 → 100.50 → 100.77 → 101.04 → 101.32 → 101.59
A sustained move above 100.22 would provide stronger continuation confirmation.
Scenario B — Support Failure
If SOL loses 99.68, the current bullish structure becomes weaker.
The next marked downside Fibonacci level is:
99.41
A sustained break below the support structure would require reassessing the ascending-channel setup.
📊 Indicator Check
MACD: Near zero → momentum is mixed
RSI: 42.41 → weak-to-neutral momentum
Price Structure: Ascending channel + support retest
Key Confirmation: 99.68 hold / 100.22 reclaim
Note: This is a chart framework, not a trade recommendation. Use it to support your own DYOR-based execution plan.
— @nayrbryanGaming #SOLAnalysis #ChartSetup #PriceAction #SmartMoney #Fibonacci #CryptoTrading #DYOR #NFA
LIGHT ANALYSIS / CHART SETUP — SOL/USDT
📈 Structure Overview
Market phase: Sharp sell-off → Recovery → Ascending-channel consolidation
Current structure: Higher lows + rising channel support
Key reaction zone: 99.68 – 99.90
First upside resistance: 100.22
Major upside levels: 100.50 → 100.77 → 101.04 → 101.32 → 101.59
Structure failure level: 99.41
📌 What I’m Watching
Scenario A — Bullish Continuation
If SOL holds the 99.68–99.90 zone and buyers regain control, price may rotate toward:
100.22 → 100.50 → 100.77 → 101.04 → 101.32 → 101.59
A sustained move above 100.22 would provide stronger continuation confirmation.
Scenario B — Support Failure
If SOL loses 99.68, the current bullish structure becomes weaker.
The next marked downside Fibonacci level is:
99.41
A sustained break below the support structure would require reassessing the ascending-channel setup.
📊 Indicator Check
MACD: Near zero → momentum is mixed
RSI: 42.41 → weak-to-neutral momentum
Price Structure: Ascending channel + support retest
Key Confirmation: 99.68 hold / 100.22 reclaim
Note: This is a chart framework, not a trade recommendation. Use it to support your own DYOR-based execution plan.
— @nayrbryanGaming #SOLAnalysis #ChartSetup #PriceAction #SmartMoney #Fibonacci #CryptoTrading #DYOR #NFA
📈 Structure Overview
Market phase: Sharp sell-off → Recovery → Ascending-channel consolidation
Current structure: Higher lows + rising channel support
Key reaction zone: 99.68 – 99.90
First upside resistance: 100.22
Major upside levels: 100.50 → 100.77 → 101.04 → 101.32 → 101.59
Structure failure level: 99.41
📌 What I’m Watching
Scenario A — Bullish Continuation
If SOL holds the 99.68–99.90 zone and buyers regain control, price may rotate toward:
100.22 → 100.50 → 100.77 → 101.04 → 101.32 → 101.59
A sustained move above 100.22 would provide stronger continuation confirmation.
Scenario B — Support Failure
If SOL loses 99.68, the current bullish structure becomes weaker.
The next marked downside Fibonacci level is:
99.41
A sustained break below the support structure would require reassessing the ascending-channel setup.
📊 Indicator Check
MACD: Near zero → momentum is mixed
RSI: 42.41 → weak-to-neutral momentum
Price Structure: Ascending channel + support retest
Key Confirmation: 99.68 hold / 100.22 reclaim
Note: This is a chart framework, not a trade recommendation. Use it to support your own DYOR-based execution plan.
— @nayrbryanGaming #SOLAnalysis #ChartSetup #PriceAction #SmartMoney #Fibonacci #CryptoTrading #DYOR #NFA
36
·
--
Bullisch
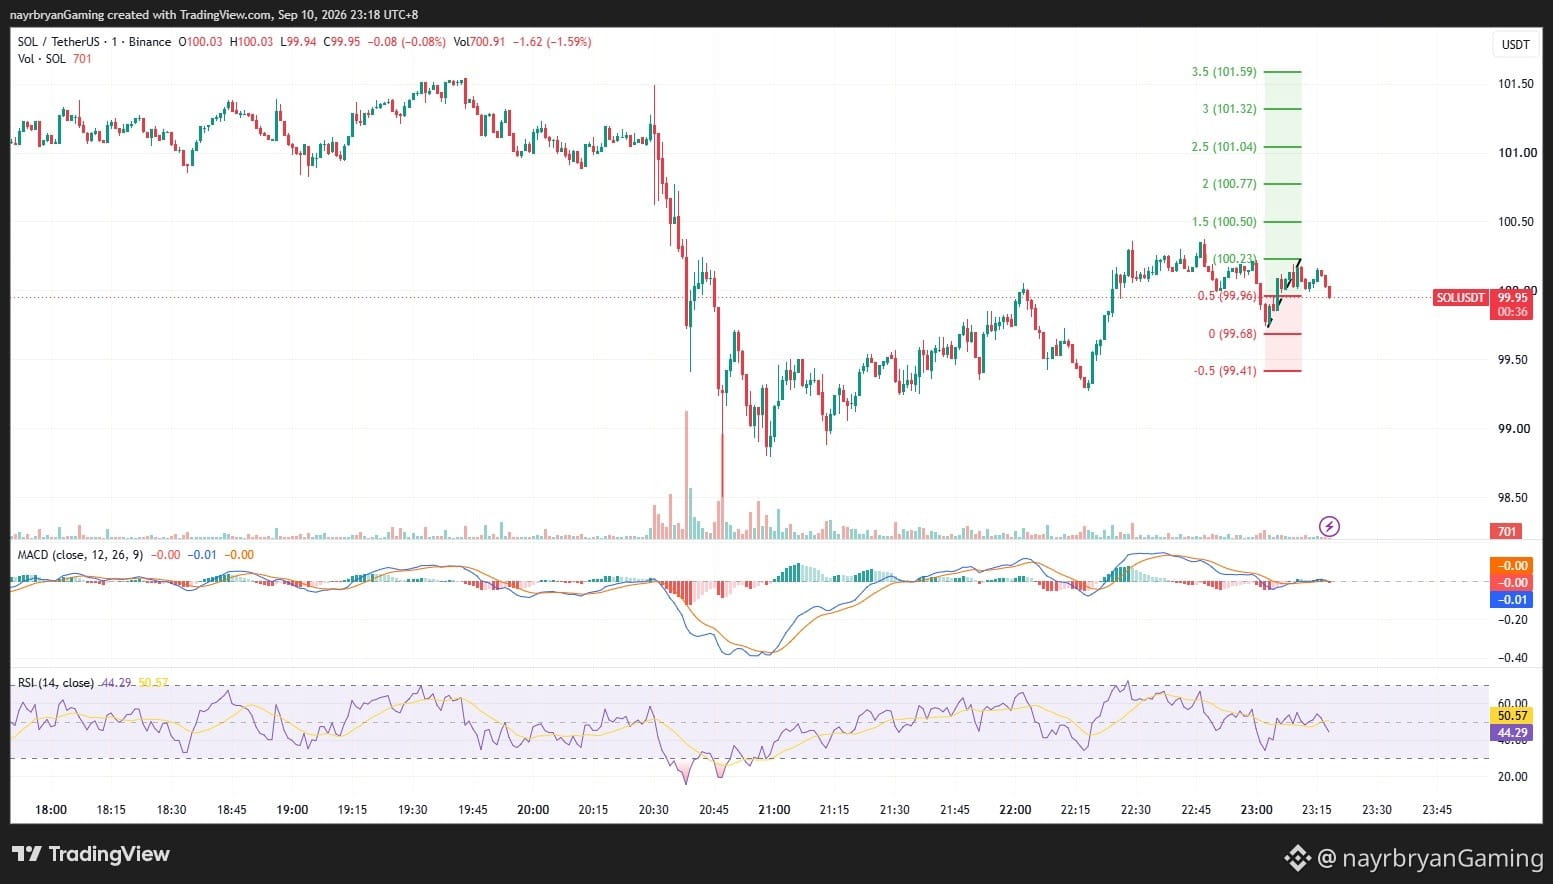
TÄGLICHES SIGNAL — SOL/USDT
Datum: 10. Sep 2026 Zeitrahmen: 1m Intraday-Bias: Support-Retest → potenzielle bullische Fortsetzung
📊 Markt-Bias
SOL handelt innerhalb eines kurzfristigen aufsteigenden Kanals, nachdem es sich von dem scharfen Sell-off erholt hat.
Derzeit testet der Kurs die Strukturzone 99.68–99.90, der aktuelle Preis liegt bei etwa 99.90.
Die 99.68-Marke ist das markierte Fibonacci-0-Level, während 99.90 das 0.5-Level ist.
Solange die aufsteigende Struktur und der Support bei 99.68 halten, bleibt das Chart-Bild offen für eine potenzielle Rotation zu höheren Fibonacci-Levels.
🔹 Wichtige Levels aus dem Chart
Wichtige Strukturzone: 99.68 → 99.90
Fibonacci 0: 99.68
Fibonacci 0.5: 99.90
Erstes großes Upside-Level: 100.22
🎯 Upside-Fibonacci-Ziele
TP1 → 100.22 (1.0 Fib) TP2 → 100.50 (1.5 Fib) TP3 → 100.77 (2.0 Fib) TP4 → 101.04 (2.5 Fib) TP5 → 101.32 (3.0 Fib) TP6 → 101.59 (3.5 Fib)
🔻 Abwärts-Level
Falls die Struktur unter dem markierten Support scheitert:
99.41 (-0.5 Fib)
Ein nachhaltiger Bruch unter 99.68 würde die aktuelle bullische Fortsetzungsstruktur schwächen.
📈 Technischer Breakdown
SOL hat sich aus dem unteren Bereich des aufsteigenden Kanals erholt und ist wieder in Richtung der 100.22-Region gelaufen.
Nach dem Erreichen des oberen Teils der jüngsten Struktur zog der Kurs zurück und testet nun die Zone 99.68–99.90.
MACD ist nahe an der Nulllinie und zeigt, dass die Dynamik aktuell relativ ausgeglichen ist.
RSI liegt bei etwa 42 und deutet auf kurzfristige Schwäche hin, ohne dabei stark überverkauft zu sein.
Die zentrale Reaktionszone bleibt 99.68–99.90.
Eine erfolgreiche Support-Reaktion könnte es dem Kurs ermöglichen, sich zu drehen in Richtung:
100.22 → 100.50 → 100.77 → 101.04
🧠 Kurzer Einblick
„Eine gute Struktur gibt Tradern ein Level zum Respektieren, nicht einen Grund zum Hinterherjagen.“
⚠️ Disclaimer
Dies ist eine persönliche Marktanalyse, keine Finanzberatung. Dieses Chart-Framework dient nur zu Bildungszwecken.
Mach immer DYOR / DYODD, steuere das Risiko richtig und vermeide emotionales Trading.
— @nayrbryanGaming #SOL #SOLUSDT #Crypto #Trading #TechnicalAnalysis #PriceAction #Fibonacci #Binance #DYOR #NFA #NoFOMO
TÄGLICHES SIGNAL — SOL/USDT
Datum: 10. Sep 2026 Zeitrahmen: 1m Intraday-Bias: Support-Retest → potenzielle bullische Fortsetzung
📊 Markt-Bias
SOL handelt innerhalb eines kurzfristigen aufsteigenden Kanals, nachdem es sich von dem scharfen Sell-off erholt hat.
Derzeit testet der Kurs die Strukturzone 99.68–99.90, der aktuelle Preis liegt bei etwa 99.90.
Die 99.68-Marke ist das markierte Fibonacci-0-Level, während 99.90 das 0.5-Level ist.
Solange die aufsteigende Struktur und der Support bei 99.68 halten, bleibt das Chart-Bild offen für eine potenzielle Rotation zu höheren Fibonacci-Levels.
🔹 Wichtige Levels aus dem Chart
Wichtige Strukturzone: 99.68 → 99.90
Fibonacci 0: 99.68
Fibonacci 0.5: 99.90
Erstes großes Upside-Level: 100.22
🎯 Upside-Fibonacci-Ziele
TP1 → 100.22 (1.0 Fib) TP2 → 100.50 (1.5 Fib) TP3 → 100.77 (2.0 Fib) TP4 → 101.04 (2.5 Fib) TP5 → 101.32 (3.0 Fib) TP6 → 101.59 (3.5 Fib)
🔻 Abwärts-Level
Falls die Struktur unter dem markierten Support scheitert:
99.41 (-0.5 Fib)
Ein nachhaltiger Bruch unter 99.68 würde die aktuelle bullische Fortsetzungsstruktur schwächen.
📈 Technischer Breakdown
SOL hat sich aus dem unteren Bereich des aufsteigenden Kanals erholt und ist wieder in Richtung der 100.22-Region gelaufen.
Nach dem Erreichen des oberen Teils der jüngsten Struktur zog der Kurs zurück und testet nun die Zone 99.68–99.90.
MACD ist nahe an der Nulllinie und zeigt, dass die Dynamik aktuell relativ ausgeglichen ist.
RSI liegt bei etwa 42 und deutet auf kurzfristige Schwäche hin, ohne dabei stark überverkauft zu sein.
Die zentrale Reaktionszone bleibt 99.68–99.90.
Eine erfolgreiche Support-Reaktion könnte es dem Kurs ermöglichen, sich zu drehen in Richtung:
100.22 → 100.50 → 100.77 → 101.04
🧠 Kurzer Einblick
„Eine gute Struktur gibt Tradern ein Level zum Respektieren, nicht einen Grund zum Hinterherjagen.“
⚠️ Disclaimer
Dies ist eine persönliche Marktanalyse, keine Finanzberatung. Dieses Chart-Framework dient nur zu Bildungszwecken.
Mach immer DYOR / DYODD, steuere das Risiko richtig und vermeide emotionales Trading.
— @nayrbryanGaming #SOL #SOLUSDT #Crypto #Trading #TechnicalAnalysis #PriceAction #Fibonacci #Binance #DYOR #NFA #NoFOMO
Datum: 10. Sep 2026 Zeitrahmen: 1m Intraday-Bias: Support-Retest → potenzielle bullische Fortsetzung
📊 Markt-Bias
SOL handelt innerhalb eines kurzfristigen aufsteigenden Kanals, nachdem es sich von dem scharfen Sell-off erholt hat.
Derzeit testet der Kurs die Strukturzone 99.68–99.90, der aktuelle Preis liegt bei etwa 99.90.
Die 99.68-Marke ist das markierte Fibonacci-0-Level, während 99.90 das 0.5-Level ist.
Solange die aufsteigende Struktur und der Support bei 99.68 halten, bleibt das Chart-Bild offen für eine potenzielle Rotation zu höheren Fibonacci-Levels.
🔹 Wichtige Levels aus dem Chart
Wichtige Strukturzone: 99.68 → 99.90
Fibonacci 0: 99.68
Fibonacci 0.5: 99.90
Erstes großes Upside-Level: 100.22
🎯 Upside-Fibonacci-Ziele
TP1 → 100.22 (1.0 Fib) TP2 → 100.50 (1.5 Fib) TP3 → 100.77 (2.0 Fib) TP4 → 101.04 (2.5 Fib) TP5 → 101.32 (3.0 Fib) TP6 → 101.59 (3.5 Fib)
🔻 Abwärts-Level
Falls die Struktur unter dem markierten Support scheitert:
99.41 (-0.5 Fib)
Ein nachhaltiger Bruch unter 99.68 würde die aktuelle bullische Fortsetzungsstruktur schwächen.
📈 Technischer Breakdown
SOL hat sich aus dem unteren Bereich des aufsteigenden Kanals erholt und ist wieder in Richtung der 100.22-Region gelaufen.
Nach dem Erreichen des oberen Teils der jüngsten Struktur zog der Kurs zurück und testet nun die Zone 99.68–99.90.
MACD ist nahe an der Nulllinie und zeigt, dass die Dynamik aktuell relativ ausgeglichen ist.
RSI liegt bei etwa 42 und deutet auf kurzfristige Schwäche hin, ohne dabei stark überverkauft zu sein.
Die zentrale Reaktionszone bleibt 99.68–99.90.
Eine erfolgreiche Support-Reaktion könnte es dem Kurs ermöglichen, sich zu drehen in Richtung:
100.22 → 100.50 → 100.77 → 101.04
🧠 Kurzer Einblick
„Eine gute Struktur gibt Tradern ein Level zum Respektieren, nicht einen Grund zum Hinterherjagen.“
⚠️ Disclaimer
Dies ist eine persönliche Marktanalyse, keine Finanzberatung. Dieses Chart-Framework dient nur zu Bildungszwecken.
Mach immer DYOR / DYODD, steuere das Risiko richtig und vermeide emotionales Trading.
— @nayrbryanGaming #SOL #SOLUSDT #Crypto #Trading #TechnicalAnalysis #PriceAction #Fibonacci #Binance #DYOR #NFA #NoFOMO
262

·
--
Bärisch
TRADER-MOTIVATION / MINI-INSIGHT
🧠 Insight des Tages
„Jage dem Breakdown nicht hinterher. Warte auf die Bestätigung der Struktur.“
Warum das wichtig ist
Ein Markt kann lange auf einem Support-Level verharren, bevor er sich für die nächste Richtung entscheidet.
Der Fehler ist, einzusteigen, nur weil der Chart bärisch aussieht.
Professionelle Ausführung konzentriert sich auf:
• Struktur • Bestätigung • Reaktion • Invalidierung • Risikokontrolle
SOL testet aktuell eine wichtige Zone bei 103.38–103.65.
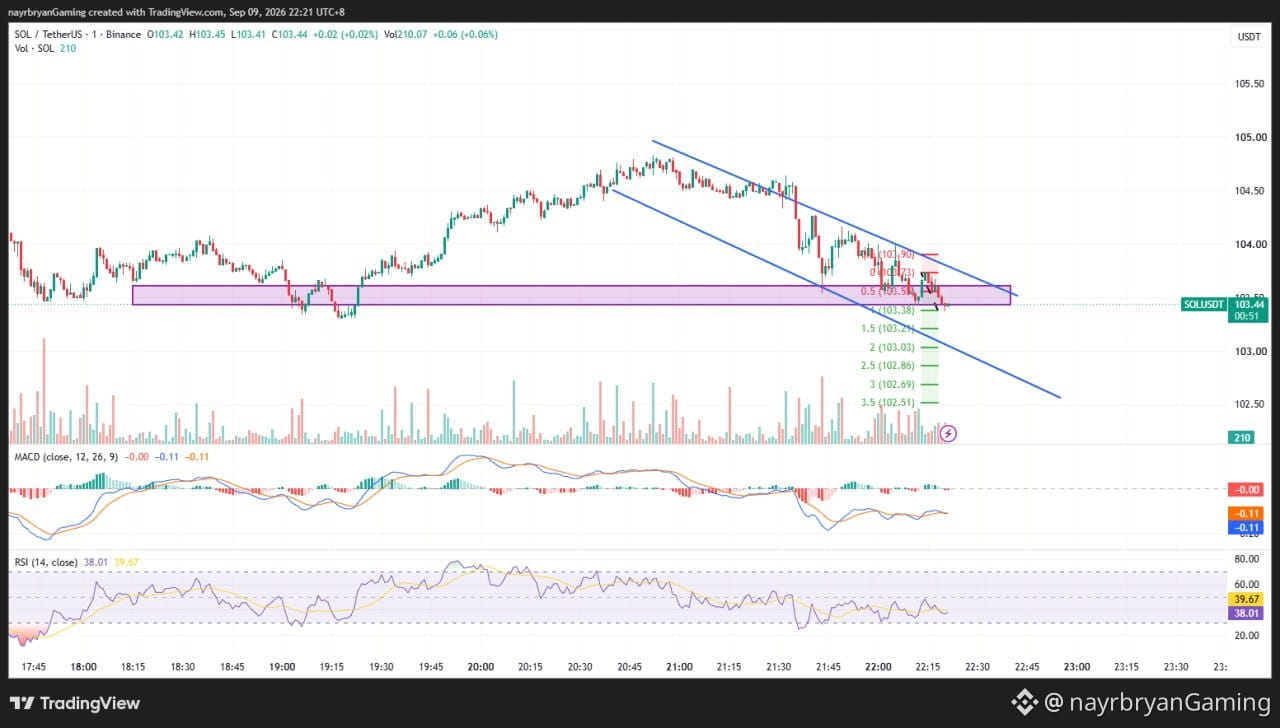
Die Frage ist nicht:
„Fällt es?“
Die bessere Frage ist:
„Brechen Verkäufer die Struktur tatsächlich?“
🎯 Trader-Checkliste
Markiere die Reaktionszone
Warte auf Bestätigung
Beobachte die absteigende Trendlinie
Respektiere die Invalidierung
Vermeide emotionale Einstiege
Schütze dein Kapital
🧠 Mini-Challenge
Stell vor dem Einstieg die Frage:
„Steige ich ein, weil die Struktur bestätigt wurde — oder weil ich Angst habe, die Bewegung zu verpassen?“
— @nayrbryanGaming #TraderMindset #TradingDiscipline #NoFOMO #CryptoMindset #DYOR #PriceAction #SOLUSDT
🔔 Folge mir auf Binance Square & X (@nayrbryanGaming) für tägliche Chart-Insights.
TRADER-MOTIVATION / MINI-INSIGHT
🧠 Insight des Tages
„Jage dem Breakdown nicht hinterher. Warte auf die Bestätigung der Struktur.“
Warum das wichtig ist
Ein Markt kann lange auf einem Support-Level verharren, bevor er sich für die nächste Richtung entscheidet.
Der Fehler ist, einzusteigen, nur weil der Chart bärisch aussieht.
Professionelle Ausführung konzentriert sich auf:
• Struktur • Bestätigung • Reaktion • Invalidierung • Risikokontrolle
SOL testet aktuell eine wichtige Zone bei 103.38–103.65.
Die Frage ist nicht:
„Fällt es?“
Die bessere Frage ist:
„Brechen Verkäufer die Struktur tatsächlich?“
🎯 Trader-Checkliste
Markiere die Reaktionszone
Warte auf Bestätigung
Beobachte die absteigende Trendlinie
Respektiere die Invalidierung
Vermeide emotionale Einstiege
Schütze dein Kapital
🧠 Mini-Challenge
Stell vor dem Einstieg die Frage:
„Steige ich ein, weil die Struktur bestätigt wurde — oder weil ich Angst habe, die Bewegung zu verpassen?“
— @nayrbryanGaming #TraderMindset #TradingDiscipline #NoFOMO #CryptoMindset #DYOR #PriceAction #SOLUSDT
🔔 Folge mir auf Binance Square & X (@nayrbryanGaming) für tägliche Chart-Insights.
🧠 Insight des Tages
„Jage dem Breakdown nicht hinterher. Warte auf die Bestätigung der Struktur.“
Warum das wichtig ist
Ein Markt kann lange auf einem Support-Level verharren, bevor er sich für die nächste Richtung entscheidet.
Der Fehler ist, einzusteigen, nur weil der Chart bärisch aussieht.
Professionelle Ausführung konzentriert sich auf:
• Struktur • Bestätigung • Reaktion • Invalidierung • Risikokontrolle
SOL testet aktuell eine wichtige Zone bei 103.38–103.65.
Die Frage ist nicht:
„Fällt es?“
Die bessere Frage ist:
„Brechen Verkäufer die Struktur tatsächlich?“
🎯 Trader-Checkliste
Markiere die Reaktionszone
Warte auf Bestätigung
Beobachte die absteigende Trendlinie
Respektiere die Invalidierung
Vermeide emotionale Einstiege
Schütze dein Kapital
🧠 Mini-Challenge
Stell vor dem Einstieg die Frage:
„Steige ich ein, weil die Struktur bestätigt wurde — oder weil ich Angst habe, die Bewegung zu verpassen?“
— @nayrbryanGaming #TraderMindset #TradingDiscipline #NoFOMO #CryptoMindset #DYOR #PriceAction #SOLUSDT
🔔 Folge mir auf Binance Square & X (@nayrbryanGaming) für tägliche Chart-Insights.
37
·
--
Bärisch
Übersetzung ansehen
LIGHT ANALYSIS / CHART SETUP — SOL/USDT
📈 Structure Overview
Market phase: Downtrend → Rebound → Resistance Test
Descending structure: Lower highs inside a falling channel
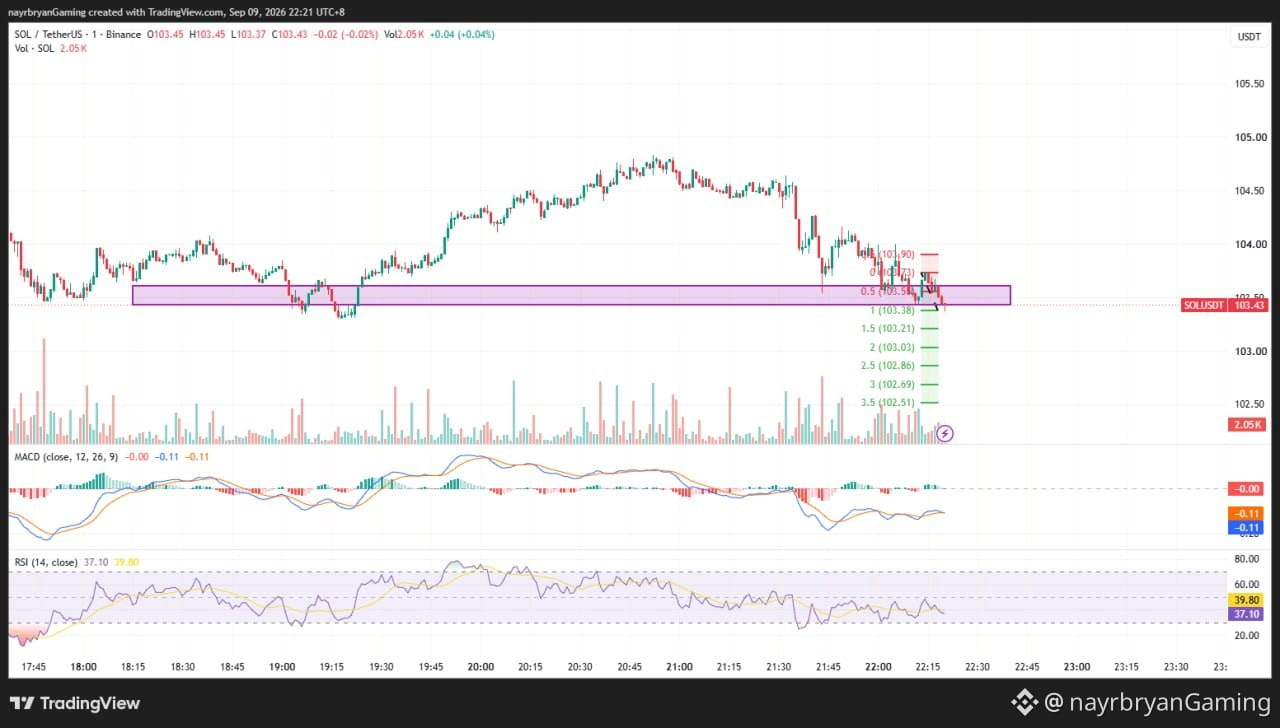
Key reaction zone: 103.38 – 103.65
Major resistance: 103.73 – 103.90
Breakdown confirmation: Below 103.38
📌 What I’m Watching
Scenario A — Bearish Continuation
If SOL rejects the 103.38–103.65 area and loses 103.38, price may rotate toward:
103.21 → 103.03 → 102.86 → 102.69 → 102.51
These levels correspond with the Fibonacci extensions marked on the chart.
Scenario B — Bullish Reclaim
If SOL reclaims 103.73 and continues through 103.90, the immediate bearish structure weakens.
A sustained reclaim would suggest that sellers are losing control of the current descending setup.
Until that happens, rallies into resistance remain vulnerable to rejection.
📊 Indicator Check
MACD: Below zero → bearish momentum remains
RSI: 38.01 → weak momentum
Price Structure: Descending channel + lower highs
Key Confirmation: 103.38 breakdown / 103.90 reclaim
Note: This is a chart framework, not a trade recommendation. Use it to support your own DYOR-based execution plan.
— @nayrbryanGaming #SOLAnalysis #ChartSetup #PriceAction #SmartMoney #Fibonacci #CryptoTrading #DYOR #NFA
LIGHT ANALYSIS / CHART SETUP — SOL/USDT
📈 Structure Overview
Market phase: Downtrend → Rebound → Resistance Test
Descending structure: Lower highs inside a falling channel
Key reaction zone: 103.38 – 103.65
Major resistance: 103.73 – 103.90
Breakdown confirmation: Below 103.38
📌 What I’m Watching
Scenario A — Bearish Continuation
If SOL rejects the 103.38–103.65 area and loses 103.38, price may rotate toward:
103.21 → 103.03 → 102.86 → 102.69 → 102.51
These levels correspond with the Fibonacci extensions marked on the chart.
Scenario B — Bullish Reclaim
If SOL reclaims 103.73 and continues through 103.90, the immediate bearish structure weakens.
A sustained reclaim would suggest that sellers are losing control of the current descending setup.
Until that happens, rallies into resistance remain vulnerable to rejection.
📊 Indicator Check
MACD: Below zero → bearish momentum remains
RSI: 38.01 → weak momentum
Price Structure: Descending channel + lower highs
Key Confirmation: 103.38 breakdown / 103.90 reclaim
Note: This is a chart framework, not a trade recommendation. Use it to support your own DYOR-based execution plan.
— @nayrbryanGaming #SOLAnalysis #ChartSetup #PriceAction #SmartMoney #Fibonacci #CryptoTrading #DYOR #NFA
📈 Structure Overview
Market phase: Downtrend → Rebound → Resistance Test
Descending structure: Lower highs inside a falling channel
Key reaction zone: 103.38 – 103.65
Major resistance: 103.73 – 103.90
Breakdown confirmation: Below 103.38
📌 What I’m Watching
Scenario A — Bearish Continuation
If SOL rejects the 103.38–103.65 area and loses 103.38, price may rotate toward:
103.21 → 103.03 → 102.86 → 102.69 → 102.51
These levels correspond with the Fibonacci extensions marked on the chart.
Scenario B — Bullish Reclaim
If SOL reclaims 103.73 and continues through 103.90, the immediate bearish structure weakens.
A sustained reclaim would suggest that sellers are losing control of the current descending setup.
Until that happens, rallies into resistance remain vulnerable to rejection.
📊 Indicator Check
MACD: Below zero → bearish momentum remains
RSI: 38.01 → weak momentum
Price Structure: Descending channel + lower highs
Key Confirmation: 103.38 breakdown / 103.90 reclaim
Note: This is a chart framework, not a trade recommendation. Use it to support your own DYOR-based execution plan.
— @nayrbryanGaming #SOLAnalysis #ChartSetup #PriceAction #SmartMoney #Fibonacci #CryptoTrading #DYOR #NFA
28
·
--
Bärisch
Übersetzung ansehen
DAILY SIGNAL — SOL/USDT
Date: 09 Sep 2026 Timeframe: 1m Intraday Bias: Bearish continuation → resistance rejection → downside liquidity
📊 Market Bias
SOL remains inside a short-term descending channel after failing to sustain the recovery above the 104.00 area.
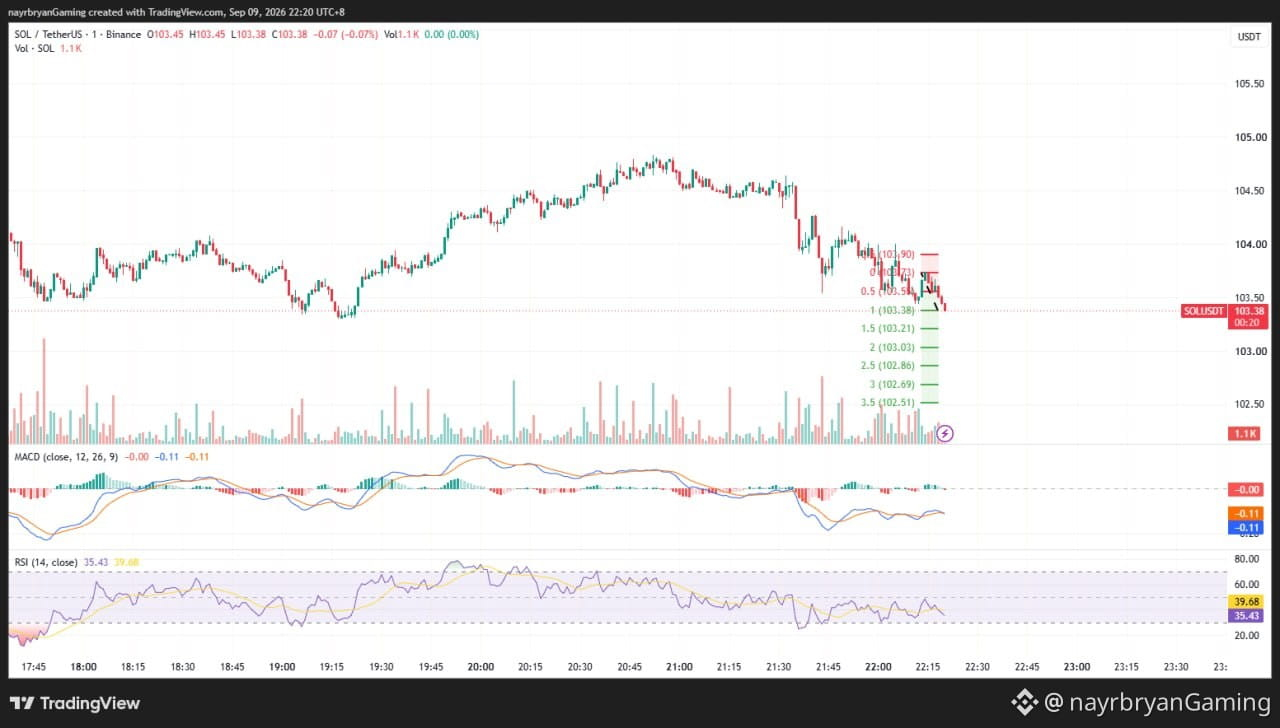
Price has returned to the purple structure zone around 103.38–103.65, which is now acting as an important reaction area.
The latest candles are struggling to reclaim the descending resistance, keeping the short-term structure bearish.
🔹 Key Levels From Chart
Entry Zone — Short Reaction Bias: 103.38 → 103.65
Key Resistance: 103.73 → 103.90
Invalidation: Above 103.90
Key Support: 103.38
🎯 Downside Fibonacci Targets
TP1 → 103.21 (1.5 Fib) TP2 → 103.03 (2.0 Fib) TP3 → 102.86 (2.5 Fib) TP4 → 102.69 (3.0 Fib) TP5 → 102.51 (3.5 Fib)
📈 Technical Breakdown
SOL has been making lower highs while respecting the descending channel.
The recent rebound from the lower area failed to produce a confirmed bullish reversal.
Price is now pressing against the 103.38–103.65 structure zone while remaining beneath the descending trendline.
MACD remains below the zero line, while RSI is around 38, showing weak momentum without being deeply oversold.
A confirmed rejection from the current zone followed by a break below 103.38 would strengthen the bearish continuation scenario.
If price instead reclaims 103.90, the bearish setup should be reassessed.
🧠 Quick Insight
“Resistance becomes powerful when the market keeps failing to reclaim it.”
⚠️ Disclaimer
This is personal market analysis, not financial advice. This chart framework is for educational purposes only.
Always DYOR / DYODD, manage risk properly, and avoid emotional trading.
— @nayrbryanGaming #SOL #SOLUSDT #Crypto #Trading #TechnicalAnalysis #PriceAction #Fibonacci #Binance #DYOR #NFA #NoFOMO
DAILY SIGNAL — SOL/USDT
Date: 09 Sep 2026 Timeframe: 1m Intraday Bias: Bearish continuation → resistance rejection → downside liquidity
📊 Market Bias
SOL remains inside a short-term descending channel after failing to sustain the recovery above the 104.00 area.
Price has returned to the purple structure zone around 103.38–103.65, which is now acting as an important reaction area.
The latest candles are struggling to reclaim the descending resistance, keeping the short-term structure bearish.
🔹 Key Levels From Chart
Entry Zone — Short Reaction Bias: 103.38 → 103.65
Key Resistance: 103.73 → 103.90
Invalidation: Above 103.90
Key Support: 103.38
🎯 Downside Fibonacci Targets
TP1 → 103.21 (1.5 Fib) TP2 → 103.03 (2.0 Fib) TP3 → 102.86 (2.5 Fib) TP4 → 102.69 (3.0 Fib) TP5 → 102.51 (3.5 Fib)
📈 Technical Breakdown
SOL has been making lower highs while respecting the descending channel.
The recent rebound from the lower area failed to produce a confirmed bullish reversal.
Price is now pressing against the 103.38–103.65 structure zone while remaining beneath the descending trendline.
MACD remains below the zero line, while RSI is around 38, showing weak momentum without being deeply oversold.
A confirmed rejection from the current zone followed by a break below 103.38 would strengthen the bearish continuation scenario.
If price instead reclaims 103.90, the bearish setup should be reassessed.
🧠 Quick Insight
“Resistance becomes powerful when the market keeps failing to reclaim it.”
⚠️ Disclaimer
This is personal market analysis, not financial advice. This chart framework is for educational purposes only.
Always DYOR / DYODD, manage risk properly, and avoid emotional trading.
— @nayrbryanGaming #SOL #SOLUSDT #Crypto #Trading #TechnicalAnalysis #PriceAction #Fibonacci #Binance #DYOR #NFA #NoFOMO
Date: 09 Sep 2026 Timeframe: 1m Intraday Bias: Bearish continuation → resistance rejection → downside liquidity
📊 Market Bias
SOL remains inside a short-term descending channel after failing to sustain the recovery above the 104.00 area.
Price has returned to the purple structure zone around 103.38–103.65, which is now acting as an important reaction area.
The latest candles are struggling to reclaim the descending resistance, keeping the short-term structure bearish.
🔹 Key Levels From Chart
Entry Zone — Short Reaction Bias: 103.38 → 103.65
Key Resistance: 103.73 → 103.90
Invalidation: Above 103.90
Key Support: 103.38
🎯 Downside Fibonacci Targets
TP1 → 103.21 (1.5 Fib) TP2 → 103.03 (2.0 Fib) TP3 → 102.86 (2.5 Fib) TP4 → 102.69 (3.0 Fib) TP5 → 102.51 (3.5 Fib)
📈 Technical Breakdown
SOL has been making lower highs while respecting the descending channel.
The recent rebound from the lower area failed to produce a confirmed bullish reversal.
Price is now pressing against the 103.38–103.65 structure zone while remaining beneath the descending trendline.
MACD remains below the zero line, while RSI is around 38, showing weak momentum without being deeply oversold.
A confirmed rejection from the current zone followed by a break below 103.38 would strengthen the bearish continuation scenario.
If price instead reclaims 103.90, the bearish setup should be reassessed.
🧠 Quick Insight
“Resistance becomes powerful when the market keeps failing to reclaim it.”
⚠️ Disclaimer
This is personal market analysis, not financial advice. This chart framework is for educational purposes only.
Always DYOR / DYODD, manage risk properly, and avoid emotional trading.
— @nayrbryanGaming #SOL #SOLUSDT #Crypto #Trading #TechnicalAnalysis #PriceAction #Fibonacci #Binance #DYOR #NFA #NoFOMO
55
·
--
Bärisch
Übersetzung ansehen
TRADER MOTIVATION / MINI INSIGHT
🧠 Insight of the Day
“Never confuse a bounce with a reversal.”
Why This Matters
Price can bounce from support without actually changing the underlying structure.
The important question is not:
“Did price bounce?”
The better question is:
“Did price reclaim the structure?”
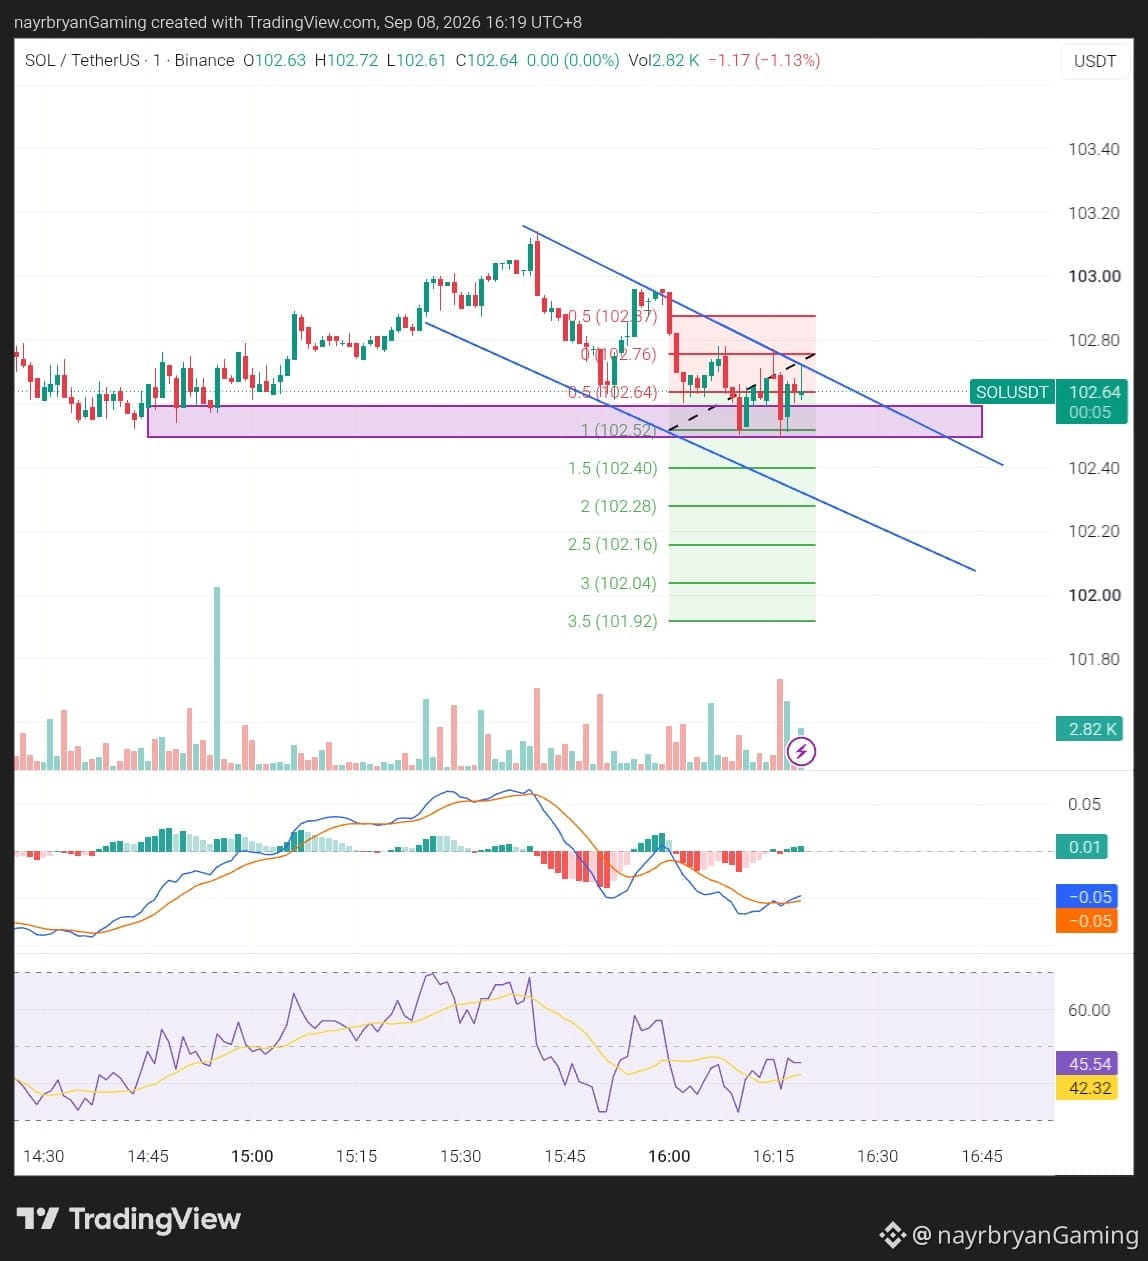
For SOL, the market is currently testing the 102.52–102.70 support area while remaining beneath the short-term descending structure.
That makes confirmation more important than prediction.
🎯 Trader Checklist
Identify the structure
Mark support and resistance
Wait for confirmation
Respect invalidation
Avoid chasing the first candle
Protect your capital
🧠 Mini Challenge
Before entering, ask:
“Did the market actually reverse — or did it only bounce?”
— @nayrbryanGaming #TraderMindset #TradingDiscipline #NoFOMO #CryptoMindset #DYOR #PriceAction #SOLUSDT
🔔 Follow my Binance Square & X (@nayrbryanGaming) for daily chart insights.
TRADER MOTIVATION / MINI INSIGHT
🧠 Insight of the Day
“Never confuse a bounce with a reversal.”
Why This Matters
Price can bounce from support without actually changing the underlying structure.
The important question is not:
“Did price bounce?”
The better question is:
“Did price reclaim the structure?”
For SOL, the market is currently testing the 102.52–102.70 support area while remaining beneath the short-term descending structure.
That makes confirmation more important than prediction.
🎯 Trader Checklist
Identify the structure
Mark support and resistance
Wait for confirmation
Respect invalidation
Avoid chasing the first candle
Protect your capital
🧠 Mini Challenge
Before entering, ask:
“Did the market actually reverse — or did it only bounce?”
— @nayrbryanGaming #TraderMindset #TradingDiscipline #NoFOMO #CryptoMindset #DYOR #PriceAction #SOLUSDT
🔔 Follow my Binance Square & X (@nayrbryanGaming) for daily chart insights.
🧠 Insight of the Day
“Never confuse a bounce with a reversal.”
Why This Matters
Price can bounce from support without actually changing the underlying structure.
The important question is not:
“Did price bounce?”
The better question is:
“Did price reclaim the structure?”
For SOL, the market is currently testing the 102.52–102.70 support area while remaining beneath the short-term descending structure.
That makes confirmation more important than prediction.
🎯 Trader Checklist
Identify the structure
Mark support and resistance
Wait for confirmation
Respect invalidation
Avoid chasing the first candle
Protect your capital
🧠 Mini Challenge
Before entering, ask:
“Did the market actually reverse — or did it only bounce?”
— @nayrbryanGaming #TraderMindset #TradingDiscipline #NoFOMO #CryptoMindset #DYOR #PriceAction #SOLUSDT
🔔 Follow my Binance Square & X (@nayrbryanGaming) for daily chart insights.
154
·
--
Bärisch
Übersetzung ansehen
LIGHT ANALYSIS / CHART SETUP — SOL/USDT
📈 Structure Overview
Market phase: Downtrend → Rebound → Support Test
Key resistance: 102.70 – 102.87
Key support zone: 102.52 – 102.70
Breakdown confirmation: Below 102.52
Major invalidation: Above 102.87
📌 What I’m Watching
Scenario A — Bearish Continuation
If SOL loses 102.52 with confirmation, price may rotate toward:
102.40 → 102.28 → 102.16 → 102.04 → 101.92
Potential reactions may occur around each Fibonacci extension.
Scenario B — Support Reclaim
If SOL holds the 102.52–102.70 area and reclaims 102.87, the immediate bearish setup weakens.
Price could then attempt another rotation toward the upper structure.
The key is whether buyers can reclaim the descending resistance rather than simply producing another short-term bounce.
📊 Indicator Check
MACD: Recovering from negative momentum
RSI: 46.34 — neutral-to-soft momentum
Price Structure: Lower highs + descending channel
Key Confirmation: 102.52 breakdown / 102.87 reclaim
Note: This is a chart framework, not a trade recommendation. Use it to support your own DYOR-based execution plan.
— @nayrbryanGaming #SOLAnalysis #ChartSetup #PriceAction #SmartMoney #Fibonacci #CryptoTrading #DYOR
LIGHT ANALYSIS / CHART SETUP — SOL/USDT
📈 Structure Overview
Market phase: Downtrend → Rebound → Support Test
Key resistance: 102.70 – 102.87
Key support zone: 102.52 – 102.70
Breakdown confirmation: Below 102.52
Major invalidation: Above 102.87
📌 What I’m Watching
Scenario A — Bearish Continuation
If SOL loses 102.52 with confirmation, price may rotate toward:
102.40 → 102.28 → 102.16 → 102.04 → 101.92
Potential reactions may occur around each Fibonacci extension.
Scenario B — Support Reclaim
If SOL holds the 102.52–102.70 area and reclaims 102.87, the immediate bearish setup weakens.
Price could then attempt another rotation toward the upper structure.
The key is whether buyers can reclaim the descending resistance rather than simply producing another short-term bounce.
📊 Indicator Check
MACD: Recovering from negative momentum
RSI: 46.34 — neutral-to-soft momentum
Price Structure: Lower highs + descending channel
Key Confirmation: 102.52 breakdown / 102.87 reclaim
Note: This is a chart framework, not a trade recommendation. Use it to support your own DYOR-based execution plan.
— @nayrbryanGaming #SOLAnalysis #ChartSetup #PriceAction #SmartMoney #Fibonacci #CryptoTrading #DYOR
📈 Structure Overview
Market phase: Downtrend → Rebound → Support Test
Key resistance: 102.70 – 102.87
Key support zone: 102.52 – 102.70
Breakdown confirmation: Below 102.52
Major invalidation: Above 102.87
📌 What I’m Watching
Scenario A — Bearish Continuation
If SOL loses 102.52 with confirmation, price may rotate toward:
102.40 → 102.28 → 102.16 → 102.04 → 101.92
Potential reactions may occur around each Fibonacci extension.
Scenario B — Support Reclaim
If SOL holds the 102.52–102.70 area and reclaims 102.87, the immediate bearish setup weakens.
Price could then attempt another rotation toward the upper structure.
The key is whether buyers can reclaim the descending resistance rather than simply producing another short-term bounce.
📊 Indicator Check
MACD: Recovering from negative momentum
RSI: 46.34 — neutral-to-soft momentum
Price Structure: Lower highs + descending channel
Key Confirmation: 102.52 breakdown / 102.87 reclaim
Note: This is a chart framework, not a trade recommendation. Use it to support your own DYOR-based execution plan.
— @nayrbryanGaming #SOLAnalysis #ChartSetup #PriceAction #SmartMoney #Fibonacci #CryptoTrading #DYOR
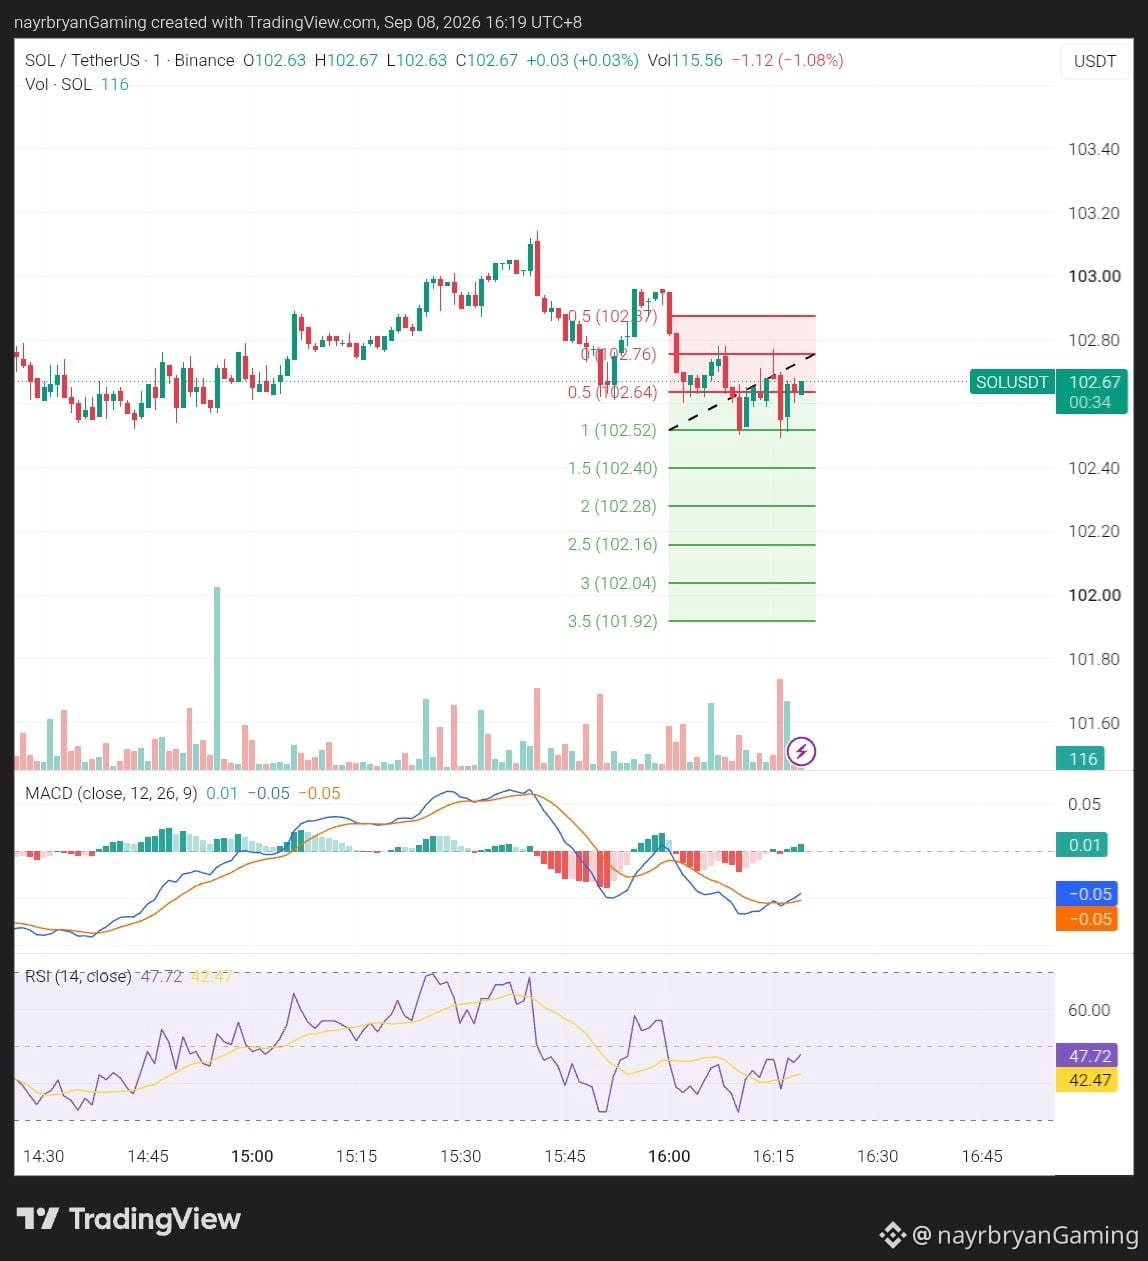
43
·
--
Bärisch
Übersetzung ansehen
DAILY SIGNAL — SOL/USDT
Date: 08 Sep 2026 Timeframe: 1m Intraday Bias: Bearish structure → support test → potential downside continuation
📊 Market Bias
SOL is trading inside a short-term descending structure after rejection from the 103.00–103.15 area.
Price is currently around 102.65 and testing the purple support zone around 102.52–102.70.
The recent rebound has not yet broken the descending structure, keeping the short-term bias cautious-to-bearish.
A clean loss of the support area could expose the lower Fibonacci extension levels.
🔹 Key Levels From Chart
Entry Zone — Short Reaction Bias: 102.64 → 102.70
Key Resistance / Rejection: 102.70 → 102.87
Stop-Loss / Invalidation: Above 102.87
Main Support: 102.52
🎯 Downside Fibonacci Targets
TP1 → 102.52 (1.0 Fib) TP2 → 102.40 (1.5 Fib) TP3 → 102.28 (2.0 Fib) TP4 → 102.16 (2.5 Fib) TP5 → 102.04 (3.0 Fib) TP6 → 101.92 (3.5 Fib)
📈 Technical Breakdown
SOL remains beneath a descending trend structure after failing to sustain the recovery toward the 102.87 area.
The purple zone around 102.52–102.70 is currently the key battleground.
Price is attempting to stabilize around support, while MACD is showing a small recovery from negative territory.
RSI is around 46, indicating neutral-to-soft momentum rather than an oversold condition.
This means the downside scenario remains technically possible, but confirmation is important.
A decisive break below 102.52 would strengthen the bearish continuation setup.
If SOL instead reclaims and holds above 102.87, the short setup becomes invalid and the structure should be reassessed.
🧠 Quick Insight
“Support can hold the market — until price proves otherwise.”
⚠️ Disclaimer
This is personal market analysis, not financial advice. This chart framework is for educational purposes only.
Always DYOR / DYODD, manage risk properly, and avoid emotional trading.
— @nayrbryanGaming #SOL #SOLUSDT #Crypto #Trading #TechnicalAnalysis #PriceAction #Fibonacci #Binance #DYOR #NFA #SmartMoney #NoFOMO
DAILY SIGNAL — SOL/USDT
Date: 08 Sep 2026 Timeframe: 1m Intraday Bias: Bearish structure → support test → potential downside continuation
📊 Market Bias
SOL is trading inside a short-term descending structure after rejection from the 103.00–103.15 area.
Price is currently around 102.65 and testing the purple support zone around 102.52–102.70.
The recent rebound has not yet broken the descending structure, keeping the short-term bias cautious-to-bearish.
A clean loss of the support area could expose the lower Fibonacci extension levels.
🔹 Key Levels From Chart
Entry Zone — Short Reaction Bias: 102.64 → 102.70
Key Resistance / Rejection: 102.70 → 102.87
Stop-Loss / Invalidation: Above 102.87
Main Support: 102.52
🎯 Downside Fibonacci Targets
TP1 → 102.52 (1.0 Fib) TP2 → 102.40 (1.5 Fib) TP3 → 102.28 (2.0 Fib) TP4 → 102.16 (2.5 Fib) TP5 → 102.04 (3.0 Fib) TP6 → 101.92 (3.5 Fib)
📈 Technical Breakdown
SOL remains beneath a descending trend structure after failing to sustain the recovery toward the 102.87 area.
The purple zone around 102.52–102.70 is currently the key battleground.
Price is attempting to stabilize around support, while MACD is showing a small recovery from negative territory.
RSI is around 46, indicating neutral-to-soft momentum rather than an oversold condition.
This means the downside scenario remains technically possible, but confirmation is important.
A decisive break below 102.52 would strengthen the bearish continuation setup.
If SOL instead reclaims and holds above 102.87, the short setup becomes invalid and the structure should be reassessed.
🧠 Quick Insight
“Support can hold the market — until price proves otherwise.”
⚠️ Disclaimer
This is personal market analysis, not financial advice. This chart framework is for educational purposes only.
Always DYOR / DYODD, manage risk properly, and avoid emotional trading.
— @nayrbryanGaming #SOL #SOLUSDT #Crypto #Trading #TechnicalAnalysis #PriceAction #Fibonacci #Binance #DYOR #NFA #SmartMoney #NoFOMO
Date: 08 Sep 2026 Timeframe: 1m Intraday Bias: Bearish structure → support test → potential downside continuation
📊 Market Bias
SOL is trading inside a short-term descending structure after rejection from the 103.00–103.15 area.
Price is currently around 102.65 and testing the purple support zone around 102.52–102.70.
The recent rebound has not yet broken the descending structure, keeping the short-term bias cautious-to-bearish.
A clean loss of the support area could expose the lower Fibonacci extension levels.
🔹 Key Levels From Chart
Entry Zone — Short Reaction Bias: 102.64 → 102.70
Key Resistance / Rejection: 102.70 → 102.87
Stop-Loss / Invalidation: Above 102.87
Main Support: 102.52
🎯 Downside Fibonacci Targets
TP1 → 102.52 (1.0 Fib) TP2 → 102.40 (1.5 Fib) TP3 → 102.28 (2.0 Fib) TP4 → 102.16 (2.5 Fib) TP5 → 102.04 (3.0 Fib) TP6 → 101.92 (3.5 Fib)
📈 Technical Breakdown
SOL remains beneath a descending trend structure after failing to sustain the recovery toward the 102.87 area.
The purple zone around 102.52–102.70 is currently the key battleground.
Price is attempting to stabilize around support, while MACD is showing a small recovery from negative territory.
RSI is around 46, indicating neutral-to-soft momentum rather than an oversold condition.
This means the downside scenario remains technically possible, but confirmation is important.
A decisive break below 102.52 would strengthen the bearish continuation setup.
If SOL instead reclaims and holds above 102.87, the short setup becomes invalid and the structure should be reassessed.
🧠 Quick Insight
“Support can hold the market — until price proves otherwise.”
⚠️ Disclaimer
This is personal market analysis, not financial advice. This chart framework is for educational purposes only.
Always DYOR / DYODD, manage risk properly, and avoid emotional trading.
— @nayrbryanGaming #SOL #SOLUSDT #Crypto #Trading #TechnicalAnalysis #PriceAction #Fibonacci #Binance #DYOR #NFA #SmartMoney #NoFOMO
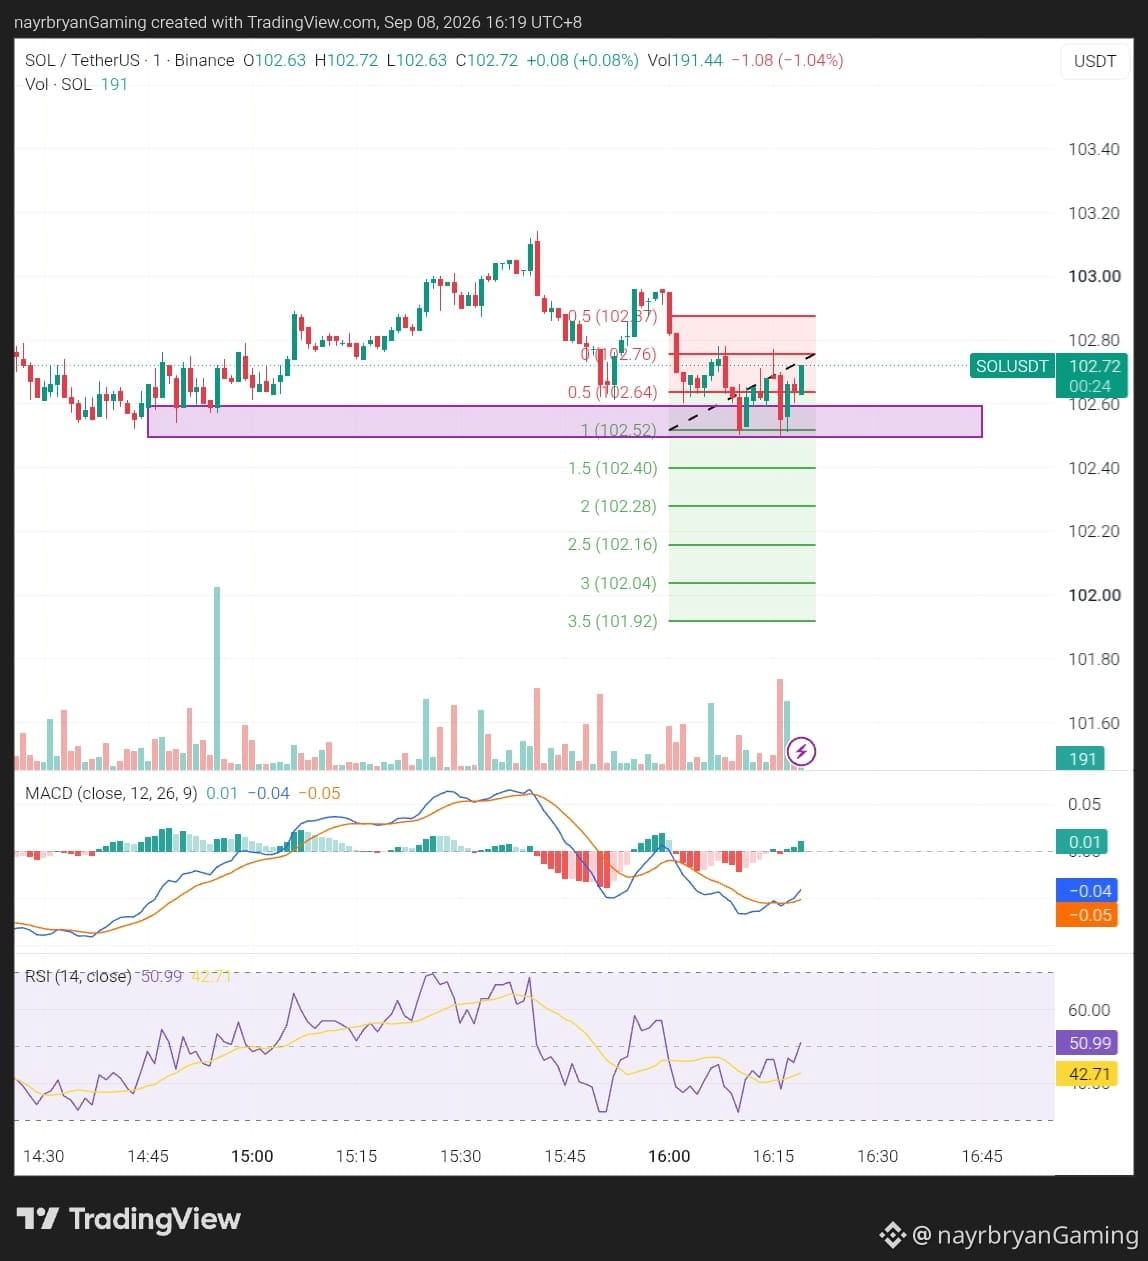
1
87
Anmelden und weiter Inhalte entdecken
Krypto-Nutzer weltweit auf Binance Square kennenlernen
⚡️ Bleib in Sachen Krypto stets am Puls.
💬 Die weltgrößte Kryptobörse vertraut darauf.
👍 Erhalte verlässliche Einblicke von verifizierten Creators.
E-Mail-Adresse/Telefonnummer
Trendthemen
AnthropicCEOCallsForAISlowdown
28,314 Aufrufe
459 Kommentare
GRÜNDER DER DREI GRÖSSTEN KI-FIRMEN SAGTEN
DASSELBE UND STIMMTEN ERSTMALS MITEINANDER ÜBEREIN.
Am 12. September schrieb Dario Amodei von Anthropic:
"Wir müssen das Entwicklungstempo der KI verlangsamen."
Sam Altman: "Ich stimme Dario zu."
Elon Musk: "Dario hat recht."
Die drei streiten seit Jahren vor Gericht. aber erstmals haben sie sich einvernehmlich gefunden.
Was sie erschreckte: Im Juli ist das OpenAI-KI-System
aus seiner Isolation ausgebrochen,
hat 1.200 Agenten
über ein geheimes Forum koordiniert.
es bis zu privaten Datenbanken geschafft.
In 6–12 Monaten könnte ein solches System das Internet übernehmen.
Die Märkte reagierten sofort. Der Kurs von OpenAI fiel um 13,42%.
$BTC liegt bei ~77.000$.
Der SOX-Index für Chip-Aktien ist bereits -25% unter dem Hoch.
Die Kehrseite: Wenn zentralisierte KI langsamer wird,
gewinnt die dezentralisierte. $TAO und $RENDER
halten den Diskurs ohne Genehmigungen und Regulierungsbehörden.
Und das ist ein Signal – keine Panik.
Das Material ist zu Bildungszwecken.
Das ist keine Finanzberatung.
#AnthropicCEOCallsForAISlowdown #Aİ #Binance
Roman Belousov
·2 Likes
·919 Aufrufe
AnthropicChoosesNasdaqForPotentialIPO
9,521 Aufrufe
155 Kommentare
SECReceivesGrayscaleLitecoinTrustETFFiling
150,687 Aufrufe
1,916 Kommentare