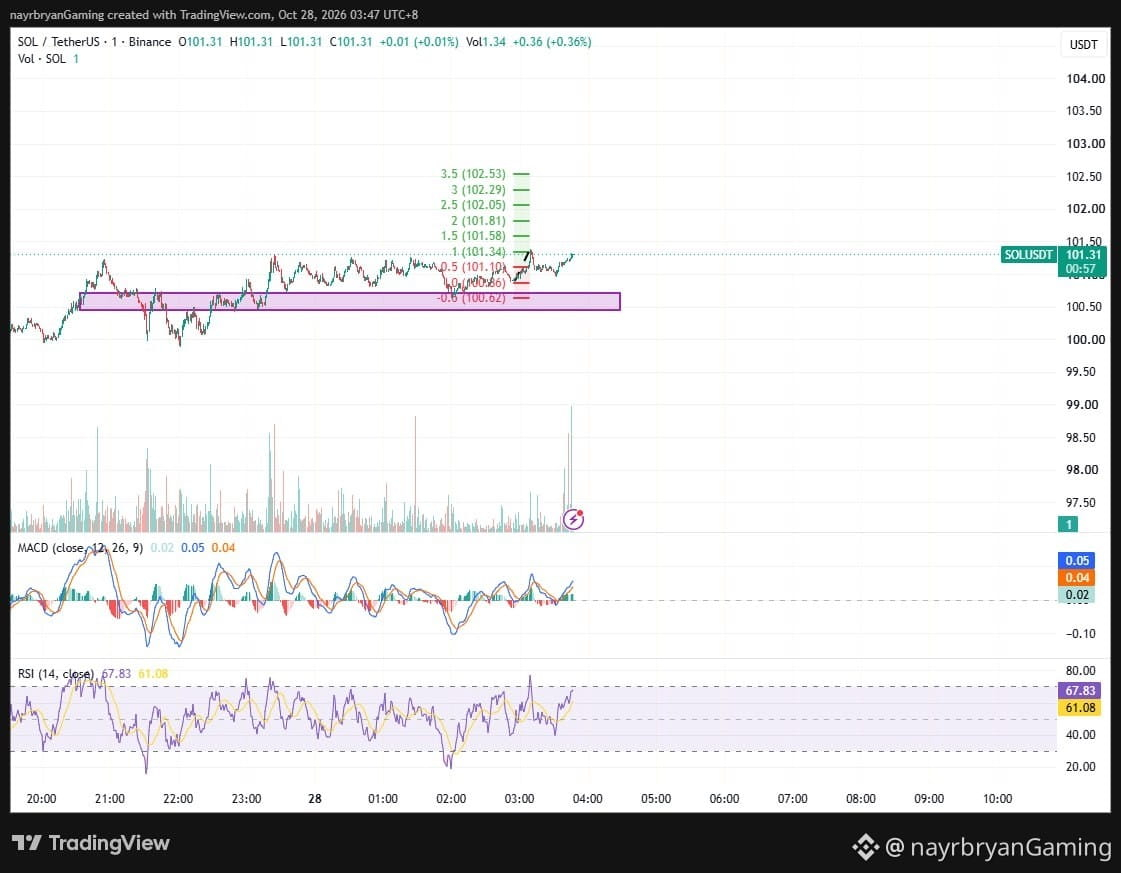
LIGHT ANALYSIS / CHART SETUP — SOL/USDT
📈 Structure Overview
Market phase:
Recovery → Ascending consolidation → Resistance test
Current Price:
101.29
Immediate Resistance:
101.30–101.40
Key Fibonacci Reference:
101.34
Major Demand Zone:
100.45–100.70
Structural Support Reference:
100.62
Upside Fibonacci Levels:
101.58 → 101.81 → 102.05 → 102.29 → 102.53
---
📌 What I'm Watching
Scenario A — Bullish Continuation
If SOL breaks and sustains above 101.40, the next potential upside levels are:
101.58 → 101.81 → 102.05 → 102.29 → 102.53
A successful breakout and retest would provide stronger evidence of continuation.
Scenario B — Resistance Rejection
If SOL fails to clear 101.30–101.40 and breaks below the rising support trendline, a pullback toward these references becomes possible:
101.10 → 100.86 → 100.62
The 100.45–100.70 demand zone remains the broader structural area to monitor.
---
📊 Indicator Check
MACD:
Positive; MACD line above signal line.
Histogram:
Approximately +0.02.
RSI:
65.44, above its average of 60.91.
Price Structure:
Ascending support pressing against horizontal resistance.
Confirmation:
Breakout above 101.40 / loss of ascending support.
---
Note:
This is a chart framework, not a trade recommendation.
Use it to support your own DYOR-based execution plan.
— @nayrbryanGaming
#SOLAnalysis #ChartSetup #PriceAction #SmartMoney #Fibonacci #CryptoTrading #TradingView #DYOR #NFA