DAILY SIGNAL — SOL/USDT
Date: 28 Oct 2026
Timeframe: 1m
Intraday Bias: Ascending support → resistance test → potential bullish breakout
---
📊 Market Bias
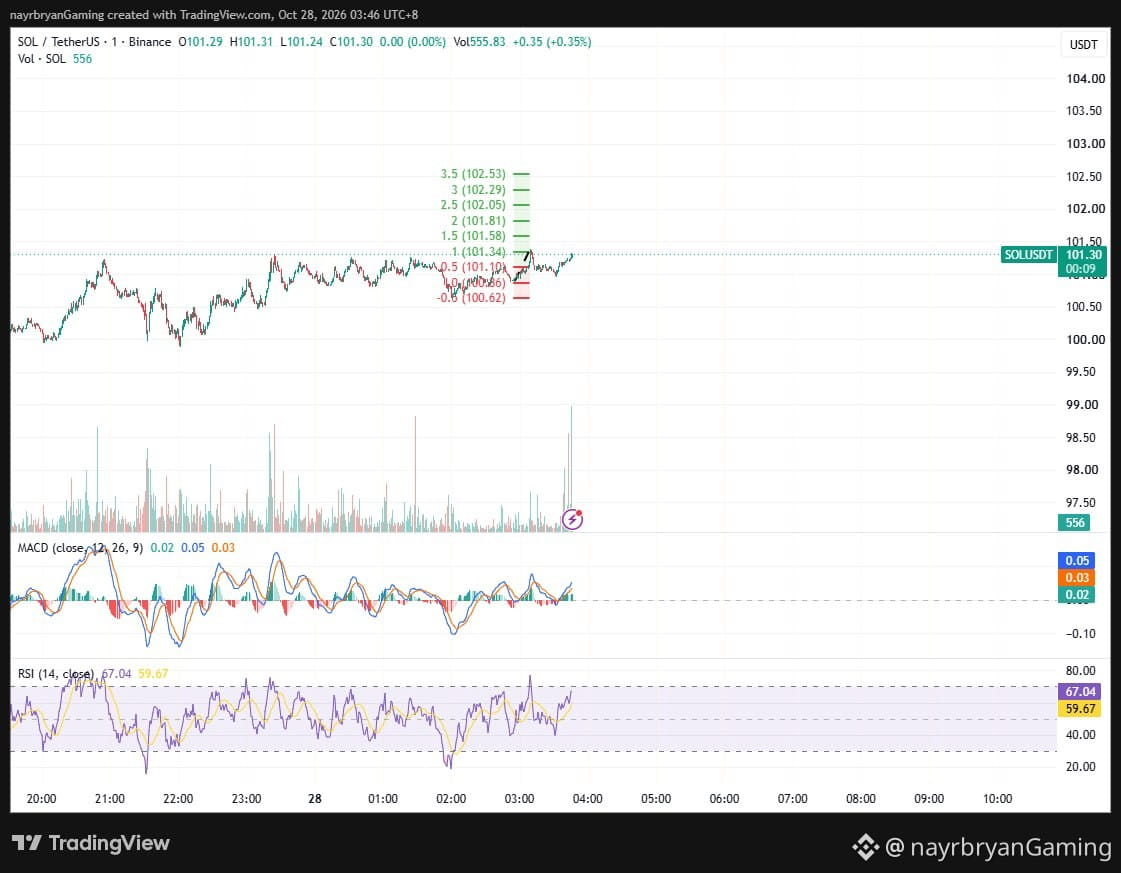
SOL is consolidating near 101.29 after recovering from the lower structure around 99.90–100.00.
Price has formed an ascending support trendline while repeatedly testing horizontal resistance around 101.30–101.40.
The purple demand zone around 100.45–100.70 remains an important structural reference. Buyers have defended higher levels, but the market still needs a confirmed breakout above resistance to establish stronger bullish continuation.
MACD is positive, with readings near 0.05 and 0.04, while the histogram is approximately 0.02. RSI is around 65.44, above its average of 60.91, indicating improving bullish momentum.
However, price is approaching resistance, so a breakout should not be assumed before confirmation.
---
🔹 Key Levels From Chart
Current Price:
101.29
Immediate Resistance:
101.30–101.40
Ascending Support:
Rising blue trendline beneath price
Key Support Reference:
100.62
Major Demand Zone:
100.45–100.70
Lower Structural Reference:
99.90–100.00
---
🎯 Fibonacci Levels
Upside Targets:
TP1 → 101.34 (1.0 Fib)
TP2 → 101.58 (1.5 Fib)
TP3 → 101.81 (2.0 Fib)
TP4 → 102.05 (2.5 Fib)
TP5 → 102.29 (3.0 Fib)
TP6 → 102.53 (3.5 Fib)
Downside References:
101.10 → 100.86 → 100.62
---
📈 Technical Breakdown
SOL is trading within a tightening structure defined by horizontal resistance and rising support.
Repeated tests of the upper boundary suggest that buyers are challenging the 101.30–101.40 resistance area.
---
🧠 Quick Insight
“Pressure builds at resistance, but confirmation comes from the breakout, not the number of tests.”
---
⚠️ Disclaimer
This is personal market analysis, not financial advice.
This chart framework is for educational purposes only.
Always DYOR / DYODD, manage risk properly, and avoid emotional trading.
— @nayrbryanGaming
#SOL #SOLUSDT #Crypto #Trading #TechnicalAnalysis #PriceAction #Fibonacci #Binance #MACD #RSI #MarketStructure #DYOR