
Crypto Adda Official
59 Beiträge

Crypto Adda Official
Melden
Nutzer blockieren
Decoding charts and spotting multi-X gems before the crowd 📊✨ 10 years in crypto. Pure price action and discipline 🧠 Find me on X: BazaidRaza 🚀
1 Following
84 Follower
39 Like gegeben
Beiträge
Alle
Zitierungen
·
--
Bullisch
Übersetzung ansehen
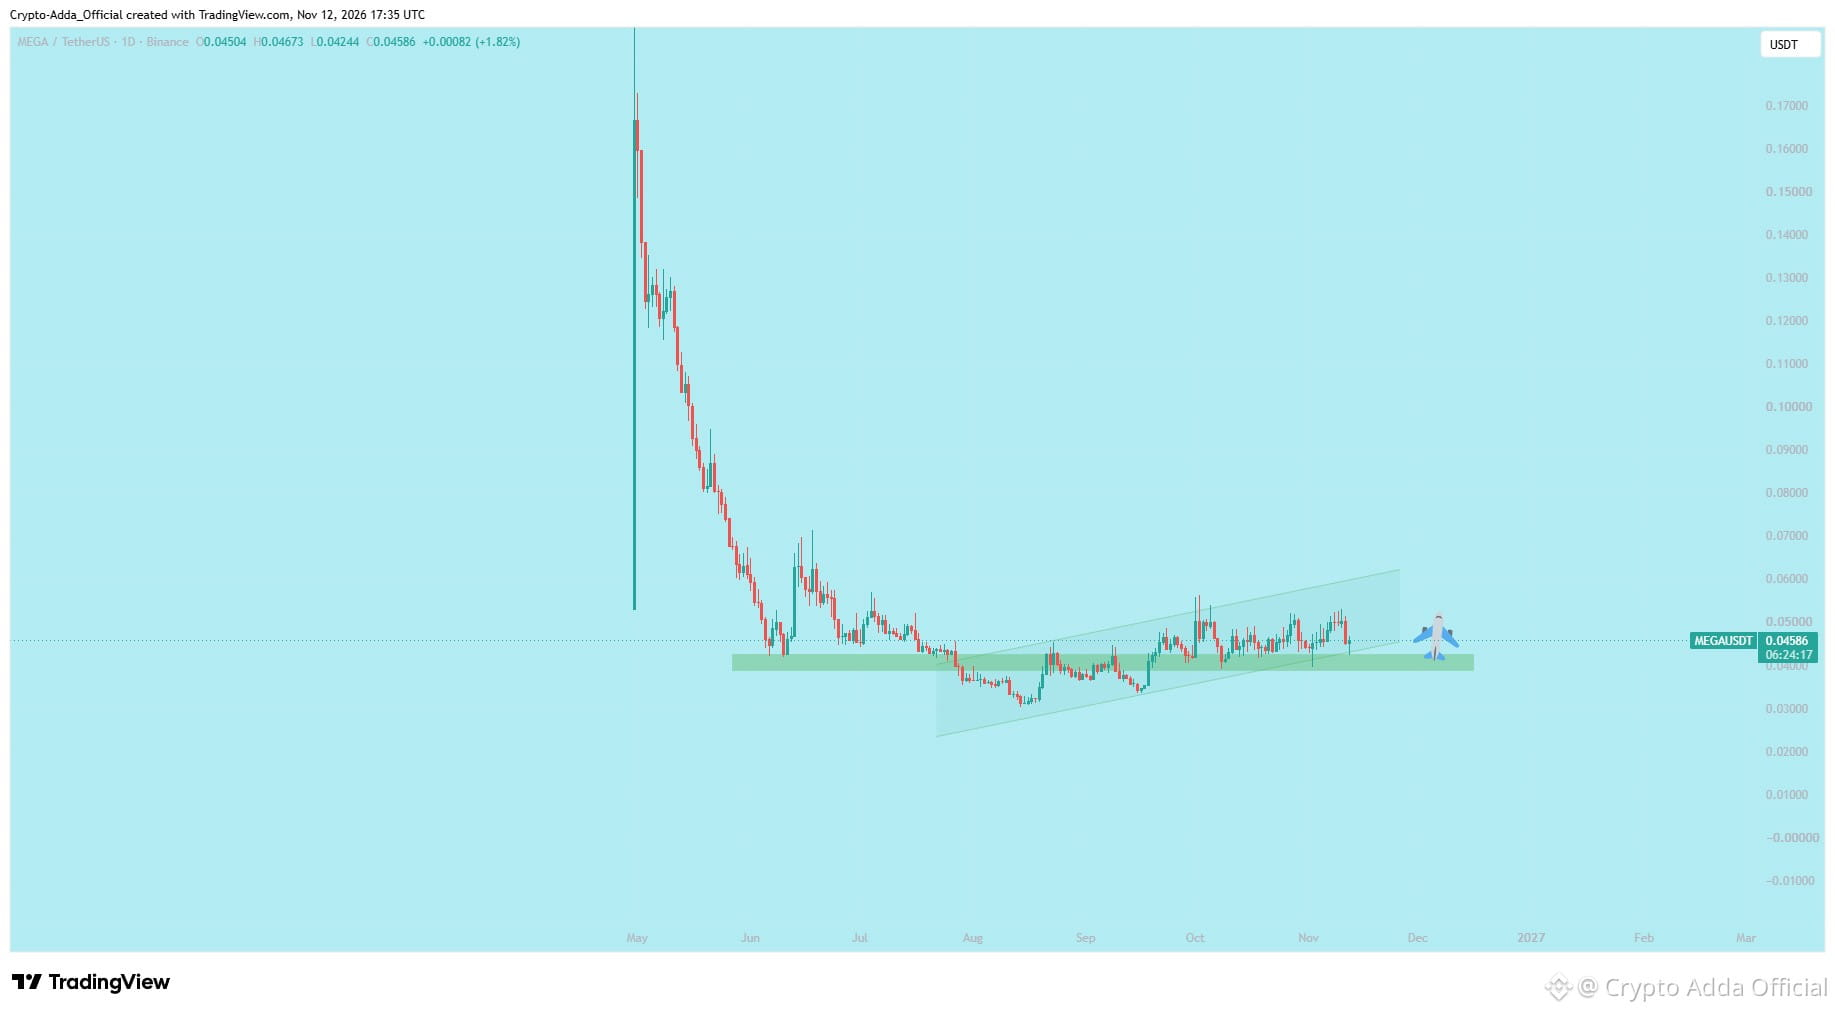
$MEGA /USDT daily chart technical breakdown! 📊 Price action is forming a bullish ascending channel right above a major green demand support zone around 0.040 to 0.045. 📈
• Clean accumulation pattern building up inside the channel structure
• Buyers actively defending the key support block and absorbing sell pressure
• Holding this zone sets up a powerful upward expansion phase
Patience and strict risk management are the keys to catching major moves. 🧠💎
Catch more chart breakdowns and community updates by checking my profile bio and finding me on X: BazaidRaza 🚀
$MAGMA $AGT #AGT #MAGMA #DODOX #play
$MEGA /USDT daily chart technical breakdown! 📊 Price action is forming a bullish ascending channel right above a major green demand support zone around 0.040 to 0.045. 📈
• Clean accumulation pattern building up inside the channel structure
• Buyers actively defending the key support block and absorbing sell pressure
• Holding this zone sets up a powerful upward expansion phase
Patience and strict risk management are the keys to catching major moves. 🧠💎
Catch more chart breakdowns and community updates by checking my profile bio and finding me on X: BazaidRaza 🚀
$MAGMA $AGT #AGT #MAGMA #DODOX #play
• Clean accumulation pattern building up inside the channel structure
• Buyers actively defending the key support block and absorbing sell pressure
• Holding this zone sets up a powerful upward expansion phase
Patience and strict risk management are the keys to catching major moves. 🧠💎
Catch more chart breakdowns and community updates by checking my profile bio and finding me on X: BazaidRaza 🚀
$MAGMA $AGT #AGT #MAGMA #DODOX #play
1
354
·
--
Bullisch
$AIOT
{future}(AIOTUSDT)
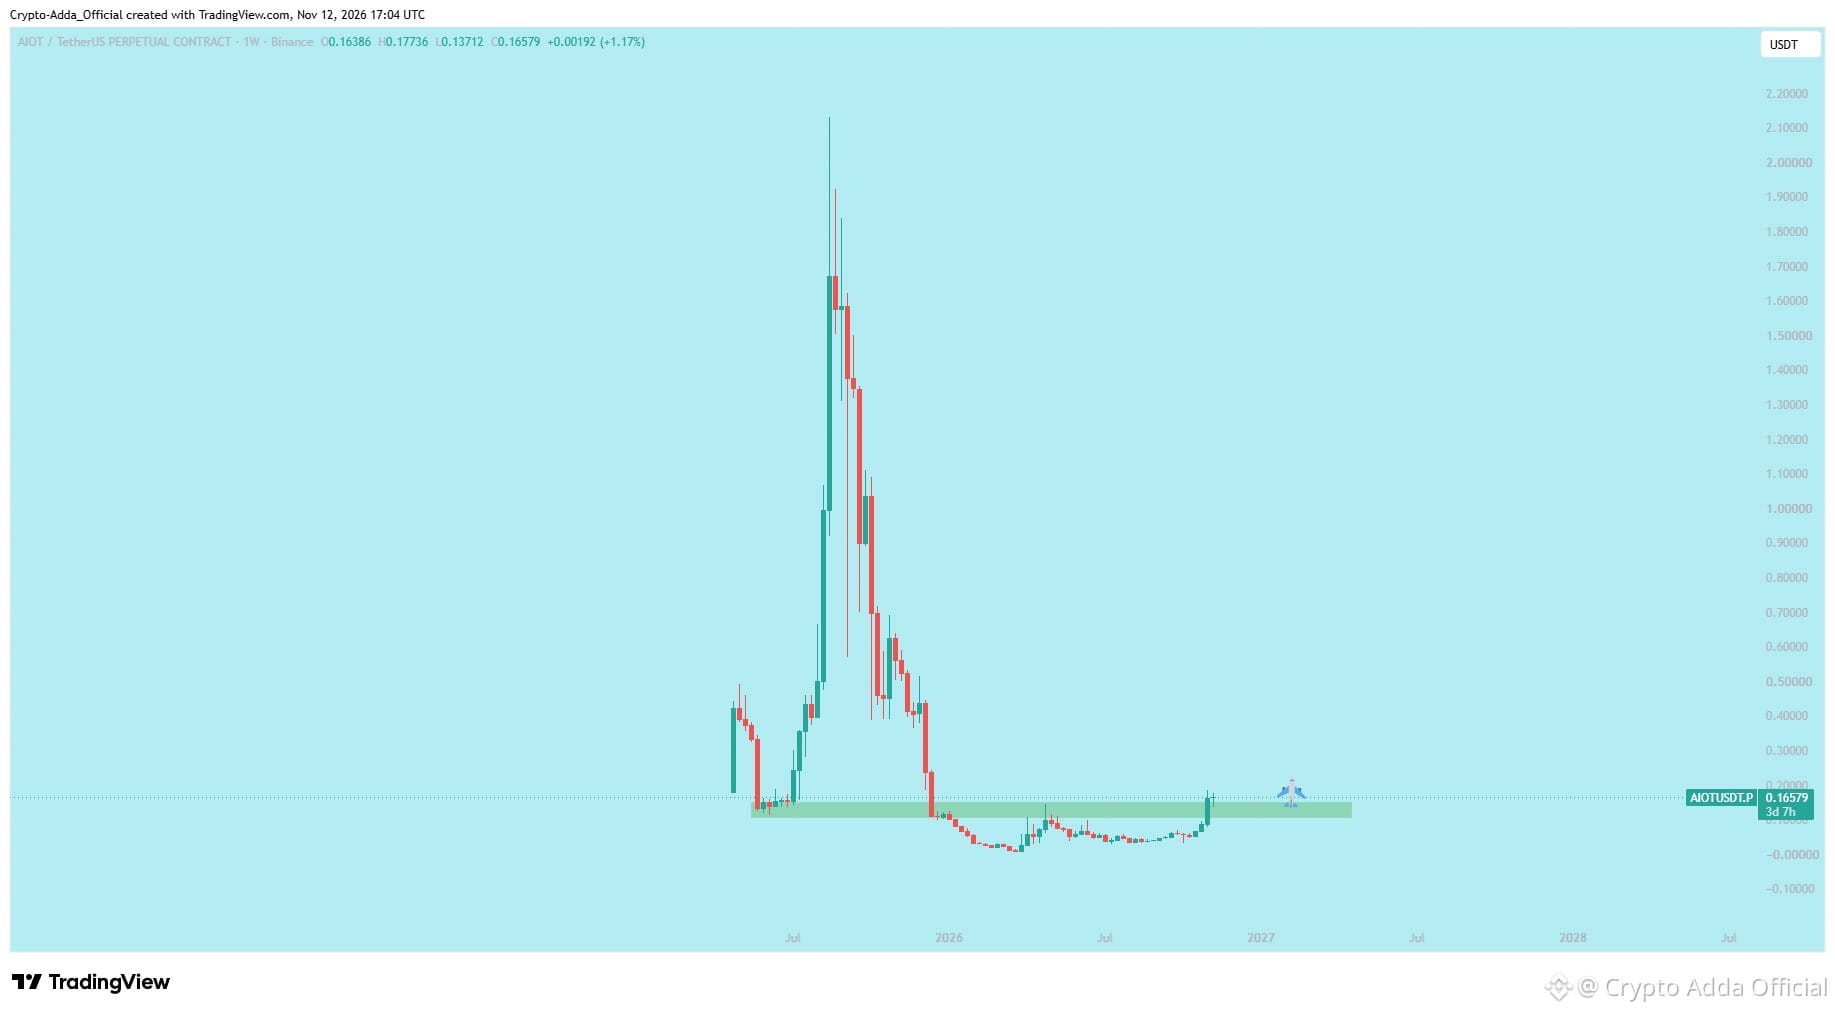
Wöchentliches Chartanalyse-Update! 📊 Die Kursbewegung bleibt stark und baut auf dem höheren Zeitrahmen eine kraftvolle Dynamik auf. 📈
• Klare technische Struktur mit starkem Käuferinteresse
• Wichtige gleitende Durchschnitte und Unterstützungszonen halten sich an den Plan
• Geduld bei Wochencharts schafft die Grundlage für enormes Expansionspotenzial
Behalte dein Risiko stets im Griff und lass die Marktstruktur sich entfalten. 🧠💎
Weitere Chartanalysen und Community-Updates findest du, wenn du in meiner Profil-Bio nachsiehst und mich auf X suchst: BazaidRaza 🚀
$AGT $MAGMA #Bard #AGT
$AIOT
Wöchentliches Chartanalyse-Update! 📊 Die Kursbewegung bleibt stark und baut auf dem höheren Zeitrahmen eine kraftvolle Dynamik auf. 📈
• Klare technische Struktur mit starkem Käuferinteresse
• Wichtige gleitende Durchschnitte und Unterstützungszonen halten sich an den Plan
• Geduld bei Wochencharts schafft die Grundlage für enormes Expansionspotenzial
Behalte dein Risiko stets im Griff und lass die Marktstruktur sich entfalten. 🧠💎
Weitere Chartanalysen und Community-Updates findest du, wenn du in meiner Profil-Bio nachsiehst und mich auf X suchst: BazaidRaza 🚀
$AGT $MAGMA #Bard #AGT
Wöchentliches Chartanalyse-Update! 📊 Die Kursbewegung bleibt stark und baut auf dem höheren Zeitrahmen eine kraftvolle Dynamik auf. 📈
• Klare technische Struktur mit starkem Käuferinteresse
• Wichtige gleitende Durchschnitte und Unterstützungszonen halten sich an den Plan
• Geduld bei Wochencharts schafft die Grundlage für enormes Expansionspotenzial
Behalte dein Risiko stets im Griff und lass die Marktstruktur sich entfalten. 🧠💎
Weitere Chartanalysen und Community-Updates findest du, wenn du in meiner Profil-Bio nachsiehst und mich auf X suchst: BazaidRaza 🚀
$AGT $MAGMA #Bard #AGT
1
530
Übersetzung ansehen
$HANA
{future}(HANAUSDT)
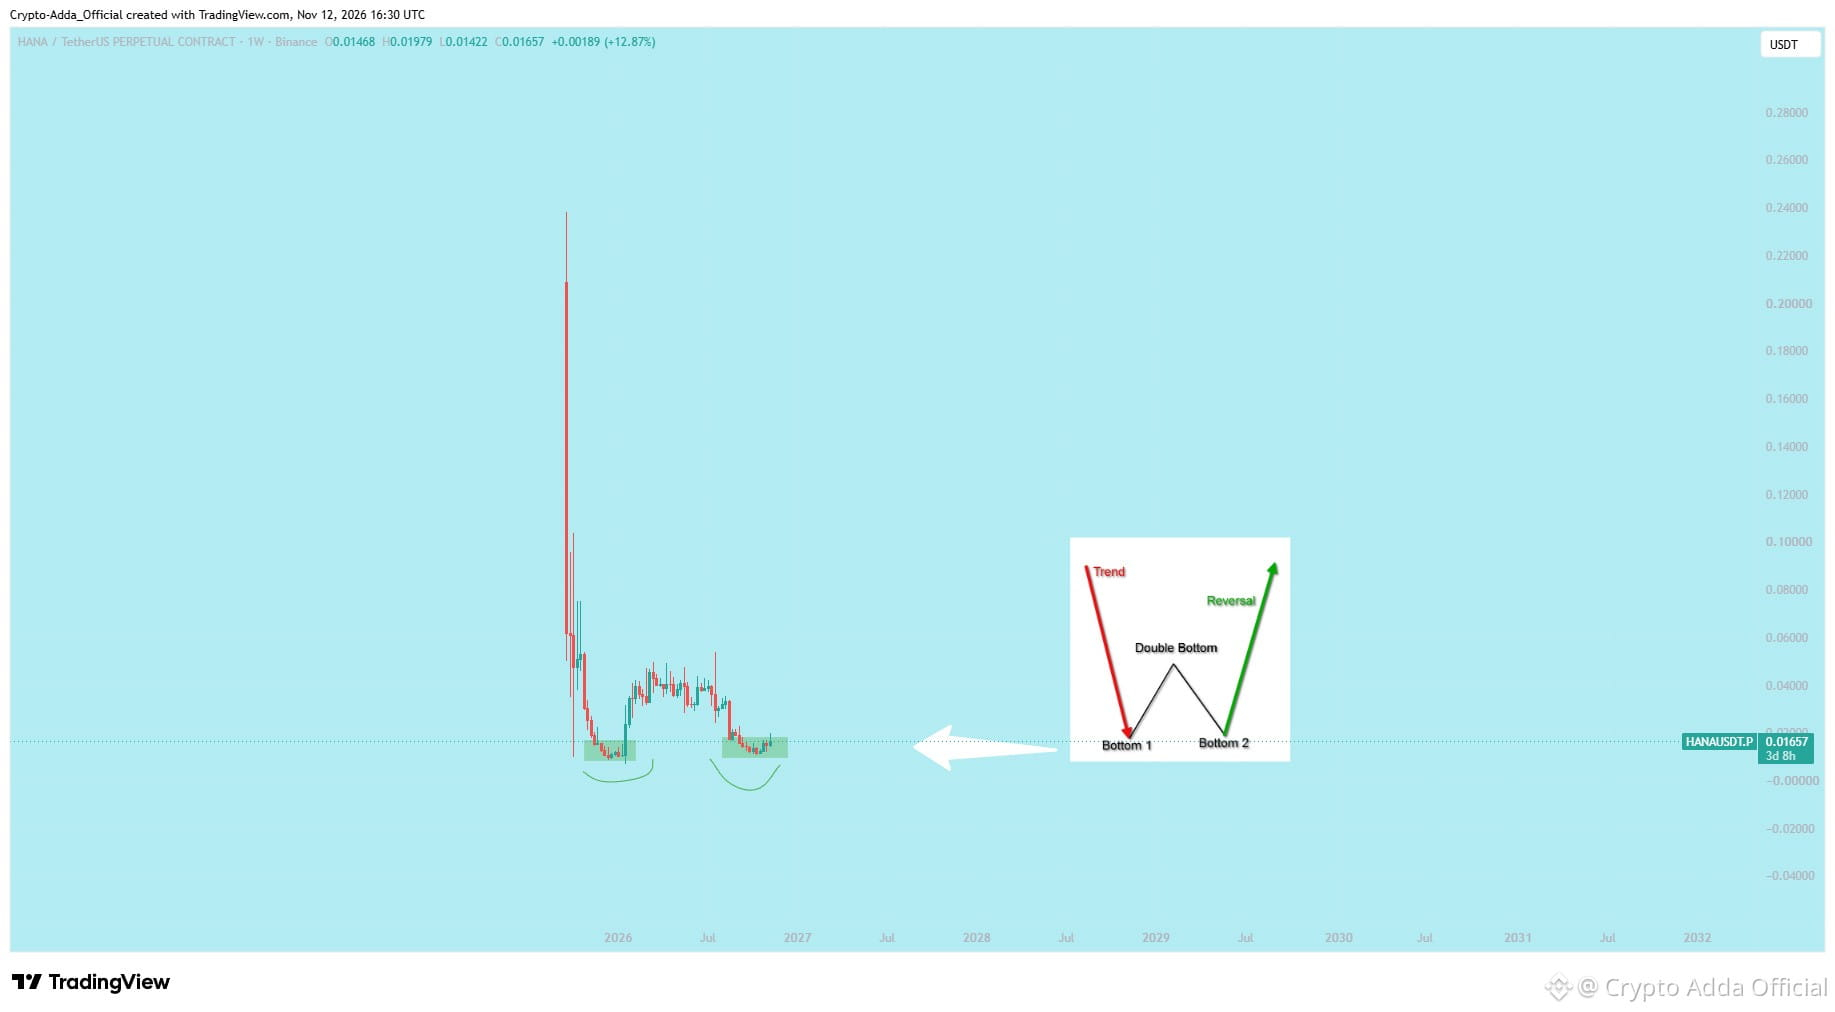
/USDT weekly chart update! 📊 Price is forming a textbook Double Bottom structure right inside a major demand zone at 0.014 to 0.017. 📈
• Two clean reactions at Bottom 1 and Bottom 2 showing solid buyer accumulation
• Higher timeframe momentum signaling potential trend reversal
• Holding this support zone keeps the bullish outlook intact
Patience on weekly charts pays the biggest rewards. Manage your risk properly.
🧠💎 Catch more chart breakdowns and community updates by checking my profile bio and finding me on X: BazaidRaza 🚀
$AGT $MAGMA #play #BTC #Binance
$HANA
/USDT weekly chart update! 📊 Price is forming a textbook Double Bottom structure right inside a major demand zone at 0.014 to 0.017. 📈
• Two clean reactions at Bottom 1 and Bottom 2 showing solid buyer accumulation
• Higher timeframe momentum signaling potential trend reversal
• Holding this support zone keeps the bullish outlook intact
Patience on weekly charts pays the biggest rewards. Manage your risk properly.
🧠💎 Catch more chart breakdowns and community updates by checking my profile bio and finding me on X: BazaidRaza 🚀
$AGT $MAGMA #play #BTC #Binance
/USDT weekly chart update! 📊 Price is forming a textbook Double Bottom structure right inside a major demand zone at 0.014 to 0.017. 📈
• Two clean reactions at Bottom 1 and Bottom 2 showing solid buyer accumulation
• Higher timeframe momentum signaling potential trend reversal
• Holding this support zone keeps the bullish outlook intact
Patience on weekly charts pays the biggest rewards. Manage your risk properly.
🧠💎 Catch more chart breakdowns and community updates by checking my profile bio and finding me on X: BazaidRaza 🚀
$AGT $MAGMA #play #BTC #Binance
1
613
·
--
Bullisch
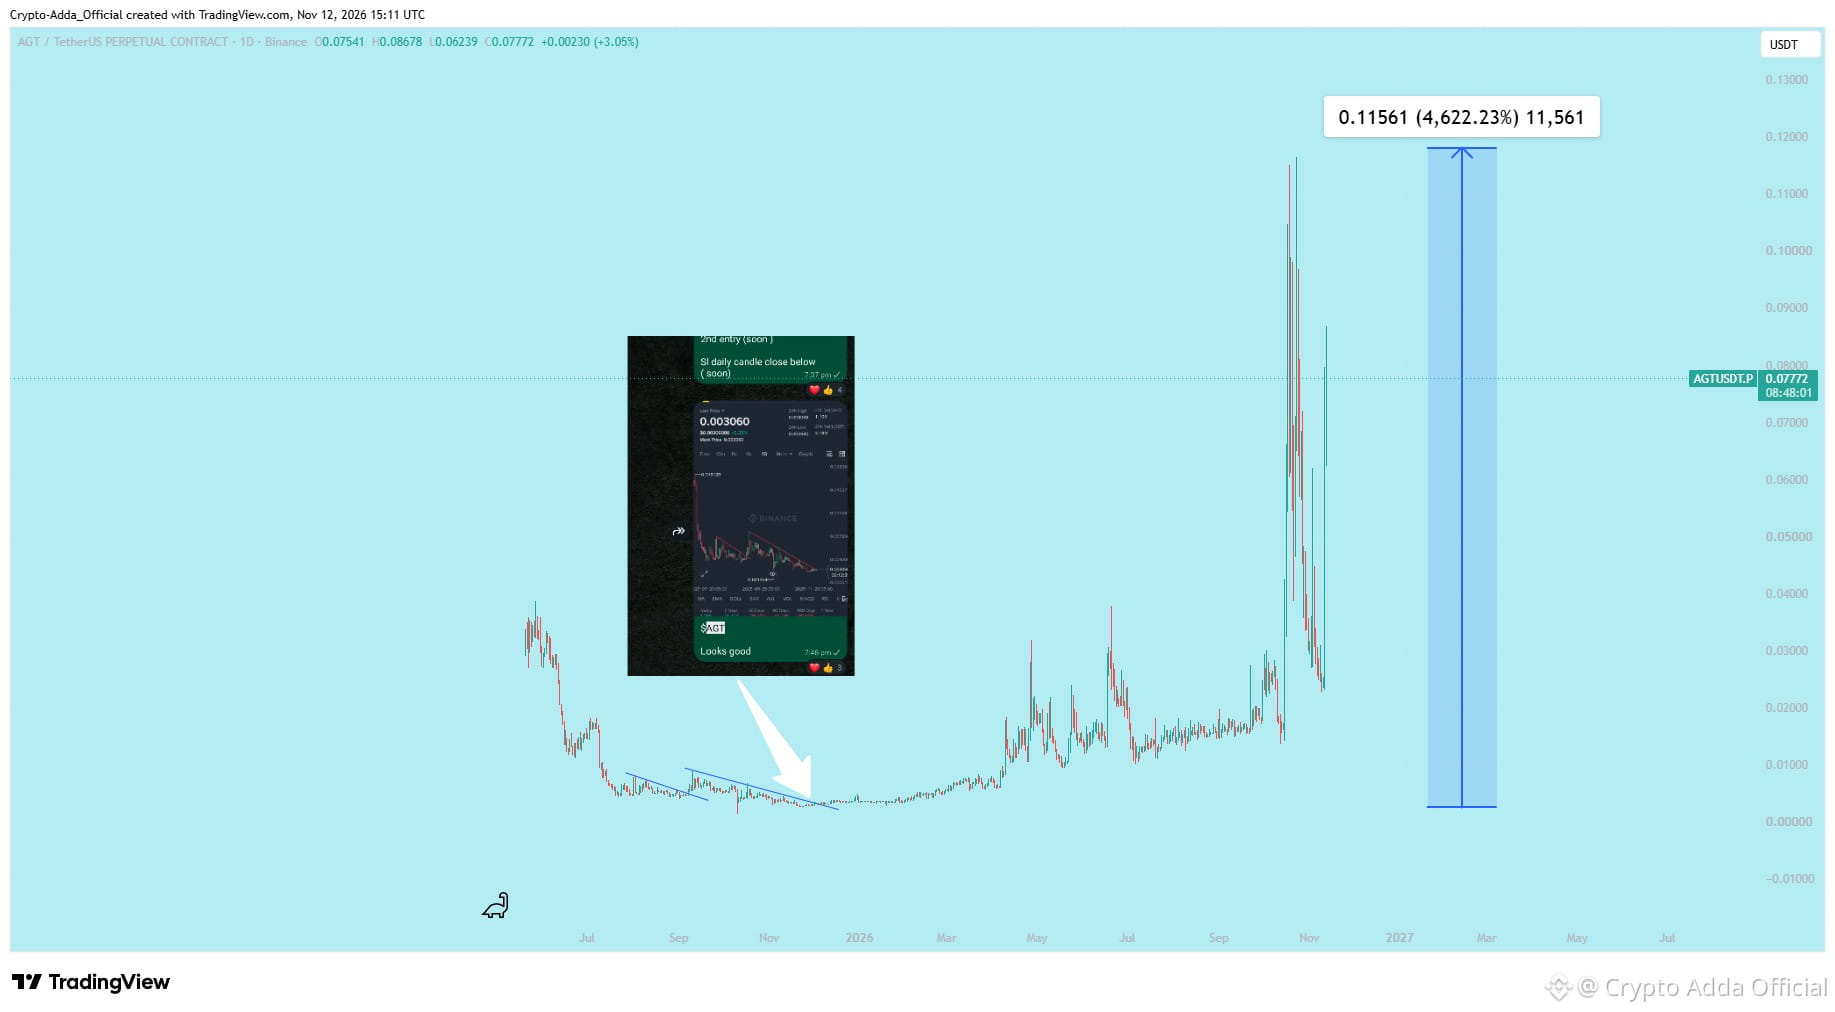
„Das ist einfach Glück.“ — Bis es zum 10. Mal passiert. 🚨📈
+4.622 % bei $AGT . Ausschließlich aus unserer Call-Zone. Glück wiederholt sich nicht so zuverlässig.
Meistere Positionsgrößen, Money-Management und Trade-Management.
Ein einziger Trade kann dein Leben verändern, wenn du weißt, wie du ihn hältst. 🔥
#AGT #Crypto #CryptoTrading #Altcoins #Binance
„Das ist einfach Glück.“ — Bis es zum 10. Mal passiert. 🚨📈
+4.622 % bei $AGT . Ausschließlich aus unserer Call-Zone. Glück wiederholt sich nicht so zuverlässig.
Meistere Positionsgrößen, Money-Management und Trade-Management.
Ein einziger Trade kann dein Leben verändern, wenn du weißt, wie du ihn hältst. 🔥
#AGT #Crypto #CryptoTrading #Altcoins #Binance
+4.622 % bei $AGT . Ausschließlich aus unserer Call-Zone. Glück wiederholt sich nicht so zuverlässig.
Meistere Positionsgrößen, Money-Management und Trade-Management.
Ein einziger Trade kann dein Leben verändern, wenn du weißt, wie du ihn hältst. 🔥
#AGT #Crypto #CryptoTrading #Altcoins #Binance
9
4
2.6k
·
--
Bullisch
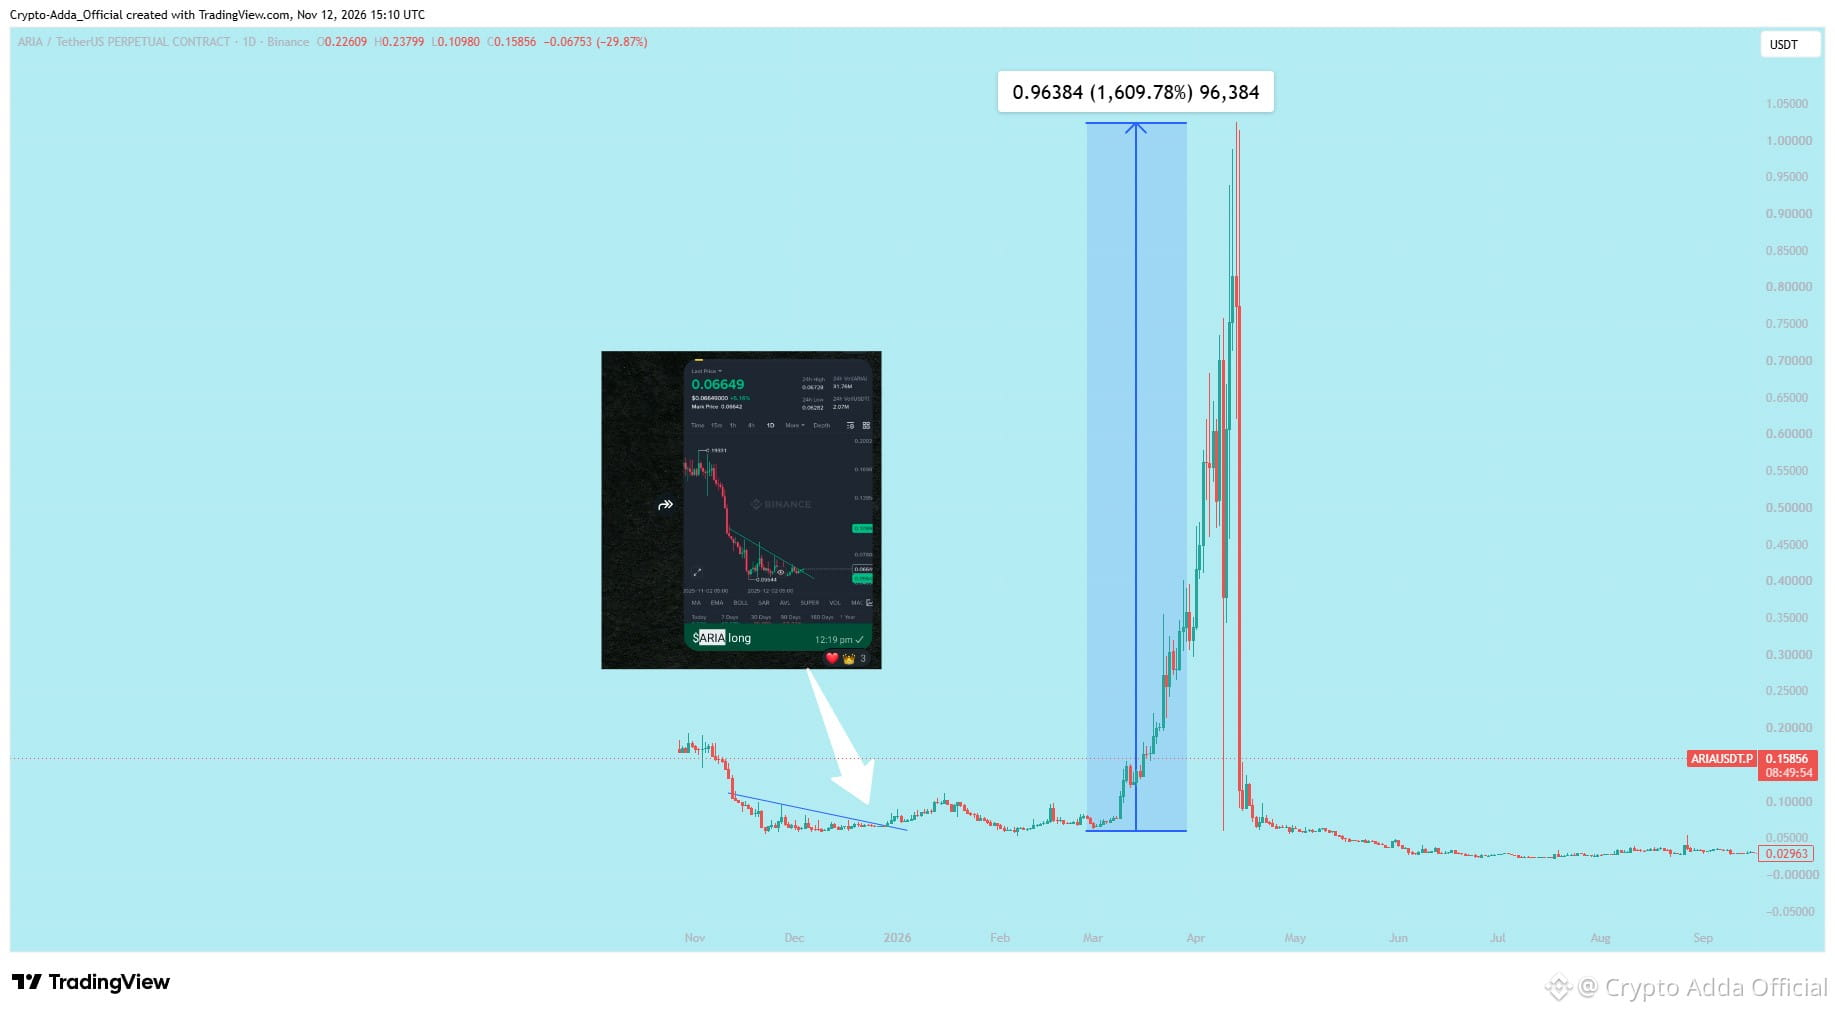
Ein einziger Trade kann dein Leben verändern – wenn du dich nicht zu früh aus dem Markt schütteln lässt. 🚨📈
+1.609 % auf $ARIA ausschließlich im Spot-Handel. Stell dir das mit 10-facher Hebelwirkung vor. 🔥
Meistere diese 3 Bereiche:
• Positionsgröße
• Geldmanagement
• Trade-Management
#Crypto #Bitcoin #Altcoins #ARİA #Binance
Ein einziger Trade kann dein Leben verändern – wenn du dich nicht zu früh aus dem Markt schütteln lässt. 🚨📈
+1.609 % auf $ARIA ausschließlich im Spot-Handel. Stell dir das mit 10-facher Hebelwirkung vor. 🔥
Meistere diese 3 Bereiche:
• Positionsgröße
• Geldmanagement
• Trade-Management
#Crypto #Bitcoin #Altcoins #ARİA #Binance
+1.609 % auf $ARIA ausschließlich im Spot-Handel. Stell dir das mit 10-facher Hebelwirkung vor. 🔥
Meistere diese 3 Bereiche:
• Positionsgröße
• Geldmanagement
• Trade-Management
#Crypto #Bitcoin #Altcoins #ARİA #Binance
1
461
·
--
Bullisch
$BTC
{spot}(BTCUSDT)
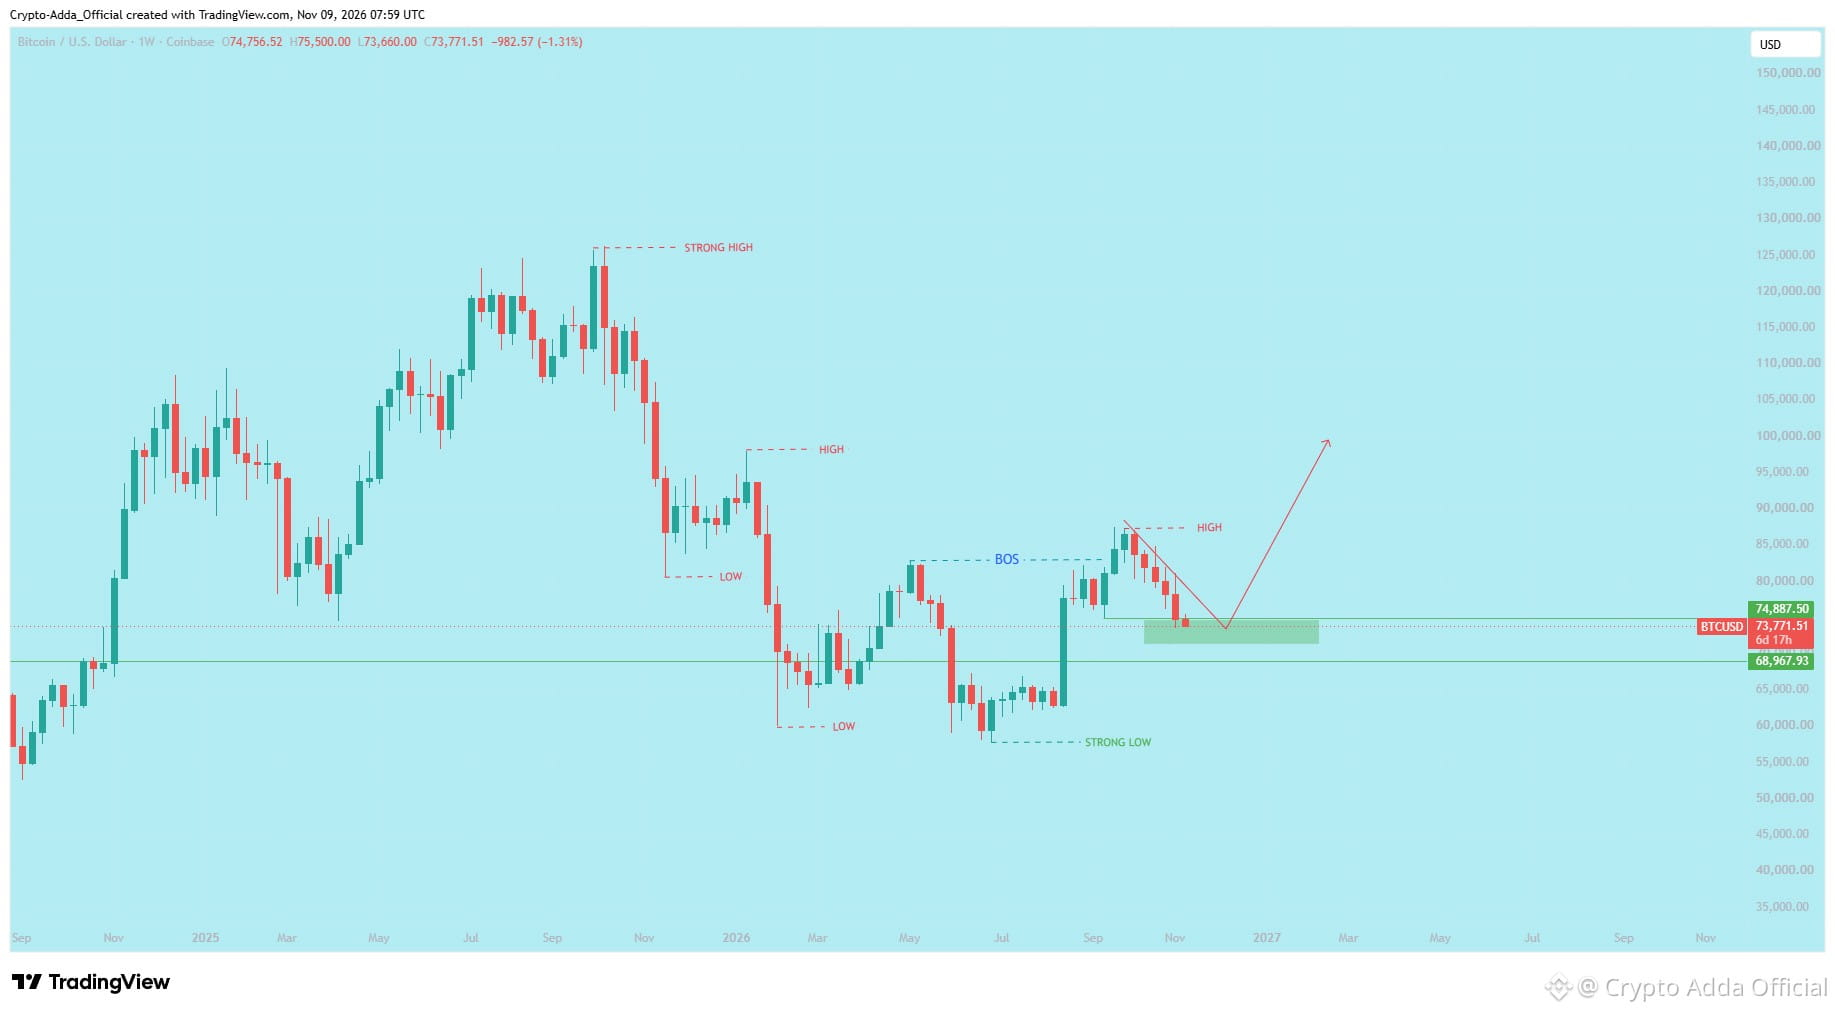
AKTUALISIERUNG DER MAKRO-MARKTSTRUKTUR (1W) 📊
Hier ist eine rein technische Analyse der aktuellen Marktstruktur im Wochenzeitrahmen:
🔹 **Wichtiges Tief etabliert**
• Der Markt verteidigte die entscheidende Nachfragebasis bei **$58,000 – $60,000** und bestätigte damit ein validiertes makroökonomisches „starkes Tief“, gestützt durch starke institutionelle Absorption.
🔹 **Strukturbruch (BOS)**
• Der klare Anstieg über das vorherige wichtige Swing-Hoch (~$83,000) löste einen mustergültigen wöchentlichen **Strukturbruch (BOS)** aus und leitete damit eine strukturelle Rückkehr zu höheren Hochs ein.
🔹 **Korrektiver Retest (aktuelle Phase)**
• Nach dem lokalen Hoch über $88,000 stellt der aktuelle Rücksetzer einen kontrollierten, korrektiven Rücklauf dar und keine impulsive Distribution.
• Der Kurs testet derzeit aktiv den früheren Widerstand, der nun als Unterstützung dient, beziehungsweise die primäre wöchentliche Nachfragezone bei **$70,000 – $74,800**.
🔹 **Makro-Trend**
• Die Struktur deutet auf die Ausbildung eines makroökonomisch **höheren Tiefs** hin.
• Solange diese primäre Nachfragezone ($70,000 – $74,800) auf Wochenschlussbasis hält, bleibt die Aufwärtssequenz technisch intakt. Die psychologisch wichtige Zone oberhalb von $100K bildet den natürlichen Weg für die nächste makroökonomische Expansion.
*Reine Analyse der Marktstruktur – mit Blick auf die Kursentwicklung im höheren Zeitrahmen.* 🧠✨ #bitcoin #eth
$BTC
AKTUALISIERUNG DER MAKRO-MARKTSTRUKTUR (1W) 📊
Hier ist eine rein technische Analyse der aktuellen Marktstruktur im Wochenzeitrahmen:
🔹 **Wichtiges Tief etabliert**
• Der Markt verteidigte die entscheidende Nachfragebasis bei **$58,000 – $60,000** und bestätigte damit ein validiertes makroökonomisches „starkes Tief“, gestützt durch starke institutionelle Absorption.
🔹 **Strukturbruch (BOS)**
• Der klare Anstieg über das vorherige wichtige Swing-Hoch (~$83,000) löste einen mustergültigen wöchentlichen **Strukturbruch (BOS)** aus und leitete damit eine strukturelle Rückkehr zu höheren Hochs ein.
🔹 **Korrektiver Retest (aktuelle Phase)**
• Nach dem lokalen Hoch über $88,000 stellt der aktuelle Rücksetzer einen kontrollierten, korrektiven Rücklauf dar und keine impulsive Distribution.
• Der Kurs testet derzeit aktiv den früheren Widerstand, der nun als Unterstützung dient, beziehungsweise die primäre wöchentliche Nachfragezone bei **$70,000 – $74,800**.
🔹 **Makro-Trend**
• Die Struktur deutet auf die Ausbildung eines makroökonomisch **höheren Tiefs** hin.
• Solange diese primäre Nachfragezone ($70,000 – $74,800) auf Wochenschlussbasis hält, bleibt die Aufwärtssequenz technisch intakt. Die psychologisch wichtige Zone oberhalb von $100K bildet den natürlichen Weg für die nächste makroökonomische Expansion.
*Reine Analyse der Marktstruktur – mit Blick auf die Kursentwicklung im höheren Zeitrahmen.* 🧠✨ #bitcoin #eth
AKTUALISIERUNG DER MAKRO-MARKTSTRUKTUR (1W) 📊
Hier ist eine rein technische Analyse der aktuellen Marktstruktur im Wochenzeitrahmen:
🔹 **Wichtiges Tief etabliert**
• Der Markt verteidigte die entscheidende Nachfragebasis bei **$58,000 – $60,000** und bestätigte damit ein validiertes makroökonomisches „starkes Tief“, gestützt durch starke institutionelle Absorption.
🔹 **Strukturbruch (BOS)**
• Der klare Anstieg über das vorherige wichtige Swing-Hoch (~$83,000) löste einen mustergültigen wöchentlichen **Strukturbruch (BOS)** aus und leitete damit eine strukturelle Rückkehr zu höheren Hochs ein.
🔹 **Korrektiver Retest (aktuelle Phase)**
• Nach dem lokalen Hoch über $88,000 stellt der aktuelle Rücksetzer einen kontrollierten, korrektiven Rücklauf dar und keine impulsive Distribution.
• Der Kurs testet derzeit aktiv den früheren Widerstand, der nun als Unterstützung dient, beziehungsweise die primäre wöchentliche Nachfragezone bei **$70,000 – $74,800**.
🔹 **Makro-Trend**
• Die Struktur deutet auf die Ausbildung eines makroökonomisch **höheren Tiefs** hin.
• Solange diese primäre Nachfragezone ($70,000 – $74,800) auf Wochenschlussbasis hält, bleibt die Aufwärtssequenz technisch intakt. Die psychologisch wichtige Zone oberhalb von $100K bildet den natürlichen Weg für die nächste makroökonomische Expansion.
*Reine Analyse der Marktstruktur – mit Blick auf die Kursentwicklung im höheren Zeitrahmen.* 🧠✨ #bitcoin #eth
61
·
--
Bullisch
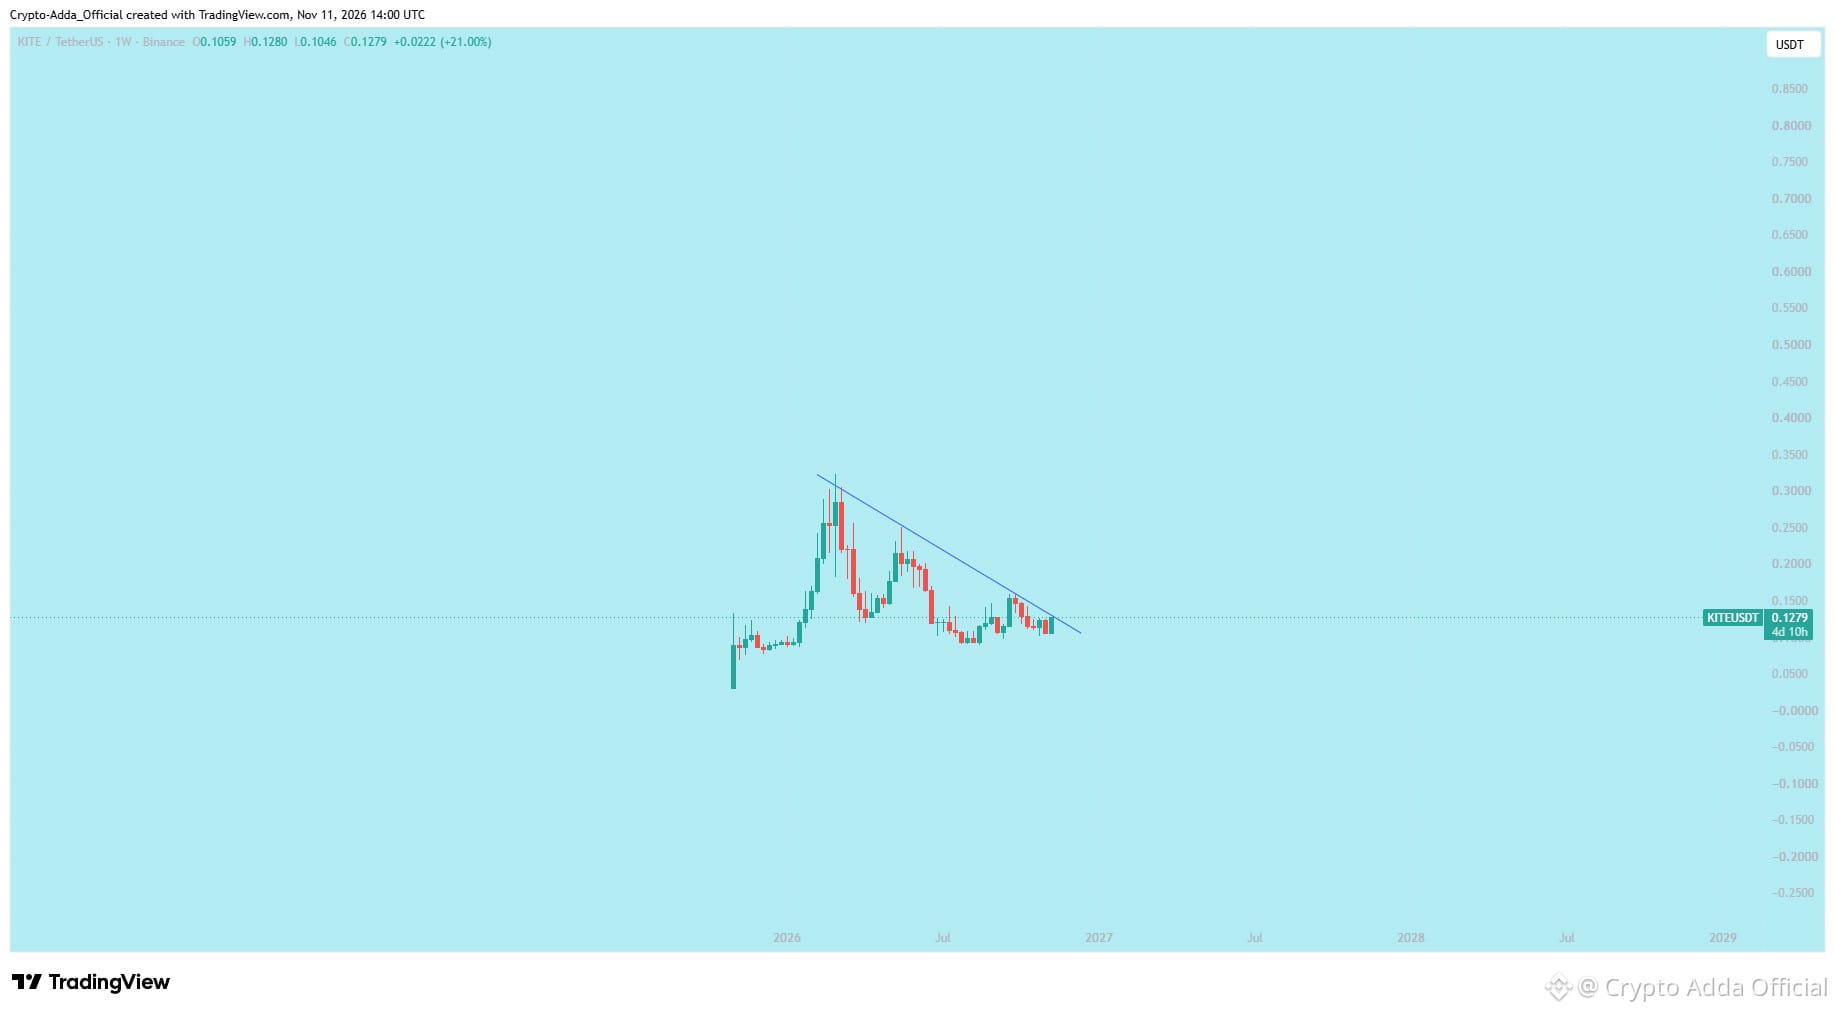
$KITE Ausbruch über die abwärts gerichtete Widerstandstrendlinie im 1W-Zeitrahmen
#BTC #ETH #KİTE #CRYPTO #TradFiForBeginners
$KITE Ausbruch über die abwärts gerichtete Widerstandstrendlinie im 1W-Zeitrahmen
#BTC #ETH #KİTE #CRYPTO #TradFiForBeginners
#BTC #ETH #KİTE #CRYPTO #TradFiForBeginners
135
·
--
Bullisch
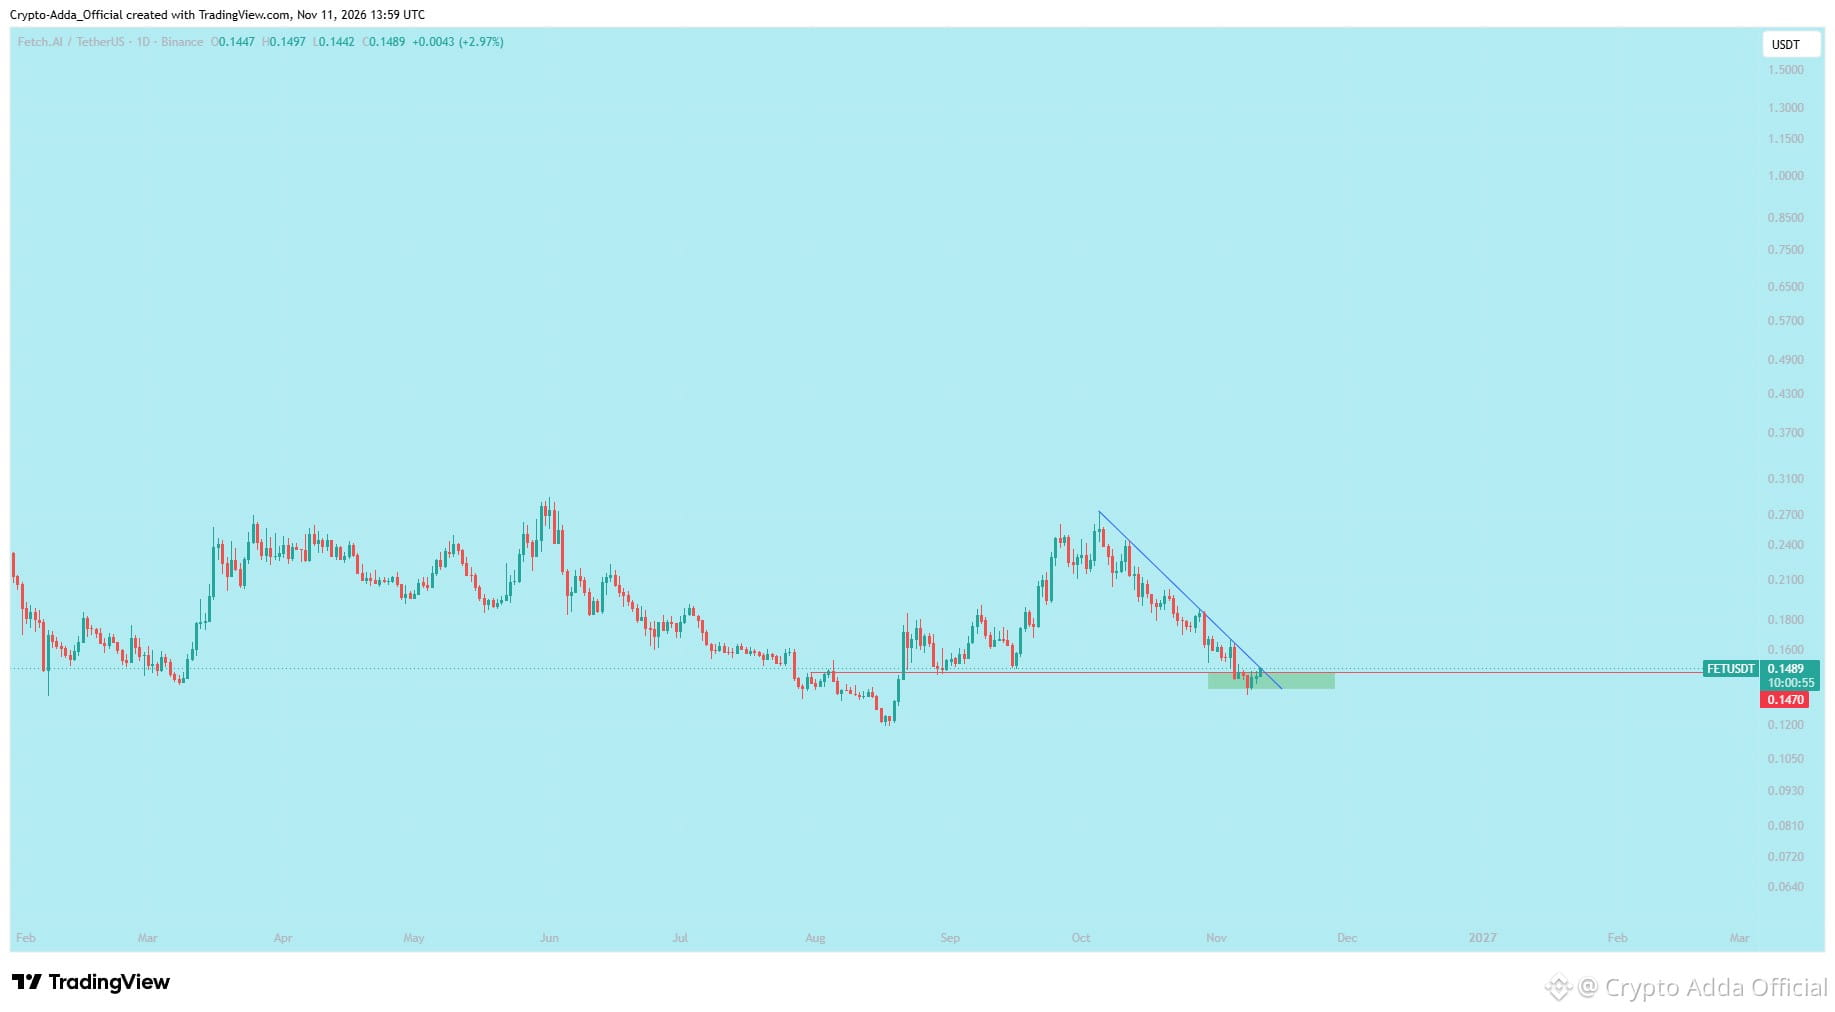
$FET: Zusammenlauf wichtiger Unterstützungen & Ausbruch über die fallende Trendlinie im Blick
#BTC☀️ #ETH #cryptooinsigts
$FET: Zusammenlauf wichtiger Unterstützungen & Ausbruch über die fallende Trendlinie im Blick
#BTC☀️ #ETH #cryptooinsigts
#BTC☀️ #ETH #cryptooinsigts
297
·
--
Bullisch
148
3
617
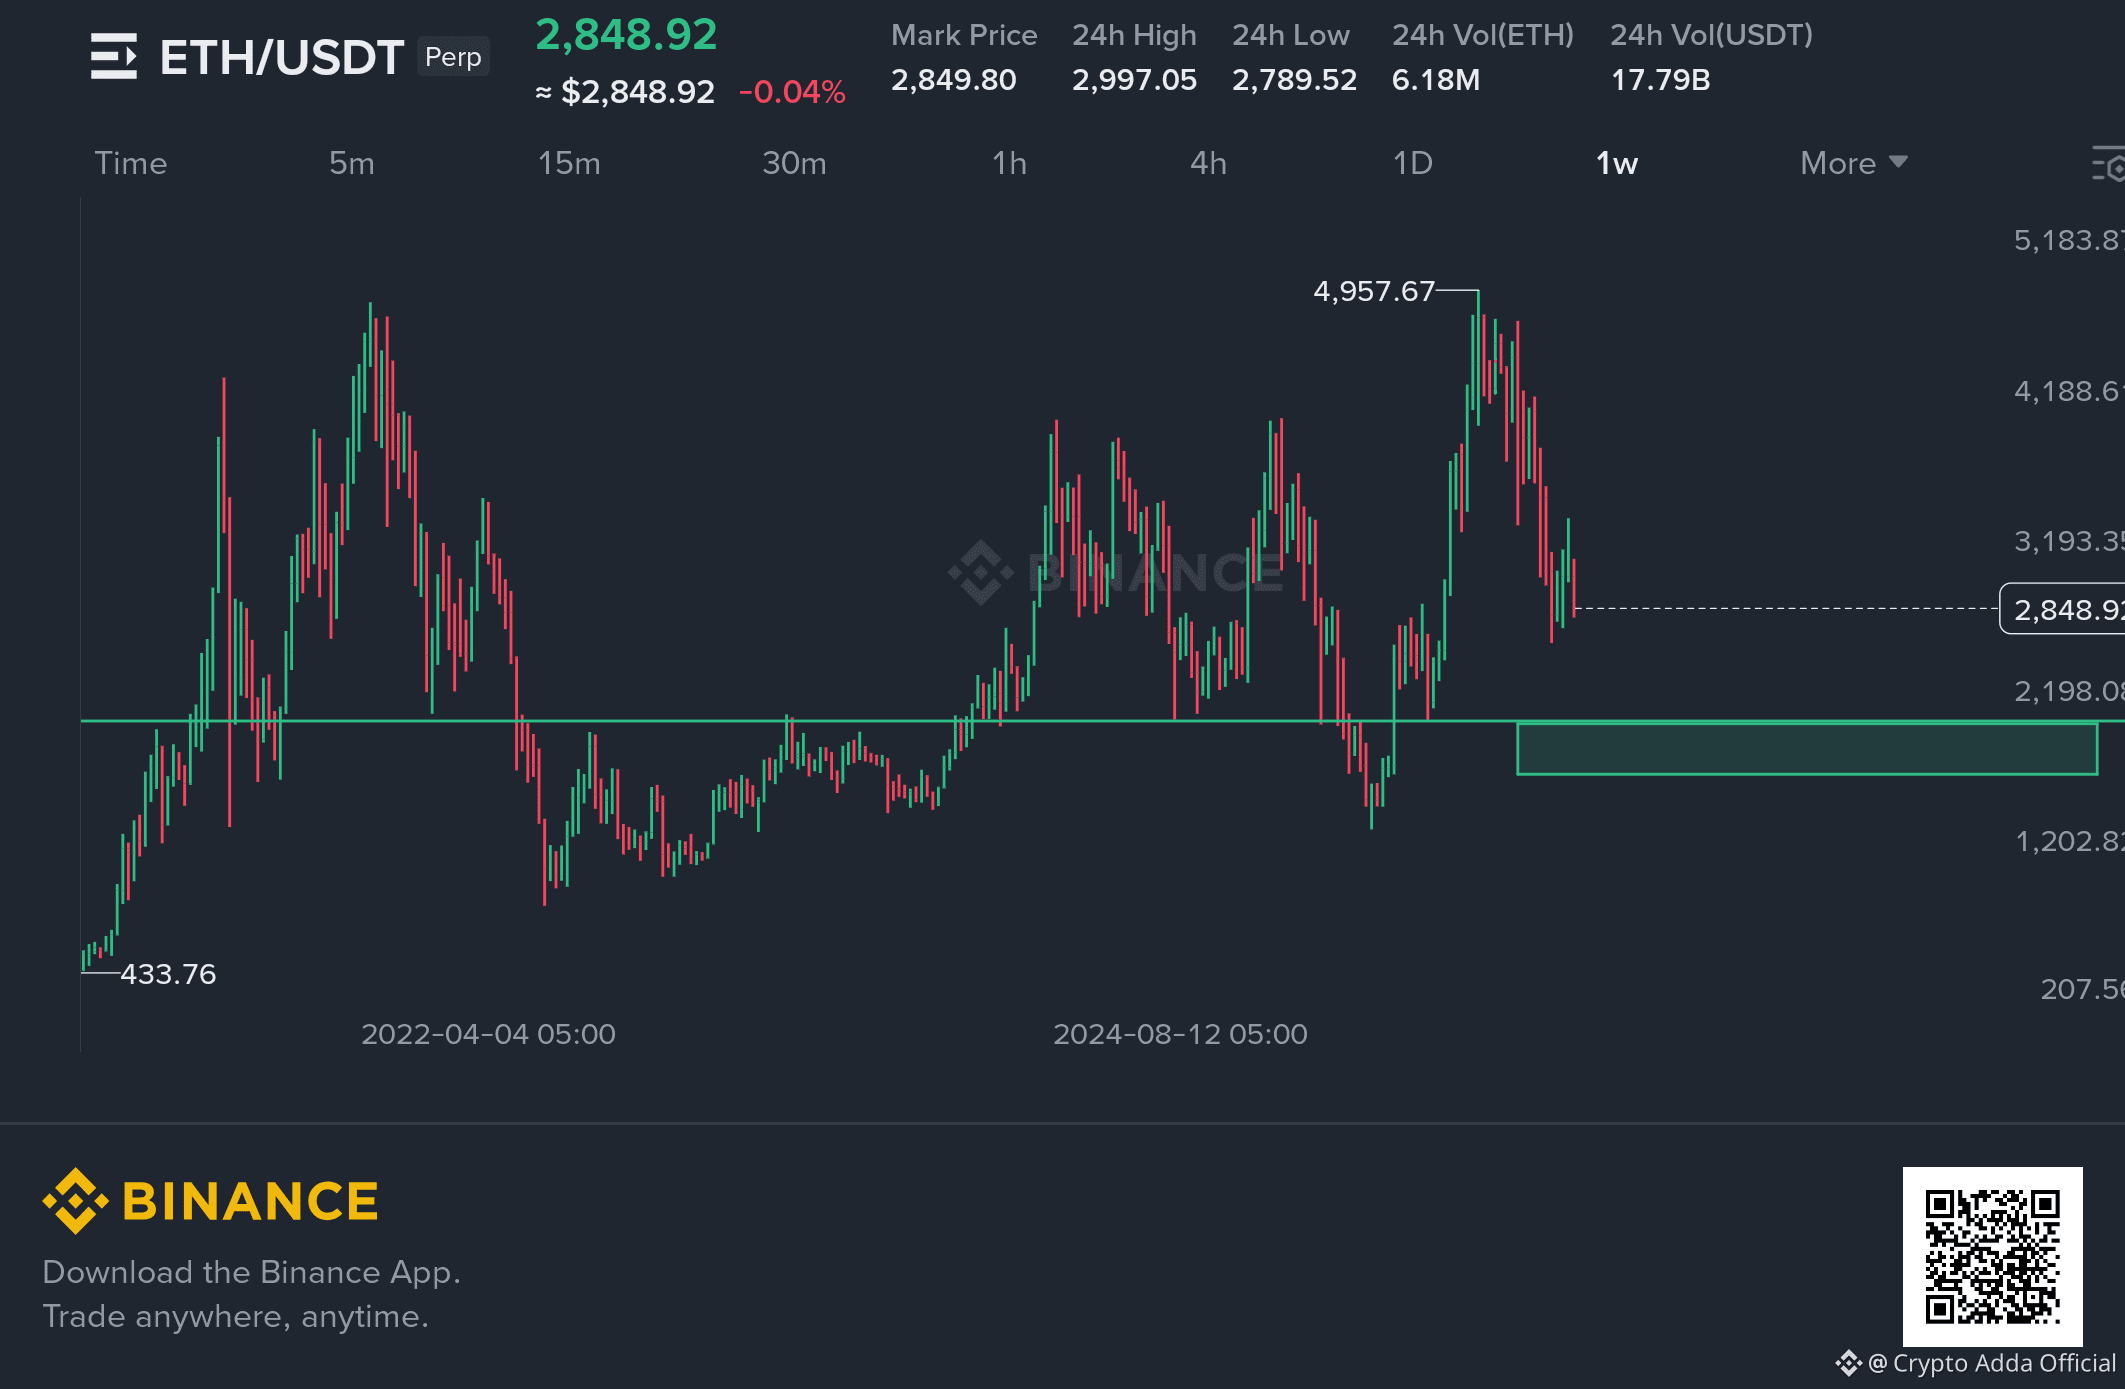
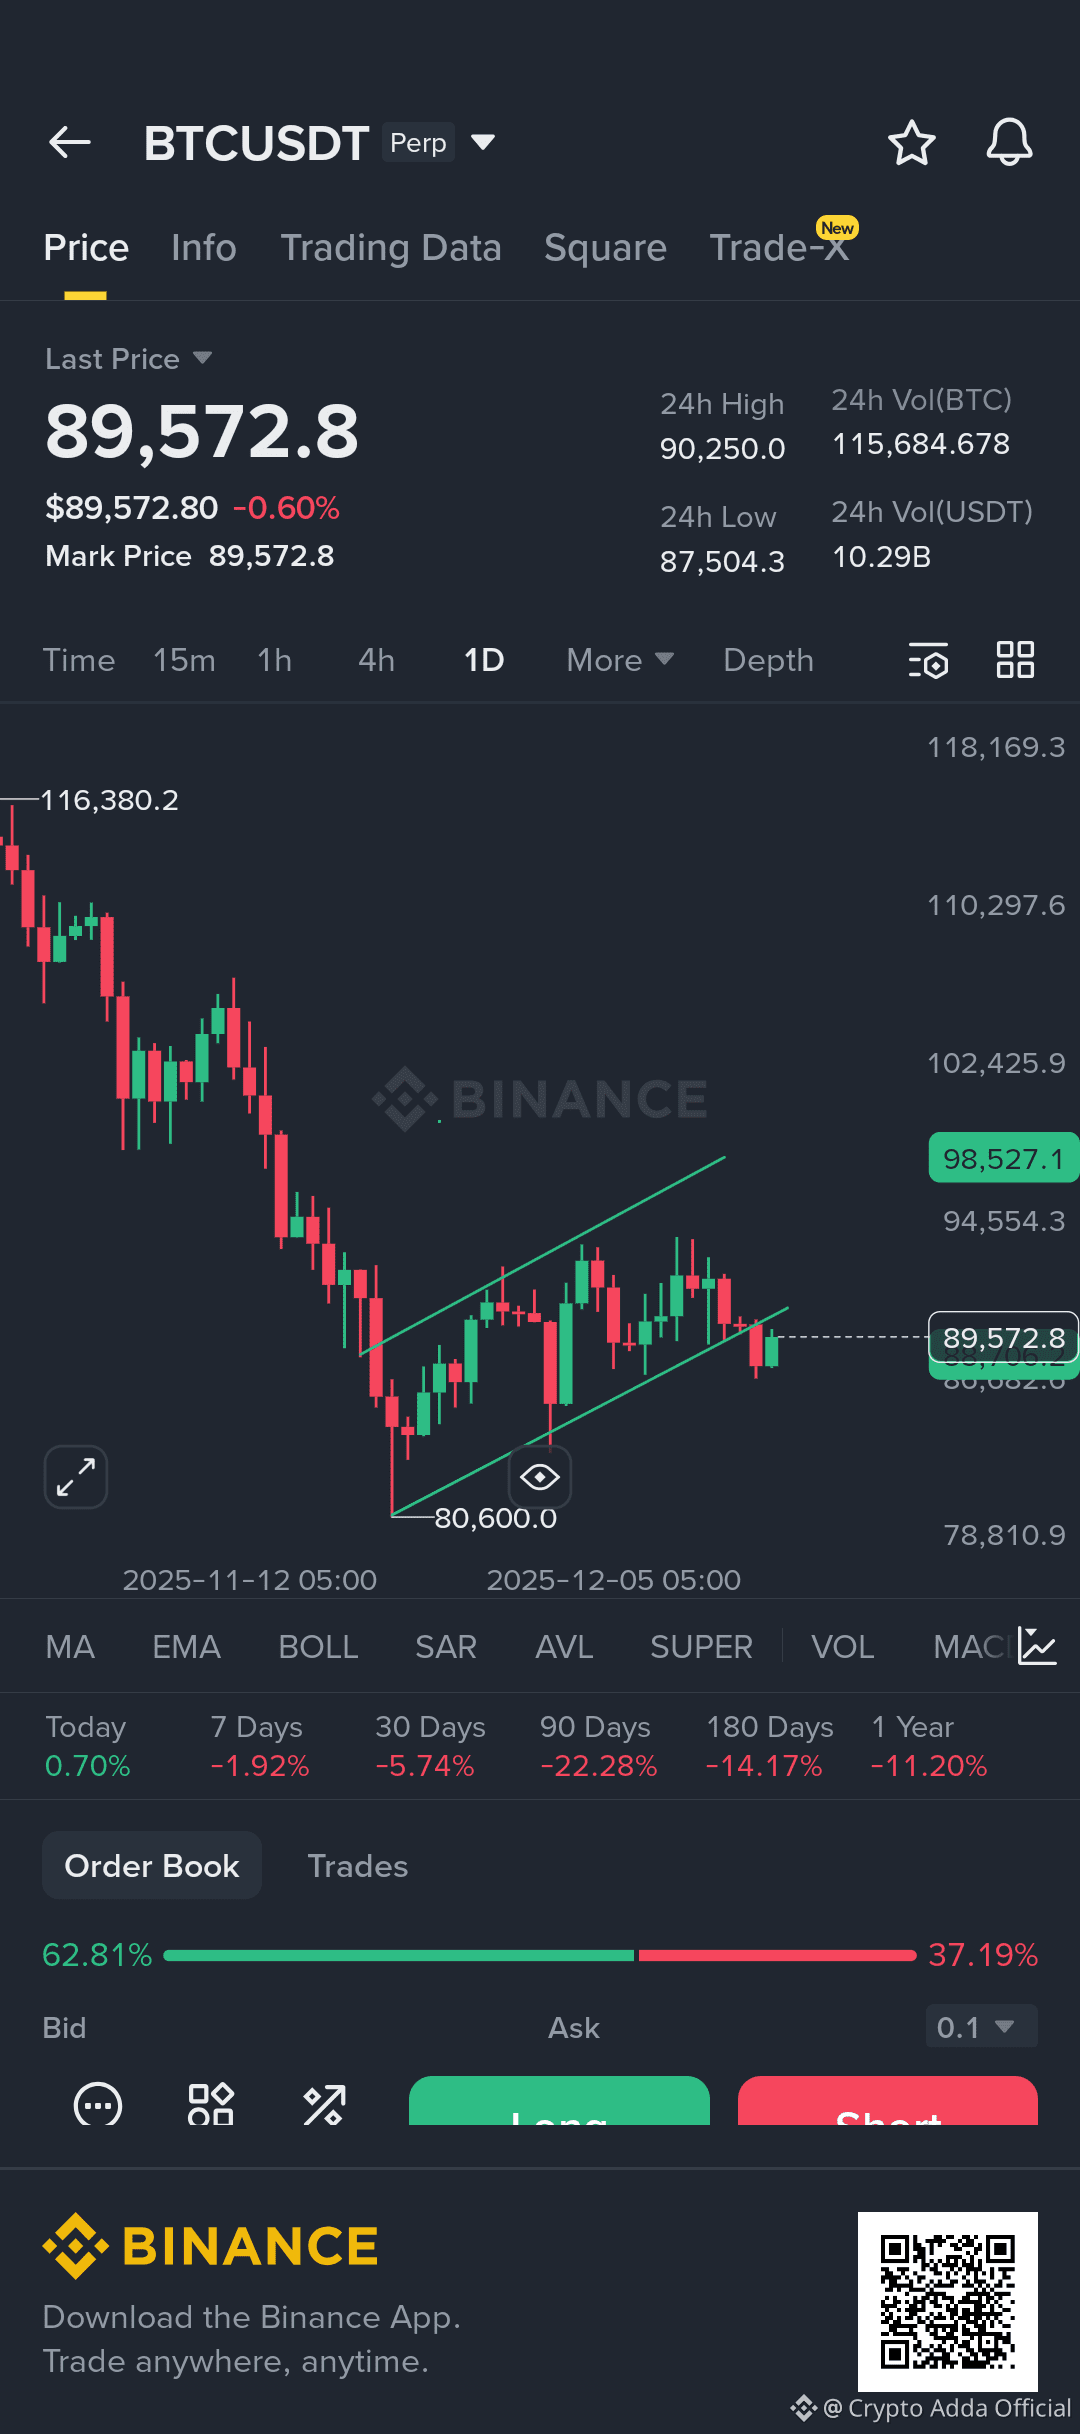
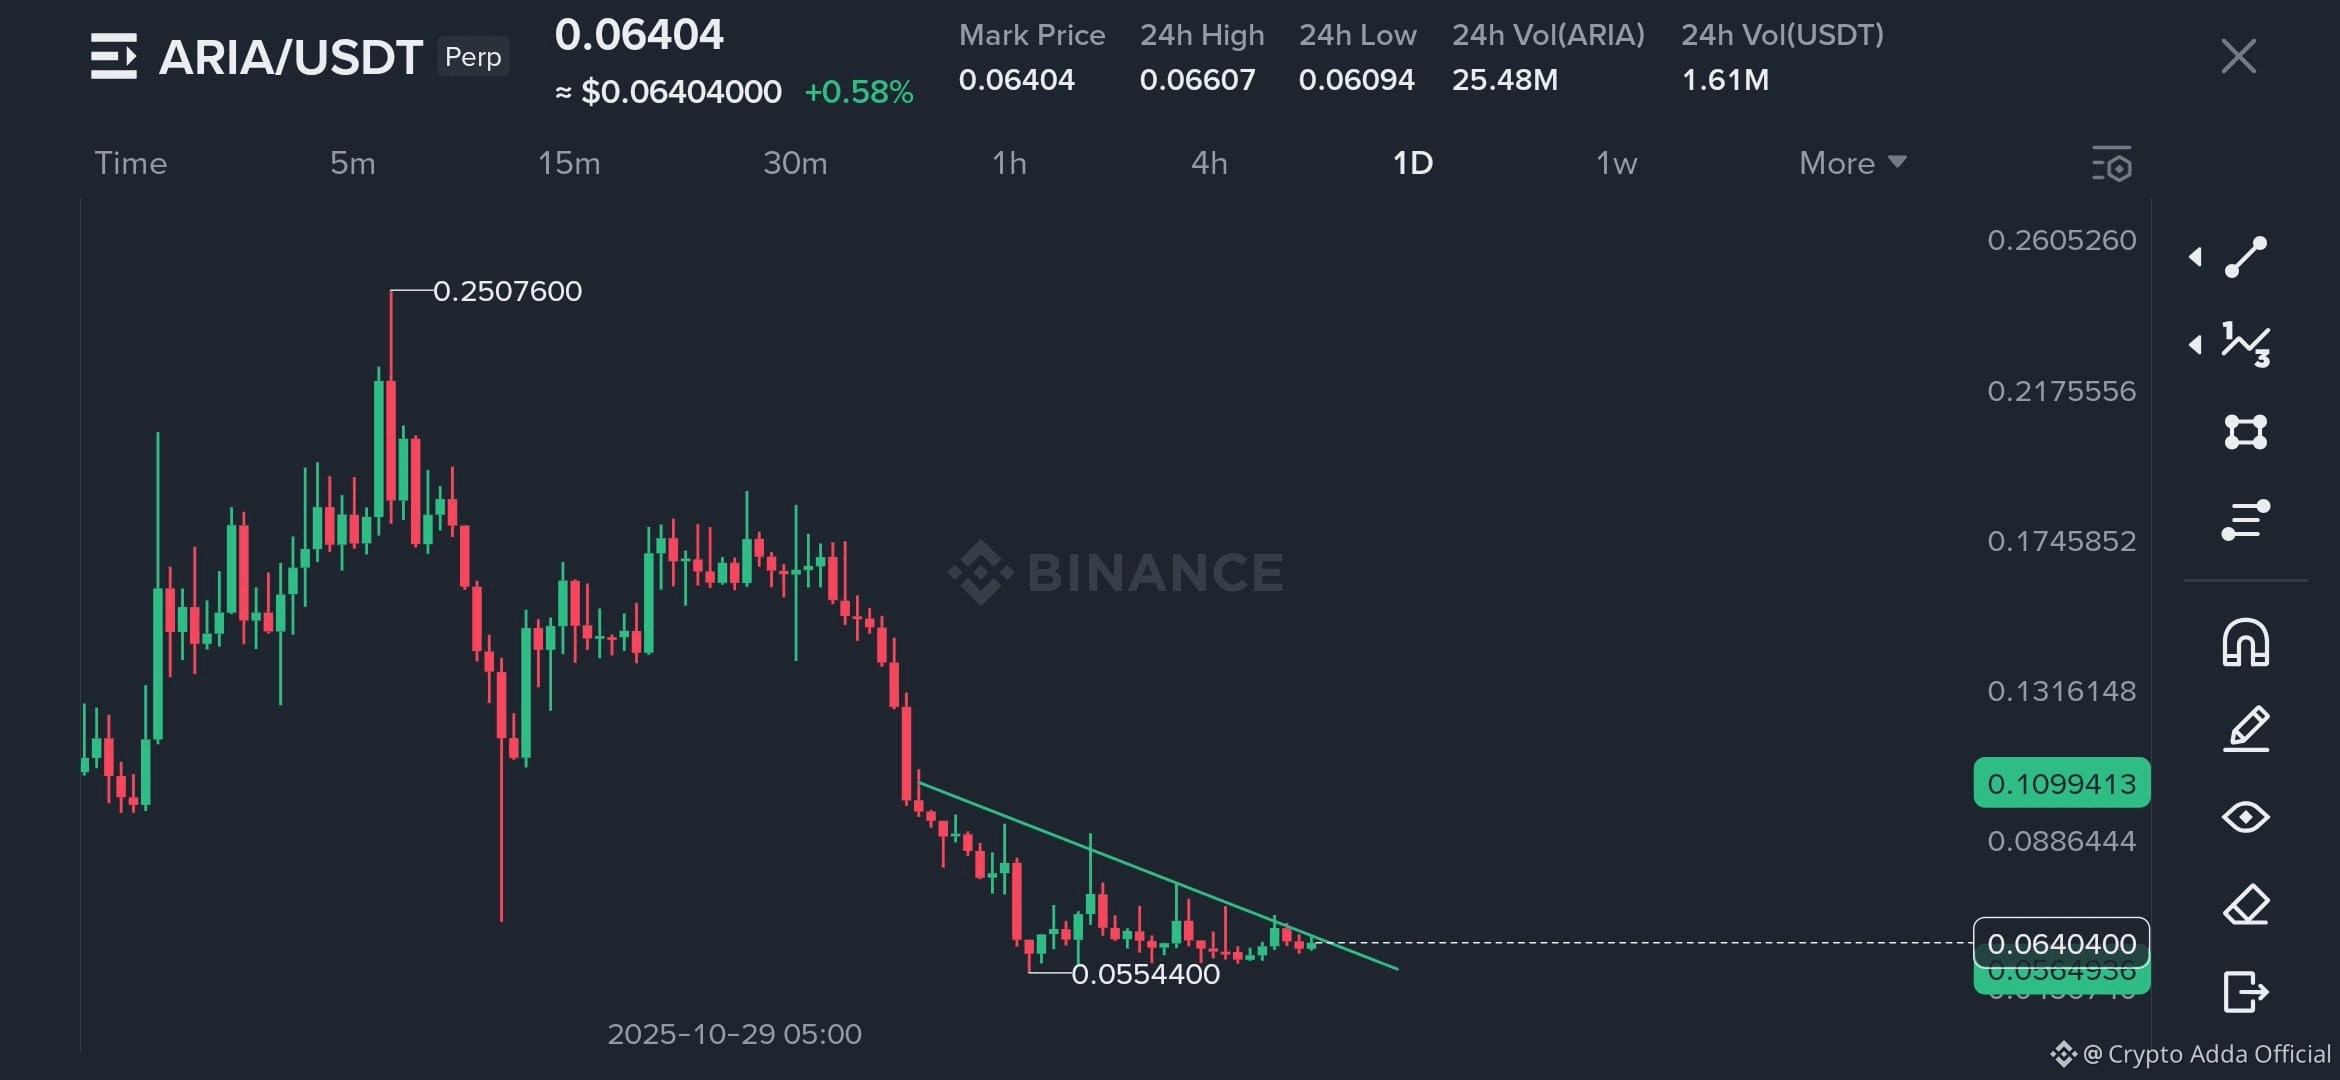
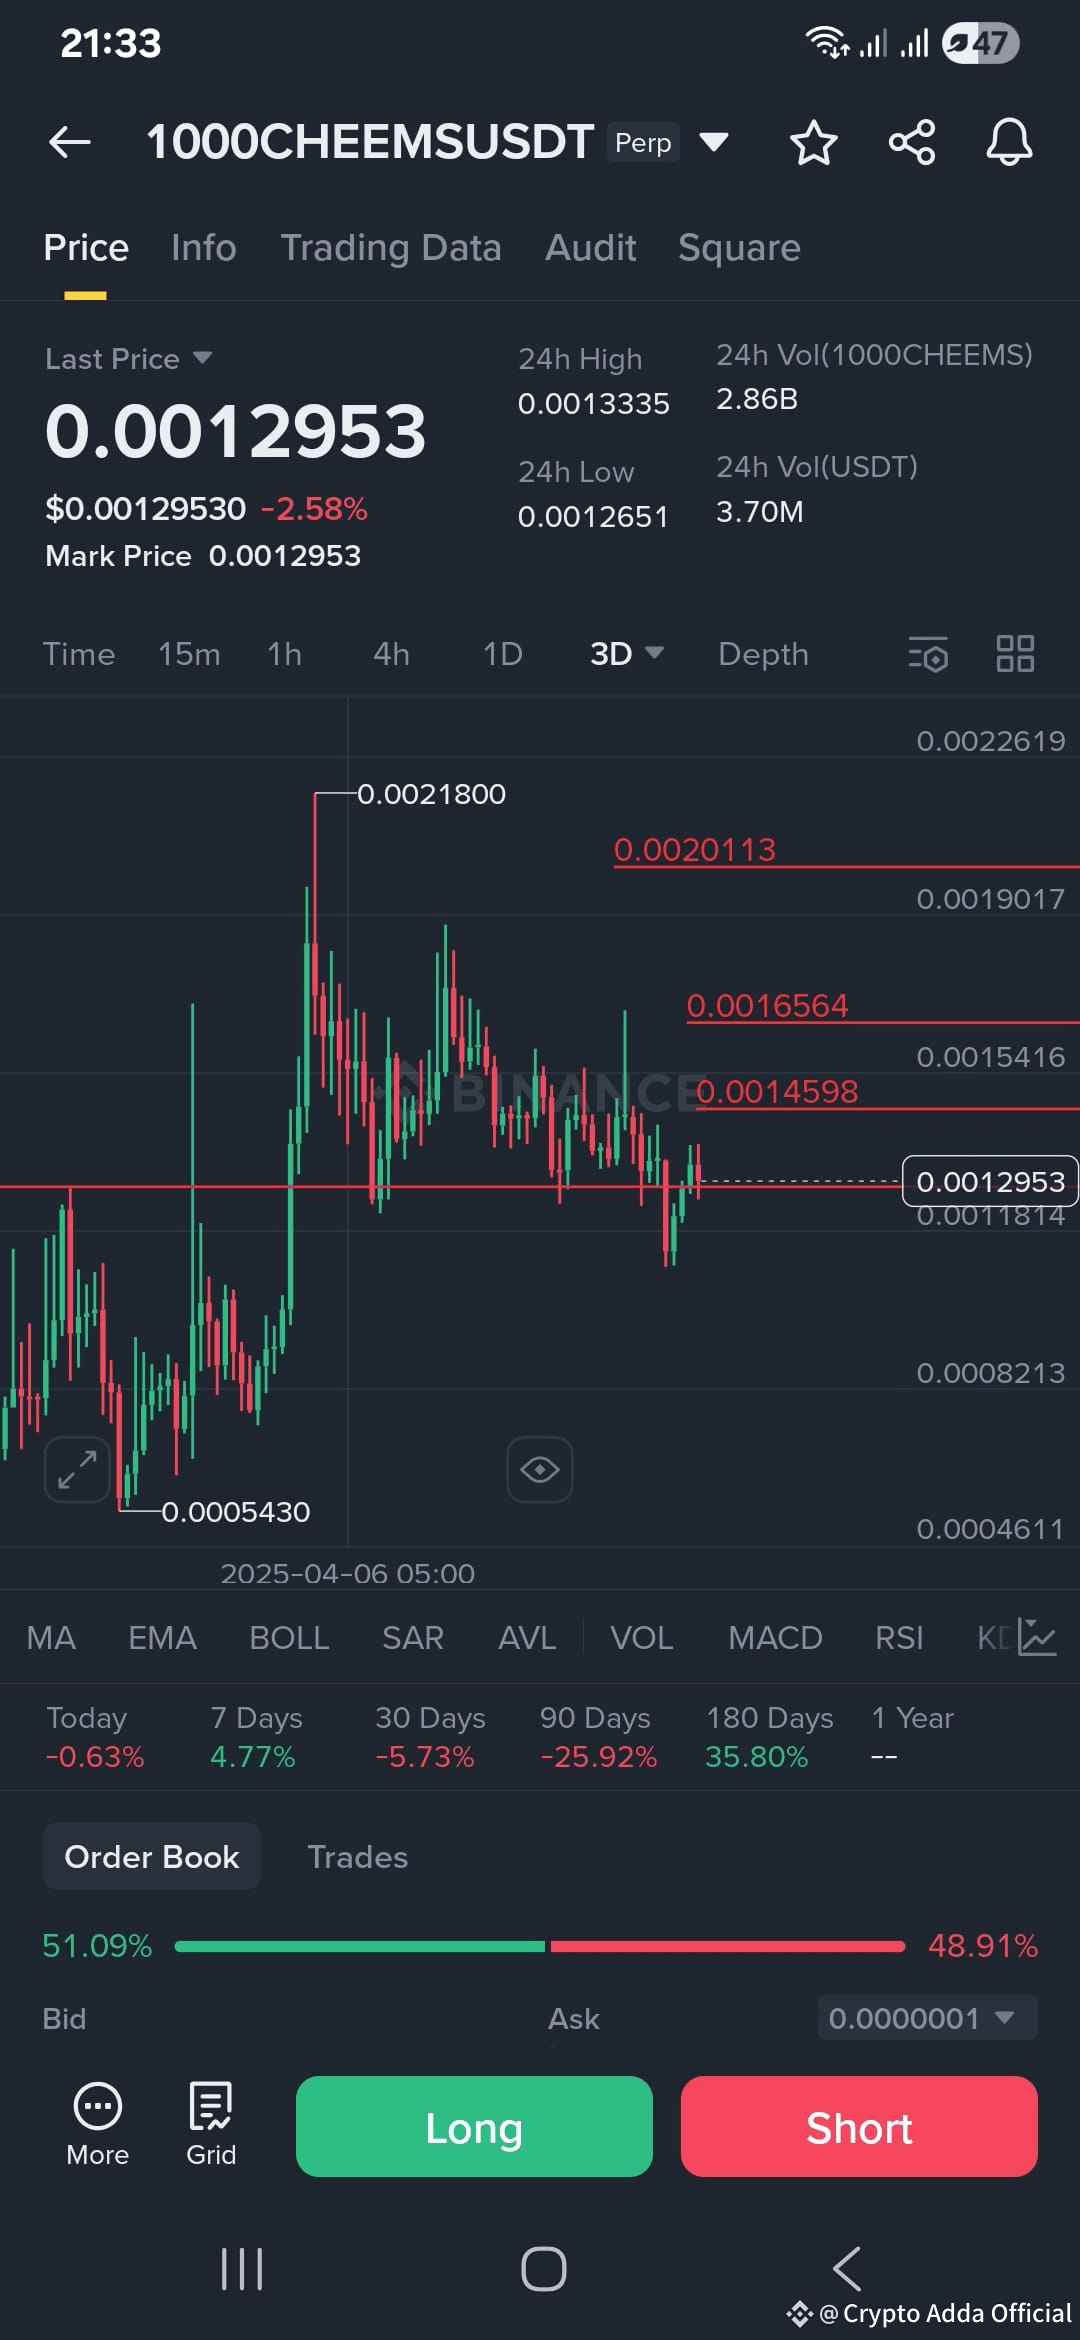
118
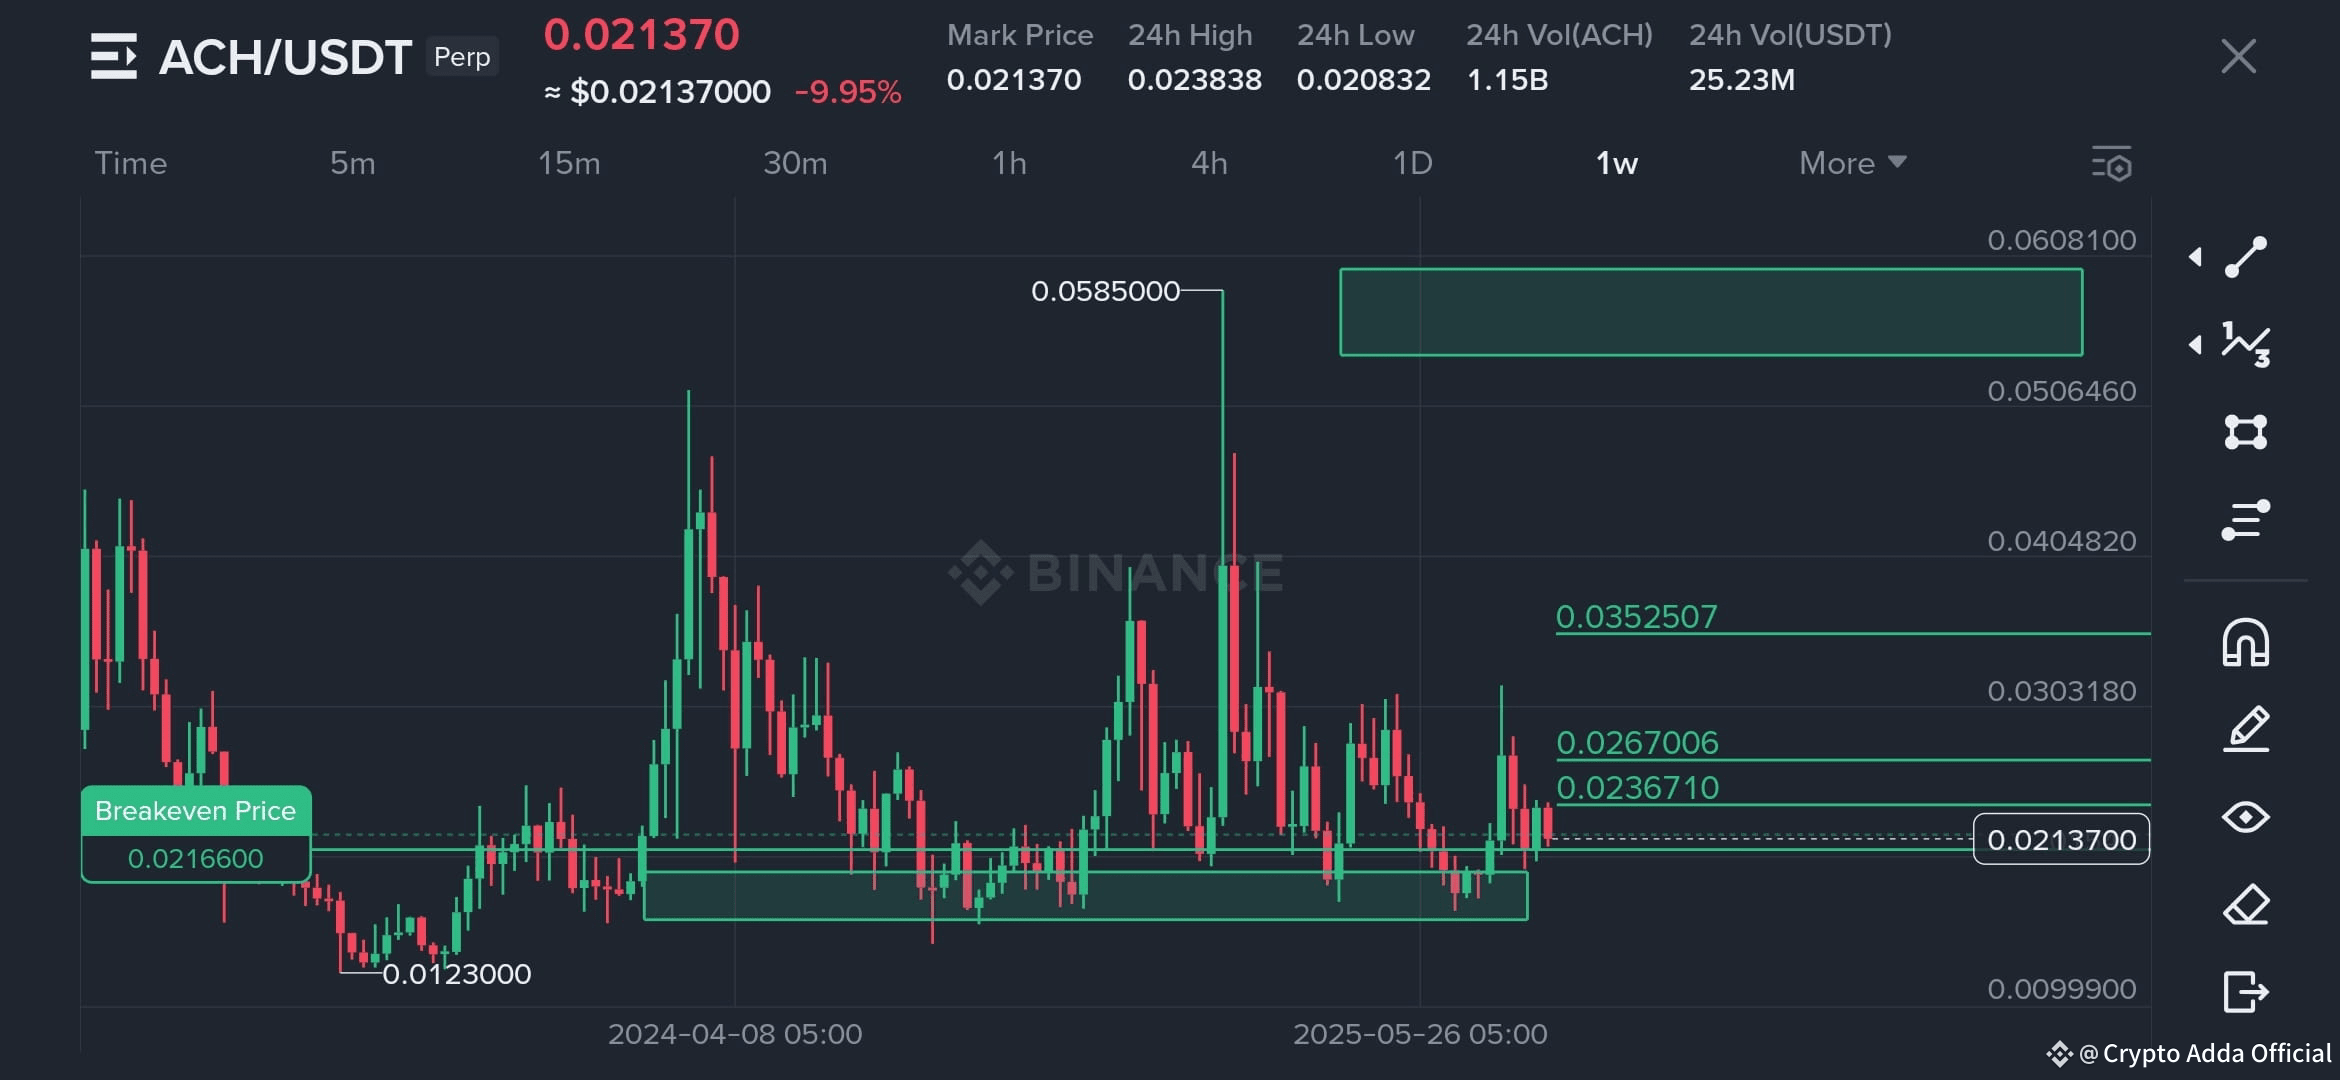
*$ACH Signal Alarm!*
*Coin:* $ACH
*Handelsart* : Swing Spot & Futures
*Einstiegspunkte:*
1. CMP Preis (Aktueller Marktpreis)
2. Zweiter Einstieg: Rund $0.02
*Ziele:*
Überprüfen Sie das Diagramm für detaillierte Ziele
*Endziel:* $0.04
#BTCBreaksATH #ETHRally #CPIWatch
*$ACH Signal Alarm!*
*Coin:* $ACH
*Handelsart* : Swing Spot & Futures
*Einstiegspunkte:*
1. CMP Preis (Aktueller Marktpreis)
2. Zweiter Einstieg: Rund $0.02
*Ziele:*
Überprüfen Sie das Diagramm für detaillierte Ziele
*Endziel:* $0.04
#BTCBreaksATH #ETHRally #CPIWatch
*Coin:* $ACH
*Handelsart* : Swing Spot & Futures
*Einstiegspunkte:*
1. CMP Preis (Aktueller Marktpreis)
2. Zweiter Einstieg: Rund $0.02
*Ziele:*
Überprüfen Sie das Diagramm für detaillierte Ziele
*Endziel:* $0.04
#BTCBreaksATH #ETHRally #CPIWatch
442


Anmelden und weiter Inhalte entdecken
Krypto-Nutzer weltweit auf Binance Square kennenlernen
⚡️ Bleib in Sachen Krypto stets am Puls.
💬 Die weltgrößte Kryptobörse vertraut darauf.
👍 Erhalte verlässliche Einblicke von verifizierten Creators.
E-Mail-Adresse/Telefonnummer
Trendthemen
HuangExitNvidiaStrategyInFocus
67,845 Aufrufe
831 Kommentare
AKTIEN | Nvidias Jensen Huang tritt zurück, Colette Kress zur Interims-CEO ernannt
Binance News
·21 Likes
·31.4k Aufrufe
AnthropicRejectsIPODelayValuationinQuestion
658,081 Aufrufe
5,102 Kommentare
BitMineReports$6.3BNetLossForFiscal2026
8,119 Aufrufe
98 Kommentare