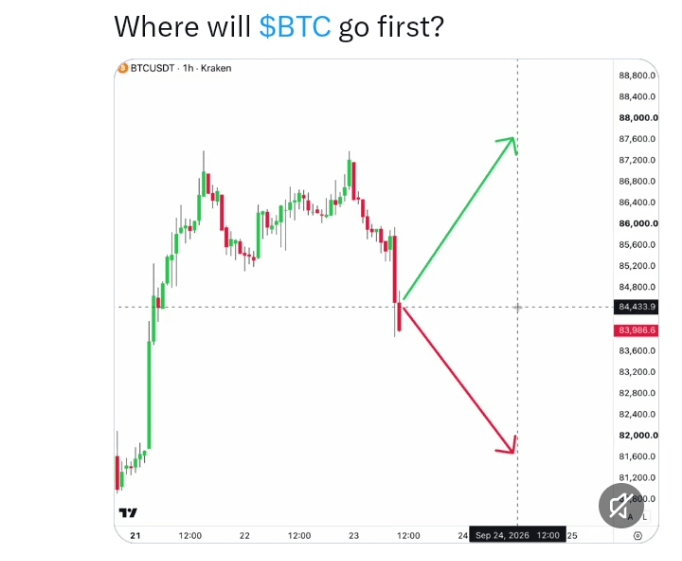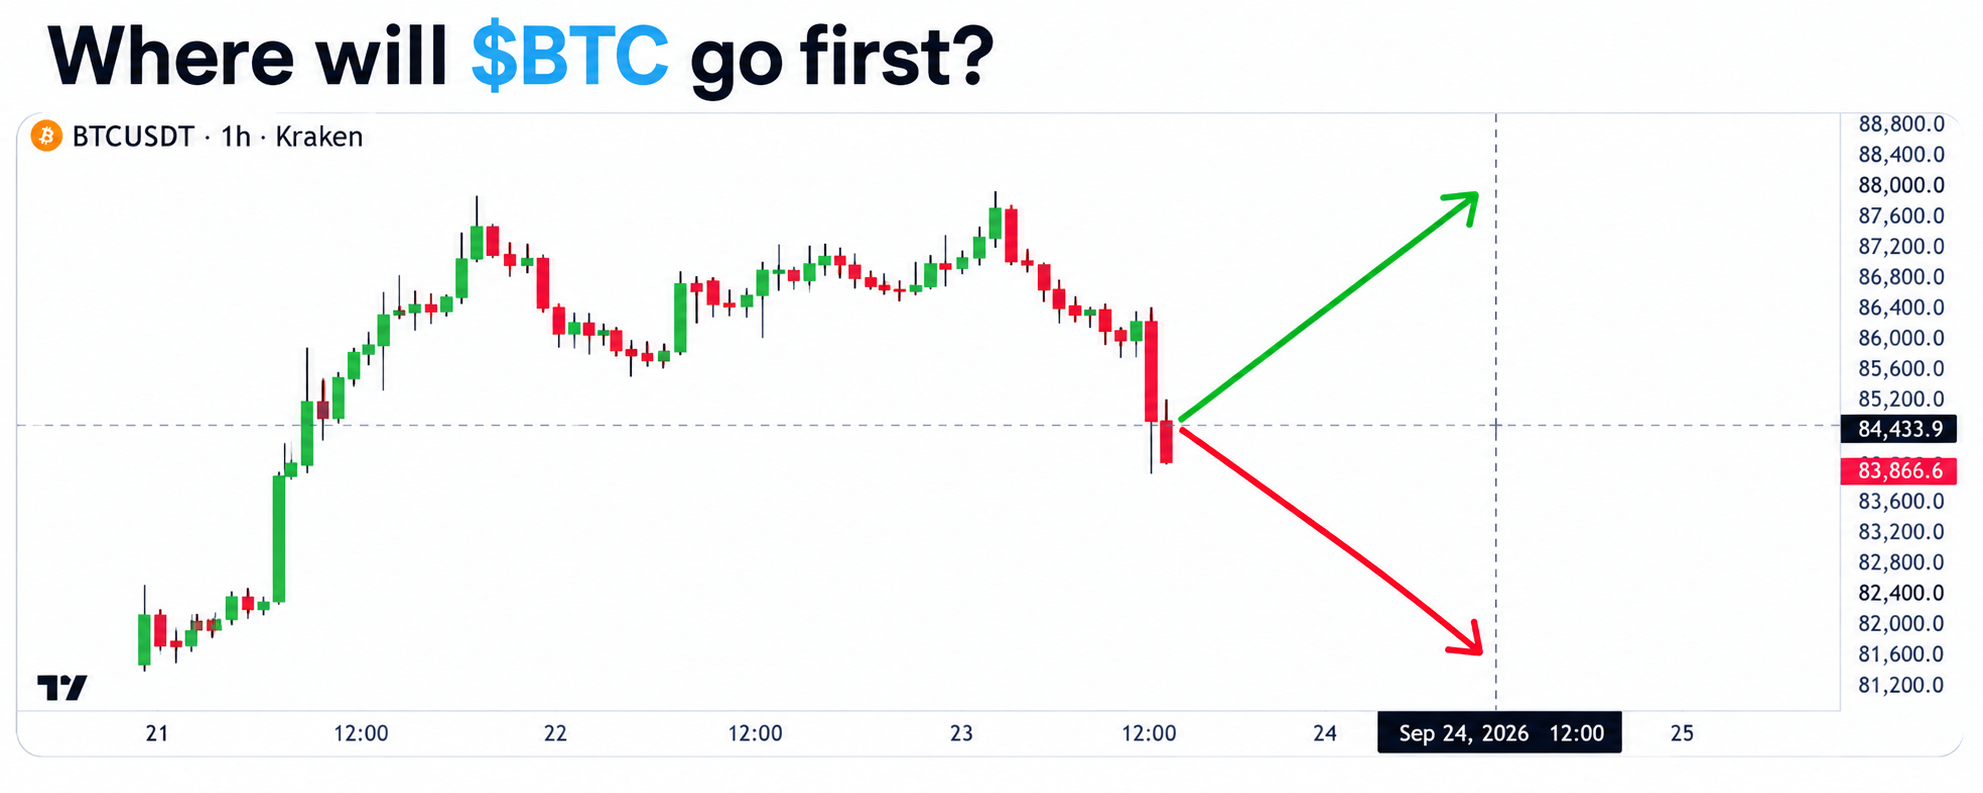

I keep looking at this chart and one question stands out:
Will Bitcoin take the liquidity above first, or sweep the downside before the next move?
The chart shows the key decision area around $84.4K, with roughly $87.6K on the upside and $81.6K on the downside.
But there is an important update: BTC has already pushed into the $87K area today, so this chart should be treated as a snapshot of the earlier setup, not the current live structure. CryptoQuant's latest dashboard had BTC around $87.36K and its Bull/Bear Indicator had turned positive at +0.27.
CryptoQuant Alpha Library
What the data is telling me 👇
Technical structure
The original chart's $84K–$85K zone remains important. Glassnode currently identifies a large long-term-holder supply cluster around $84K–$85K. Above that, its next major on-chain resistance is around $96.7K, the mean MVRV price.
So my levels to watch:
Resistance: $88K → $92K → $95K → $96.7K
Support: $85K → $84K → $82K → $81.6K
A sustained move above $88K would put the market closer to the $92K–$96.7K resistance zone.
A rejection followed by a loss of $84K would reopen the downside liquidity area.
On chain demand
There is a mixed but improving picture.
Glassnode says spot buying has returned, spot volume has more than doubled from its August low, ETF buying is picking up, and profit-taking remains relatively light compared with previous cycle tops.
But exchange data needs watching: another recent report showed Bitcoin exchange reserves had risen by about 14,800 BTC from the September 5 low, meaning some supply has moved back toward exchanges.
That's why I don't want to call every green candle a guaranteed breakout.
What is Polymarket saying?
This is interesting.
Polymarket currently prices the September market with $82.5K downside at about 68%, while the $88K level for the Sept. 21–27 window is around 23%. The hourly BTC market was showing 81% Up, while the daily market was around 57% Up when I checked.
But remember: these are market-implied probabilities, not guaranteed predictions. Polymarket itself says the odds represent trader consensus at a point in time.
What are major analysts saying?
There isn't one universal forecast.
Glassnode: BTC has moved above important cost bases, with $84K–$85K as a major supply area and $96.7K as the next major on-chain resistance.
CryptoQuant: previously identified $81.7K, $83.6K and $88.7K as important resistance levels; its latest dashboard now shows a positive bull/bear reading.
The Block +1
Grayscale's Zach Pandl: said the roughly $58K June low remained his view of the cycle bottom.
Coinbase CEO Brian Armstrong: also said he believed BTC had likely bottomed and expected an upward trend over the next 1–2 years.
Bernstein: has a much longer-term scenario of $150K by mid 2027, with a projected next cycle peak around $300K in 2029. That's a long term forecast, not a short term target.
Standard Chartered's Geoffrey Kendrick: has maintained a $100K end-2026 view despite earlier volatility.
My trading map
Bullish path:
$87K → $88K → $92K → $95K → $96.7K
Bearish path:
$87K rejection → $85K → $84K → $82K → $81.6K
The important part for me isn't guessing the exact next candle.
I want to see which liquidity zone BTC takes first and whether price can hold after the sweep.
If BTC breaks resistance with spot demand + volume + positive on chain flows, the upside structure becomes stronger.
If it loses $84K with increasing exchange inflows and selling pressure, I would start watching the lower liquidity levels instead.
No blind long. No blind short.
Let BTC show the direction first.
#Bitcoin #BTC #BitcoinAnalysis #Polymarket #Trading