

BTC Freeman
18 貼文

BTC Freeman
舉報
封鎖用戶
Bitcoin Technical Analysis Only . Pure Bitcoin chart analysis & market structure. Levels, Trends & Price Action . Not financial advice
0 關注
28 粉絲
44 點讚數
貼文
全部
引用
·
--
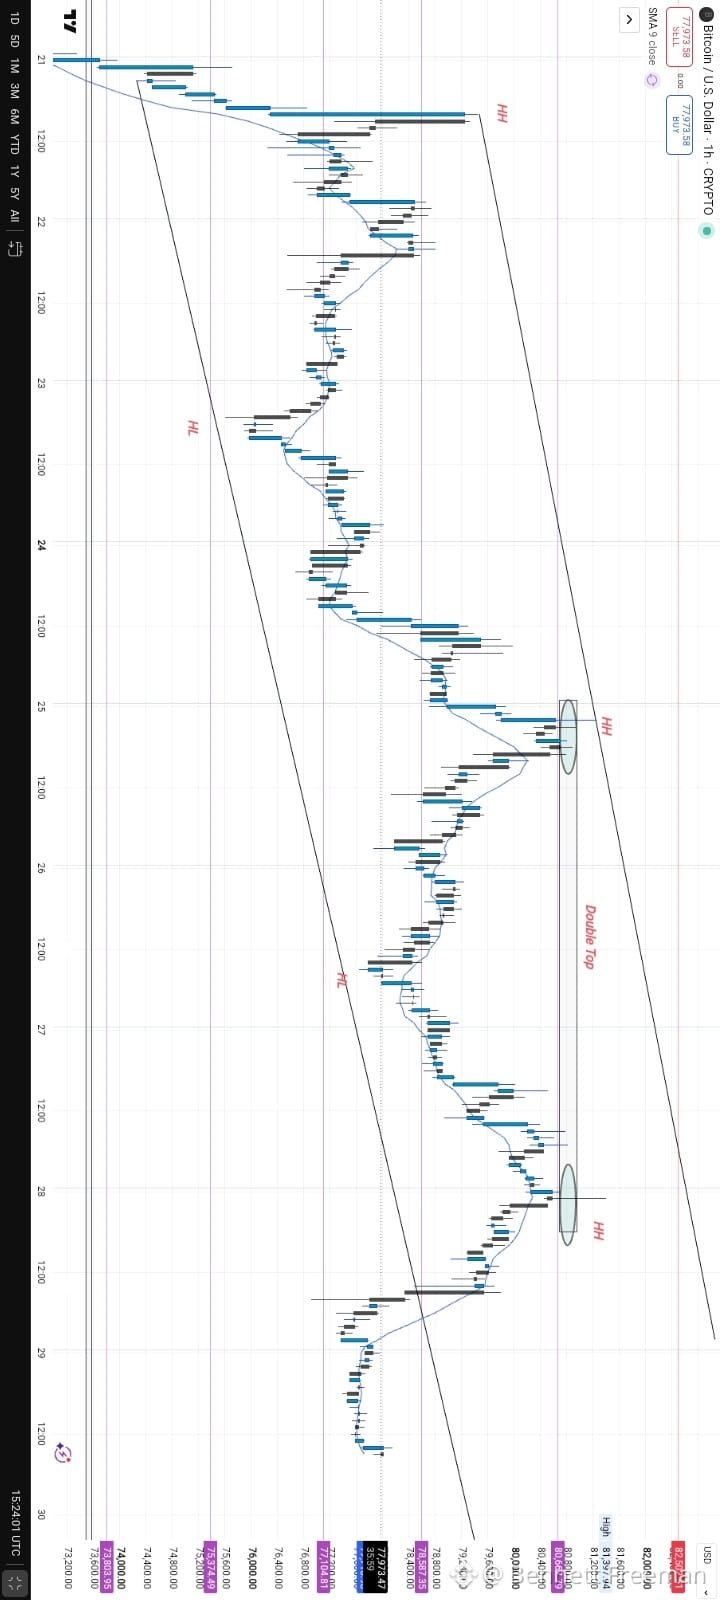
你不覺得BTC真的要衝向月球了嗎?牛市行情朝向15萬美元可能已經開始了嗎?👀
我們目前還無法確認這一走勢,但需要關注的關鍵水平是近期高點82,852.96美元。如果BTC跌破並站穩在該水平之上,這可能表明市場結構發生變化——從熊市轉向牛市。
你怎麼看?
你覺得BTC正朝着15萬美元前進,還是現在還太早下結論?
把你的分析發給我吧!👇
#Bitcoin❗
你不覺得BTC真的要衝向月球了嗎?牛市行情朝向15萬美元可能已經開始了嗎?👀
我們目前還無法確認這一走勢,但需要關注的關鍵水平是近期高點82,852.96美元。如果BTC跌破並站穩在該水平之上,這可能表明市場結構發生變化——從熊市轉向牛市。
你怎麼看?
你覺得BTC正朝着15萬美元前進,還是現在還太早下結論?
把你的分析發給我吧!👇
#Bitcoin❗
我們目前還無法確認這一走勢,但需要關注的關鍵水平是近期高點82,852.96美元。如果BTC跌破並站穩在該水平之上,這可能表明市場結構發生變化——從熊市轉向牛市。
你怎麼看?
你覺得BTC正朝着15萬美元前進,還是現在還太早下結論?
把你的分析發給我吧!👇
#Bitcoin❗
1
103
·
--
🤝
🤝

Ade_Krypt
·
--
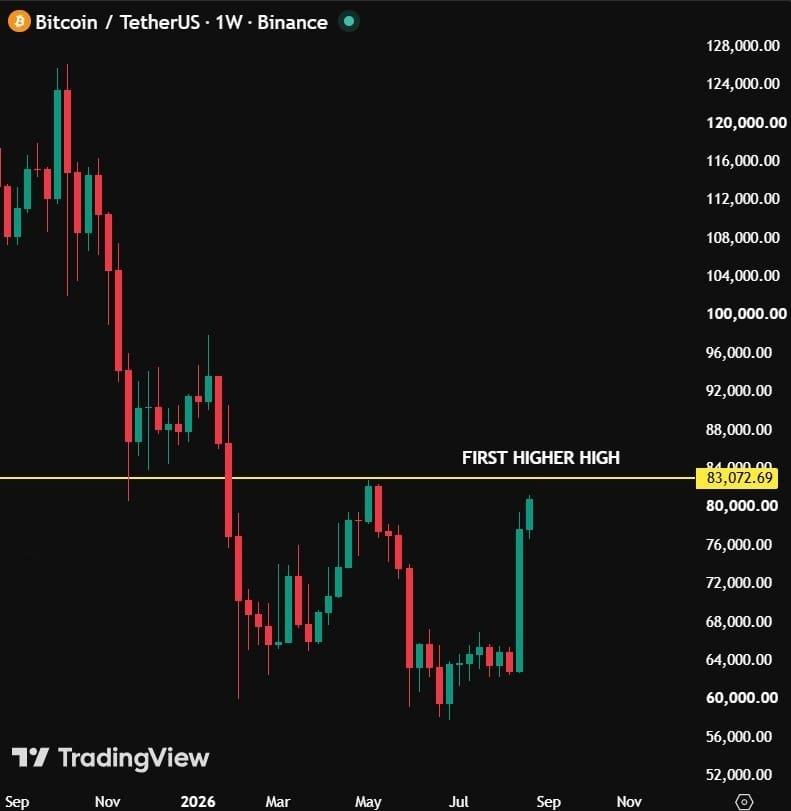
$BTC 現在距離確認其首個主要更高高點僅差 2,200 美元,一次突破可能會顯著重塑當前的市場結構。
如果比特幣突破這一關鍵阻力並確認結構性轉變,那麼再次跌回 60,000 美元以下的概率可能會顯著下降。這個價位或許會從臨時支撐演變爲本輪週期的主要宏觀底部。
空頭的動能正在減弱,而一波強勁的放量可能會點燃下一段主要上行行情。那些還在等待更深回調的人,或許很快就會發現自己正在追逐市場。
我們可能正接近一次重大的動能轉折。請做好準備。
#OilHoldsLosses #KazakhstanCutsOilOutputForecastTo96MTons
如果比特幣突破這一關鍵阻力並確認結構性轉變,那麼再次跌回 60,000 美元以下的概率可能會顯著下降。這個價位或許會從臨時支撐演變爲本輪週期的主要宏觀底部。
空頭的動能正在減弱,而一波強勁的放量可能會點燃下一段主要上行行情。那些還在等待更深回調的人,或許很快就會發現自己正在追逐市場。
我們可能正接近一次重大的動能轉折。請做好準備。
#OilHoldsLosses #KazakhstanCutsOilOutputForecastTo96MTons
1
11
·
--
BTCUSDT:比特幣正在形成反向頭肩形態嗎&應該嗎?👀
讓我們把這件事說得非常簡單。
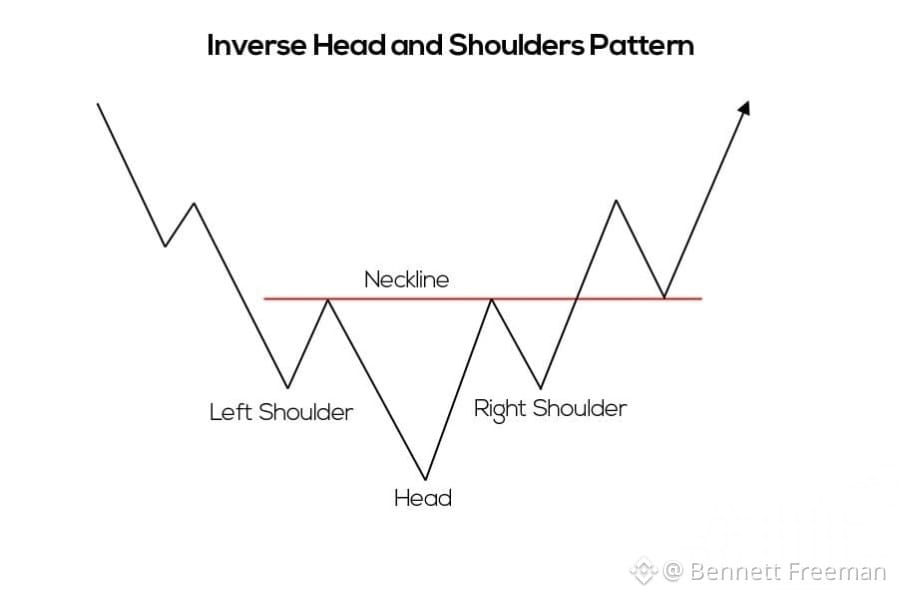
第一張圖展示了反向頭肩形態長什麼樣。
想象一個人倒掛着站着:
🟢 左肩
🔻 頭
🟢 右肩
頭部是下跌最深的位置,而兩側的肩部更高一些,且相對相似。
紅線叫做頸線。你可以把它想成價格需要突破的“天花板”。
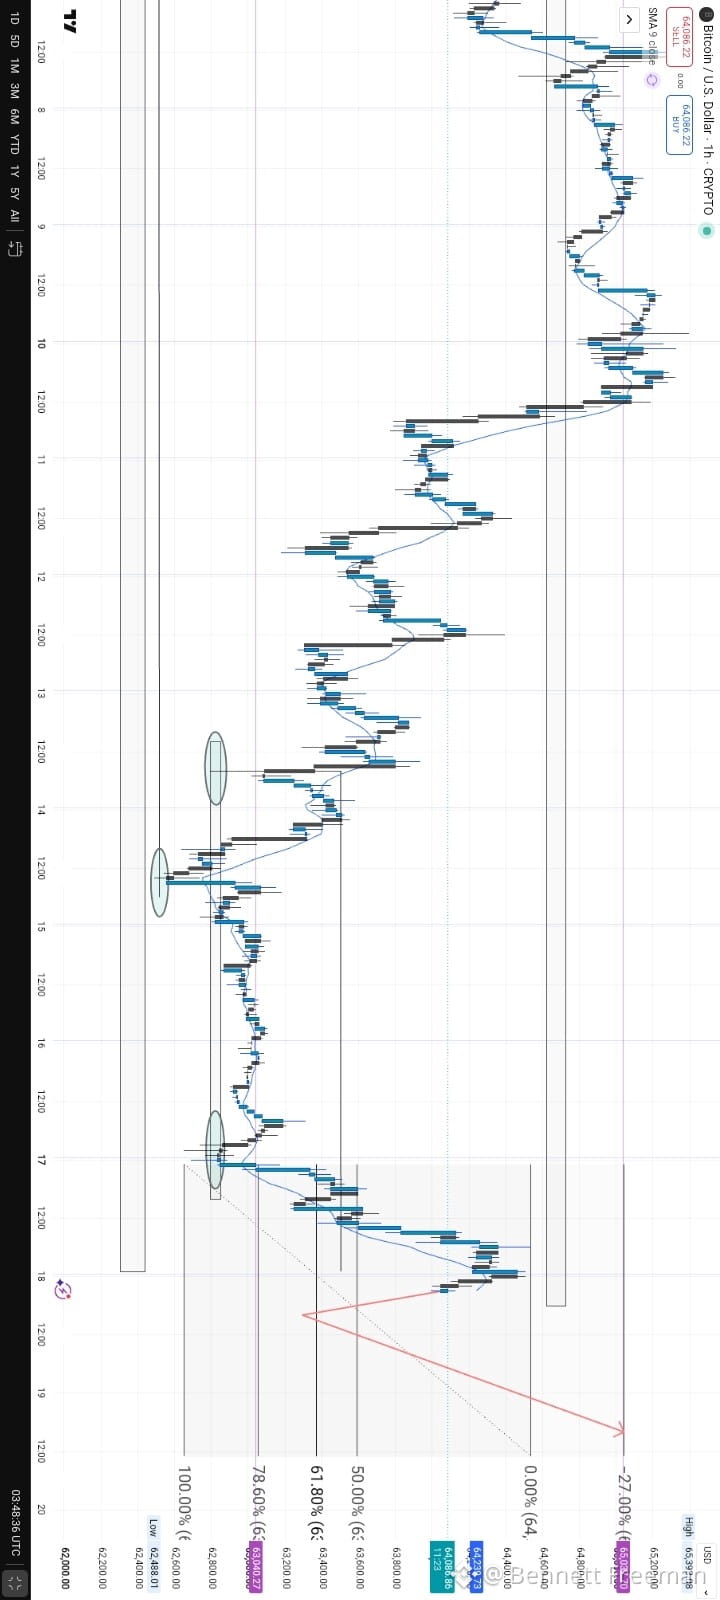
現在看第二張圖——我的 BTC 1小時圖。
我在 $62K–$62.5K 這一帶附近標出了三個區域,它們看起來類似:
➡️ 左肩
➡️ 頭
➡️ 右肩
在形成這種結構之後,BTC 強勢向上推動。
我也在關注斐波那契(Fib)在 50%、61.8% 和 78.6% 附近的水平,認爲它們可能是價格出現反應的區域。
我的看多情景是:
回調 → 獲得支撐 → 延續 → 可能向前高附近(約 $65K+)發起一波走勢
但請記住:
⚠️ 形態並不是保證。
真正重要的確認在於:BTC 能否成功突破並站穩在相關阻力/頸線區域之上。
如果確認失敗,看多想法就會變弱。
所以對我來說,最大的疑問是:
BTC 是否正在完成一個反向頭肩形態,還是這只是另一輪暫時性的反彈?🤔
你在圖表上看到了什麼?👇
#BTC #bitcoin #BTCUSDT #Crypto #TechnicalAnalysis
BTCUSDT:比特幣正在形成反向頭肩形態嗎&應該嗎?👀
讓我們把這件事說得非常簡單。
第一張圖展示了反向頭肩形態長什麼樣。
想象一個人倒掛着站着:
🟢 左肩
🔻 頭
🟢 右肩
頭部是下跌最深的位置,而兩側的肩部更高一些,且相對相似。
紅線叫做頸線。你可以把它想成價格需要突破的“天花板”。
現在看第二張圖——我的 BTC 1小時圖。
我在 $62K–$62.5K 這一帶附近標出了三個區域,它們看起來類似:
➡️ 左肩
➡️ 頭
➡️ 右肩
在形成這種結構之後,BTC 強勢向上推動。
我也在關注斐波那契(Fib)在 50%、61.8% 和 78.6% 附近的水平,認爲它們可能是價格出現反應的區域。
我的看多情景是:
回調 → 獲得支撐 → 延續 → 可能向前高附近(約 $65K+)發起一波走勢
但請記住:
⚠️ 形態並不是保證。
真正重要的確認在於:BTC 能否成功突破並站穩在相關阻力/頸線區域之上。
如果確認失敗,看多想法就會變弱。
所以對我來說,最大的疑問是:
BTC 是否正在完成一個反向頭肩形態,還是這只是另一輪暫時性的反彈?🤔
你在圖表上看到了什麼?👇
#BTC #bitcoin #BTCUSDT #Crypto #TechnicalAnalysis
讓我們把這件事說得非常簡單。
第一張圖展示了反向頭肩形態長什麼樣。
想象一個人倒掛着站着:
🟢 左肩
🔻 頭
🟢 右肩
頭部是下跌最深的位置,而兩側的肩部更高一些,且相對相似。
紅線叫做頸線。你可以把它想成價格需要突破的“天花板”。
現在看第二張圖——我的 BTC 1小時圖。
我在 $62K–$62.5K 這一帶附近標出了三個區域,它們看起來類似:
➡️ 左肩
➡️ 頭
➡️ 右肩
在形成這種結構之後,BTC 強勢向上推動。
我也在關注斐波那契(Fib)在 50%、61.8% 和 78.6% 附近的水平,認爲它們可能是價格出現反應的區域。
我的看多情景是:
回調 → 獲得支撐 → 延續 → 可能向前高附近(約 $65K+)發起一波走勢
但請記住:
⚠️ 形態並不是保證。
真正重要的確認在於:BTC 能否成功突破並站穩在相關阻力/頸線區域之上。
如果確認失敗,看多想法就會變弱。
所以對我來說,最大的疑問是:
BTC 是否正在完成一個反向頭肩形態,還是這只是另一輪暫時性的反彈?🤔
你在圖表上看到了什麼?👇
#BTC #bitcoin #BTCUSDT #Crypto #TechnicalAnalysis
1
96
·
--
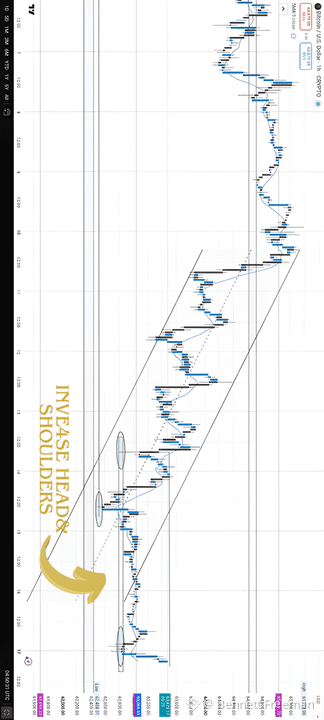
BTC 周度展望 📊
儘管 BTC 處於更大下行趨勢中的回調與橫盤階段,但本週卻以一個有趣的發展開始:出現了反向頭肩(Inverse Head & Shoulders)形態。
把它想象成 BTC 跌了三次:中間那次跌得最深,而第三次下跌更弱。這可能表明賣方的力度正在減弱,買方可能正在入場。
如果 BTC 突破並站穩頸線,我們本週可能會看到更強的看漲走勢。但如果突破失敗,BTC 可能繼續橫盤,或進一步下探。
我的觀點:謹慎偏多,但需要確認。🚀
#USToPressNationsToPickUSOrChinaAICoalition
#SP500EarningsBeatExpectations
#bitcoin
BTC 周度展望 📊
儘管 BTC 處於更大下行趨勢中的回調與橫盤階段,但本週卻以一個有趣的發展開始:出現了反向頭肩(Inverse Head & Shoulders)形態。
把它想象成 BTC 跌了三次:中間那次跌得最深,而第三次下跌更弱。這可能表明賣方的力度正在減弱,買方可能正在入場。
如果 BTC 突破並站穩頸線,我們本週可能會看到更強的看漲走勢。但如果突破失敗,BTC 可能繼續橫盤,或進一步下探。
我的觀點:謹慎偏多,但需要確認。🚀
#USToPressNationsToPickUSOrChinaAICoalition
#SP500EarningsBeatExpectations
#bitcoin
儘管 BTC 處於更大下行趨勢中的回調與橫盤階段,但本週卻以一個有趣的發展開始:出現了反向頭肩(Inverse Head & Shoulders)形態。
把它想象成 BTC 跌了三次:中間那次跌得最深,而第三次下跌更弱。這可能表明賣方的力度正在減弱,買方可能正在入場。
如果 BTC 突破並站穩頸線,我們本週可能會看到更強的看漲走勢。但如果突破失敗,BTC 可能繼續橫盤,或進一步下探。
我的觀點:謹慎偏多,但需要確認。🚀
#USToPressNationsToPickUSOrChinaAICoalition
#SP500EarningsBeatExpectations
#bitcoin
1
82
·
--
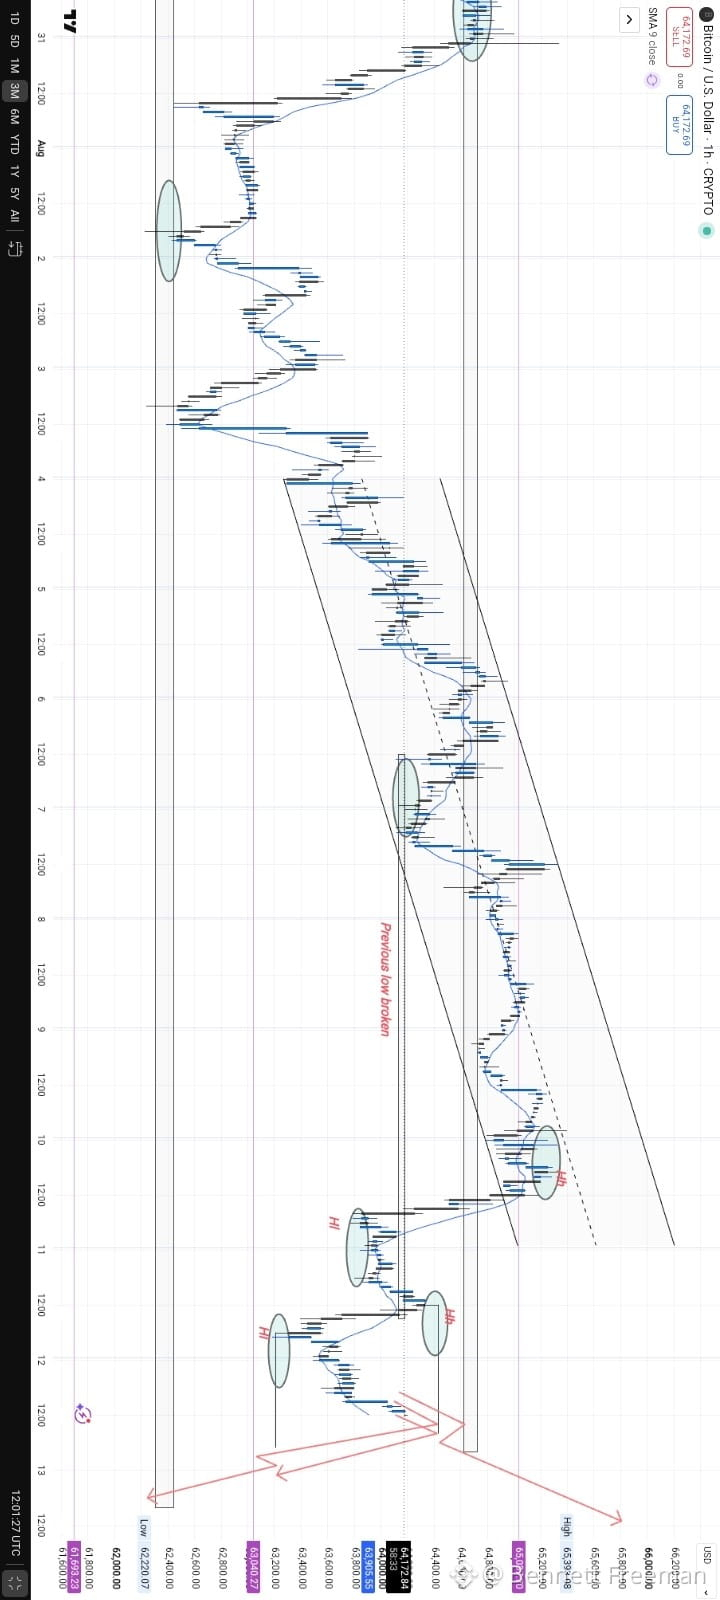
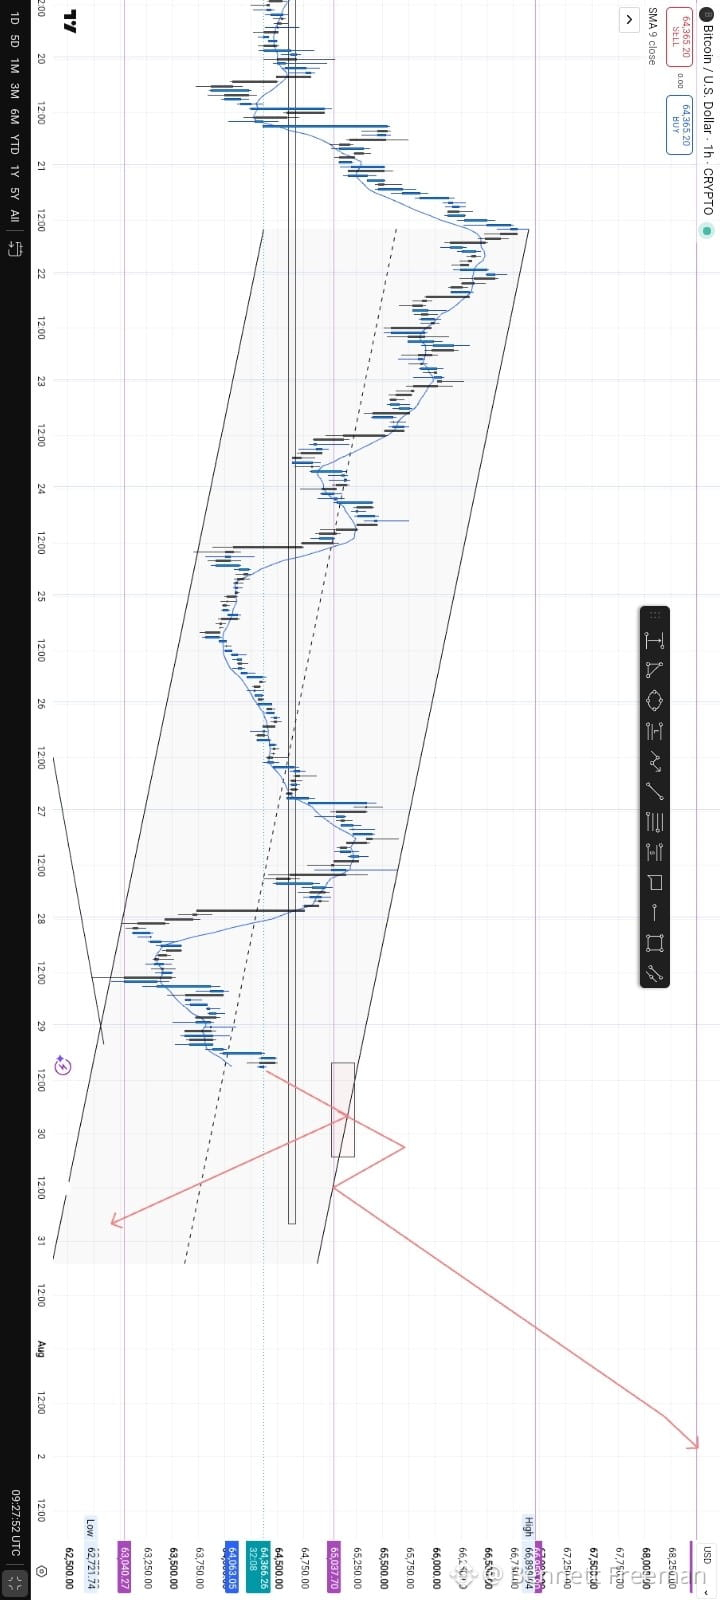
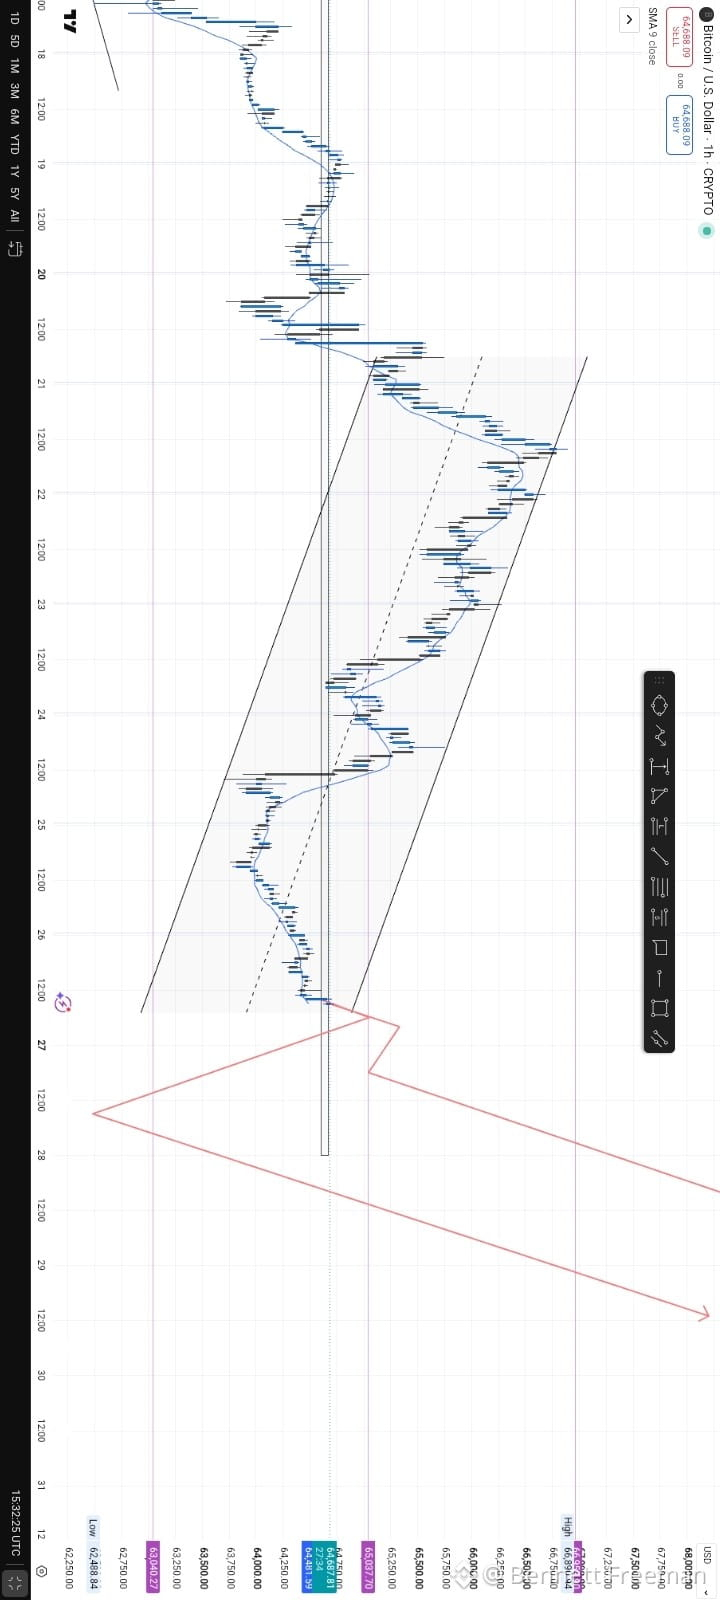
BTC。讓我們把這張圖表講得一目瞭然
(日內交易設置)
把市場想象成一段樓梯。BTC 在上升通道里一步一步攀升。我們看到了更高的高點和更高的低點。
然後發生了一件重要的事:前一個低點被打破。⛓️💥
這說明這段樓梯結構開始崩壞。
在跌破之後,BTC 開始構建新的結構:
更低的高點——更低的低點——更低的高點——更低的低點
目前,價格正試圖重新上行,回到 64,300–64,500 這個區域附近。
🟢 如果 BTC 突破並能站穩該阻力位,下一個重要區域可能在 65,000–65,400,並有繼續上衝的可能。
🔴 但如果價格在 64,300–64,500 附近遭到拒絕,那麼看跌結構可能繼續運行,63,400 → 63,000 → 62,200 將成爲接下來需要重點關注的下行區域。
簡單的結論:
不要只盯着價格是漲還是跌。要盯住高點和低點。
更高的高點 + 更高的低點 = 買方掌控 📈
更低的高點 + 更低的低點 = 賣方掌控 📉
這就是我目前對該設置的解讀。下單交易前務必等待確認。
#bitcoin #MoneyGramExpandsCashCryptoServiceToSolana
#TechnicalAnalysiss
#TechnicalAnalysisCrypto
BTC。讓我們把這張圖表講得一目瞭然
(日內交易設置)
把市場想象成一段樓梯。BTC 在上升通道里一步一步攀升。我們看到了更高的高點和更高的低點。
然後發生了一件重要的事:前一個低點被打破。⛓️💥
這說明這段樓梯結構開始崩壞。
在跌破之後,BTC 開始構建新的結構:
更低的高點——更低的低點——更低的高點——更低的低點
目前,價格正試圖重新上行,回到 64,300–64,500 這個區域附近。
🟢 如果 BTC 突破並能站穩該阻力位,下一個重要區域可能在 65,000–65,400,並有繼續上衝的可能。
🔴 但如果價格在 64,300–64,500 附近遭到拒絕,那麼看跌結構可能繼續運行,63,400 → 63,000 → 62,200 將成爲接下來需要重點關注的下行區域。
簡單的結論:
不要只盯着價格是漲還是跌。要盯住高點和低點。
更高的高點 + 更高的低點 = 買方掌控 📈
更低的高點 + 更低的低點 = 賣方掌控 📉
這就是我目前對該設置的解讀。下單交易前務必等待確認。
#bitcoin #MoneyGramExpandsCashCryptoServiceToSolana
#TechnicalAnalysiss
#TechnicalAnalysisCrypto
(日內交易設置)
把市場想象成一段樓梯。BTC 在上升通道里一步一步攀升。我們看到了更高的高點和更高的低點。
然後發生了一件重要的事:前一個低點被打破。⛓️💥
這說明這段樓梯結構開始崩壞。
在跌破之後,BTC 開始構建新的結構:
更低的高點——更低的低點——更低的高點——更低的低點
目前,價格正試圖重新上行,回到 64,300–64,500 這個區域附近。
🟢 如果 BTC 突破並能站穩該阻力位,下一個重要區域可能在 65,000–65,400,並有繼續上衝的可能。
🔴 但如果價格在 64,300–64,500 附近遭到拒絕,那麼看跌結構可能繼續運行,63,400 → 63,000 → 62,200 將成爲接下來需要重點關注的下行區域。
簡單的結論:
不要只盯着價格是漲還是跌。要盯住高點和低點。
更高的高點 + 更高的低點 = 買方掌控 📈
更低的高點 + 更低的低點 = 賣方掌控 📉
這就是我目前對該設置的解讀。下單交易前務必等待確認。
#bitcoin #MoneyGramExpandsCashCryptoServiceToSolana
#TechnicalAnalysiss
#TechnicalAnalysisCrypto
1
116
·
--
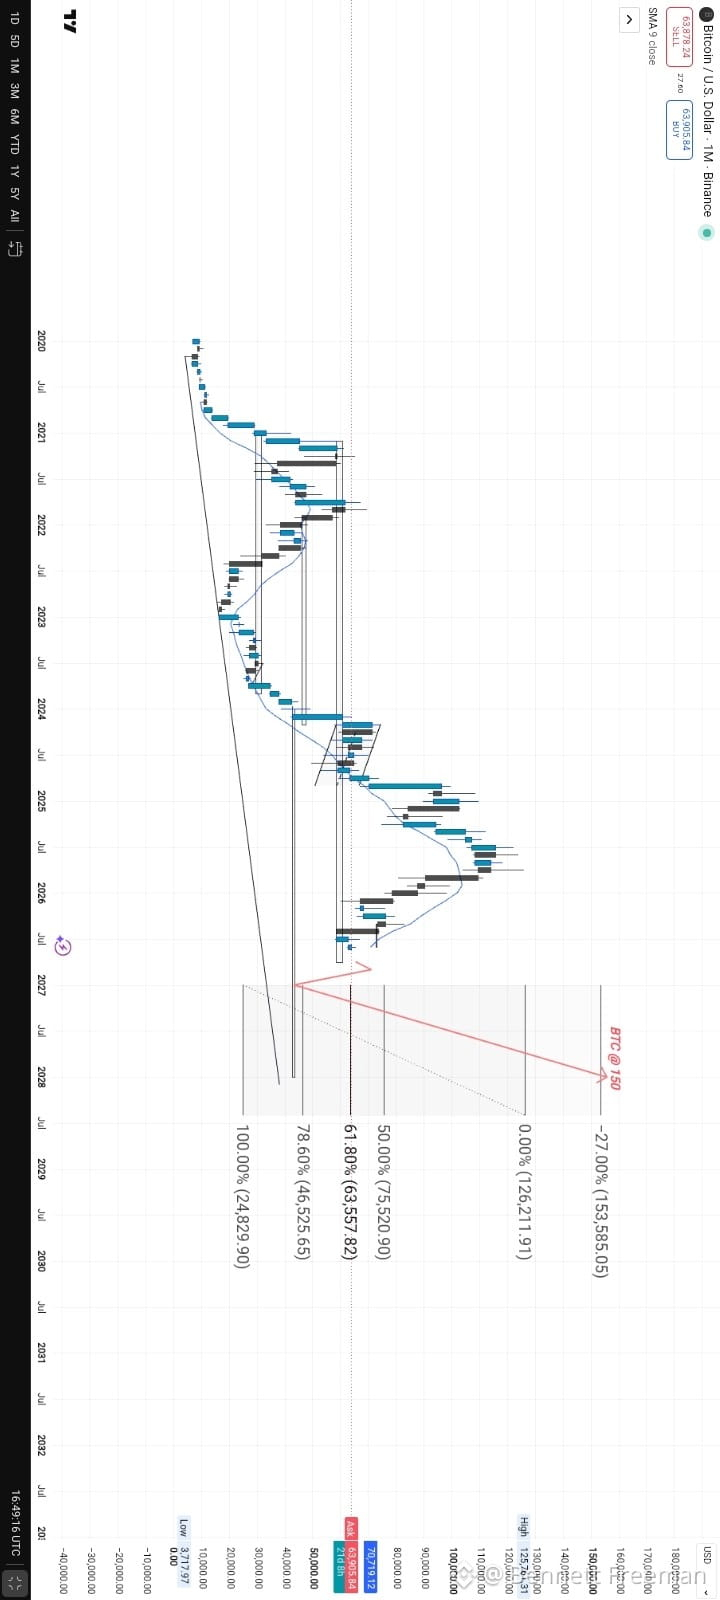
BTC 15萬美元 SETUP 但可能還有一次下跌 👀
讓我用盡可能簡單的方式解釋我的圖表 😂。比特幣目前大約在 7 萬美元附近,但我不認爲通往 15 萬美元的路一定會一路直上。看一下月線圖,我是這樣理解的:
1️⃣ 首先,我關注 6.35 萬美元區域
這是對我來說很關鍵的一個水平。
把它想作“地板”。如果 BTC 跌到這裏,我想看看買家是否會介入並守住它。
2️⃣ 但如果我們繼續更低呢?
我的圖表顯示,可能會出現更深的回調,目標大約在 4.65 萬美元。
這大概對應 78.6% 的斐波那契水平。
基本上,BTC 在再邁出下一次大步向前之前,可能會先退得很深一點。
這並不意味着 BTC MUST 一定會到 4.65 萬美元。它只是我在觀察的一個情景。
3️⃣ 然後是大目標 🚀
如果市場完成回調,並再次開始構建看漲結構,我的長期目標大約是:15 萬美元+
我圖表上的斐波那契投影大約落在 153.6K 左右。
所以我關注的路線是:
7 萬美元 - 6.35 萬美元 - 可能的 4.65 萬美元 - 反彈 - 12.6 萬美元 - 15 萬美元+
這就是我看到的 setup。
那藍色線呢?
那是 9 個月移動平均線(SMA 9)。
別想太多 😂
它本質上是一條線,幫助我在不被所有噪音干擾的情況下,更清楚地看到更廣泛的月度價格方向。
而黑色線呢?
那是長期趨勢線。
對我來說,它表明即使 BTC 出現了重大的修正,更大的趨勢仍可能保持看漲。
👀 我最在意的重點
我不想預測每一根蠟燭。
我只想看 BTC 在這些關鍵區域附近會如何反應:
6.35 萬美元 - 4.65 萬美元 - 12.6 萬美元 - 15 萬美元
如果更低的位置守住了,並且比特幣又開始展現強勁的看漲結構,那麼 15 萬美元目標就會變得非常有吸引力。
但如果結構發生變化,我的觀點也會跟着調整。
這就是交易。你不會“跟預測結婚”😂。
你怎麼看?
我們會看到 15 萬美元的 BTC 嗎,還是比特幣會再次讓所有人驚訝?👀
⚠️ 注意:這不是財務建議。任何投資或交易之前,請務必記得做你自己的研究(DYOR)
BTC 15萬美元 SETUP 但可能還有一次下跌 👀
讓我用盡可能簡單的方式解釋我的圖表 😂。比特幣目前大約在 7 萬美元附近,但我不認爲通往 15 萬美元的路一定會一路直上。看一下月線圖,我是這樣理解的:
1️⃣ 首先,我關注 6.35 萬美元區域
這是對我來說很關鍵的一個水平。
把它想作“地板”。如果 BTC 跌到這裏,我想看看買家是否會介入並守住它。
2️⃣ 但如果我們繼續更低呢?
我的圖表顯示,可能會出現更深的回調,目標大約在 4.65 萬美元。
這大概對應 78.6% 的斐波那契水平。
基本上,BTC 在再邁出下一次大步向前之前,可能會先退得很深一點。
這並不意味着 BTC MUST 一定會到 4.65 萬美元。它只是我在觀察的一個情景。
3️⃣ 然後是大目標 🚀
如果市場完成回調,並再次開始構建看漲結構,我的長期目標大約是:15 萬美元+
我圖表上的斐波那契投影大約落在 153.6K 左右。
所以我關注的路線是:
7 萬美元 - 6.35 萬美元 - 可能的 4.65 萬美元 - 反彈 - 12.6 萬美元 - 15 萬美元+
這就是我看到的 setup。
那藍色線呢?
那是 9 個月移動平均線(SMA 9)。
別想太多 😂
它本質上是一條線,幫助我在不被所有噪音干擾的情況下,更清楚地看到更廣泛的月度價格方向。
而黑色線呢?
那是長期趨勢線。
對我來說,它表明即使 BTC 出現了重大的修正,更大的趨勢仍可能保持看漲。
👀 我最在意的重點
我不想預測每一根蠟燭。
我只想看 BTC 在這些關鍵區域附近會如何反應:
6.35 萬美元 - 4.65 萬美元 - 12.6 萬美元 - 15 萬美元
如果更低的位置守住了,並且比特幣又開始展現強勁的看漲結構,那麼 15 萬美元目標就會變得非常有吸引力。
但如果結構發生變化,我的觀點也會跟着調整。
這就是交易。你不會“跟預測結婚”😂。
你怎麼看?
我們會看到 15 萬美元的 BTC 嗎,還是比特幣會再次讓所有人驚訝?👀
⚠️ 注意:這不是財務建議。任何投資或交易之前,請務必記得做你自己的研究(DYOR)
讓我用盡可能簡單的方式解釋我的圖表 😂。比特幣目前大約在 7 萬美元附近,但我不認爲通往 15 萬美元的路一定會一路直上。看一下月線圖,我是這樣理解的:
1️⃣ 首先,我關注 6.35 萬美元區域
這是對我來說很關鍵的一個水平。
把它想作“地板”。如果 BTC 跌到這裏,我想看看買家是否會介入並守住它。
2️⃣ 但如果我們繼續更低呢?
我的圖表顯示,可能會出現更深的回調,目標大約在 4.65 萬美元。
這大概對應 78.6% 的斐波那契水平。
基本上,BTC 在再邁出下一次大步向前之前,可能會先退得很深一點。
這並不意味着 BTC MUST 一定會到 4.65 萬美元。它只是我在觀察的一個情景。
3️⃣ 然後是大目標 🚀
如果市場完成回調,並再次開始構建看漲結構,我的長期目標大約是:15 萬美元+
我圖表上的斐波那契投影大約落在 153.6K 左右。
所以我關注的路線是:
7 萬美元 - 6.35 萬美元 - 可能的 4.65 萬美元 - 反彈 - 12.6 萬美元 - 15 萬美元+
這就是我看到的 setup。
那藍色線呢?
那是 9 個月移動平均線(SMA 9)。
別想太多 😂
它本質上是一條線,幫助我在不被所有噪音干擾的情況下,更清楚地看到更廣泛的月度價格方向。
而黑色線呢?
那是長期趨勢線。
對我來說,它表明即使 BTC 出現了重大的修正,更大的趨勢仍可能保持看漲。
👀 我最在意的重點
我不想預測每一根蠟燭。
我只想看 BTC 在這些關鍵區域附近會如何反應:
6.35 萬美元 - 4.65 萬美元 - 12.6 萬美元 - 15 萬美元
如果更低的位置守住了,並且比特幣又開始展現強勁的看漲結構,那麼 15 萬美元目標就會變得非常有吸引力。
但如果結構發生變化,我的觀點也會跟着調整。
這就是交易。你不會“跟預測結婚”😂。
你怎麼看?
我們會看到 15 萬美元的 BTC 嗎,還是比特幣會再次讓所有人驚訝?👀
⚠️ 注意:這不是財務建議。任何投資或交易之前,請務必記得做你自己的研究(DYOR)
1
113
·
--
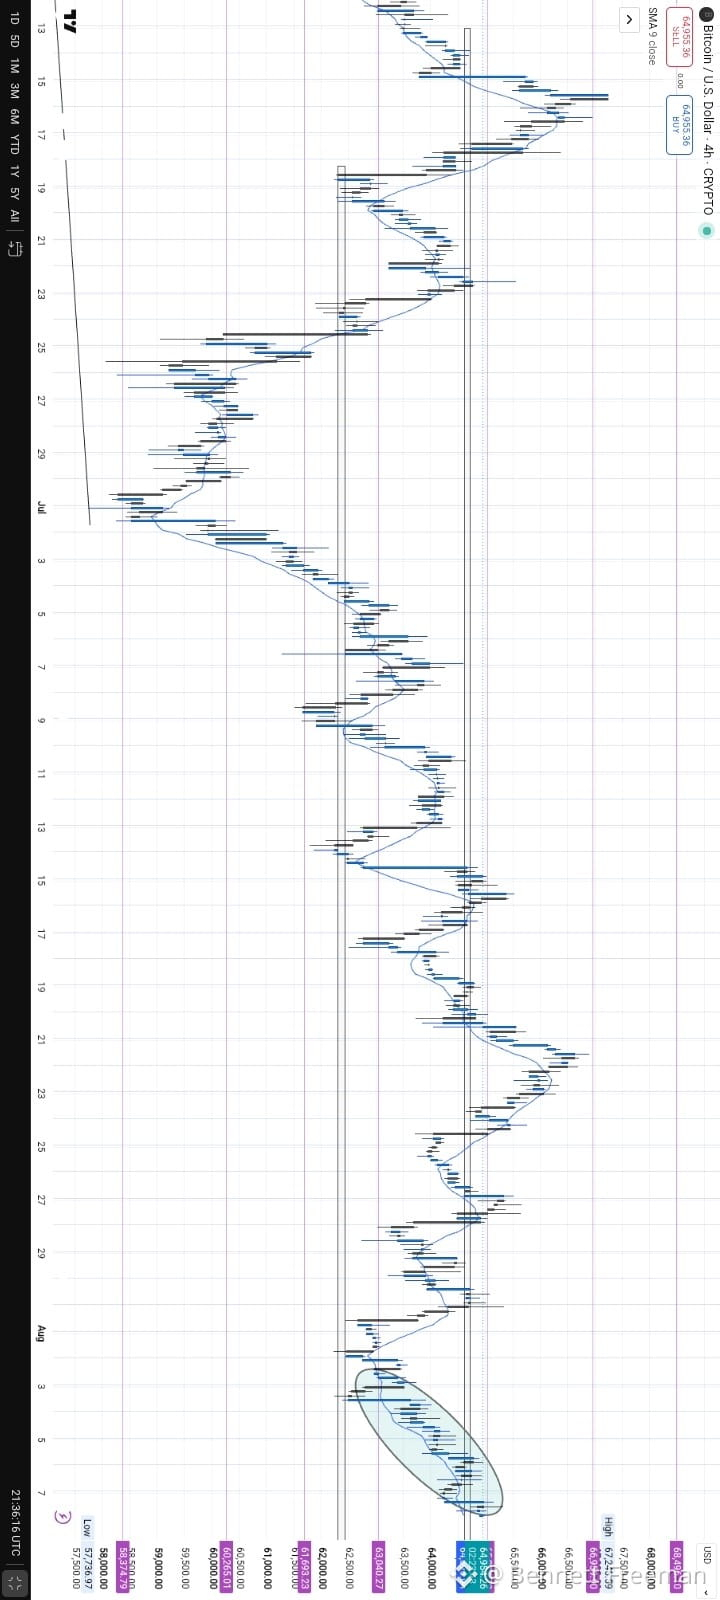
這就是本週 BTC 的走勢——我用藍色標出的路徑💙📈
老實說,如果你期待的是一條乾淨俐落的趨勢,那麼目前 BTC 所發生的一切可能並不會那麼容易理解。市場仍處於修正階段,而在這個階段,耐心變得至關重要。
如果你不夠有耐心,很容易就會過度交易、強行進場,然後在正確的設定終於出現之前就把好幾個帳戶打爆。
有時候最好的交易方式就是靜待修正結束,並讓市場用行動把牌攤在你面前。🧘♂️
不要追 BTC。不要強行做出交易設定。讓市場自己走到你面前。
耐心也是策略的一部分。💙
#BTC #cryptotrading #priceaction #bitcoin
這就是本週 BTC 的走勢——我用藍色標出的路徑💙📈
老實說,如果你期待的是一條乾淨俐落的趨勢,那麼目前 BTC 所發生的一切可能並不會那麼容易理解。市場仍處於修正階段,而在這個階段,耐心變得至關重要。
如果你不夠有耐心,很容易就會過度交易、強行進場,然後在正確的設定終於出現之前就把好幾個帳戶打爆。
有時候最好的交易方式就是靜待修正結束,並讓市場用行動把牌攤在你面前。🧘♂️
不要追 BTC。不要強行做出交易設定。讓市場自己走到你面前。
耐心也是策略的一部分。💙
#BTC #cryptotrading #priceaction #bitcoin
老實說,如果你期待的是一條乾淨俐落的趨勢,那麼目前 BTC 所發生的一切可能並不會那麼容易理解。市場仍處於修正階段,而在這個階段,耐心變得至關重要。
如果你不夠有耐心,很容易就會過度交易、強行進場,然後在正確的設定終於出現之前就把好幾個帳戶打爆。
有時候最好的交易方式就是靜待修正結束,並讓市場用行動把牌攤在你面前。🧘♂️
不要追 BTC。不要強行做出交易設定。讓市場自己走到你面前。
耐心也是策略的一部分。💙
#BTC #cryptotrading #priceaction #bitcoin
1
128
·
--
BTC 分析
比特幣目前在一個下降通道內交易,且價格已回到關鍵阻力區域。高亮區域是我預計市場將做出下一步決定的地方。
從我所看到的情況:
價格正在接近通道上邊界,這一位置此前曾充當動態阻力。
灰色方框標記了一個反應區域。如果賣方在這裏入場,我們可能會看到價格回落至通道中部,隨後最終指向通道下邊界。
然而,如果買方能夠憑藉強勁動能突破該區域並將其守住爲支撐,那麼看跌結構將被削弱,爲更強的看漲延續打開空間。
我的傾向:除非 BTC 在高亮的阻力上方實現乾淨突破,否則我略偏看跌。
關鍵情景:🟥 看跌:從阻力區域出現回落 → 回到通道下方的趨勢線附近。🟩 看漲:突破並收於通道上方 → 回踩驗證 → 繼續上行,挑戰新高。
耐心很關鍵。不要追逐行情,讓市場先確認方向。
這只是我基於價格行爲的技術觀點,不構成任何金融建議。
#BTC #bitcoin #crypto #trading #PriceAction
BTC 分析
比特幣目前在一個下降通道內交易,且價格已回到關鍵阻力區域。高亮區域是我預計市場將做出下一步決定的地方。
從我所看到的情況:
價格正在接近通道上邊界,這一位置此前曾充當動態阻力。
灰色方框標記了一個反應區域。如果賣方在這裏入場,我們可能會看到價格回落至通道中部,隨後最終指向通道下邊界。
然而,如果買方能夠憑藉強勁動能突破該區域並將其守住爲支撐,那麼看跌結構將被削弱,爲更強的看漲延續打開空間。
我的傾向:除非 BTC 在高亮的阻力上方實現乾淨突破,否則我略偏看跌。
關鍵情景:🟥 看跌:從阻力區域出現回落 → 回到通道下方的趨勢線附近。🟩 看漲:突破並收於通道上方 → 回踩驗證 → 繼續上行,挑戰新高。
耐心很關鍵。不要追逐行情,讓市場先確認方向。
這只是我基於價格行爲的技術觀點,不構成任何金融建議。
#BTC #bitcoin #crypto #trading #PriceAction
比特幣目前在一個下降通道內交易,且價格已回到關鍵阻力區域。高亮區域是我預計市場將做出下一步決定的地方。
從我所看到的情況:
價格正在接近通道上邊界,這一位置此前曾充當動態阻力。
灰色方框標記了一個反應區域。如果賣方在這裏入場,我們可能會看到價格回落至通道中部,隨後最終指向通道下邊界。
然而,如果買方能夠憑藉強勁動能突破該區域並將其守住爲支撐,那麼看跌結構將被削弱,爲更強的看漲延續打開空間。
我的傾向:除非 BTC 在高亮的阻力上方實現乾淨突破,否則我略偏看跌。
關鍵情景:🟥 看跌:從阻力區域出現回落 → 回到通道下方的趨勢線附近。🟩 看漲:突破並收於通道上方 → 回踩驗證 → 繼續上行,挑戰新高。
耐心很關鍵。不要追逐行情,讓市場先確認方向。
這只是我基於價格行爲的技術觀點,不構成任何金融建議。
#BTC #bitcoin #crypto #trading #PriceAction
1
69
·
--
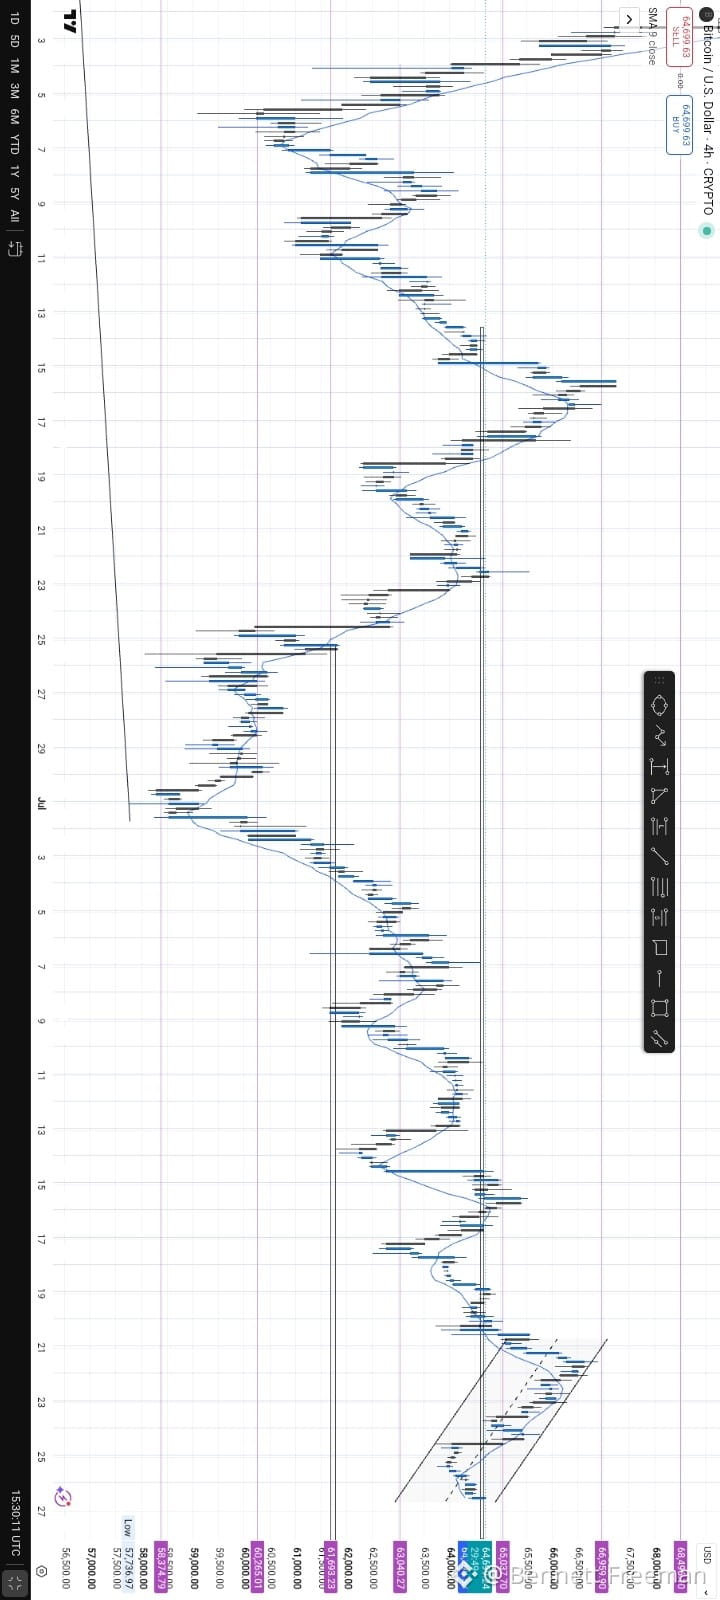
📊 比特幣展望:下一波重大多頭行情前的修正?🚀
根據我的技術分析,目前比特幣正處於修正階段;價格被限制在一個清晰定義的支撐與壓力區間內,導致短期方向不確定。
我的圖表顯示,BTC 可能會繼續向 $72,876 區域的修正走勢推進,這也對應到 61.8% 的斐波那契黃金比率。這是一個我預期將出現強烈拋售壓力的關鍵區域。
如果這次反彈遭到拒絕,比特幣可能會出現急劇下跌,甚至跌破 $60,000 的支撐,並延伸至 $49,965 的需求區。
我認為 $49,965 可能會成為修正結束的拐點,並成為下一段重大多頭行情的發射台。從那裡開始,比特幣可能重新獲得動能,突破先前的歷史新高,並把目標指向 $125,000–$150,000。
📌 需要特別留意的關鍵位:
🎯 斐波那契 61.8%:$72,876
🛑 主要支撐:$60,000
💎 潛在反轉區:$49,965
🚀 多頭行情目標:$125,000–$150,000
以上是我的個人技術觀點,並非財務建議。正如往常所說,風險管理比「猜對」更重要。
你怎麼看?你認為在下一輪爆發式反彈之前,比特幣會回測 $50K 嗎?還是多頭會直接
#Bitcoin #BTC #Crypto #TechnicalAnalysis
#BinanceSquare
📊 比特幣展望:下一波重大多頭行情前的修正?🚀
根據我的技術分析,目前比特幣正處於修正階段;價格被限制在一個清晰定義的支撐與壓力區間內,導致短期方向不確定。
我的圖表顯示,BTC 可能會繼續向 $72,876 區域的修正走勢推進,這也對應到 61.8% 的斐波那契黃金比率。這是一個我預期將出現強烈拋售壓力的關鍵區域。
如果這次反彈遭到拒絕,比特幣可能會出現急劇下跌,甚至跌破 $60,000 的支撐,並延伸至 $49,965 的需求區。
我認為 $49,965 可能會成為修正結束的拐點,並成為下一段重大多頭行情的發射台。從那裡開始,比特幣可能重新獲得動能,突破先前的歷史新高,並把目標指向 $125,000–$150,000。
📌 需要特別留意的關鍵位:
🎯 斐波那契 61.8%:$72,876
🛑 主要支撐:$60,000
💎 潛在反轉區:$49,965
🚀 多頭行情目標:$125,000–$150,000
以上是我的個人技術觀點,並非財務建議。正如往常所說,風險管理比「猜對」更重要。
你怎麼看?你認為在下一輪爆發式反彈之前,比特幣會回測 $50K 嗎?還是多頭會直接
#Bitcoin #BTC #Crypto #TechnicalAnalysis
#BinanceSquare
根據我的技術分析,目前比特幣正處於修正階段;價格被限制在一個清晰定義的支撐與壓力區間內,導致短期方向不確定。
我的圖表顯示,BTC 可能會繼續向 $72,876 區域的修正走勢推進,這也對應到 61.8% 的斐波那契黃金比率。這是一個我預期將出現強烈拋售壓力的關鍵區域。
如果這次反彈遭到拒絕,比特幣可能會出現急劇下跌,甚至跌破 $60,000 的支撐,並延伸至 $49,965 的需求區。
我認為 $49,965 可能會成為修正結束的拐點,並成為下一段重大多頭行情的發射台。從那裡開始,比特幣可能重新獲得動能,突破先前的歷史新高,並把目標指向 $125,000–$150,000。
📌 需要特別留意的關鍵位:
🎯 斐波那契 61.8%:$72,876
🛑 主要支撐:$60,000
💎 潛在反轉區:$49,965
🚀 多頭行情目標:$125,000–$150,000
以上是我的個人技術觀點,並非財務建議。正如往常所說,風險管理比「猜對」更重要。
你怎麼看?你認為在下一輪爆發式反彈之前,比特幣會回測 $50K 嗎?還是多頭會直接
#Bitcoin #BTC #Crypto #TechnicalAnalysis
#BinanceSquare
1
216
·
--
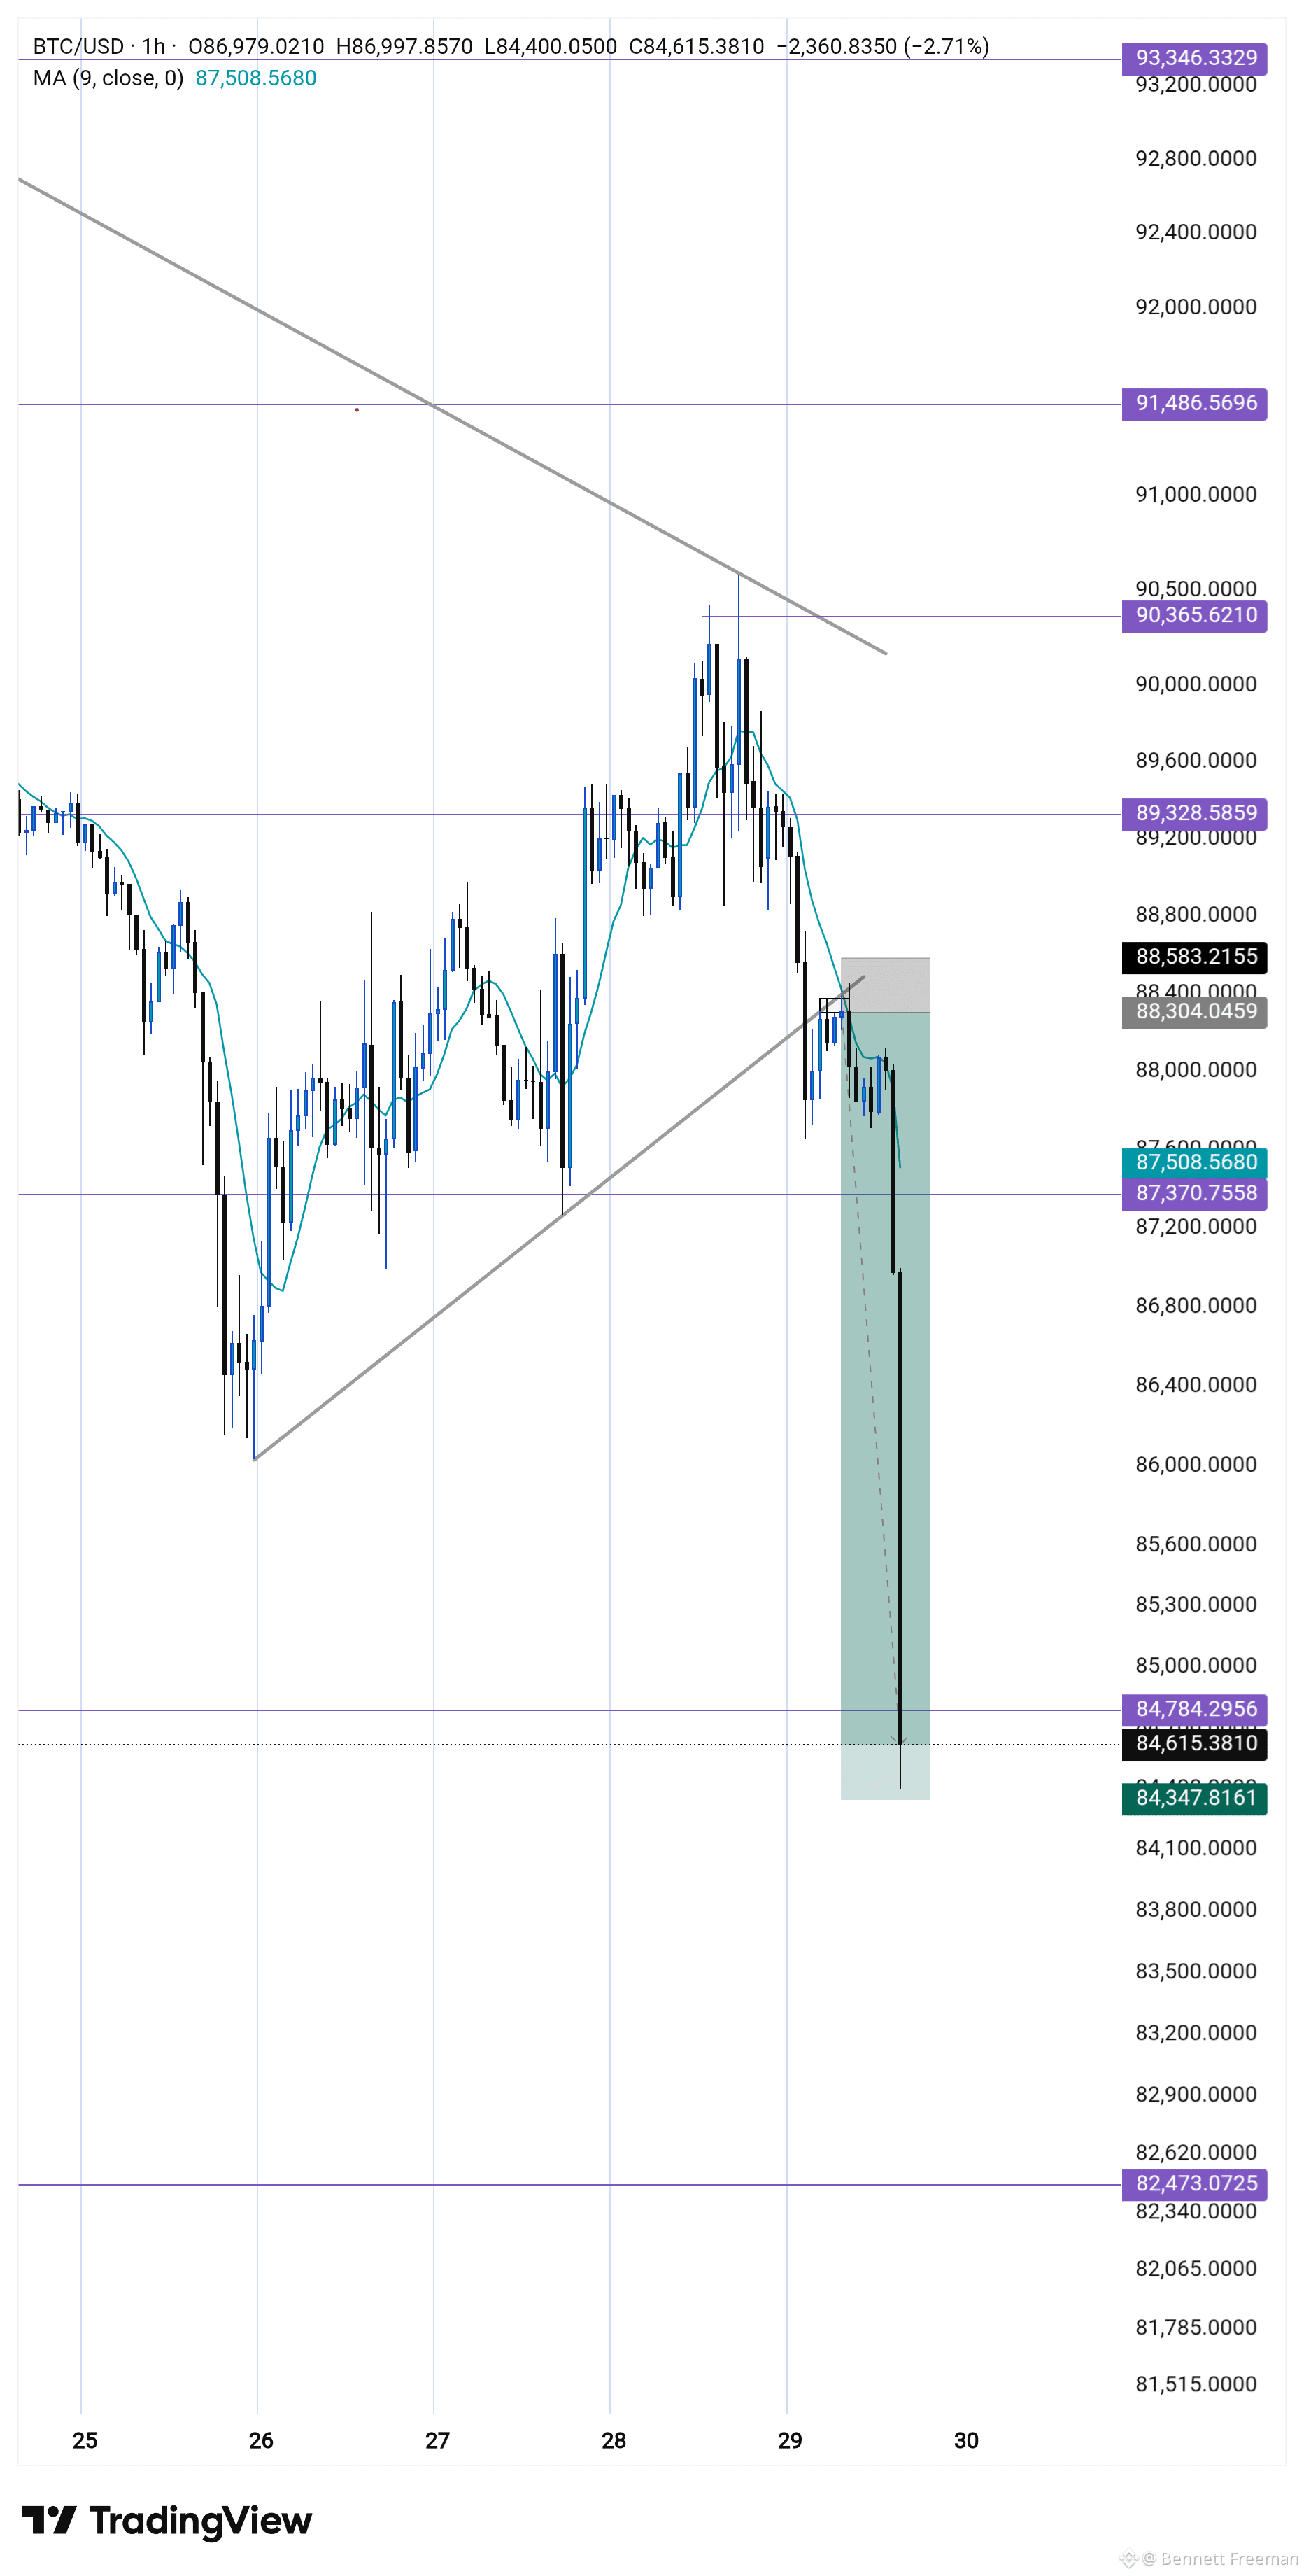
在$BTC 打印出一系列更高的高點和更低的低點後,價格推入了61%的斐波那契黃金區間,在那裏形成了一個雙頂結構。
在那個水平進入需要一個較大的止損,因此我保持耐心,等待確認。價格隨後突破了上升趨勢線,並在後續重新測試,暗示市場結構可能發生變化。
我最初的進入稍微早了一點,並被止損出局,但我保持了紀律。我等待了一個4小時的蠟燭收盤,這在重新測試時打印出了一個明顯的看跌吞沒形態。
那個確認提供了一個高概率的交易設置,我進入了一個短倉,目標是84k區域,與下一個關鍵支撐區對齊。
#StrategyBTCPurchase
#GoldOnTheRise
在$BTC 打印出一系列更高的高點和更低的低點後,價格推入了61%的斐波那契黃金區間,在那裏形成了一個雙頂結構。
在那個水平進入需要一個較大的止損,因此我保持耐心,等待確認。價格隨後突破了上升趨勢線,並在後續重新測試,暗示市場結構可能發生變化。
我最初的進入稍微早了一點,並被止損出局,但我保持了紀律。我等待了一個4小時的蠟燭收盤,這在重新測試時打印出了一個明顯的看跌吞沒形態。
那個確認提供了一個高概率的交易設置,我進入了一個短倉,目標是84k區域,與下一個關鍵支撐區對齊。
#StrategyBTCPurchase
#GoldOnTheRise
在那個水平進入需要一個較大的止損,因此我保持耐心,等待確認。價格隨後突破了上升趨勢線,並在後續重新測試,暗示市場結構可能發生變化。
我最初的進入稍微早了一點,並被止損出局,但我保持了紀律。我等待了一個4小時的蠟燭收盤,這在重新測試時打印出了一個明顯的看跌吞沒形態。
那個確認提供了一個高概率的交易設置,我進入了一個短倉,目標是84k區域,與下一個關鍵支撐區對齊。
#StrategyBTCPurchase
#GoldOnTheRise
40
·
--
$BTC /USD市場結構分析 📊
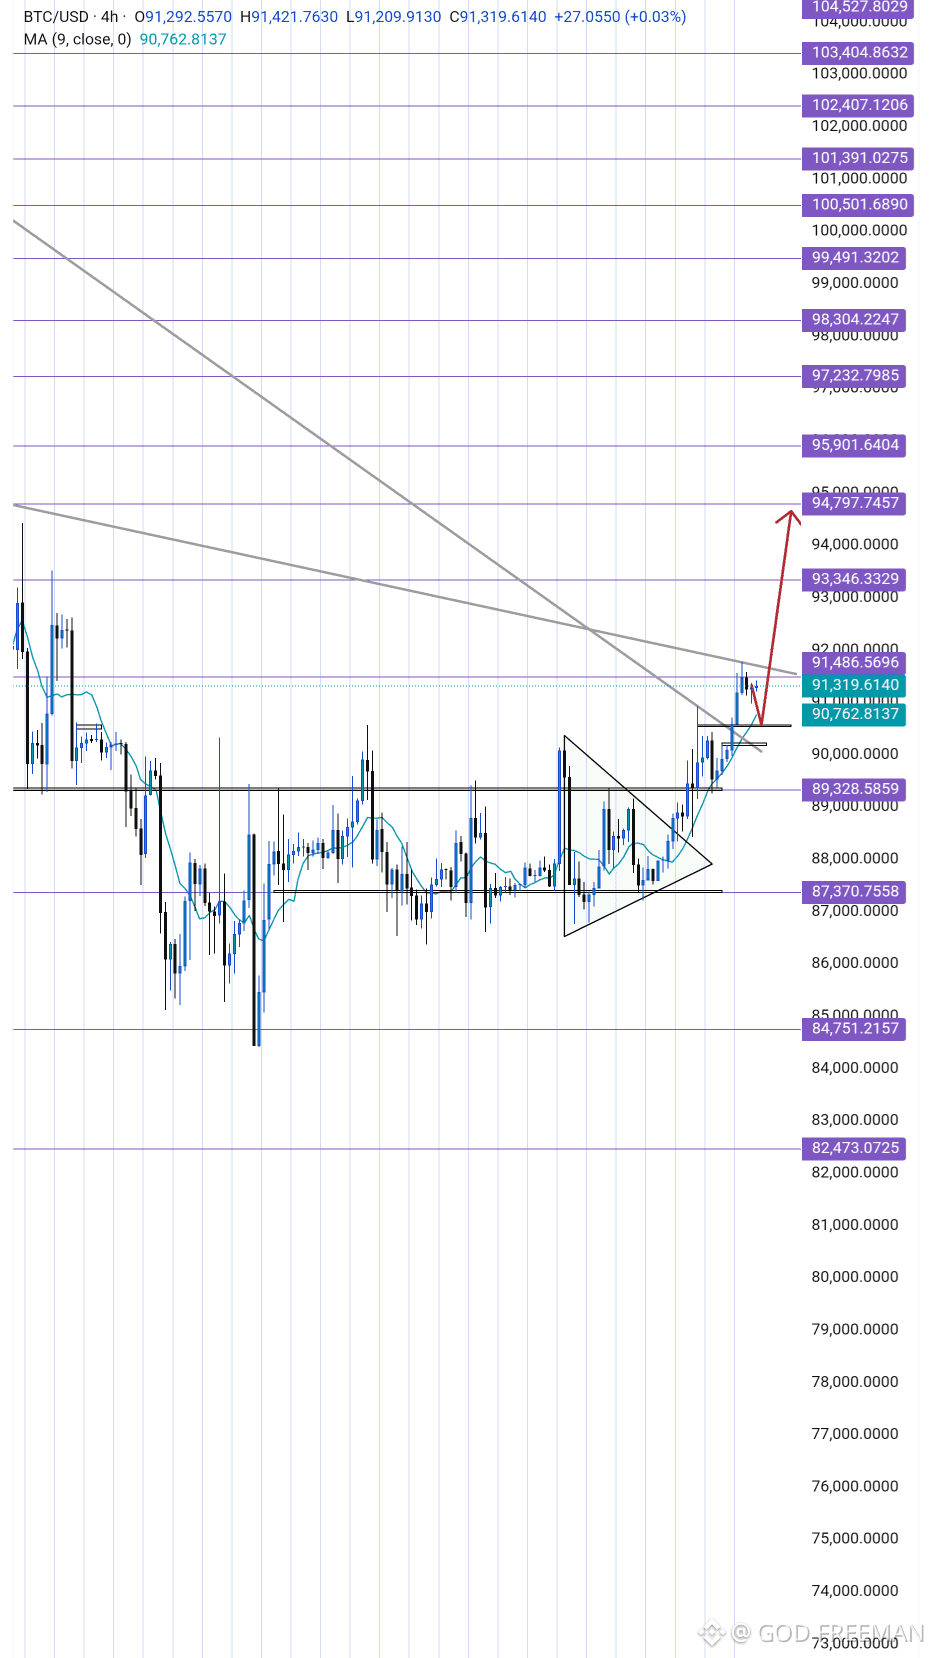
比特幣繼續尊重90,000的支撐區,這仍然是當前牛市趨勢的支柱。價格已經突破整合,並且現在在關鍵結構水平上保持強勁。
只要$BTC 重新測試90,000並且在沒有決定性下跌的情況下保持,這種看漲偏見仍然有效。這個水平作爲一個關鍵需求區,支持進一步的上漲擴展。
📈 看漲情景:
°在90K有強大的結構支撐
°確認了更高的低點
°動能有利於延續
°持續的強勁增加了向126K歷史新高移動的概率
⚠️ 風險提示:
如果確認突破並收盤低於90K,將使這一看漲前景失效。
你有什麼想法?👇👇👇🤔🤔
🚫 不是財務建議。自行研究。
#FOMCWatch
#BinanceHODLerMorpho
#CPIWatch✨
#WriteToEarnUpgradel
#BTCVSGOLD
$BTC /USD市場結構分析 📊
比特幣繼續尊重90,000的支撐區,這仍然是當前牛市趨勢的支柱。價格已經突破整合,並且現在在關鍵結構水平上保持強勁。
只要$BTC 重新測試90,000並且在沒有決定性下跌的情況下保持,這種看漲偏見仍然有效。這個水平作爲一個關鍵需求區,支持進一步的上漲擴展。
📈 看漲情景:
°在90K有強大的結構支撐
°確認了更高的低點
°動能有利於延續
°持續的強勁增加了向126K歷史新高移動的概率
⚠️ 風險提示:
如果確認突破並收盤低於90K,將使這一看漲前景失效。
你有什麼想法?👇👇👇🤔🤔
🚫 不是財務建議。自行研究。
#FOMCWatch
#BinanceHODLerMorpho
#CPIWatch✨
#WriteToEarnUpgradel
#BTCVSGOLD
比特幣繼續尊重90,000的支撐區,這仍然是當前牛市趨勢的支柱。價格已經突破整合,並且現在在關鍵結構水平上保持強勁。
只要$BTC 重新測試90,000並且在沒有決定性下跌的情況下保持,這種看漲偏見仍然有效。這個水平作爲一個關鍵需求區,支持進一步的上漲擴展。
📈 看漲情景:
°在90K有強大的結構支撐
°確認了更高的低點
°動能有利於延續
°持續的強勁增加了向126K歷史新高移動的概率
⚠️ 風險提示:
如果確認突破並收盤低於90K,將使這一看漲前景失效。
你有什麼想法?👇👇👇🤔🤔
🚫 不是財務建議。自行研究。
#FOMCWatch
#BinanceHODLerMorpho
#CPIWatch✨
#WriteToEarnUpgradel
#BTCVSGOLD
9
124
·
--
🧐 BTC/USD:在4小時圖上測試關鍵阻力
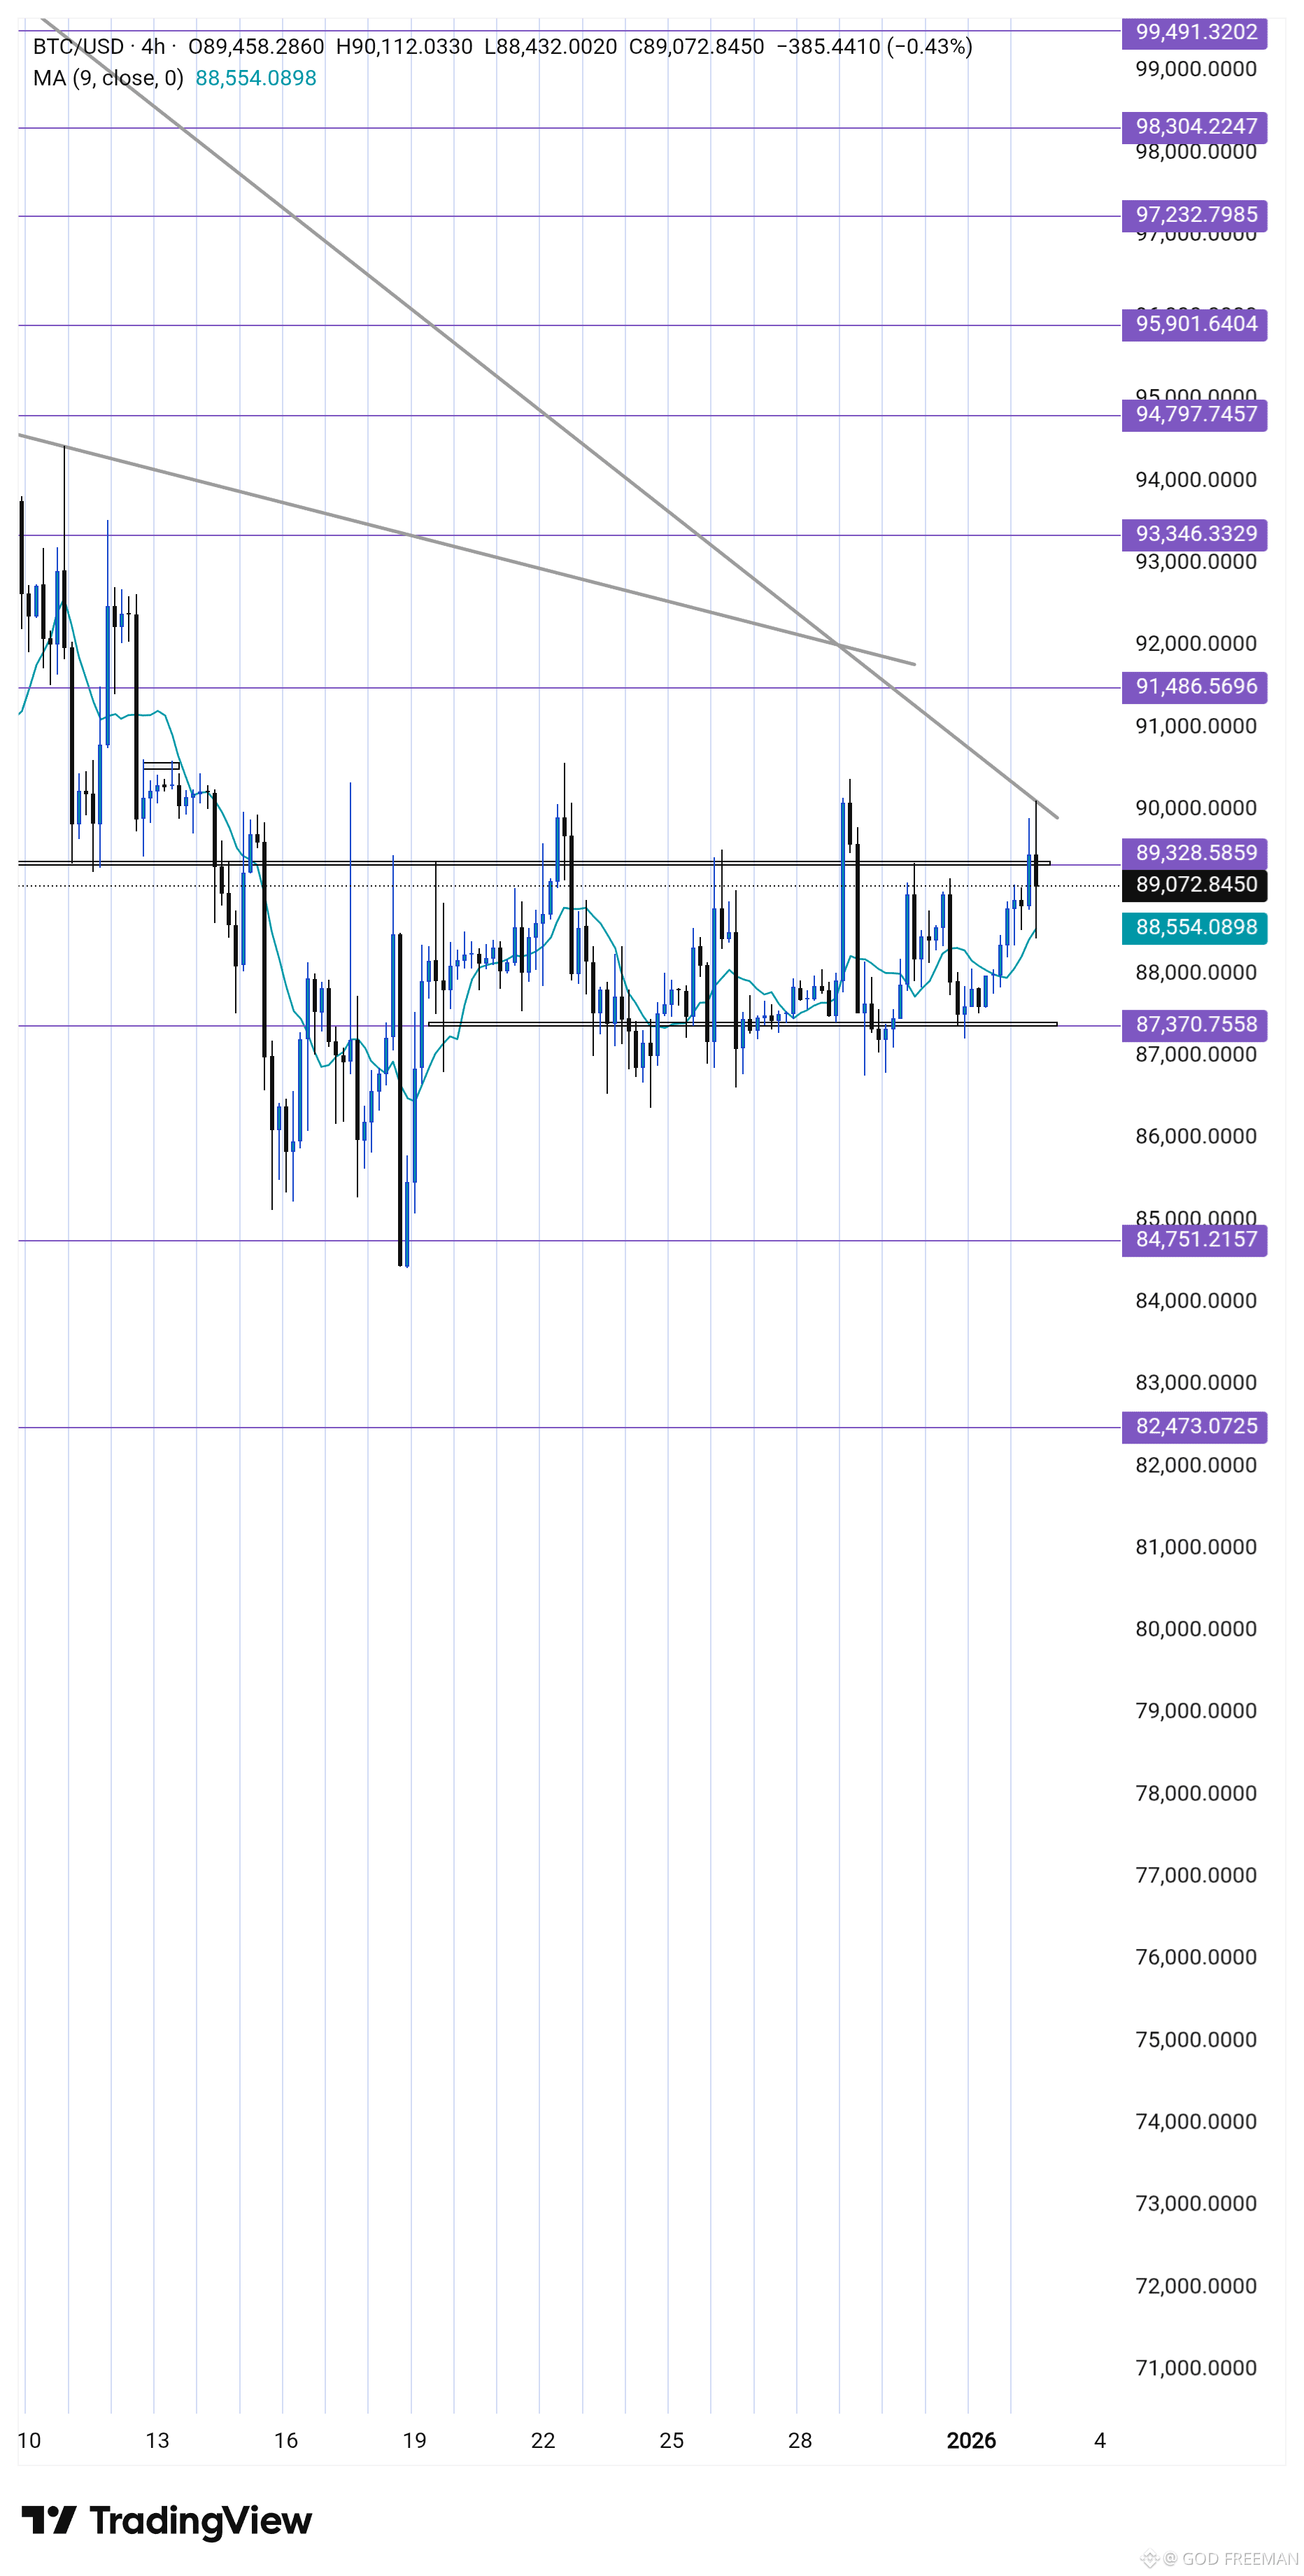
比特幣目前正面臨一個重大阻力區,標記為下降趨勢線(上方的灰色線)。
當前價格:約為 $$$89,672。
關鍵阻力測試:價格正好位於下降阻力趨勢線與心理關口 $$$90,000 水平的交匯處。
關鍵支撐:即時支撐位於 $$$87,000 水平線附近,而9期移動平均線(MA)目前位於 $$$88,554,為當前價格下方提供動態支撐。
📈 關注重點:
突破確認:若價格明確突破並收於趨勢線及 $$$90,000 之上,將是極其看漲的信號,可能開啟向 $$$93,000 和 $$$95,000 前進的大門。
反彈風險:若阻力保持不破,我們可能看到價格回撤至 $$$87,000 支撐水平。
你的看法是?看漲突破還是看跌反彈?👇
#BTC90kChristmas
#StrategyBTCPurchase
#USJobsData
#FOMCWatch
#USChinaDeal
🧐 BTC/USD:在4小時圖上測試關鍵阻力
比特幣目前正面臨一個重大阻力區,標記為下降趨勢線(上方的灰色線)。
當前價格:約為 $$$89,672。
關鍵阻力測試:價格正好位於下降阻力趨勢線與心理關口 $$$90,000 水平的交匯處。
關鍵支撐:即時支撐位於 $$$87,000 水平線附近,而9期移動平均線(MA)目前位於 $$$88,554,為當前價格下方提供動態支撐。
📈 關注重點:
突破確認:若價格明確突破並收於趨勢線及 $$$90,000 之上,將是極其看漲的信號,可能開啟向 $$$93,000 和 $$$95,000 前進的大門。
反彈風險:若阻力保持不破,我們可能看到價格回撤至 $$$87,000 支撐水平。
你的看法是?看漲突破還是看跌反彈?👇
#BTC90kChristmas
#StrategyBTCPurchase
#USJobsData
#FOMCWatch
#USChinaDeal
比特幣目前正面臨一個重大阻力區,標記為下降趨勢線(上方的灰色線)。
當前價格:約為 $$$89,672。
關鍵阻力測試:價格正好位於下降阻力趨勢線與心理關口 $$$90,000 水平的交匯處。
關鍵支撐:即時支撐位於 $$$87,000 水平線附近,而9期移動平均線(MA)目前位於 $$$88,554,為當前價格下方提供動態支撐。
📈 關注重點:
突破確認:若價格明確突破並收於趨勢線及 $$$90,000 之上,將是極其看漲的信號,可能開啟向 $$$93,000 和 $$$95,000 前進的大門。
反彈風險:若阻力保持不破,我們可能看到價格回撤至 $$$87,000 支撐水平。
你的看法是?看漲突破還是看跌反彈?👇
#BTC90kChristmas
#StrategyBTCPurchase
#USJobsData
#FOMCWatch
#USChinaDeal
2
1
12
171
登入以探索更多內容
加入幣安廣場中的全球加密貨幣用戶
⚡️ 獲取加密貨幣的最新和實用資訊。
💬 受到全球最大加密貨幣交易所的信任。
👍 發掘來自經過驗證創作者的真實見解。
電子郵件 / 電話號碼