

Lin Xiao
380 Bài đăng

Lin Xiao
Báo cáo
Chặn người dùng
$3.8B BTC ETF inflows but price still flat? 🤔 I explain why in 60 seconds. Daily alpha, no FOMO — just follow me ✨
Trader thường xuyên
{thời gian} năm
23 Đang theo dõi
2.0K+ Người theo dõi
3.6K+ Đã thích
Bài đăng
Tất cả
Trích dẫn
Video
PINNED
·
--
🏆 Bạn chỉ có thể nắm GIỮ MỘT đồng coin cho đến hết năm 2026. Đó là đồng nào?
🔷 ETH — vượt mốc $2,800, dòng tiền mới ETF trị giá $270M
🟣 SOL — vua về tốc độ + thanh khoản memecoin
⚪ XRP — hoạt động tốt hơn khi Chỉ số Altseason đạt 48
🟡 $BNB — cỗ máy mạnh mẽ của hệ sinh thái sàn giao dịch
Đang tải vòng quay Altseason: BTC đã bứt phá, đà thống trị đang chững lại, và các altcoin bắt đầu chuyển động. Người chọn sớm sẽ thắng. Người chờ thì mua ở đỉnh. ⏳
👇 Hãy thả MỘT mã ticker + lý do của bạn. Lập luận hay nhất sẽ được gọi tên.
🔁 Chia sẻ lại và tag một người bạn sẽ chọn sai. 😅
✅ Theo dõi để nhận tín hiệu cho vòng quay tiếp theo.
NFA. DYOR.
#Altseason #Ethereum #Solana #XRP #BinanceSquare
🏆 Bạn chỉ có thể nắm GIỮ MỘT đồng coin cho đến hết năm 2026. Đó là đồng nào?
🔷 ETH — vượt mốc $2,800, dòng tiền mới ETF trị giá $270M
🟣 SOL — vua về tốc độ + thanh khoản memecoin
⚪ XRP — hoạt động tốt hơn khi Chỉ số Altseason đạt 48
🟡 $BNB — cỗ máy mạnh mẽ của hệ sinh thái sàn giao dịch
Đang tải vòng quay Altseason: BTC đã bứt phá, đà thống trị đang chững lại, và các altcoin bắt đầu chuyển động. Người chọn sớm sẽ thắng. Người chờ thì mua ở đỉnh. ⏳
👇 Hãy thả MỘT mã ticker + lý do của bạn. Lập luận hay nhất sẽ được gọi tên.
🔁 Chia sẻ lại và tag một người bạn sẽ chọn sai. 😅
✅ Theo dõi để nhận tín hiệu cho vòng quay tiếp theo.
NFA. DYOR.
#Altseason #Ethereum #Solana #XRP #BinanceSquare
🔷 ETH — vượt mốc $2,800, dòng tiền mới ETF trị giá $270M
🟣 SOL — vua về tốc độ + thanh khoản memecoin
⚪ XRP — hoạt động tốt hơn khi Chỉ số Altseason đạt 48
🟡 $BNB — cỗ máy mạnh mẽ của hệ sinh thái sàn giao dịch
Đang tải vòng quay Altseason: BTC đã bứt phá, đà thống trị đang chững lại, và các altcoin bắt đầu chuyển động. Người chọn sớm sẽ thắng. Người chờ thì mua ở đỉnh. ⏳
👇 Hãy thả MỘT mã ticker + lý do của bạn. Lập luận hay nhất sẽ được gọi tên.
🔁 Chia sẻ lại và tag một người bạn sẽ chọn sai. 😅
✅ Theo dõi để nhận tín hiệu cho vòng quay tiếp theo.
NFA. DYOR.
#Altseason #Ethereum #Solana #XRP #BinanceSquare

3
1.1k
PINNED
·
--
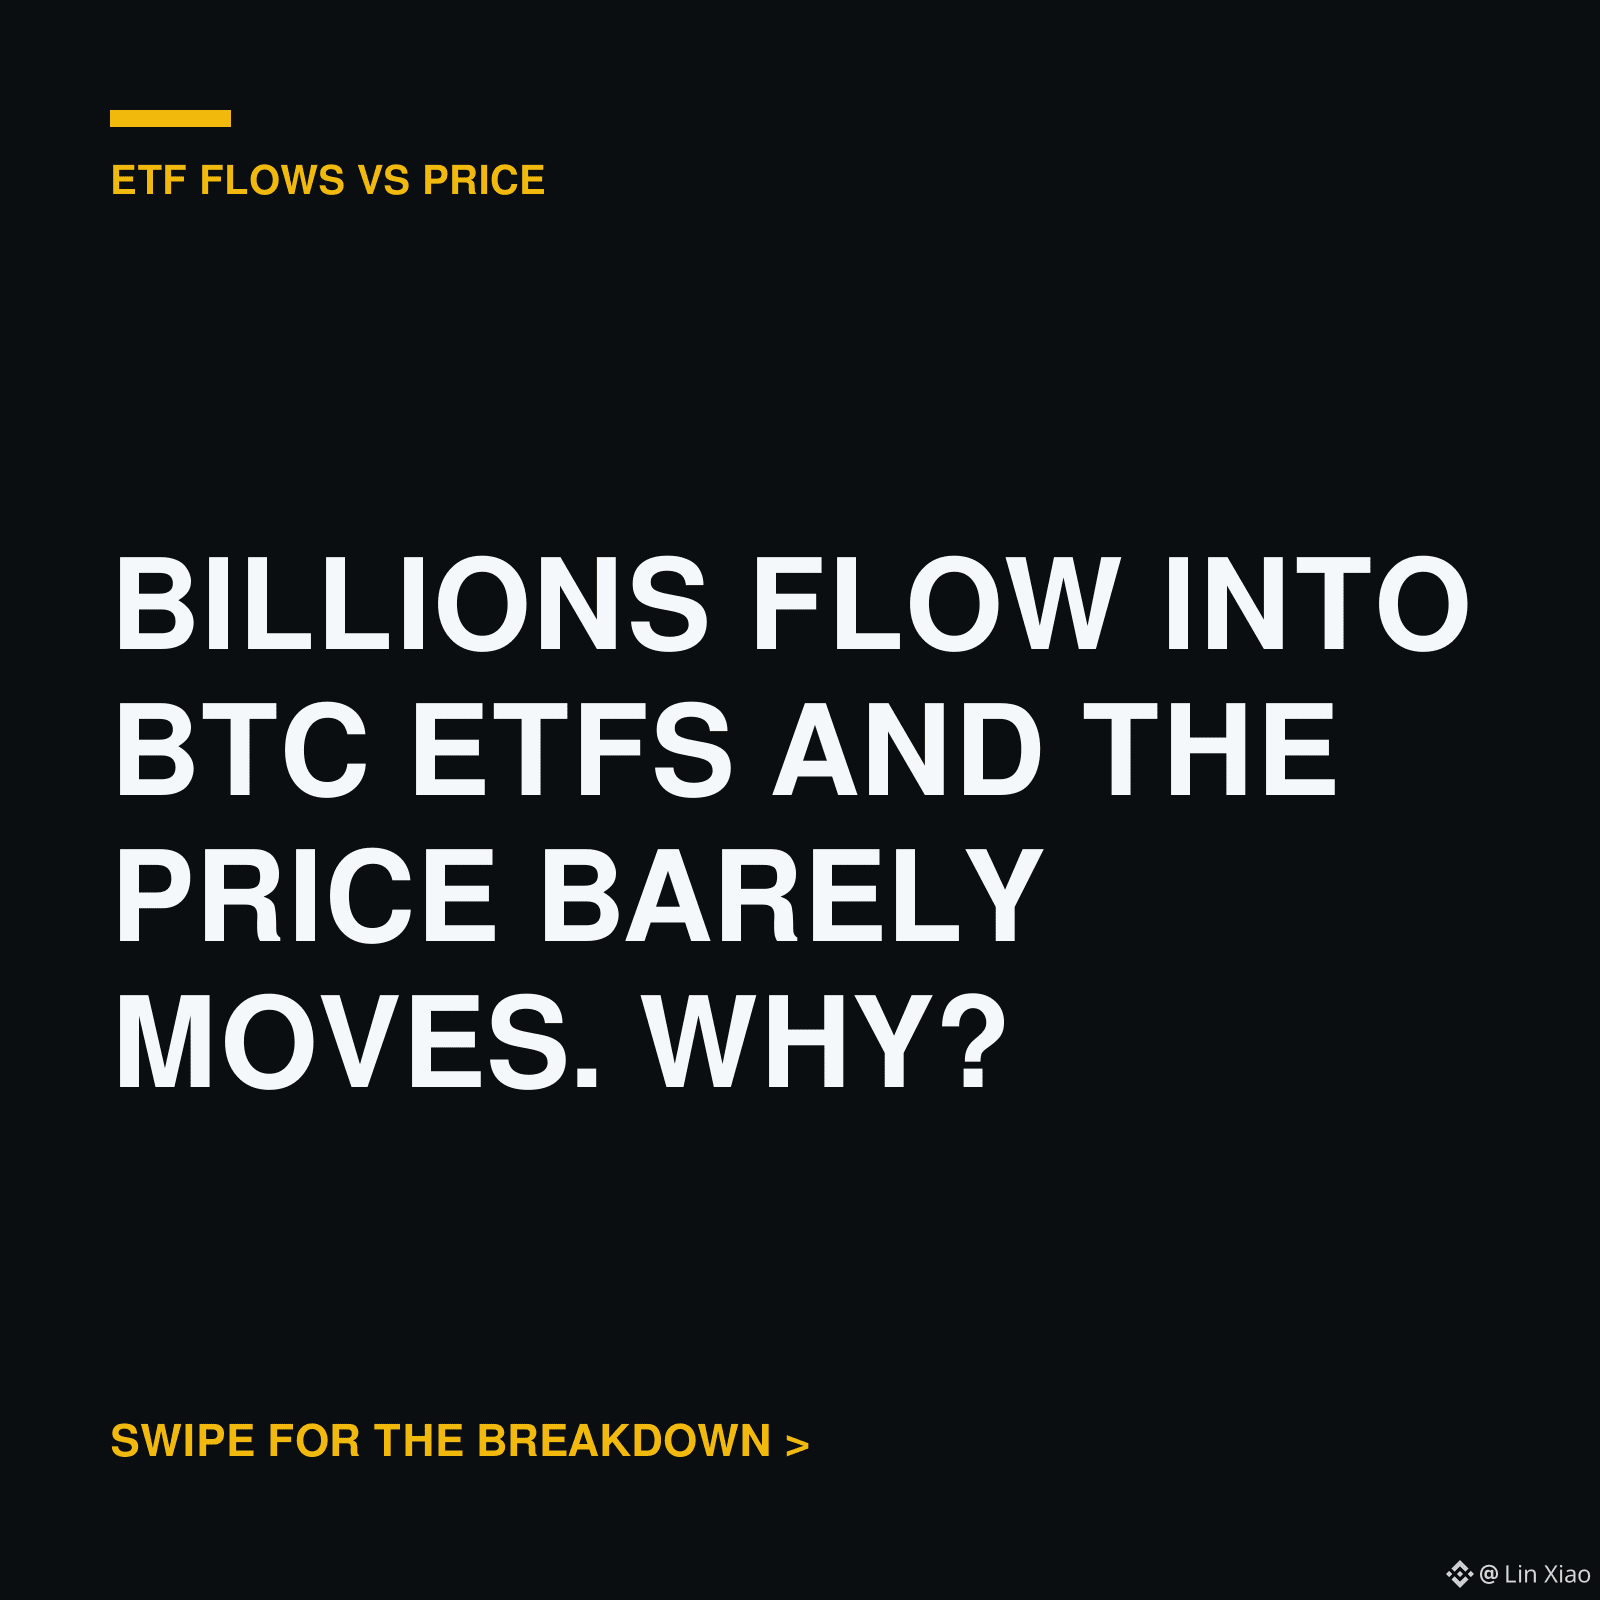
Vì sao hàng chục tỷ USD dòng tiền ETF lại khiến Bitcoin gần như không biến động? 🤔
Ai cũng đọc tiêu đề theo hướng tăng giá. Biểu đồ thì chỉ… nhún vai.
Đây là những gì phần lớn mọi người bỏ sót:
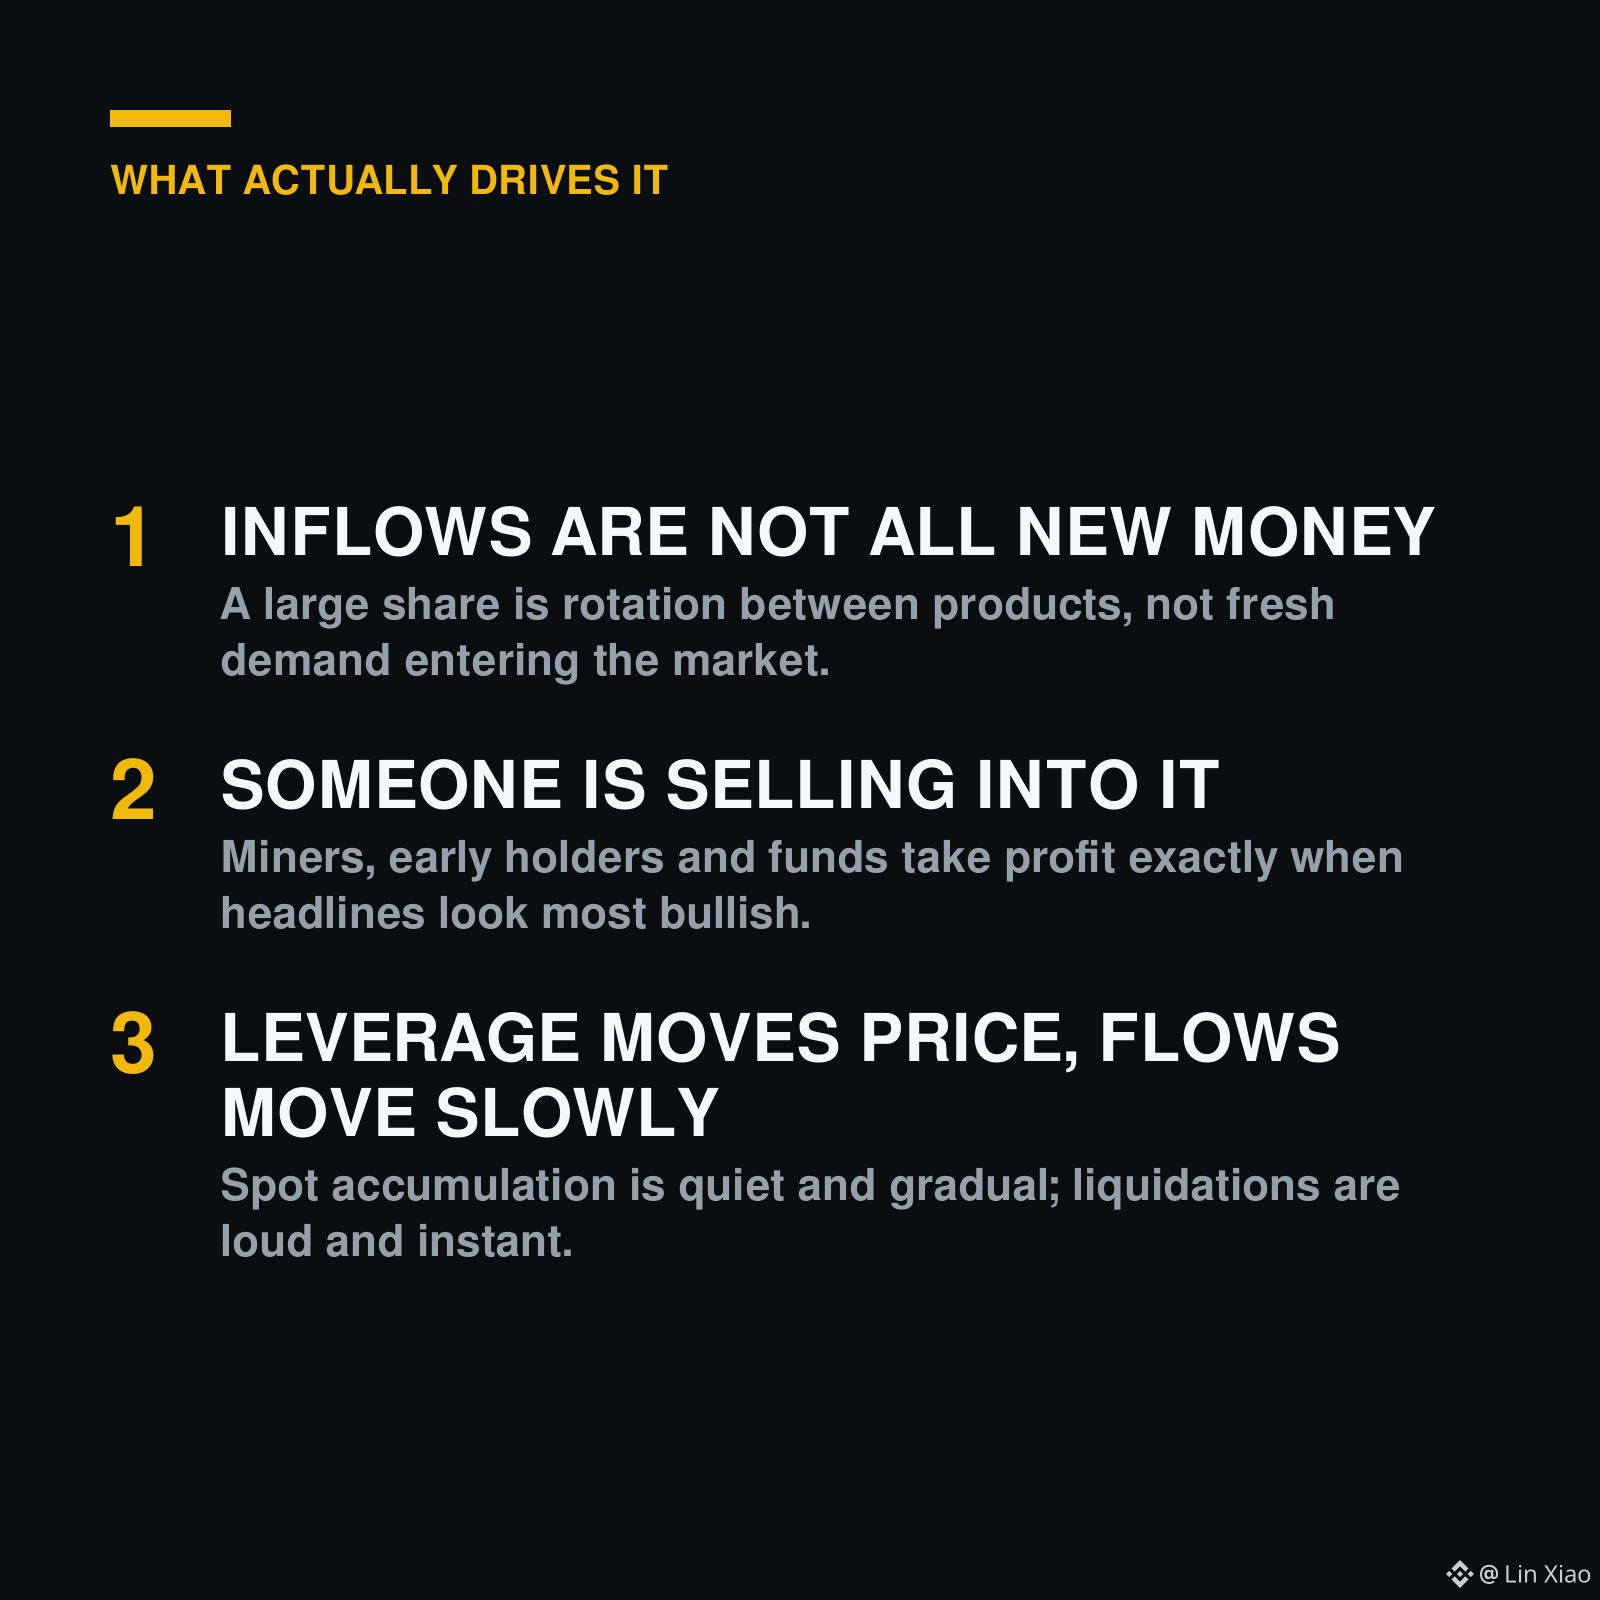
1) Dòng tiền không phải toàn bộ là tiền mới - một phần lớn là luân chuyển giữa các sản phẩm, không phải nhu cầu tươi
2) Có ai đó đang bán vào đó - thợ đào và các holder mua từ sớm chốt lời đúng lúc tin tức trông có vẻ “đẹp” nhất
3) Đòn bẩy làm giá biến động nhanh, dòng tiền spot đi chậm - một bên ồn ào, bên kia lặng lẽ
Dòng chảy cho bạn biết AI đang mua. Chúng không nói cho bạn BIẾT khi nào giá phản ứng.
Vuốt 4 slide để xem toàn bộ phân tích 👉
Bạn thấy phần nào khiến bạn bất ngờ nhất - 1, 2 hay 3? Bình luận số của bạn bên dưới.
Lưu lại cho tiêu đề “dòng tiền kỷ lục” lần tới, và theo dõi để có daily alpha, không FOMO.
#Bitcoin #ETF #CryptoNews #TradingTips $BTC $ETH
Vì sao hàng chục tỷ USD dòng tiền ETF lại khiến Bitcoin gần như không biến động? 🤔
Ai cũng đọc tiêu đề theo hướng tăng giá. Biểu đồ thì chỉ… nhún vai.
Đây là những gì phần lớn mọi người bỏ sót:
1) Dòng tiền không phải toàn bộ là tiền mới - một phần lớn là luân chuyển giữa các sản phẩm, không phải nhu cầu tươi
2) Có ai đó đang bán vào đó - thợ đào và các holder mua từ sớm chốt lời đúng lúc tin tức trông có vẻ “đẹp” nhất
3) Đòn bẩy làm giá biến động nhanh, dòng tiền spot đi chậm - một bên ồn ào, bên kia lặng lẽ
Dòng chảy cho bạn biết AI đang mua. Chúng không nói cho bạn BIẾT khi nào giá phản ứng.
Vuốt 4 slide để xem toàn bộ phân tích 👉
Bạn thấy phần nào khiến bạn bất ngờ nhất - 1, 2 hay 3? Bình luận số của bạn bên dưới.
Lưu lại cho tiêu đề “dòng tiền kỷ lục” lần tới, và theo dõi để có daily alpha, không FOMO.
#Bitcoin #ETF #CryptoNews #TradingTips $BTC $ETH
Ai cũng đọc tiêu đề theo hướng tăng giá. Biểu đồ thì chỉ… nhún vai.
Đây là những gì phần lớn mọi người bỏ sót:
1) Dòng tiền không phải toàn bộ là tiền mới - một phần lớn là luân chuyển giữa các sản phẩm, không phải nhu cầu tươi
2) Có ai đó đang bán vào đó - thợ đào và các holder mua từ sớm chốt lời đúng lúc tin tức trông có vẻ “đẹp” nhất
3) Đòn bẩy làm giá biến động nhanh, dòng tiền spot đi chậm - một bên ồn ào, bên kia lặng lẽ
Dòng chảy cho bạn biết AI đang mua. Chúng không nói cho bạn BIẾT khi nào giá phản ứng.
Vuốt 4 slide để xem toàn bộ phân tích 👉
Bạn thấy phần nào khiến bạn bất ngờ nhất - 1, 2 hay 3? Bình luận số của bạn bên dưới.
Lưu lại cho tiêu đề “dòng tiền kỷ lục” lần tới, và theo dõi để có daily alpha, không FOMO.
#Bitcoin #ETF #CryptoNews #TradingTips $BTC $ETH


1
1
63
·
--
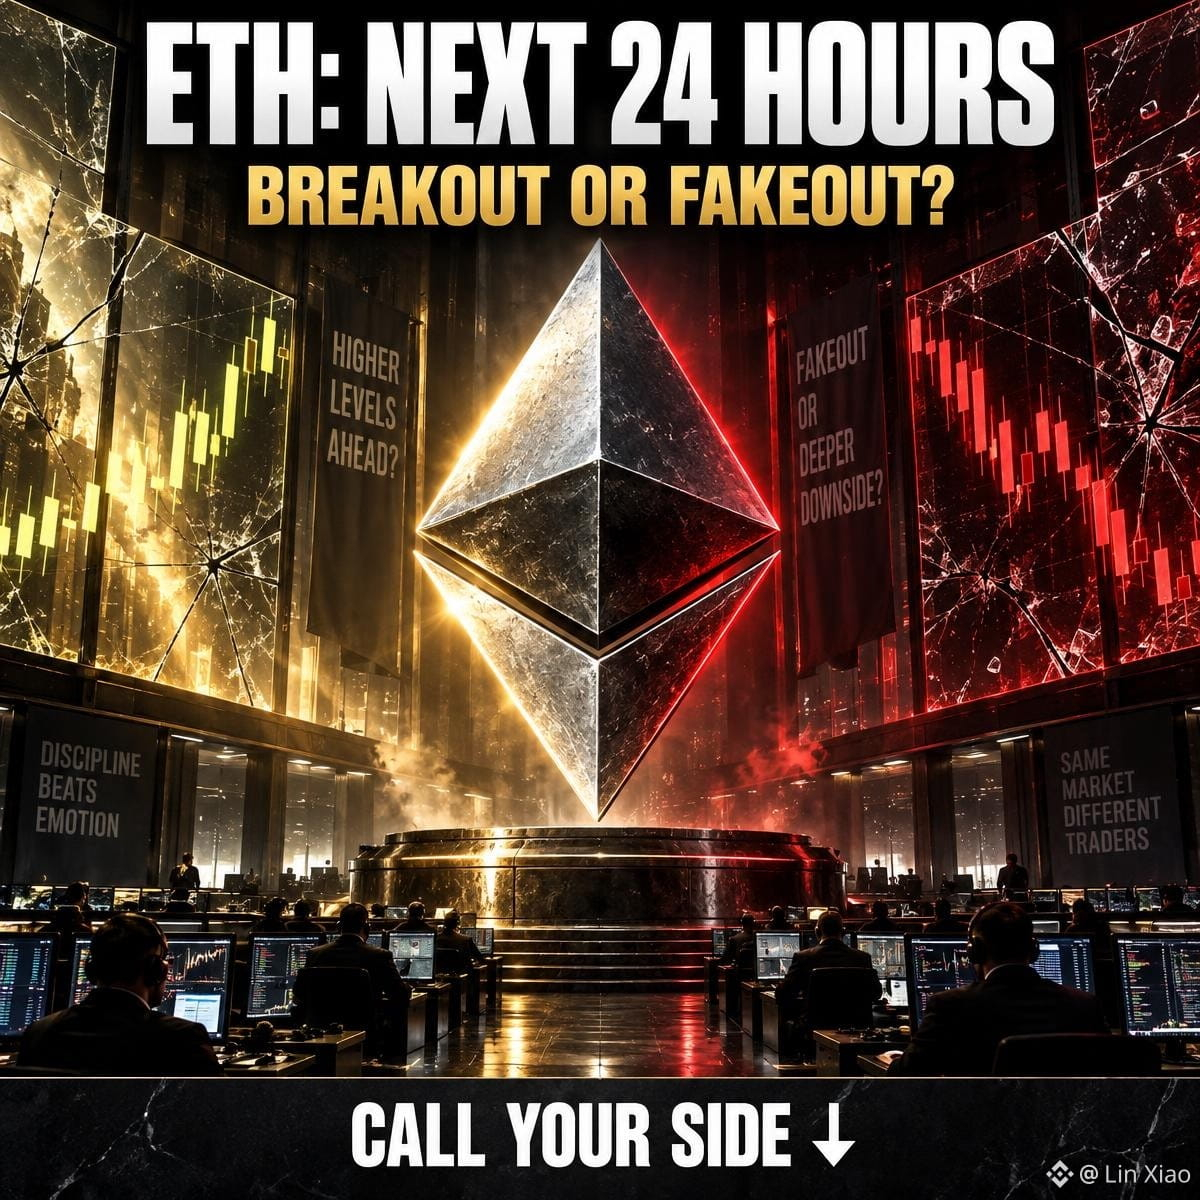
⚠️ MỘT ĐỒNG XU TRONG DANH SÁCH THEO DÕI 24 GIỜ CỦA TÔI: $ETH
Không phải vì một đột phá chắc chắn. Mà vì thiết lập xứng đáng được chú ý.
ETH giao dịch quanh $2.707 tại thời điểm tôi kiểm tra, với biên độ 24h khoảng $2.665–$2.712. Dòng tiền vào gần đây từ các quỹ ETF ETH giao ngay là một lý do để theo dõi — không phải là lời hứa về điều gì sẽ xảy ra tiếp theo.
Kế hoạch của tôi: chờ một nhịp đi lên dứt khoát vượt đỉnh gần nhất kèm khối lượng. Nếu nó bị từ chối, tôi sẽ chờ. Không mua bừa, không dùng đòn bẩy chỉ vì một tiêu đề nghe có vẻ gấp gáp.
Bạn sẽ MUA đột phá hay CHỜ đợt “giật lừa”? Comment MUA hoặc CHỜ và cho tôi biết mức giá của bạn. Theo dõi tôi, kết nối cùng nhau, và chia sẻ bài này với một người bạn cũng đang theo dõi ETH.
Tóm tắt giá: 27/09, 06:32 UTC (Binance ETH/USDT). Bối cảnh ETF: Dòng tiền vào được báo cáo vào 25/09. Thị trường biến động rất nhanh. NFA. DYOR.
#ETH #Ethereum #Crypto #Trading #MarketWatch
⚠️ MỘT ĐỒNG XU TRONG DANH SÁCH THEO DÕI 24 GIỜ CỦA TÔI: $ETH
Không phải vì một đột phá chắc chắn. Mà vì thiết lập xứng đáng được chú ý.
ETH giao dịch quanh $2.707 tại thời điểm tôi kiểm tra, với biên độ 24h khoảng $2.665–$2.712. Dòng tiền vào gần đây từ các quỹ ETF ETH giao ngay là một lý do để theo dõi — không phải là lời hứa về điều gì sẽ xảy ra tiếp theo.
Kế hoạch của tôi: chờ một nhịp đi lên dứt khoát vượt đỉnh gần nhất kèm khối lượng. Nếu nó bị từ chối, tôi sẽ chờ. Không mua bừa, không dùng đòn bẩy chỉ vì một tiêu đề nghe có vẻ gấp gáp.
Bạn sẽ MUA đột phá hay CHỜ đợt “giật lừa”? Comment MUA hoặc CHỜ và cho tôi biết mức giá của bạn. Theo dõi tôi, kết nối cùng nhau, và chia sẻ bài này với một người bạn cũng đang theo dõi ETH.
Tóm tắt giá: 27/09, 06:32 UTC (Binance ETH/USDT). Bối cảnh ETF: Dòng tiền vào được báo cáo vào 25/09. Thị trường biến động rất nhanh. NFA. DYOR.
#ETH #Ethereum #Crypto #Trading #MarketWatch
Không phải vì một đột phá chắc chắn. Mà vì thiết lập xứng đáng được chú ý.
ETH giao dịch quanh $2.707 tại thời điểm tôi kiểm tra, với biên độ 24h khoảng $2.665–$2.712. Dòng tiền vào gần đây từ các quỹ ETF ETH giao ngay là một lý do để theo dõi — không phải là lời hứa về điều gì sẽ xảy ra tiếp theo.
Kế hoạch của tôi: chờ một nhịp đi lên dứt khoát vượt đỉnh gần nhất kèm khối lượng. Nếu nó bị từ chối, tôi sẽ chờ. Không mua bừa, không dùng đòn bẩy chỉ vì một tiêu đề nghe có vẻ gấp gáp.
Bạn sẽ MUA đột phá hay CHỜ đợt “giật lừa”? Comment MUA hoặc CHỜ và cho tôi biết mức giá của bạn. Theo dõi tôi, kết nối cùng nhau, và chia sẻ bài này với một người bạn cũng đang theo dõi ETH.
Tóm tắt giá: 27/09, 06:32 UTC (Binance ETH/USDT). Bối cảnh ETF: Dòng tiền vào được báo cáo vào 25/09. Thị trường biến động rất nhanh. NFA. DYOR.
#ETH #Ethereum #Crypto #Trading #MarketWatch
1
86
·
--
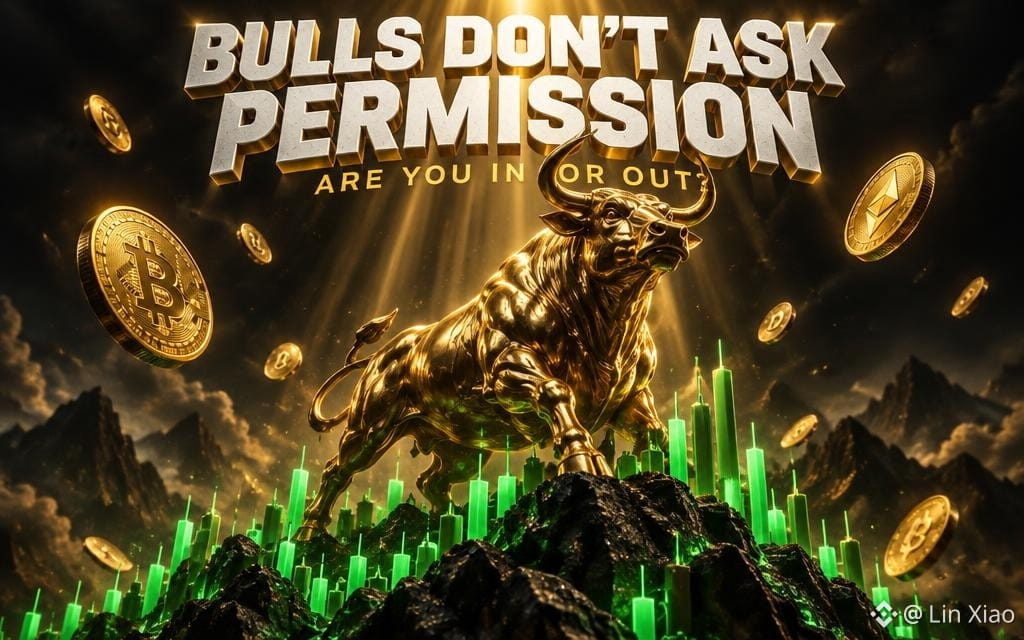
Bò không xin phép.
Chúng không chờ sự xác nhận từ đám đông. Chúng không nài nỉ thị trường phải chuyển động.
Chúng định vị. Chúng chờ. Chúng ra đòn.
— chặng tiếp theo thưởng cho sự kiên định, không phải do dự.
Bạn vào hay ra? Trên chuyến đi này không có chỗ ngồi trung lập.
Nếu bạn di chuyển với sự kiên định, hãy theo tôi. Làm bạn ở đây nhé — tôi chia sẻ mức của tôi, bạn chia sẻ của bạn, và chúng ta cùng thắng sắc hơn.
Bình luận IN hoặc OUT. Không có kẻ lén lút theo dõi. Chia lại cho một người bạn vẫn đang đứng giữa.
#Crypto #BullRun #Bitcoin #BinanceSquare #Trading
NFA. DYOR.
Bò không xin phép.
Chúng không chờ sự xác nhận từ đám đông. Chúng không nài nỉ thị trường phải chuyển động.
Chúng định vị. Chúng chờ. Chúng ra đòn.
— chặng tiếp theo thưởng cho sự kiên định, không phải do dự.
Bạn vào hay ra? Trên chuyến đi này không có chỗ ngồi trung lập.
Nếu bạn di chuyển với sự kiên định, hãy theo tôi. Làm bạn ở đây nhé — tôi chia sẻ mức của tôi, bạn chia sẻ của bạn, và chúng ta cùng thắng sắc hơn.
Bình luận IN hoặc OUT. Không có kẻ lén lút theo dõi. Chia lại cho một người bạn vẫn đang đứng giữa.
#Crypto #BullRun #Bitcoin #BinanceSquare #Trading
NFA. DYOR.
Chúng không chờ sự xác nhận từ đám đông. Chúng không nài nỉ thị trường phải chuyển động.
Chúng định vị. Chúng chờ. Chúng ra đòn.
— chặng tiếp theo thưởng cho sự kiên định, không phải do dự.
Bạn vào hay ra? Trên chuyến đi này không có chỗ ngồi trung lập.
Nếu bạn di chuyển với sự kiên định, hãy theo tôi. Làm bạn ở đây nhé — tôi chia sẻ mức của tôi, bạn chia sẻ của bạn, và chúng ta cùng thắng sắc hơn.
Bình luận IN hoặc OUT. Không có kẻ lén lút theo dõi. Chia lại cho một người bạn vẫn đang đứng giữa.
#Crypto #BullRun #Bitcoin #BinanceSquare #Trading
NFA. DYOR.
1
77
·
--
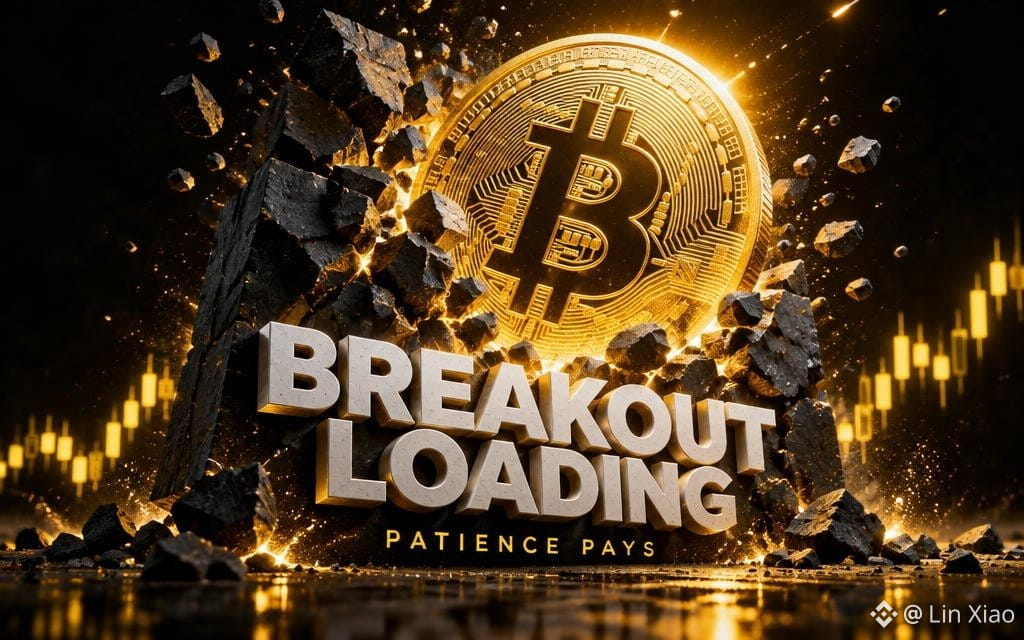
Đang tải Breakout.
Mọi huyền thoại đều từng bị gọi là điên rồ vì dám giữ.
Biểu đồ không quan tâm đến những nghi ngờ của bạn. Nó thưởng cho những người đã ở lại khi người khác rời đi.
Đang cuộn lại. Bạn có thể cảm nhận được. Khoảnh khắc yên lặng trước khi hành động luôn là tín hiệu lớn nhất.
Sự kiên nhẫn là giá trị. Nó luôn có.
Nếu bạn đang xây dựng vị thế trong khi người khác xây dựng lời bào chữa, hãy theo tôi. Chúng ta làm bạn nhé — tư duy sắc bén thu hút tư duy sắc bén.
Bình luận LOADING nếu bạn đang có vị thế. Chia sẻ lại cho một người bạn cần kiên nhẫn hôm nay.
#Bitcoin #Crypto #Breakout #BinanceSquare #HODL
NFA. DYOR.
Đang tải Breakout.
Mọi huyền thoại đều từng bị gọi là điên rồ vì dám giữ.
Biểu đồ không quan tâm đến những nghi ngờ của bạn. Nó thưởng cho những người đã ở lại khi người khác rời đi.
Đang cuộn lại. Bạn có thể cảm nhận được. Khoảnh khắc yên lặng trước khi hành động luôn là tín hiệu lớn nhất.
Sự kiên nhẫn là giá trị. Nó luôn có.
Nếu bạn đang xây dựng vị thế trong khi người khác xây dựng lời bào chữa, hãy theo tôi. Chúng ta làm bạn nhé — tư duy sắc bén thu hút tư duy sắc bén.
Bình luận LOADING nếu bạn đang có vị thế. Chia sẻ lại cho một người bạn cần kiên nhẫn hôm nay.
#Bitcoin #Crypto #Breakout #BinanceSquare #HODL
NFA. DYOR.
Mọi huyền thoại đều từng bị gọi là điên rồ vì dám giữ.
Biểu đồ không quan tâm đến những nghi ngờ của bạn. Nó thưởng cho những người đã ở lại khi người khác rời đi.
Đang cuộn lại. Bạn có thể cảm nhận được. Khoảnh khắc yên lặng trước khi hành động luôn là tín hiệu lớn nhất.
Sự kiên nhẫn là giá trị. Nó luôn có.
Nếu bạn đang xây dựng vị thế trong khi người khác xây dựng lời bào chữa, hãy theo tôi. Chúng ta làm bạn nhé — tư duy sắc bén thu hút tư duy sắc bén.
Bình luận LOADING nếu bạn đang có vị thế. Chia sẻ lại cho một người bạn cần kiên nhẫn hôm nay.
#Bitcoin #Crypto #Breakout #BinanceSquare #HODL
NFA. DYOR.
1
85
·
--
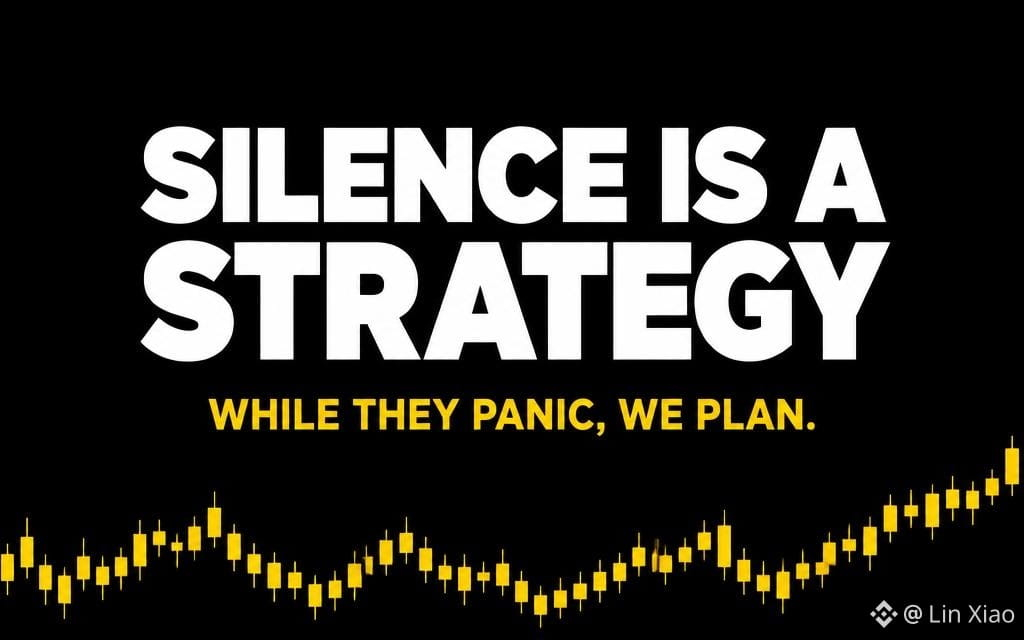
Sự im lặng là một chiến lược.
Những nhà giao dịch ồn ào nhất trên nguồn cấp của bạn thường là những người đang thua một cách lặng lẽ.
Trong khi mọi người hoảng loạn trước mỗi cây nến đỏ, người chiến thắng lại đang làm một việc rất “nhàm chán”: chờ đợi. Lên kế hoạch. Thực thi.
không thưởng cho tiếng ồn. Nó thưởng cho sự kiên nhẫn đi kèm một kế hoạch.
Không hype. Không sợ hãi. Chỉ có các mức giá, kỷ luật và thời gian.
Nếu bạn giao dịch theo kế hoạch thay vì cảm xúc, theo dõi tôi. Hãy làm bạn ở đây — tôi chia sẻ những gì tôi thấy, bạn chia sẻ những gì bạn thấy, và chúng ta đều trở nên sắc bén hơn.
Bình luận SILENT nếu bạn giao dịch trong im lặng. Chia sẻ lại bài này cho một người bạn giao dịch quá ồn.
#Crypto #Bitcoin #TradingMindset #BinanceSquare #DYOR
NFA. DYOR.
Sự im lặng là một chiến lược.
Những nhà giao dịch ồn ào nhất trên nguồn cấp của bạn thường là những người đang thua một cách lặng lẽ.
Trong khi mọi người hoảng loạn trước mỗi cây nến đỏ, người chiến thắng lại đang làm một việc rất “nhàm chán”: chờ đợi. Lên kế hoạch. Thực thi.
không thưởng cho tiếng ồn. Nó thưởng cho sự kiên nhẫn đi kèm một kế hoạch.
Không hype. Không sợ hãi. Chỉ có các mức giá, kỷ luật và thời gian.
Nếu bạn giao dịch theo kế hoạch thay vì cảm xúc, theo dõi tôi. Hãy làm bạn ở đây — tôi chia sẻ những gì tôi thấy, bạn chia sẻ những gì bạn thấy, và chúng ta đều trở nên sắc bén hơn.
Bình luận SILENT nếu bạn giao dịch trong im lặng. Chia sẻ lại bài này cho một người bạn giao dịch quá ồn.
#Crypto #Bitcoin #TradingMindset #BinanceSquare #DYOR
NFA. DYOR.
Những nhà giao dịch ồn ào nhất trên nguồn cấp của bạn thường là những người đang thua một cách lặng lẽ.
Trong khi mọi người hoảng loạn trước mỗi cây nến đỏ, người chiến thắng lại đang làm một việc rất “nhàm chán”: chờ đợi. Lên kế hoạch. Thực thi.
không thưởng cho tiếng ồn. Nó thưởng cho sự kiên nhẫn đi kèm một kế hoạch.
Không hype. Không sợ hãi. Chỉ có các mức giá, kỷ luật và thời gian.
Nếu bạn giao dịch theo kế hoạch thay vì cảm xúc, theo dõi tôi. Hãy làm bạn ở đây — tôi chia sẻ những gì tôi thấy, bạn chia sẻ những gì bạn thấy, và chúng ta đều trở nên sắc bén hơn.
Bình luận SILENT nếu bạn giao dịch trong im lặng. Chia sẻ lại bài này cho một người bạn giao dịch quá ồn.
#Crypto #Bitcoin #TradingMindset #BinanceSquare #DYOR
NFA. DYOR.
1
91
·
--
Quản lý rủi ro & tính toán nhanh trong tài chính thường là yếu tố tạo nên khác biệt giữa quyết định theo cảm xúc và quyết định lý trí.
Nhiều trader hoặc nhà đầu tư hay tính sai tỷ lệ drawdown và mức % gain thực sự cần bao nhiêu chỉ để quay lại vốn (hòa vốn/breakeven). Ví dụ, lỗ tạm thời -20% cần hồi phục +25%, nhưng lỗ -50% lại cần mức tăng +100% chỉ để đạt BEP.
Với các phép tính thực tế như tính toán margin, ước tính lãi suất trả góp, hoặc mô phỏng tài chính hằng ngày mà không rắc rối với công thức phức tạp, các bạn có thể thử các công cụ utility đơn giản tại:
kalkulatorkilat.my.id
Luôn ưu tiên quản lý rủi ro trước khi vào lệnh! 📊
#Crypto #TradingTips #RiskManagement #Finance #BinanceSquare
Quản lý rủi ro & tính toán nhanh trong tài chính thường là yếu tố tạo nên khác biệt giữa quyết định theo cảm xúc và quyết định lý trí.
Nhiều trader hoặc nhà đầu tư hay tính sai tỷ lệ drawdown và mức % gain thực sự cần bao nhiêu chỉ để quay lại vốn (hòa vốn/breakeven). Ví dụ, lỗ tạm thời -20% cần hồi phục +25%, nhưng lỗ -50% lại cần mức tăng +100% chỉ để đạt BEP.
Với các phép tính thực tế như tính toán margin, ước tính lãi suất trả góp, hoặc mô phỏng tài chính hằng ngày mà không rắc rối với công thức phức tạp, các bạn có thể thử các công cụ utility đơn giản tại:
kalkulatorkilat.my.id
Luôn ưu tiên quản lý rủi ro trước khi vào lệnh! 📊
#Crypto #TradingTips #RiskManagement #Finance #BinanceSquare
Nhiều trader hoặc nhà đầu tư hay tính sai tỷ lệ drawdown và mức % gain thực sự cần bao nhiêu chỉ để quay lại vốn (hòa vốn/breakeven). Ví dụ, lỗ tạm thời -20% cần hồi phục +25%, nhưng lỗ -50% lại cần mức tăng +100% chỉ để đạt BEP.
Với các phép tính thực tế như tính toán margin, ước tính lãi suất trả góp, hoặc mô phỏng tài chính hằng ngày mà không rắc rối với công thức phức tạp, các bạn có thể thử các công cụ utility đơn giản tại:
kalkulatorkilat.my.id
Luôn ưu tiên quản lý rủi ro trước khi vào lệnh! 📊
#Crypto #TradingTips #RiskManagement #Finance #BinanceSquare
1
15
·
--
Thị trường trả công cho người kiên nhẫn.
Người thiếu kiên nhẫn mua đỉnh vì một cây nến xanh.
Người thiếu kiên nhẫn bán đáy vì một cây nến đỏ.
Người thiếu kiên nhẫn gọi đó là xui xẻo.
Chẳng bao giờ là may mắn. Đó là một kế hoạch mà họ chưa từng có.
Người kiên nhẫn làm những việc nhàm chán:
Họ đặt lệnh trước khi bơm.
Họ chốt lời khi người khác chỉ mơ mộng.
Họ ngồi trên tiền mặt và không cảm thấy gì.
Nhàm chán là lợi thế mà chẳng ai muốn.
Comment "PATIENT" nếu bạn giao dịch theo một kế hoạch, không phải theo cảm hứng.
Theo dõi tôi cho bài đăng tiếp theo. Hãy làm bạn với nhau ở đây. Chia sẻ điều này cho ai đó cần nó ngay hôm nay.
$BTC $SOL
#CryptoSafety #BinanceSquare #DYOR #CryptoCommunity #Web3
NFA. DYOR.
Thị trường trả công cho người kiên nhẫn.
Người thiếu kiên nhẫn mua đỉnh vì một cây nến xanh.
Người thiếu kiên nhẫn bán đáy vì một cây nến đỏ.
Người thiếu kiên nhẫn gọi đó là xui xẻo.
Chẳng bao giờ là may mắn. Đó là một kế hoạch mà họ chưa từng có.
Người kiên nhẫn làm những việc nhàm chán:
Họ đặt lệnh trước khi bơm.
Họ chốt lời khi người khác chỉ mơ mộng.
Họ ngồi trên tiền mặt và không cảm thấy gì.
Nhàm chán là lợi thế mà chẳng ai muốn.
Comment "PATIENT" nếu bạn giao dịch theo một kế hoạch, không phải theo cảm hứng.
Theo dõi tôi cho bài đăng tiếp theo. Hãy làm bạn với nhau ở đây. Chia sẻ điều này cho ai đó cần nó ngay hôm nay.
$BTC $SOL
#CryptoSafety #BinanceSquare #DYOR #CryptoCommunity #Web3
NFA. DYOR.
Người thiếu kiên nhẫn mua đỉnh vì một cây nến xanh.
Người thiếu kiên nhẫn bán đáy vì một cây nến đỏ.
Người thiếu kiên nhẫn gọi đó là xui xẻo.
Chẳng bao giờ là may mắn. Đó là một kế hoạch mà họ chưa từng có.
Người kiên nhẫn làm những việc nhàm chán:
Họ đặt lệnh trước khi bơm.
Họ chốt lời khi người khác chỉ mơ mộng.
Họ ngồi trên tiền mặt và không cảm thấy gì.
Nhàm chán là lợi thế mà chẳng ai muốn.
Comment "PATIENT" nếu bạn giao dịch theo một kế hoạch, không phải theo cảm hứng.
Theo dõi tôi cho bài đăng tiếp theo. Hãy làm bạn với nhau ở đây. Chia sẻ điều này cho ai đó cần nó ngay hôm nay.
$BTC $SOL
#CryptoSafety #BinanceSquare #DYOR #CryptoCommunity #Web3
NFA. DYOR.

61
·
--
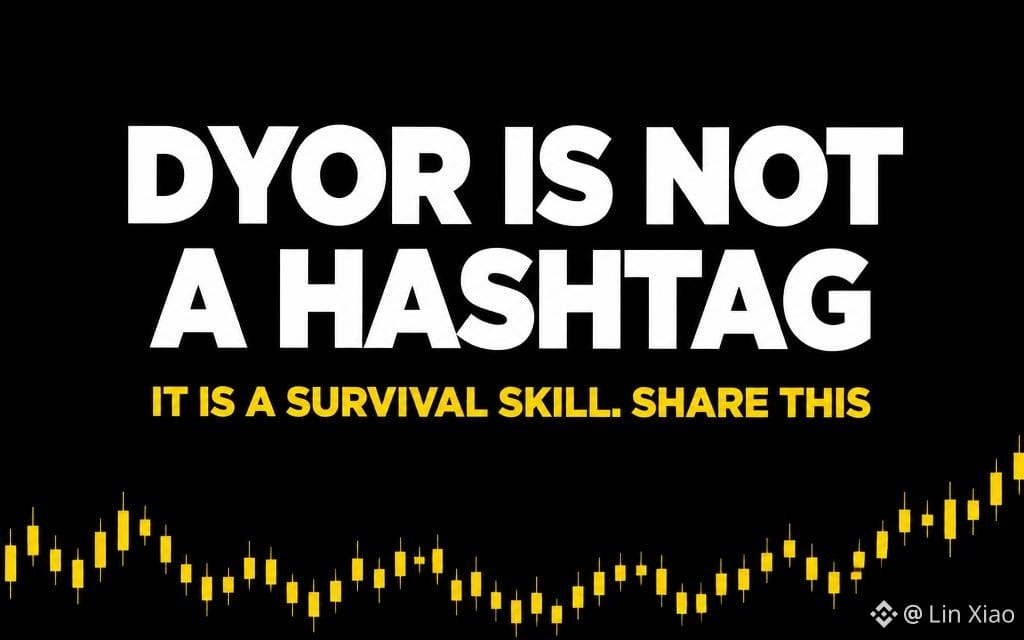
DYOR không phải là hashtag. Đó là một kỹ năng sinh tồn.
Ai cũng gõ nó. Hầu như không ai làm.
DYOR thật sự mất 15 phút:
1. Ai đứng sau dự án? Tên thật, lịch sử thật.
2. Thanh khoản ở đâu? Bị khóa hay có thể rút ra?
3. Chủ sở hữu trông như thế nào? 10 ví nắm 90% không phải là một cộng đồng.
4. Sản phẩm có tồn tại không, hay chỉ là lời hứa?
5. Điều gì xảy ra nếu đội ngũ biến mất vào ngày mai?
Thị trường không khen thưởng người mua nhanh nhất.
Nó thưởng cho người đã kiểm tra.
Gắn thẻ một người bạn mua trước và đọc sau.
Theo dõi để xem phần tiếp theo. Cùng nhau phát triển. Chia sẻ lên trang của bạn.
$ETH $BTC
#CryptoSafety #BinanceSquare #DYOR #CryptoCommunity #Web3
NFA. DYOR. Lần này nói thật.
DYOR không phải là hashtag. Đó là một kỹ năng sinh tồn.
Ai cũng gõ nó. Hầu như không ai làm.
DYOR thật sự mất 15 phút:
1. Ai đứng sau dự án? Tên thật, lịch sử thật.
2. Thanh khoản ở đâu? Bị khóa hay có thể rút ra?
3. Chủ sở hữu trông như thế nào? 10 ví nắm 90% không phải là một cộng đồng.
4. Sản phẩm có tồn tại không, hay chỉ là lời hứa?
5. Điều gì xảy ra nếu đội ngũ biến mất vào ngày mai?
Thị trường không khen thưởng người mua nhanh nhất.
Nó thưởng cho người đã kiểm tra.
Gắn thẻ một người bạn mua trước và đọc sau.
Theo dõi để xem phần tiếp theo. Cùng nhau phát triển. Chia sẻ lên trang của bạn.
$ETH $BTC
#CryptoSafety #BinanceSquare #DYOR #CryptoCommunity #Web3
NFA. DYOR. Lần này nói thật.
Ai cũng gõ nó. Hầu như không ai làm.
DYOR thật sự mất 15 phút:
1. Ai đứng sau dự án? Tên thật, lịch sử thật.
2. Thanh khoản ở đâu? Bị khóa hay có thể rút ra?
3. Chủ sở hữu trông như thế nào? 10 ví nắm 90% không phải là một cộng đồng.
4. Sản phẩm có tồn tại không, hay chỉ là lời hứa?
5. Điều gì xảy ra nếu đội ngũ biến mất vào ngày mai?
Thị trường không khen thưởng người mua nhanh nhất.
Nó thưởng cho người đã kiểm tra.
Gắn thẻ một người bạn mua trước và đọc sau.
Theo dõi để xem phần tiếp theo. Cùng nhau phát triển. Chia sẻ lên trang của bạn.
$ETH $BTC
#CryptoSafety #BinanceSquare #DYOR #CryptoCommunity #Web3
NFA. DYOR. Lần này nói thật.
47
·
--
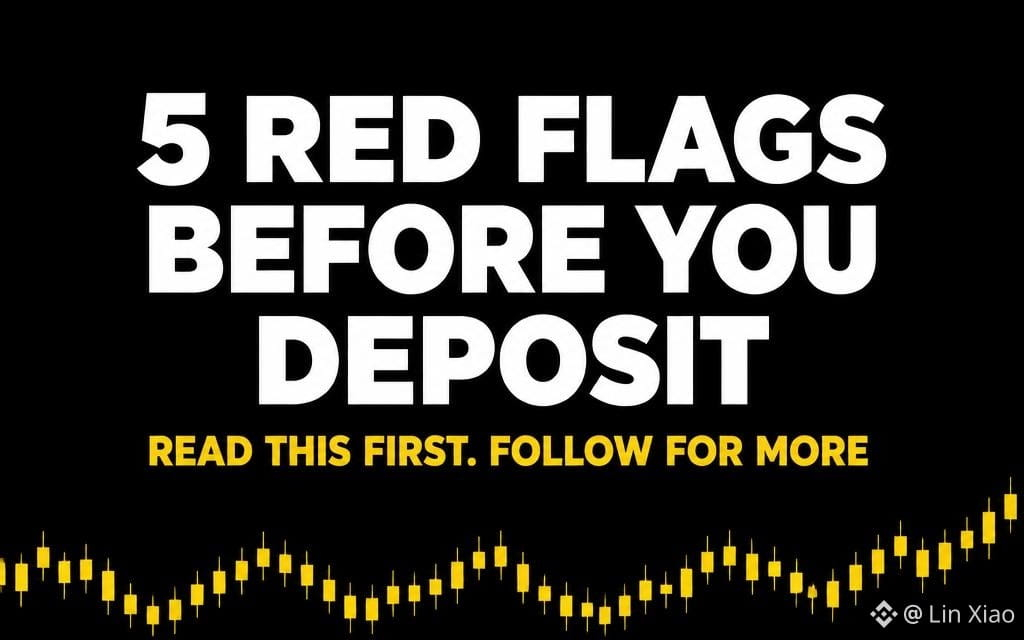
5 dấu hiệu đỏ trước khi bạn nạp crypto ở bất kỳ nơi nào.
Đọc điều này trước lần nạp tiếp theo của bạn. Mất 60 giây.
1. Không có thông tin cấp phép trên trang web. Ở bất kỳ đâu. Thậm chí không có ở phần chân trang.
2. Chỉ hỗ trợ trả lời trước khi bạn nạp. Sau đó, im lặng.
3. Các “phí” rút tiền xuất hiện một cách khó hiểu.
4. Ưu đãi/bonus khóa tiền của chính bạn.
5. Ứng dụng không có trên cửa hàng chính thức. Chỉ có một liên kết APK.
Một dấu hiệu đỏ là cảnh báo.
Hai là một hình mẫu.
Ba là một trò lừa đảo.
Lưu danh sách này. Gửi cho người bạn đó—người chẳng bao giờ kiểm tra.
Theo dõi mình để có thêm các bài đăng như thế này. Kết bạn ở đây nhé. Chia sẻ để ít người phải học theo cách đau đớn.
$BTC $BNB
#CryptoSafety #BinanceSquare #DYOR #CryptoCommunity #Web3
NFA. DYOR.
5 dấu hiệu đỏ trước khi bạn nạp crypto ở bất kỳ nơi nào.
Đọc điều này trước lần nạp tiếp theo của bạn. Mất 60 giây.
1. Không có thông tin cấp phép trên trang web. Ở bất kỳ đâu. Thậm chí không có ở phần chân trang.
2. Chỉ hỗ trợ trả lời trước khi bạn nạp. Sau đó, im lặng.
3. Các “phí” rút tiền xuất hiện một cách khó hiểu.
4. Ưu đãi/bonus khóa tiền của chính bạn.
5. Ứng dụng không có trên cửa hàng chính thức. Chỉ có một liên kết APK.
Một dấu hiệu đỏ là cảnh báo.
Hai là một hình mẫu.
Ba là một trò lừa đảo.
Lưu danh sách này. Gửi cho người bạn đó—người chẳng bao giờ kiểm tra.
Theo dõi mình để có thêm các bài đăng như thế này. Kết bạn ở đây nhé. Chia sẻ để ít người phải học theo cách đau đớn.
$BTC $BNB
#CryptoSafety #BinanceSquare #DYOR #CryptoCommunity #Web3
NFA. DYOR.
Đọc điều này trước lần nạp tiếp theo của bạn. Mất 60 giây.
1. Không có thông tin cấp phép trên trang web. Ở bất kỳ đâu. Thậm chí không có ở phần chân trang.
2. Chỉ hỗ trợ trả lời trước khi bạn nạp. Sau đó, im lặng.
3. Các “phí” rút tiền xuất hiện một cách khó hiểu.
4. Ưu đãi/bonus khóa tiền của chính bạn.
5. Ứng dụng không có trên cửa hàng chính thức. Chỉ có một liên kết APK.
Một dấu hiệu đỏ là cảnh báo.
Hai là một hình mẫu.
Ba là một trò lừa đảo.
Lưu danh sách này. Gửi cho người bạn đó—người chẳng bao giờ kiểm tra.
Theo dõi mình để có thêm các bài đăng như thế này. Kết bạn ở đây nhé. Chia sẻ để ít người phải học theo cách đau đớn.
$BTC $BNB
#CryptoSafety #BinanceSquare #DYOR #CryptoCommunity #Web3
NFA. DYOR.
69
·
--
Quan điểm nóng: 90% "phân tích" trên nguồn này là ảnh chụp màn hình và một lời cầu nguyện. Tại sao nó vẫn được thả tim? 🤔
Bởi vì sự chắc chắn bán chạy hơn xác suất.
"BTC lên 200K" nhận 3000 lượt thả tim. "Tôi đang giữ 40% tiền mặt và chờ" chỉ được 12.
Tài khoản ồn ào nhất trong nguồn của bạn chưa bao giờ đăng một giao dịch thua. Hãy nghĩ xem điều đó có ý nghĩa gì.
Ai là kiểu "nhà phân tích" bị thổi phồng nhất trong crypto? Chê họ trong phần bình luận—không cần nêu tên.
#Crypto #TradingTips #CryptoNews #Bitcoin $BTC $BNB
Quan điểm nóng: 90% "phân tích" trên nguồn này là ảnh chụp màn hình và một lời cầu nguyện. Tại sao nó vẫn được thả tim? 🤔
Bởi vì sự chắc chắn bán chạy hơn xác suất.
"BTC lên 200K" nhận 3000 lượt thả tim. "Tôi đang giữ 40% tiền mặt và chờ" chỉ được 12.
Tài khoản ồn ào nhất trong nguồn của bạn chưa bao giờ đăng một giao dịch thua. Hãy nghĩ xem điều đó có ý nghĩa gì.
Ai là kiểu "nhà phân tích" bị thổi phồng nhất trong crypto? Chê họ trong phần bình luận—không cần nêu tên.
#Crypto #TradingTips #CryptoNews #Bitcoin $BTC $BNB
Bởi vì sự chắc chắn bán chạy hơn xác suất.
"BTC lên 200K" nhận 3000 lượt thả tim. "Tôi đang giữ 40% tiền mặt và chờ" chỉ được 12.
Tài khoản ồn ào nhất trong nguồn của bạn chưa bao giờ đăng một giao dịch thua. Hãy nghĩ xem điều đó có ý nghĩa gì.
Ai là kiểu "nhà phân tích" bị thổi phồng nhất trong crypto? Chê họ trong phần bình luận—không cần nêu tên.
#Crypto #TradingTips #CryptoNews #Bitcoin $BTC $BNB
2
91
·
--
Lợi suất 10Y vừa chạm mức cao nhất trong 19 năm và kênh này đang tranh cãi về memecoin. Tại sao? 🤔
Nói thật: biểu đồ quan trọng nhất trong crypto không nằm trên một sàn giao dịch crypto.
Khi tiền đắt đến vậy, thanh khoản sẽ rời khỏi các tài sản rủi ro nhất trước. Và đó là chúng ta.
Bỏ qua vĩ mô không khiến bạn thành kẻ liều. Nó chỉ khiến bạn rời khỏi thanh khoản.
Thứ gì sẽ gãy trước — tài sản rủi ro, hay câu chuyện “lần này khác”? Comment 1 hoặc 2.
#US10YTreasuryYieldHits19YearHigh #Macro #Crypto #Bitcoin $BTC $ETH
Lợi suất 10Y vừa chạm mức cao nhất trong 19 năm và kênh này đang tranh cãi về memecoin. Tại sao? 🤔
Nói thật: biểu đồ quan trọng nhất trong crypto không nằm trên một sàn giao dịch crypto.
Khi tiền đắt đến vậy, thanh khoản sẽ rời khỏi các tài sản rủi ro nhất trước. Và đó là chúng ta.
Bỏ qua vĩ mô không khiến bạn thành kẻ liều. Nó chỉ khiến bạn rời khỏi thanh khoản.
Thứ gì sẽ gãy trước — tài sản rủi ro, hay câu chuyện “lần này khác”? Comment 1 hoặc 2.
#US10YTreasuryYieldHits19YearHigh #Macro #Crypto #Bitcoin $BTC $ETH
Nói thật: biểu đồ quan trọng nhất trong crypto không nằm trên một sàn giao dịch crypto.
Khi tiền đắt đến vậy, thanh khoản sẽ rời khỏi các tài sản rủi ro nhất trước. Và đó là chúng ta.
Bỏ qua vĩ mô không khiến bạn thành kẻ liều. Nó chỉ khiến bạn rời khỏi thanh khoản.
Thứ gì sẽ gãy trước — tài sản rủi ro, hay câu chuyện “lần này khác”? Comment 1 hoặc 2.
#US10YTreasuryYieldHits19YearHigh #Macro #Crypto #Bitcoin $BTC $ETH
1
123
·
--
$BTC không quan tâm đến cảm xúc của bạn 🤔
Bạn có kiểm tra kế hoạch hay biểu đồ nhiều hơn không?
Chỉ một từ: KẾ HOẠCH hay BIỂU ĐỒ 👇
$BTC không quan tâm đến cảm xúc của bạn 🤔
Bạn có kiểm tra kế hoạch hay biểu đồ nhiều hơn không?
Chỉ một từ: KẾ HOẠCH hay BIỂU ĐỒ 👇
Bạn có kiểm tra kế hoạch hay biểu đồ nhiều hơn không?
Chỉ một từ: KẾ HOẠCH hay BIỂU ĐỒ 👇

1
41
·
--
Bạn sẽ giữ LOẠI nào trong 90 ngày — $BTC, $ETH hoặc $SOL? 🤔
Một mã. Không dài dòng. 🤐👇
Bạn sẽ giữ LOẠI nào trong 90 ngày — $BTC , $ETH hoặc $SOL ? 🤔
Một mã. Không dài dòng. 🤐👇
Một mã. Không dài dòng. 🤐👇

60
·
--
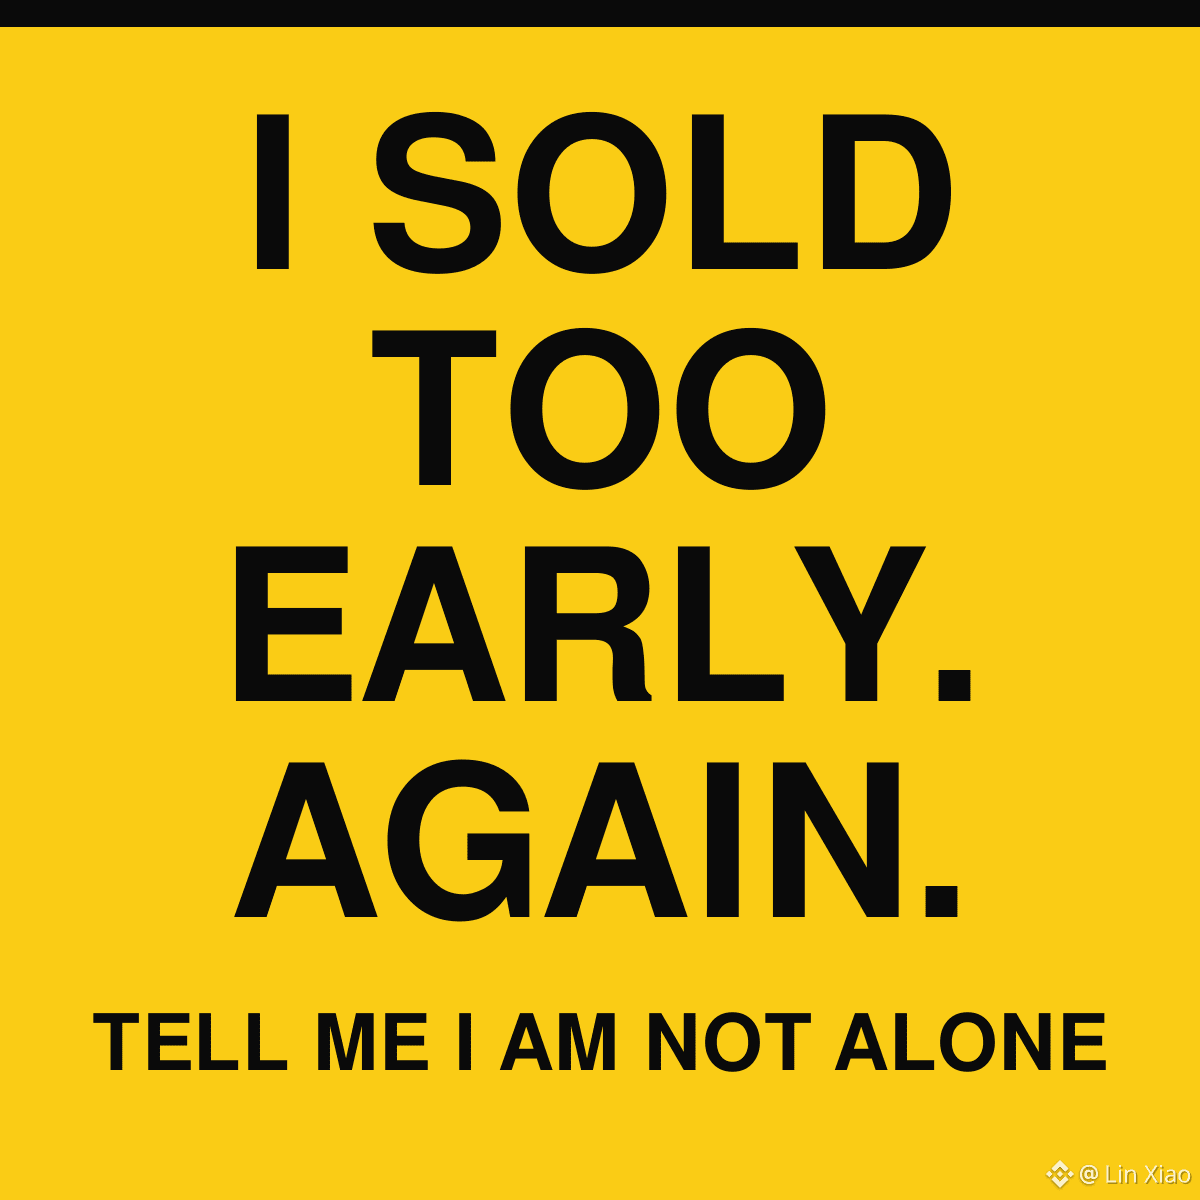
$BTC bơm vào ngay khi tôi đóng vị thế của mình. Lại nữa. 😮💨🤡
Nói với tôi rằng tôi không phải là người duy nhất?
Lần thoát lệnh sớm tệ nhất của bạn 👇
$BTC bơm vào ngay khi tôi đóng vị thế của mình. Lại nữa. 😮💨🤡
Nói với tôi rằng tôi không phải là người duy nhất?
Lần thoát lệnh sớm tệ nhất của bạn 👇
Nói với tôi rằng tôi không phải là người duy nhất?
Lần thoát lệnh sớm tệ nhất của bạn 👇
1
54
·
--
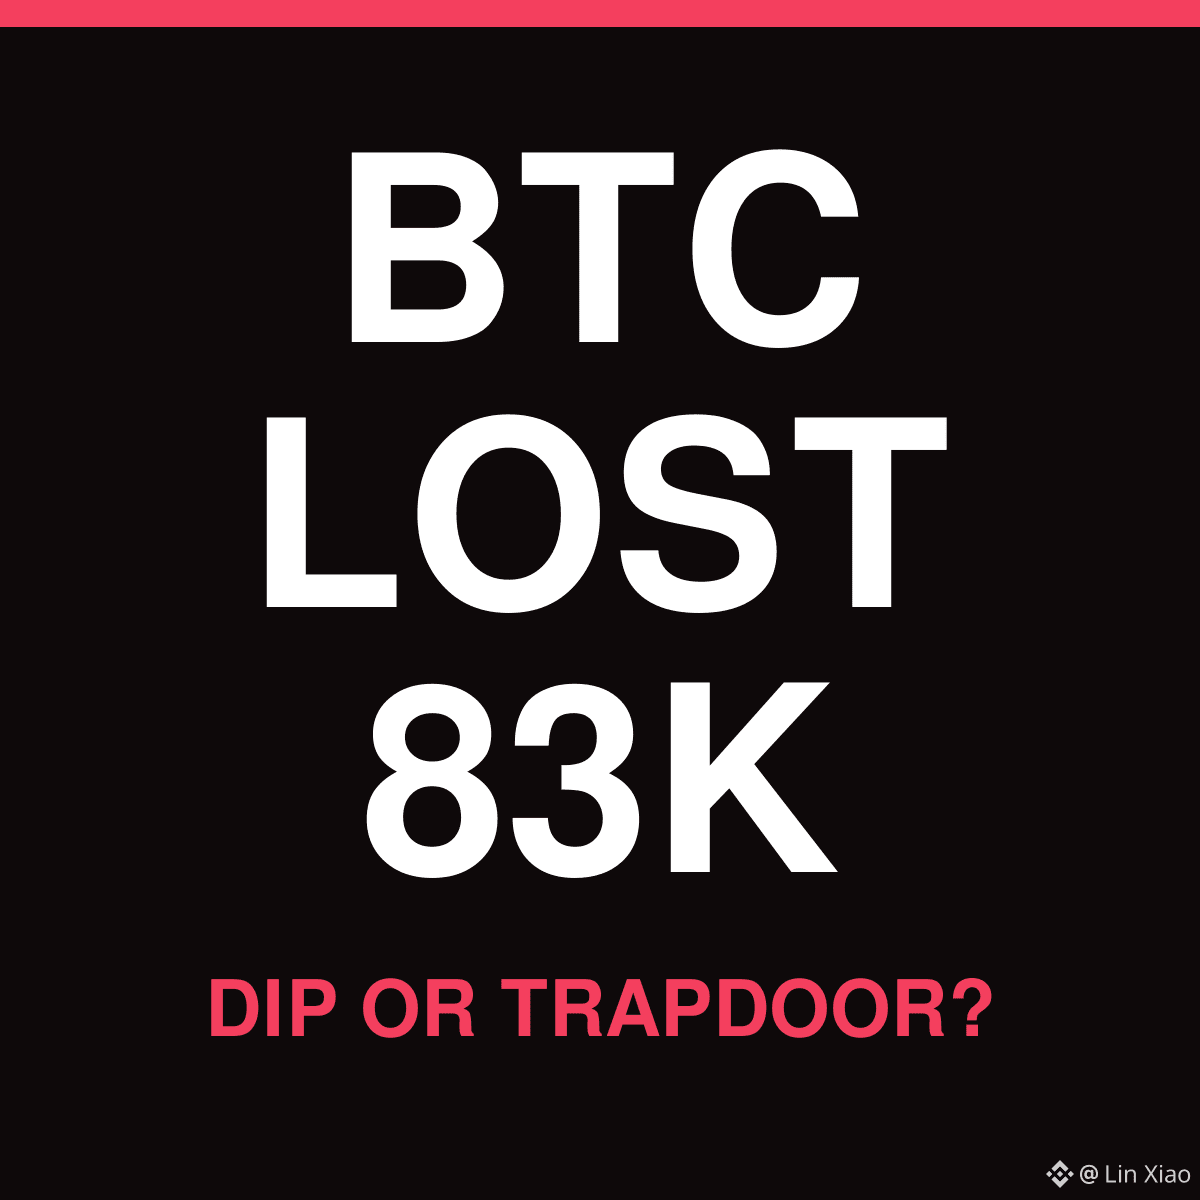
$BTC vừa mất 83.000 🩸😬
Trượt hay bẫy rơi? 🤔
Một từ trong phần bình luận 👇
$BTC vừa mất 83.000 🩸😬
Trượt hay bẫy rơi? 🤔
Một từ trong phần bình luận 👇
Trượt hay bẫy rơi? 🤔
Một từ trong phần bình luận 👇
22
·
--
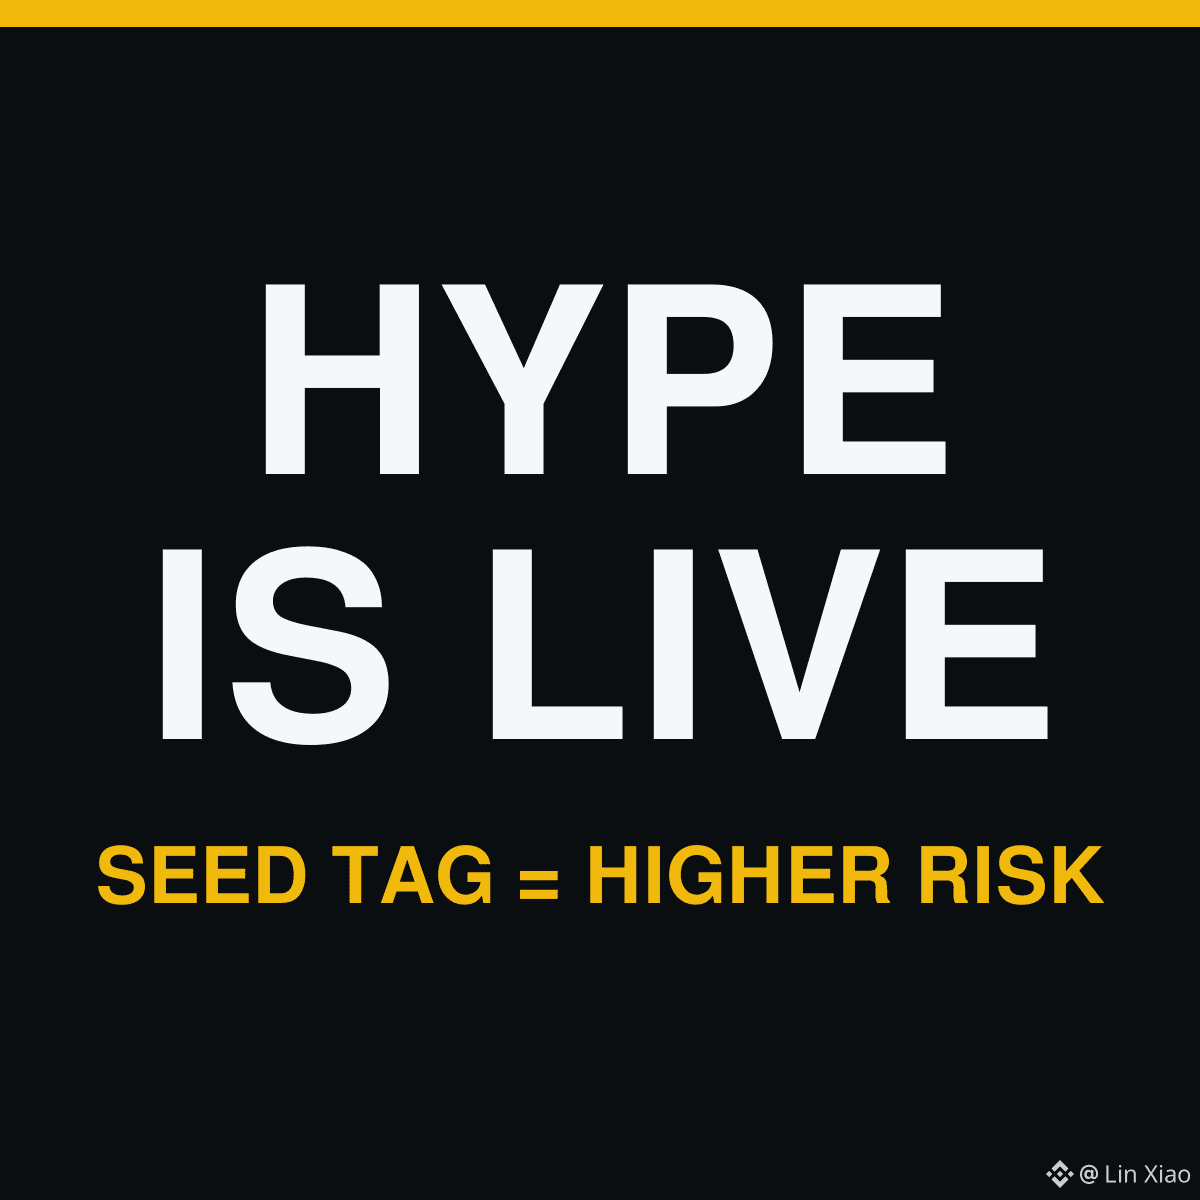
$HYPE is đang hoạt động trên Binance với Thẻ Seed 🌱⚠️
Thẻ Seed = rủi ro cao hơn, thanh khoản mỏng hơn.
Mua hay theo dõi? Chỉ một từ 👇
$HYPE is đang hoạt động trên Binance với Thẻ Seed 🌱⚠️
Thẻ Seed = rủi ro cao hơn, thanh khoản mỏng hơn.
Mua hay theo dõi? Chỉ một từ 👇
Thẻ Seed = rủi ro cao hơn, thanh khoản mỏng hơn.
Mua hay theo dõi? Chỉ một từ 👇
1
103
·
--
Bài viết
Cách Giao Dịch Một Đợt Niêm Yết Binance Mới: Khung Quản Trị Rủi Ro 6 BướcMỗi đợt niêm yết mới tạo ra đúng hai nhóm giống nhau: những người vào ra một giao dịch sạch, và những người trở thành thanh khoản thoát hàng trong 5 phút đầu tiên. Khác biệt gần như không phải là thông tin. Đó là quy trình. Dưới đây là khung 6 bước.
TẠI SAO CÁC NẾN NIÊM YẾT LÀM HẠI MỌI NGƯỜI
Một đợt niêm yết mới tạo ra sổ lệnh mỏng nhất mà token đó từng có. Người nhận airdrop đang bán vào đó, các nhà tạo lập thị trường vẫn đang hình thành biên độ, và nhà đầu tư lẻ bước vào bằng lệnh thị trường. Lệnh thị trường trong một sổ lệnh mỏng sẽ không “lấy được đúng giá” - nó sẽ ăn hết từng mức giá theo đường đi lên. Khi đó, bạn giữ một vị thế được mở ở mức giá tệ nhất hiện có, không có mốc tham chiếu để so sánh.
Cách Giao Dịch Một Đợt Niêm Yết Binance Mới: Khung Quản Trị Rủi Ro 6 Bước
Mỗi đợt niêm yết mới tạo ra đúng hai nhóm giống nhau: những người vào ra một giao dịch sạch, và những người trở thành thanh khoản thoát hàng trong 5 phút đầu tiên. Khác biệt gần như không phải là thông tin. Đó là quy trình. Dưới đây là khung 6 bước.
TẠI SAO CÁC NẾN NIÊM YẾT LÀM HẠI MỌI NGƯỜI
Một đợt niêm yết mới tạo ra sổ lệnh mỏng nhất mà token đó từng có. Người nhận airdrop đang bán vào đó, các nhà tạo lập thị trường vẫn đang hình thành biên độ, và nhà đầu tư lẻ bước vào bằng lệnh thị trường. Lệnh thị trường trong một sổ lệnh mỏng sẽ không “lấy được đúng giá” - nó sẽ ăn hết từng mức giá theo đường đi lên. Khi đó, bạn giữ một vị thế được mở ở mức giá tệ nhất hiện có, không có mốc tham chiếu để so sánh.
TẠI SAO CÁC NẾN NIÊM YẾT LÀM HẠI MỌI NGƯỜI
Một đợt niêm yết mới tạo ra sổ lệnh mỏng nhất mà token đó từng có. Người nhận airdrop đang bán vào đó, các nhà tạo lập thị trường vẫn đang hình thành biên độ, và nhà đầu tư lẻ bước vào bằng lệnh thị trường. Lệnh thị trường trong một sổ lệnh mỏng sẽ không “lấy được đúng giá” - nó sẽ ăn hết từng mức giá theo đường đi lên. Khi đó, bạn giữ một vị thế được mở ở mức giá tệ nhất hiện có, không có mốc tham chiếu để so sánh.
32
Đăng nhập để khám phá thêm nội dung
Tham gia cùng người dùng tiền mã hóa toàn cầu trên Binance Square
⚡️ Nhận thông tin mới nhất và hữu ích về tiền mã hóa.
💬 Được tin cậy bởi sàn giao dịch tiền mã hóa lớn nhất thế giới.
👍 Khám phá những thông tin chuyên sâu thực tế từ những nhà sáng tạo đã xác minh.
Email / Số điện thoại
Chủ đề thịnh hành
TheoDõiFOMC
112,708 lượt xem
650 đang thảo luận
#TheoDõiFOMC $BTC $ETH
FOMC không chỉ là một cuộc họp về lãi suất.
Đây là nơi mà hướng đi của “tiền lớn” có thể bắt đầu thay đổi.
Một câu nói từ Fed có thể trở thành tín hiệu cho thị trường.
Lãi suất có thể không đổi, nhưng kỳ vọng của nhà đầu tư có thể thay đổi trước.
Với Bitcoin, câu hỏi thực sự không phải lúc nào cũng là:
“Fed sẽ tăng hay cắt giảm lãi suất?”
Mà là:
“Fed muốn thị trường tin điều gì?”
Trong crypto, giá thường biến động trước cả tin tức.
Vì vậy, trước mỗi kỳ FOMC, đừng chỉ nhìn vào biểu đồ.
Hãy theo dõi kỳ vọng, thanh khoản và tâm lý thị trường.
🌊 Thị trường không chỉ phản ứng với những gì Fed làm.
Mà nó phản ứng với những gì thị trường tin rằng Fed sẽ làm.
#FOMC #Bitcoin #Crypto #Fed #BinanceSquare
Cristore-trading
·1 lượt thích
·130 lượt xem
TinFed
94,709 lượt xem
453 đang thảo luận
EtherGains70.9%InQ3
148,820 lượt xem
1,134 đang thảo luận