

Isaac_12Newton
10 Bài đăng

Isaac_12Newton
Báo cáo
Chặn người dùng
Giao dịch mở
Trader tần suất cao
{thời gian} năm
1 Đang theo dõi
1 Người theo dõi
5 Đã thích
Bài đăng
Danh mục đầu tư
·
--
Giảm giá
Xem bản dịch
$RLC
{future}(RLCUSDT)
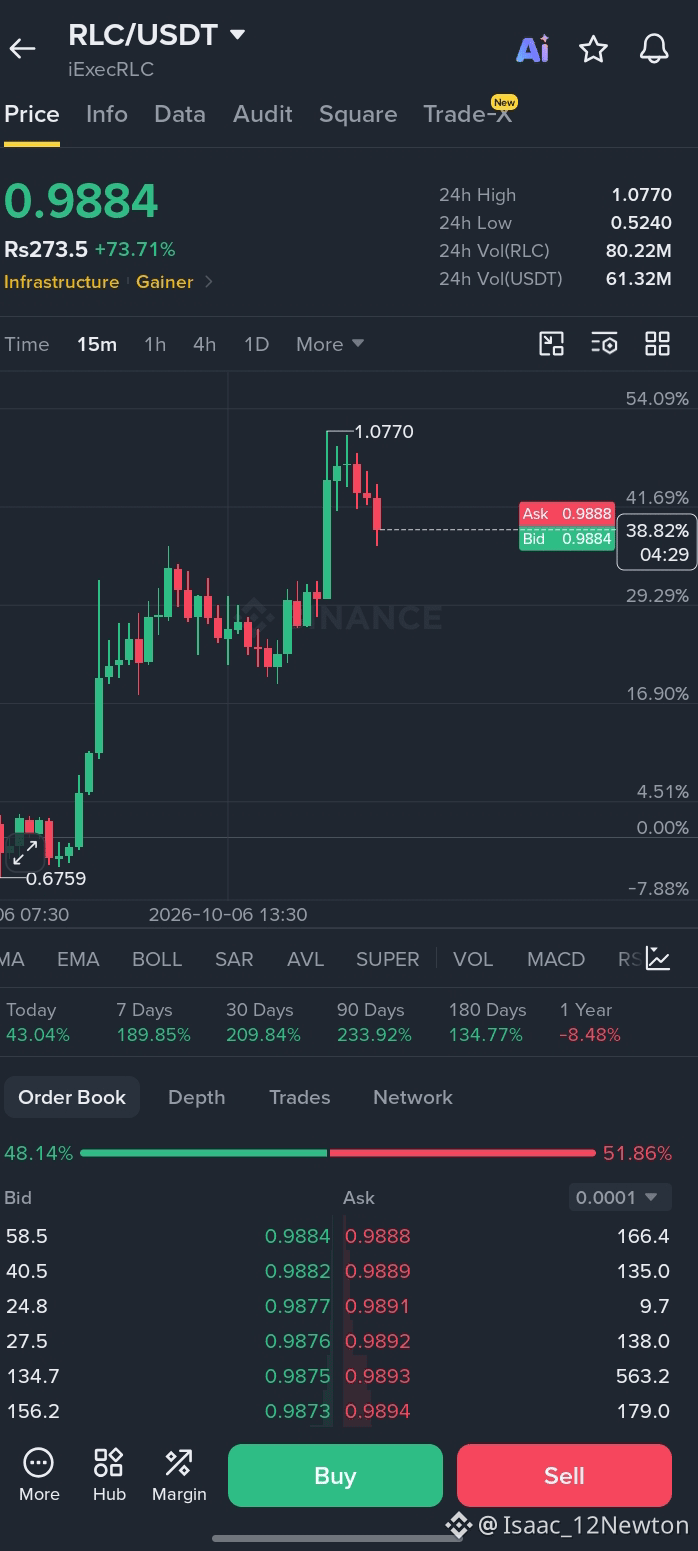
RLC is currently around $0.90–$0.93 after an extremely strong rally. It recently moved from roughly $0.36 to above $0.95, so a pullback is very possible. The daily RSI is around 93, which is extremely overbought. �
COINOTAG +1
Important downside levels
Level
Significance
$0.88–$0.89
First minor support
$0.82
First meaningful pullback area
$0.72–$0.70
Major support zone
$0.61
50% Fibonacci retracement
$0.52
61.8% Fibonacci retracement
$0.40–$0.33
Deep correction zone
Technical analysis currently identifies $0.7177 as the nearest strong daily support, followed by $0.6881. A daily close below this area would significantly weaken the bullish structure. �
COINOTAG
My short-term view
Base correction: $0.88 → $0.82
Stronger correction: $0.72 → $0.69
Bearish breakdown: $0.61 → $0.52
Extreme correction: $0.40 → $0.33
However, this does not mean RLC must fall to $0.33. The overall trend is still strongly bullish; the concern is that the coin is extremely overbought after the huge pump. �
COINOTAG +1
Key level to watch: $0.72. If RLC holds above it, the bullish trend can remain intact. If it breaks decisively below $0.69–$0.72, the probability of a deeper correction increases.
This is technical analysis, not a guaranteed prediction or financial advice.#BinanceLaunchesBinanceIntelligence #EvernorthXRPTreasuryCompletesSPACMerger #ETHUp70%InQ3ButLiquidityFalls #FedOctoberHoldOdds82.3% #FedOctoberHoldOdds82.3%
$RLC
RLC is currently around $0.90–$0.93 after an extremely strong rally. It recently moved from roughly $0.36 to above $0.95, so a pullback is very possible. The daily RSI is around 93, which is extremely overbought. �
COINOTAG +1
Important downside levels
Level
Significance
$0.88–$0.89
First minor support
$0.82
First meaningful pullback area
$0.72–$0.70
Major support zone
$0.61
50% Fibonacci retracement
$0.52
61.8% Fibonacci retracement
$0.40–$0.33
Deep correction zone
Technical analysis currently identifies $0.7177 as the nearest strong daily support, followed by $0.6881. A daily close below this area would significantly weaken the bullish structure. �
COINOTAG
My short-term view
Base correction: $0.88 → $0.82
Stronger correction: $0.72 → $0.69
Bearish breakdown: $0.61 → $0.52
Extreme correction: $0.40 → $0.33
However, this does not mean RLC must fall to $0.33. The overall trend is still strongly bullish; the concern is that the coin is extremely overbought after the huge pump. �
COINOTAG +1
Key level to watch: $0.72. If RLC holds above it, the bullish trend can remain intact. If it breaks decisively below $0.69–$0.72, the probability of a deeper correction increases.
This is technical analysis, not a guaranteed prediction or financial advice.#BinanceLaunchesBinanceIntelligence #EvernorthXRPTreasuryCompletesSPACMerger #ETHUp70%InQ3ButLiquidityFalls #FedOctoberHoldOdds82.3% #FedOctoberHoldOdds82.3%
RLC is currently around $0.90–$0.93 after an extremely strong rally. It recently moved from roughly $0.36 to above $0.95, so a pullback is very possible. The daily RSI is around 93, which is extremely overbought. �
COINOTAG +1
Important downside levels
Level
Significance
$0.88–$0.89
First minor support
$0.82
First meaningful pullback area
$0.72–$0.70
Major support zone
$0.61
50% Fibonacci retracement
$0.52
61.8% Fibonacci retracement
$0.40–$0.33
Deep correction zone
Technical analysis currently identifies $0.7177 as the nearest strong daily support, followed by $0.6881. A daily close below this area would significantly weaken the bullish structure. �
COINOTAG
My short-term view
Base correction: $0.88 → $0.82
Stronger correction: $0.72 → $0.69
Bearish breakdown: $0.61 → $0.52
Extreme correction: $0.40 → $0.33
However, this does not mean RLC must fall to $0.33. The overall trend is still strongly bullish; the concern is that the coin is extremely overbought after the huge pump. �
COINOTAG +1
Key level to watch: $0.72. If RLC holds above it, the bullish trend can remain intact. If it breaks decisively below $0.69–$0.72, the probability of a deeper correction increases.
This is technical analysis, not a guaranteed prediction or financial advice.#BinanceLaunchesBinanceIntelligence #EvernorthXRPTreasuryCompletesSPACMerger #ETHUp70%InQ3ButLiquidityFalls #FedOctoberHoldOdds82.3% #FedOctoberHoldOdds82.3%
163
·
--
Giảm giá
Xem bản dịch
$RLC
{future}(RLCUSDT)
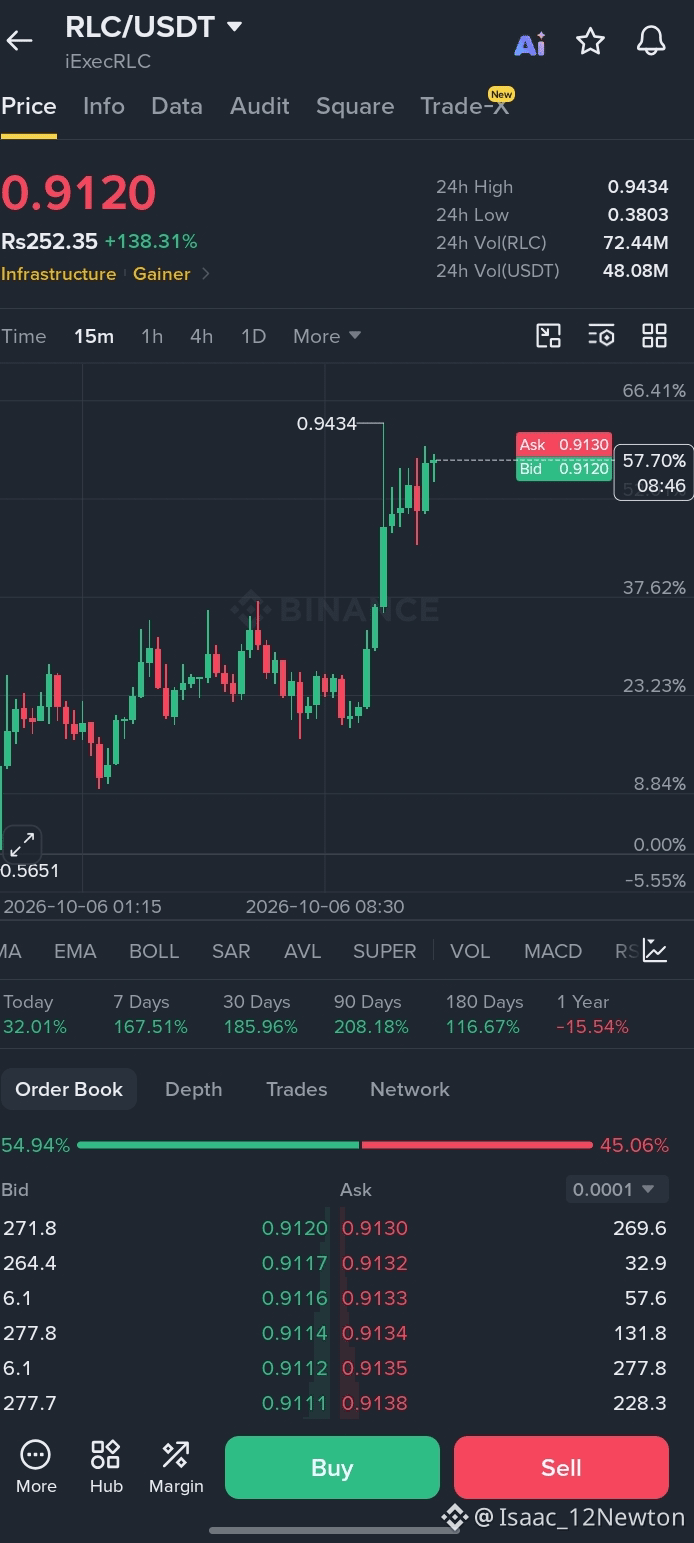
RLC is currently in a very high-volatility pump. On Binance data, RLC/USDT moved from around $0.365 to above $0.72, roughly a 100% move in 24 hours. The 24h range has been approximately $0.365–$0.785, with a major spike in volume. �
Yatırımcı.AI +1
What this means for trading
Bullish side:
Strong momentum and unusually high volume.
Price has broken far above the previous ~$0.35–$0.38 area.
If RLC holds $0.70–$0.72, another move toward $0.78–$0.80 is possible.
A clean breakout above $0.80 with strong volume could open the way toward $0.85–$0.90.
Risk side:
This is already an extremely extended pump.
RLC has shown a huge intraday rejection: the price reached around $0.78–$0.80 and then pulled back. �
ChartExchange
Chasing the price after a ~100% move is high risk because a sharp correction can happen quickly.
Key levels
Level
Importance
$0.80
Major resistance
$0.78
Recent high/resistance
$0.70–0.72
Current decision zone
$0.60–0.65
Possible pullback support
$0.50–0.55
Stronger support
$0.36–0.38
Previous major base
My view: RLC is bullish but extremely risky at the current price. I would not consider a large entry after such a massive pump. A safer setup would be waiting for a pullback and seeing whether support holds, rather than buying purely because the coin is trending.#DriftHackVictimsBeginClaims #BinanceLaunchesBinanceIntelligence #EvernorthXRPTreasuryCompletesSPACMerger #EthStakingExitQueueHits2026High #FedOctoberHoldOdds82.3%
$RLC
RLC is currently in a very high-volatility pump. On Binance data, RLC/USDT moved from around $0.365 to above $0.72, roughly a 100% move in 24 hours. The 24h range has been approximately $0.365–$0.785, with a major spike in volume. �
Yatırımcı.AI +1
What this means for trading
Bullish side:
Strong momentum and unusually high volume.
Price has broken far above the previous ~$0.35–$0.38 area.
If RLC holds $0.70–$0.72, another move toward $0.78–$0.80 is possible.
A clean breakout above $0.80 with strong volume could open the way toward $0.85–$0.90.
Risk side:
This is already an extremely extended pump.
RLC has shown a huge intraday rejection: the price reached around $0.78–$0.80 and then pulled back. �
ChartExchange
Chasing the price after a ~100% move is high risk because a sharp correction can happen quickly.
Key levels
Level
Importance
$0.80
Major resistance
$0.78
Recent high/resistance
$0.70–0.72
Current decision zone
$0.60–0.65
Possible pullback support
$0.50–0.55
Stronger support
$0.36–0.38
Previous major base
My view: RLC is bullish but extremely risky at the current price. I would not consider a large entry after such a massive pump. A safer setup would be waiting for a pullback and seeing whether support holds, rather than buying purely because the coin is trending.#DriftHackVictimsBeginClaims #BinanceLaunchesBinanceIntelligence #EvernorthXRPTreasuryCompletesSPACMerger #EthStakingExitQueueHits2026High #FedOctoberHoldOdds82.3%
RLC is currently in a very high-volatility pump. On Binance data, RLC/USDT moved from around $0.365 to above $0.72, roughly a 100% move in 24 hours. The 24h range has been approximately $0.365–$0.785, with a major spike in volume. �
Yatırımcı.AI +1
What this means for trading
Bullish side:
Strong momentum and unusually high volume.
Price has broken far above the previous ~$0.35–$0.38 area.
If RLC holds $0.70–$0.72, another move toward $0.78–$0.80 is possible.
A clean breakout above $0.80 with strong volume could open the way toward $0.85–$0.90.
Risk side:
This is already an extremely extended pump.
RLC has shown a huge intraday rejection: the price reached around $0.78–$0.80 and then pulled back. �
ChartExchange
Chasing the price after a ~100% move is high risk because a sharp correction can happen quickly.
Key levels
Level
Importance
$0.80
Major resistance
$0.78
Recent high/resistance
$0.70–0.72
Current decision zone
$0.60–0.65
Possible pullback support
$0.50–0.55
Stronger support
$0.36–0.38
Previous major base
My view: RLC is bullish but extremely risky at the current price. I would not consider a large entry after such a massive pump. A safer setup would be waiting for a pullback and seeing whether support holds, rather than buying purely because the coin is trending.#DriftHackVictimsBeginClaims #BinanceLaunchesBinanceIntelligence #EvernorthXRPTreasuryCompletesSPACMerger #EthStakingExitQueueHits2026High #FedOctoberHoldOdds82.3%
219
$RLC
{future}(RLCUSDT)
RLC/USDT — Vì sao giá đang tăng vọt?
Khối lượng giao dịch tăng mạnh: RLC đã tăng từ khoảng 0,36 USD lên trên 0,70 USD, trong khi khối lượng giao dịch 24 giờ tăng lên hàng chục hoặc hàng trăm triệu đô la, tùy theo nguồn dữ liệu. �
ChartExchange +1
Phá vỡ vùng tích lũy kéo dài: Trước đợt tăng vọt, RLC chủ yếu được giao dịch quanh mức 0,33–0,38 USD. Cú bứt phá đột ngột đã thu hút các nhà giao dịch theo xu hướng và có thể đã kích hoạt các lệnh thanh lý vị thế bán khống. �
CoinLore
Câu chuyện về iExec: RLC là token của iExec, một dự án điện toán phi tập trung/điện toán bảo mật. Các cuộc thảo luận gần đây nhấn mạnh cơ sở hạ tầng điện toán bảo mật đã được xây dựng của iExec, điều này có thể đang góp phần thúc đẩy câu chuyện của dự án. �
CoinMarketCap
Động lượng kỹ thuật cực kỳ mạnh: Các chỉ báo kỹ thuật hiện tại cho thấy xu hướng tăng, nhưng cũng cho thấy biến động cực lớn. �
COINOTAG
Cảnh báo quan trọng
Đây không phải là một đợt tăng thông thường 5–10%. RLC đã tăng khoảng hơn 100% trong một thời gian rất ngắn, vì vậy mua đuổi theo cây nến tiềm ẩn rủi ro điều chỉnh đáng kể. Dữ liệu thị trường cho thấy giá đã tăng mạnh và cách xa vùng nền gần đây. �
Yatırımcı.AI +1
Nhận định của tôi: Đợt tăng này có vẻ chủ yếu được thúc đẩy bởi cú bứt phá + khối lượng giao dịch khổng lồ + động lượng/đầu cơ, trong khi hiện vẫn chưa có một tin tức xúc tác đơn lẻ nào được xác nhận để giải thích đầy đủ cho biến động này. �#RLCUSDT #EvernorthXRPTreasuryCompletesSPACMerger #EvernorthXRPTreasuryCompletesSPACMerger #EthStakingExitQueueHits2026High #FedOctoberHoldOdds82.3%
$RLC
RLC/USDT — Vì sao giá đang tăng vọt?
Khối lượng giao dịch tăng mạnh: RLC đã tăng từ khoảng 0,36 USD lên trên 0,70 USD, trong khi khối lượng giao dịch 24 giờ tăng lên hàng chục hoặc hàng trăm triệu đô la, tùy theo nguồn dữ liệu. �
ChartExchange +1
Phá vỡ vùng tích lũy kéo dài: Trước đợt tăng vọt, RLC chủ yếu được giao dịch quanh mức 0,33–0,38 USD. Cú bứt phá đột ngột đã thu hút các nhà giao dịch theo xu hướng và có thể đã kích hoạt các lệnh thanh lý vị thế bán khống. �
CoinLore
Câu chuyện về iExec: RLC là token của iExec, một dự án điện toán phi tập trung/điện toán bảo mật. Các cuộc thảo luận gần đây nhấn mạnh cơ sở hạ tầng điện toán bảo mật đã được xây dựng của iExec, điều này có thể đang góp phần thúc đẩy câu chuyện của dự án. �
CoinMarketCap
Động lượng kỹ thuật cực kỳ mạnh: Các chỉ báo kỹ thuật hiện tại cho thấy xu hướng tăng, nhưng cũng cho thấy biến động cực lớn. �
COINOTAG
Cảnh báo quan trọng
Đây không phải là một đợt tăng thông thường 5–10%. RLC đã tăng khoảng hơn 100% trong một thời gian rất ngắn, vì vậy mua đuổi theo cây nến tiềm ẩn rủi ro điều chỉnh đáng kể. Dữ liệu thị trường cho thấy giá đã tăng mạnh và cách xa vùng nền gần đây. �
Yatırımcı.AI +1
Nhận định của tôi: Đợt tăng này có vẻ chủ yếu được thúc đẩy bởi cú bứt phá + khối lượng giao dịch khổng lồ + động lượng/đầu cơ, trong khi hiện vẫn chưa có một tin tức xúc tác đơn lẻ nào được xác nhận để giải thích đầy đủ cho biến động này. �#RLCUSDT #EvernorthXRPTreasuryCompletesSPACMerger #EvernorthXRPTreasuryCompletesSPACMerger #EthStakingExitQueueHits2026High #FedOctoberHoldOdds82.3%
RLC/USDT — Vì sao giá đang tăng vọt?
Khối lượng giao dịch tăng mạnh: RLC đã tăng từ khoảng 0,36 USD lên trên 0,70 USD, trong khi khối lượng giao dịch 24 giờ tăng lên hàng chục hoặc hàng trăm triệu đô la, tùy theo nguồn dữ liệu. �
ChartExchange +1
Phá vỡ vùng tích lũy kéo dài: Trước đợt tăng vọt, RLC chủ yếu được giao dịch quanh mức 0,33–0,38 USD. Cú bứt phá đột ngột đã thu hút các nhà giao dịch theo xu hướng và có thể đã kích hoạt các lệnh thanh lý vị thế bán khống. �
CoinLore
Câu chuyện về iExec: RLC là token của iExec, một dự án điện toán phi tập trung/điện toán bảo mật. Các cuộc thảo luận gần đây nhấn mạnh cơ sở hạ tầng điện toán bảo mật đã được xây dựng của iExec, điều này có thể đang góp phần thúc đẩy câu chuyện của dự án. �
CoinMarketCap
Động lượng kỹ thuật cực kỳ mạnh: Các chỉ báo kỹ thuật hiện tại cho thấy xu hướng tăng, nhưng cũng cho thấy biến động cực lớn. �
COINOTAG
Cảnh báo quan trọng
Đây không phải là một đợt tăng thông thường 5–10%. RLC đã tăng khoảng hơn 100% trong một thời gian rất ngắn, vì vậy mua đuổi theo cây nến tiềm ẩn rủi ro điều chỉnh đáng kể. Dữ liệu thị trường cho thấy giá đã tăng mạnh và cách xa vùng nền gần đây. �
Yatırımcı.AI +1
Nhận định của tôi: Đợt tăng này có vẻ chủ yếu được thúc đẩy bởi cú bứt phá + khối lượng giao dịch khổng lồ + động lượng/đầu cơ, trong khi hiện vẫn chưa có một tin tức xúc tác đơn lẻ nào được xác nhận để giải thích đầy đủ cho biến động này. �#RLCUSDT #EvernorthXRPTreasuryCompletesSPACMerger #EvernorthXRPTreasuryCompletesSPACMerger #EthStakingExitQueueHits2026High #FedOctoberHoldOdds82.3%
229
·
--
Tăng giá
Xem bản dịch
$RLC
{future}(RLCUSDT)
RLC/USD_Trending Coin Analysis
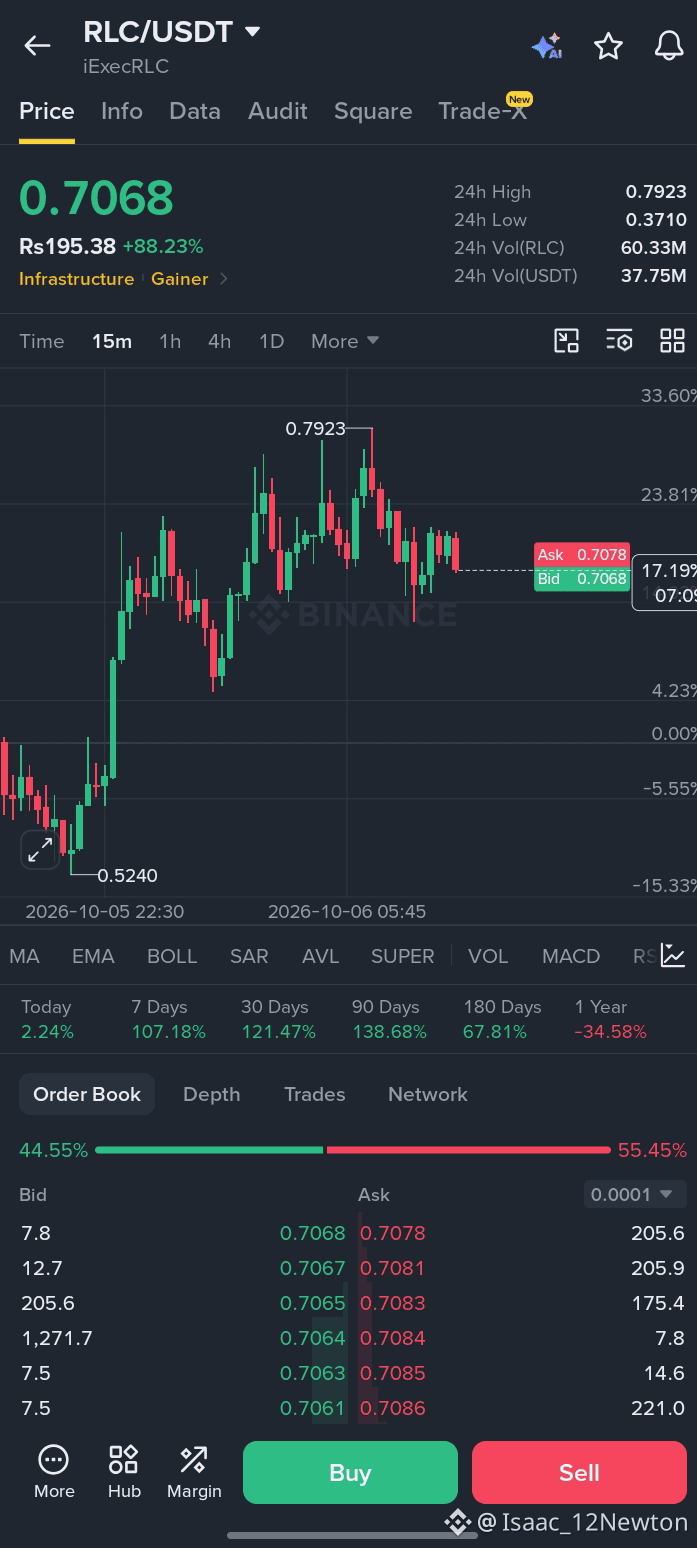
According to Binance’s current market data, RLC (iExec RLC) is one of the strongest gainers, around $0.746 and +104% in 24h. �
Binance +1
Technical view:
Trend: Strong bullish momentum
Resistance: $0.80–$0.85
Support: $0.65–$0.70
Above $0.80: breakout could extend the move
Below $0.65: bullish setup weakens significantly
Risk: Very high volatility after a ~100% daily move
The Binance market scanner also currently shows RLCUSDT as strong bullish across multiple timeframes, with RSI around 77, which means momentum is strong but the coin is also stretched. �
9jacashflow.com
Important: This is market analysis, not a guaranteed profit signal. After a move this large, chasing the price can be especially risky.#BinanceLaunchesBinanceIntelligence #EvernorthXRPTreasuryCompletesSPACMerger #ETHUp70%InQ3ButLiquidityFalls #DriftHackVictimsBeginClaims #Nikkei225Jumps2.5%ToThreeMonthHigh
$RLC
RLC/USD_Trending Coin Analysis
According to Binance’s current market data, RLC (iExec RLC) is one of the strongest gainers, around $0.746 and +104% in 24h. �
Binance +1
Technical view:
Trend: Strong bullish momentum
Resistance: $0.80–$0.85
Support: $0.65–$0.70
Above $0.80: breakout could extend the move
Below $0.65: bullish setup weakens significantly
Risk: Very high volatility after a ~100% daily move
The Binance market scanner also currently shows RLCUSDT as strong bullish across multiple timeframes, with RSI around 77, which means momentum is strong but the coin is also stretched. �
9jacashflow.com
Important: This is market analysis, not a guaranteed profit signal. After a move this large, chasing the price can be especially risky.#BinanceLaunchesBinanceIntelligence #EvernorthXRPTreasuryCompletesSPACMerger #ETHUp70%InQ3ButLiquidityFalls #DriftHackVictimsBeginClaims #Nikkei225Jumps2.5%ToThreeMonthHigh
RLC/USD_Trending Coin Analysis
According to Binance’s current market data, RLC (iExec RLC) is one of the strongest gainers, around $0.746 and +104% in 24h. �
Binance +1
Technical view:
Trend: Strong bullish momentum
Resistance: $0.80–$0.85
Support: $0.65–$0.70
Above $0.80: breakout could extend the move
Below $0.65: bullish setup weakens significantly
Risk: Very high volatility after a ~100% daily move
The Binance market scanner also currently shows RLCUSDT as strong bullish across multiple timeframes, with RSI around 77, which means momentum is strong but the coin is also stretched. �
9jacashflow.com
Important: This is market analysis, not a guaranteed profit signal. After a move this large, chasing the price can be especially risky.#BinanceLaunchesBinanceIntelligence #EvernorthXRPTreasuryCompletesSPACMerger #ETHUp70%InQ3ButLiquidityFalls #DriftHackVictimsBeginClaims #Nikkei225Jumps2.5%ToThreeMonthHigh
254
·
--
Tăng giá
$PUMPBTC
{alpha}(560xb7c0007ab75350c582d5eab1862b872b5cf53f0c)
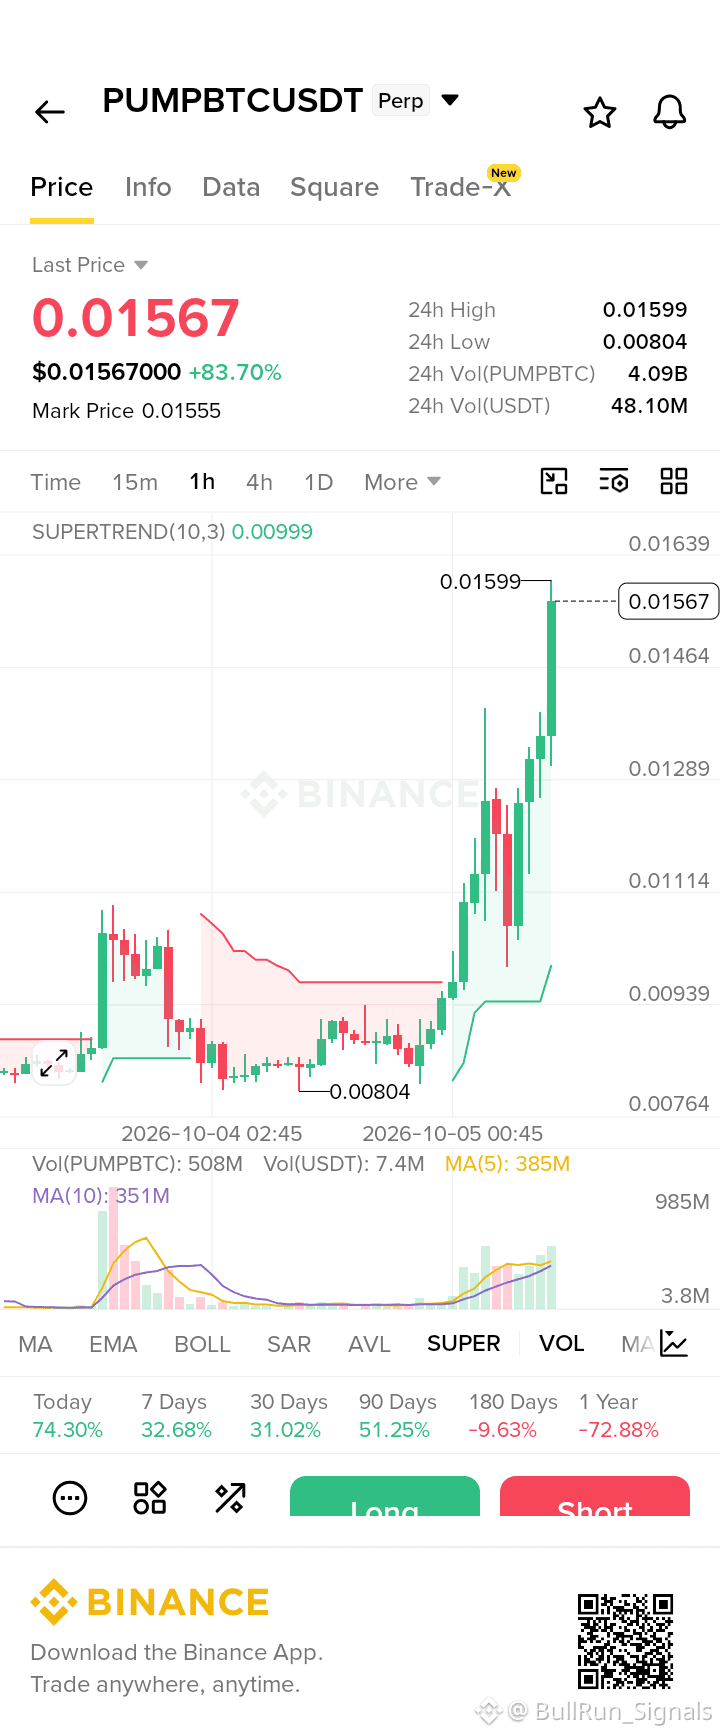
đã đến mức mà nếu bạn short
thì bạn có thể bị thanh lý
chúng tôi sẽ cố gắng scalp trên một vị thế long nhỏ và nếu chúng tôi chịu lỗ nhiều hơn 80% thì chúng tôi sẽ đóng vị thế
hãy thử scalp long nhé mấy ông, tạm thời đừng short
giao dịch ngay🤑
$ go long#DriftHackVictimsBeginClaims #EthereumValidatorExitQueueJumps392% #SECHaltsCryptoETFReviewsAmidFundingLapse #GreekPoliceBustCryptoScamRingArrest17 #FedOctoberRateHikeOddsFallTo17%
$PUMPBTC
đã đến mức mà nếu bạn short
thì bạn có thể bị thanh lý
chúng tôi sẽ cố gắng scalp trên một vị thế long nhỏ và nếu chúng tôi chịu lỗ nhiều hơn 80% thì chúng tôi sẽ đóng vị thế
hãy thử scalp long nhé mấy ông, tạm thời đừng short
giao dịch ngay🤑
$ go long#DriftHackVictimsBeginClaims #EthereumValidatorExitQueueJumps392% #SECHaltsCryptoETFReviewsAmidFundingLapse #GreekPoliceBustCryptoScamRingArrest17 #FedOctoberRateHikeOddsFallTo17%
đã đến mức mà nếu bạn short
thì bạn có thể bị thanh lý
chúng tôi sẽ cố gắng scalp trên một vị thế long nhỏ và nếu chúng tôi chịu lỗ nhiều hơn 80% thì chúng tôi sẽ đóng vị thế
hãy thử scalp long nhé mấy ông, tạm thời đừng short
giao dịch ngay🤑
$ go long#DriftHackVictimsBeginClaims #EthereumValidatorExitQueueJumps392% #SECHaltsCryptoETFReviewsAmidFundingLapse #GreekPoliceBustCryptoScamRingArrest17 #FedOctoberRateHikeOddsFallTo17%
54
·
--
Giảm giá
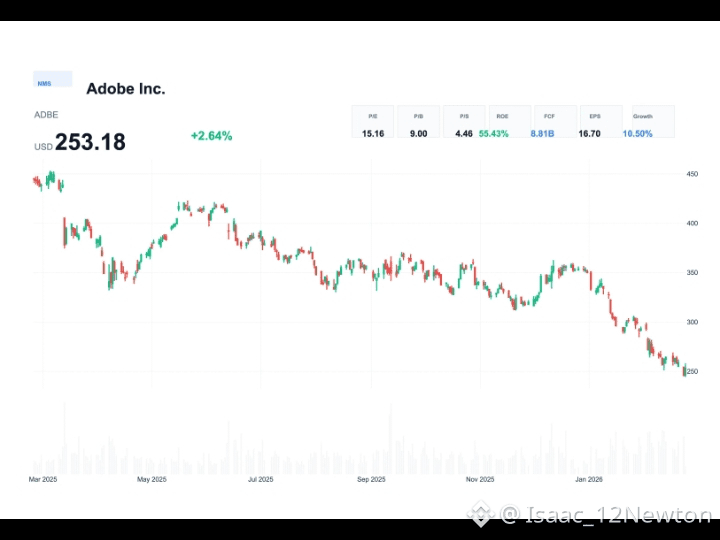
$ADBEB Giá hiện tại: khoảng $237.7
24h: gần như đi ngang
Vốn hóa thị trường: khoảng $1.05M
Khối lượng giao dịch 24h: khoảng $110K �
CoinMarketCap +1
Tổng quan nhanh: ADBEB là token hóa cổ phiếu Adobe, không phải một đồng meme/tiện ích truyền thống. Giá hiện tại gần bằng giá cổ phiếu Adobe cơ sở. Thanh khoản tương đối thấp, nên rủi ro biến động và chênh lệch giá có thể cao. �
CoinGecko
Xu hướng: 🟡 Trung lập / Theo dõi — chờ giá bứt phá rõ ràng cùng khối lượng giao dịch lớn hơn thay vì mua đuổi.
#DriftHackVictimsBeginClaims #EthereumValidatorExitQueueJumps392% #SECHaltsCryptoETFReviewsAmidFundingLapse #GreekPoliceBustCryptoScamRingArrest17 #FedOctoberRateHikeOddsFallTo17%
{spot}(ADBEBUSDT)
$ADBEB Giá hiện tại: khoảng $237.7
24h: gần như đi ngang
Vốn hóa thị trường: khoảng $1.05M
Khối lượng giao dịch 24h: khoảng $110K �
CoinMarketCap +1
Tổng quan nhanh: ADBEB là token hóa cổ phiếu Adobe, không phải một đồng meme/tiện ích truyền thống. Giá hiện tại gần bằng giá cổ phiếu Adobe cơ sở. Thanh khoản tương đối thấp, nên rủi ro biến động và chênh lệch giá có thể cao. �
CoinGecko
Xu hướng: 🟡 Trung lập / Theo dõi — chờ giá bứt phá rõ ràng cùng khối lượng giao dịch lớn hơn thay vì mua đuổi.
#DriftHackVictimsBeginClaims #EthereumValidatorExitQueueJumps392% #SECHaltsCryptoETFReviewsAmidFundingLapse #GreekPoliceBustCryptoScamRingArrest17 #FedOctoberRateHikeOddsFallTo17%
24h: gần như đi ngang
Vốn hóa thị trường: khoảng $1.05M
Khối lượng giao dịch 24h: khoảng $110K �
CoinMarketCap +1
Tổng quan nhanh: ADBEB là token hóa cổ phiếu Adobe, không phải một đồng meme/tiện ích truyền thống. Giá hiện tại gần bằng giá cổ phiếu Adobe cơ sở. Thanh khoản tương đối thấp, nên rủi ro biến động và chênh lệch giá có thể cao. �
CoinGecko
Xu hướng: 🟡 Trung lập / Theo dõi — chờ giá bứt phá rõ ràng cùng khối lượng giao dịch lớn hơn thay vì mua đuổi.
#DriftHackVictimsBeginClaims #EthereumValidatorExitQueueJumps392% #SECHaltsCryptoETFReviewsAmidFundingLapse #GreekPoliceBustCryptoScamRingArrest17 #FedOctoberRateHikeOddsFallTo17%
75
Xem bản dịch
$GTC
{spot}(GTCUSDT)
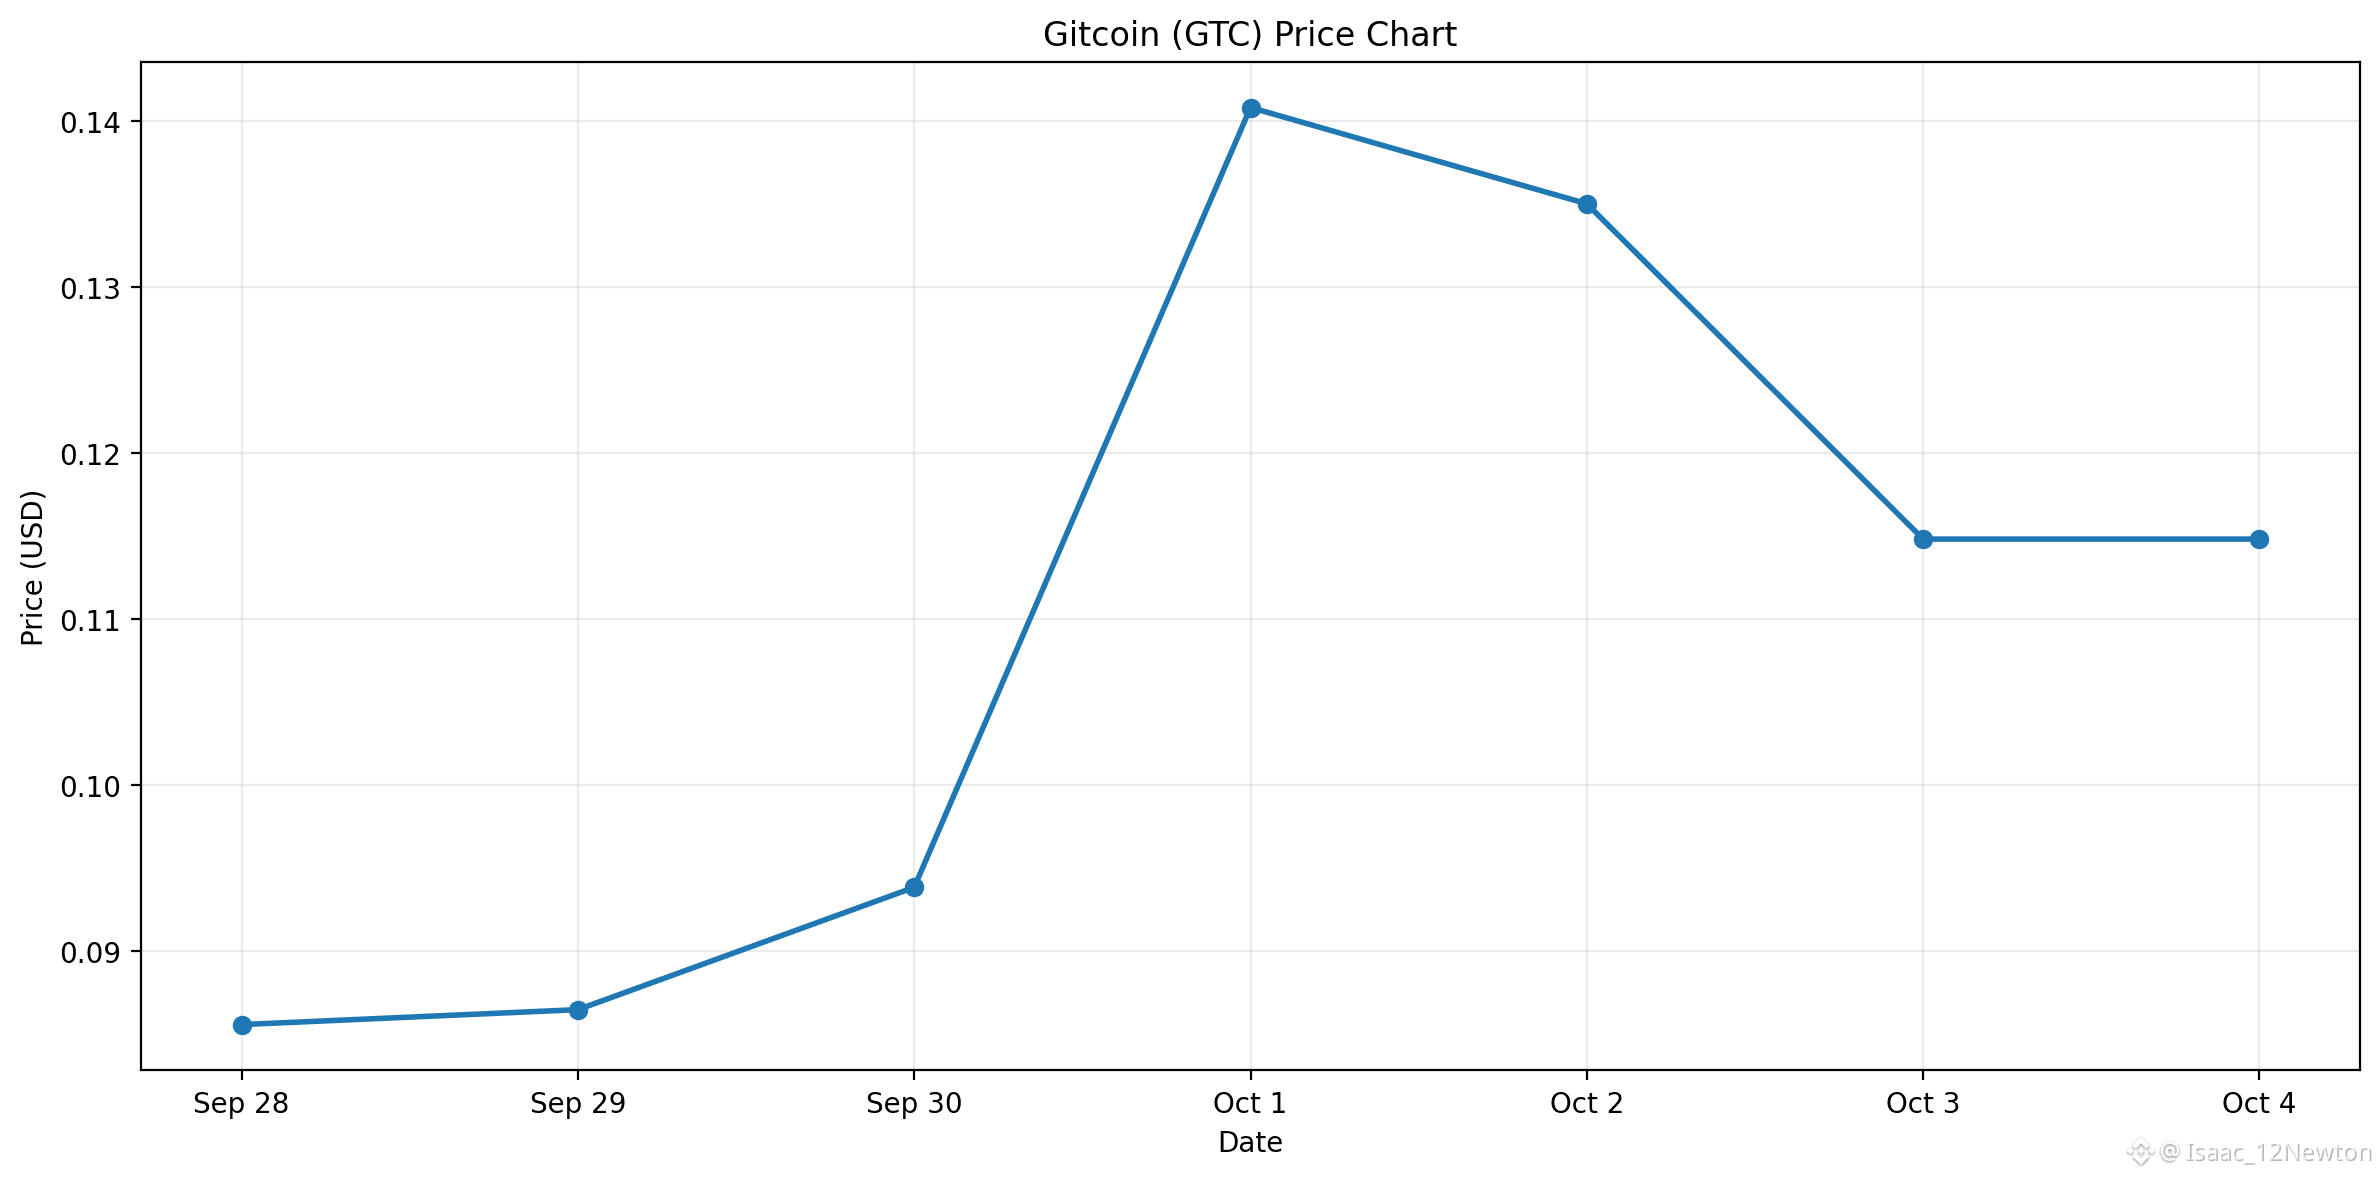
Trend: Strong Bullish
Current price: Around $0.22
Support: Around $0.18
Next support: Around $0.15
Resistance: Around $0.22–$0.23
Momentum: Very strong, but highly volatile after the big pump.
Risk: Buying immediately after an ~85% move can be risky. A pullback/retest may offer a better entry.
My view: GTC is trending strongly, but there is no guaranteed-profit coin. A sharp correction is possible after such a large move.
If you want, I can make a �GTC trading setup with Entry + Stop Loss + Target 1/2/3.#EthereumValidatorExitQueueJumps392% #SECHaltsCryptoETFReviewsAmidFundingLapse #GreekPoliceBustCryptoScamRingArrest17 #FedOctoberRateHikeOddsFallTo17% #NvidiaHitsRecordHighUp2.4%
$GTC
Trend: Strong Bullish
Current price: Around $0.22
Support: Around $0.18
Next support: Around $0.15
Resistance: Around $0.22–$0.23
Momentum: Very strong, but highly volatile after the big pump.
Risk: Buying immediately after an ~85% move can be risky. A pullback/retest may offer a better entry.
My view: GTC is trending strongly, but there is no guaranteed-profit coin. A sharp correction is possible after such a large move.
If you want, I can make a �GTC trading setup with Entry + Stop Loss + Target 1/2/3.#EthereumValidatorExitQueueJumps392% #SECHaltsCryptoETFReviewsAmidFundingLapse #GreekPoliceBustCryptoScamRingArrest17 #FedOctoberRateHikeOddsFallTo17% #NvidiaHitsRecordHighUp2.4%
Trend: Strong Bullish
Current price: Around $0.22
Support: Around $0.18
Next support: Around $0.15
Resistance: Around $0.22–$0.23
Momentum: Very strong, but highly volatile after the big pump.
Risk: Buying immediately after an ~85% move can be risky. A pullback/retest may offer a better entry.
My view: GTC is trending strongly, but there is no guaranteed-profit coin. A sharp correction is possible after such a large move.
If you want, I can make a �GTC trading setup with Entry + Stop Loss + Target 1/2/3.#EthereumValidatorExitQueueJumps392% #SECHaltsCryptoETFReviewsAmidFundingLapse #GreekPoliceBustCryptoScamRingArrest17 #FedOctoberRateHikeOddsFallTo17% #NvidiaHitsRecordHighUp2.4%
1
506
·
--
Tăng giá
Xem bản dịch
$BNB
{spot}(BNBUSDT)
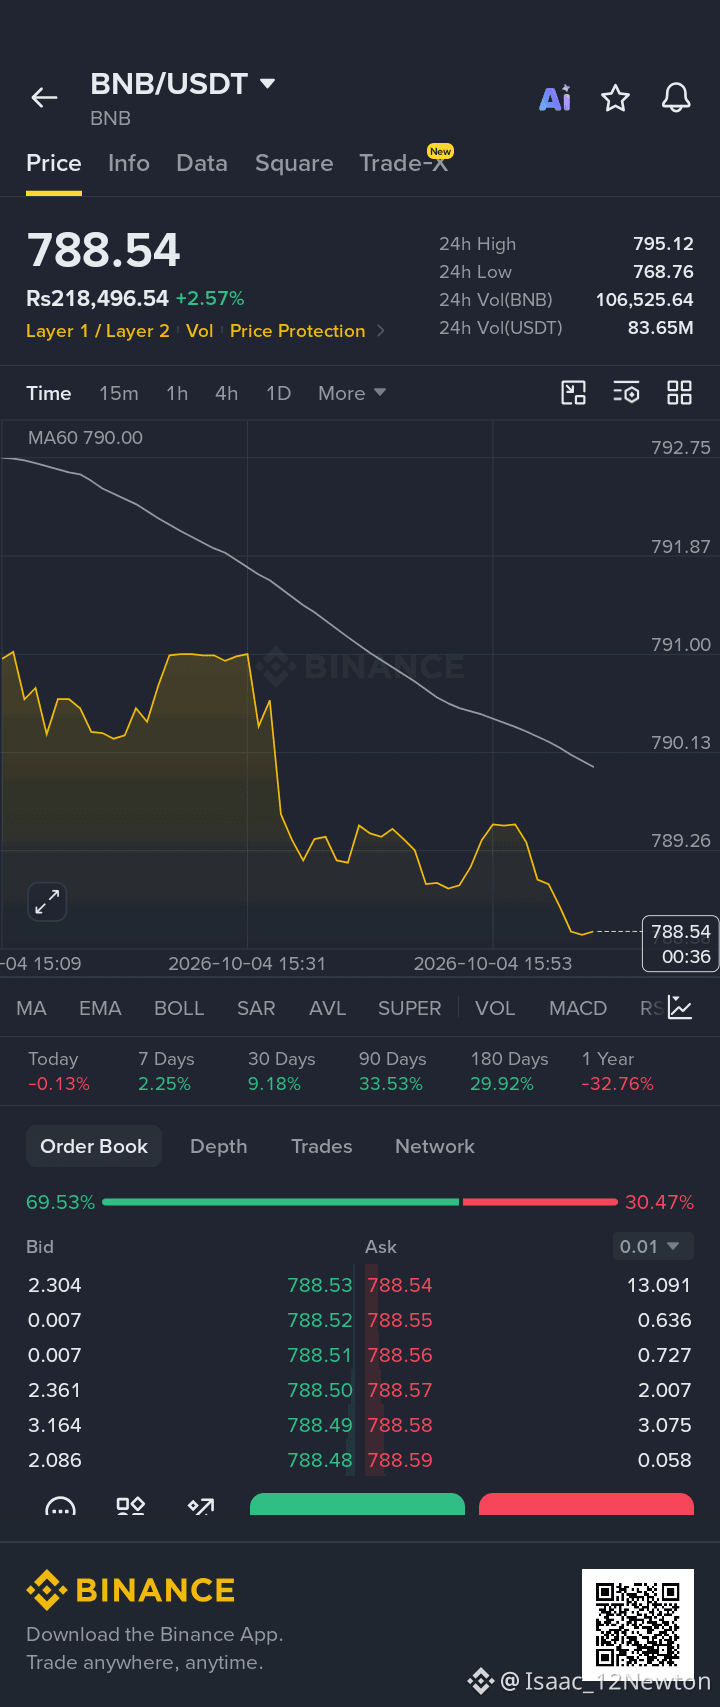
Current price: ~$787.5
24h: +2.83%
24h high/low: $791.54 / $764.89
Market cap: ~$104.9B �
Binance
BNB recent price trend
Daily BNB closing prices from Sep 27 to Oct 4, 2026.
BNB price
$786.8
Source: Investing.com
Technical levels
Support 1: $775–$780
Strong support: ~$730
Resistance 1: $800
Next resistance: $840–$850
Major resistance: ~$900
BNB is currently showing a mild bullish setup. RSI is around 58 and MACD is giving a buy signal; the 20- and 50-period moving averages are also below the current price. �
Investing.com
Bullish scenario: If BNB convincingly breaks $800, the next move could target $840–850. A break above that zone would make $900+ more interesting. �
FXEmpire
Bearish scenario: If it loses $775, momentum could weaken. A break below $730 would be a much more important bearish signal, with ~$645 mentioned as the next major support area. �
CoinMarketCap
My view
Short term: 🟢 Bullish, but $800 is the key confirmation level.
I would not call it a confirmed breakout until BNB gets above $800 with strong volume.
BNB also has some fundamental catalysts right now, including the upcoming quarterly burn and progress around a spot BNB ETF filing with staking. �
tradingkey.com +1
This is market analysis, not a guarantee or personal financial advice.#SECHaltsCryptoETFReviewsAmidFundingLapse #GreekPoliceBustCryptoScamRingArrest17 #FedOctoberRateHikeOddsFallTo17% #NvidiaHitsRecordHighUp2.4% #CanaryFilesAmendedS1ForPEPEETF
$BNB
Current price: ~$787.5
24h: +2.83%
24h high/low: $791.54 / $764.89
Market cap: ~$104.9B �
Binance
BNB recent price trend
Daily BNB closing prices from Sep 27 to Oct 4, 2026.
BNB price
$786.8
Source: Investing.com
Technical levels
Support 1: $775–$780
Strong support: ~$730
Resistance 1: $800
Next resistance: $840–$850
Major resistance: ~$900
BNB is currently showing a mild bullish setup. RSI is around 58 and MACD is giving a buy signal; the 20- and 50-period moving averages are also below the current price. �
Investing.com
Bullish scenario: If BNB convincingly breaks $800, the next move could target $840–850. A break above that zone would make $900+ more interesting. �
FXEmpire
Bearish scenario: If it loses $775, momentum could weaken. A break below $730 would be a much more important bearish signal, with ~$645 mentioned as the next major support area. �
CoinMarketCap
My view
Short term: 🟢 Bullish, but $800 is the key confirmation level.
I would not call it a confirmed breakout until BNB gets above $800 with strong volume.
BNB also has some fundamental catalysts right now, including the upcoming quarterly burn and progress around a spot BNB ETF filing with staking. �
tradingkey.com +1
This is market analysis, not a guarantee or personal financial advice.#SECHaltsCryptoETFReviewsAmidFundingLapse #GreekPoliceBustCryptoScamRingArrest17 #FedOctoberRateHikeOddsFallTo17% #NvidiaHitsRecordHighUp2.4% #CanaryFilesAmendedS1ForPEPEETF
Current price: ~$787.5
24h: +2.83%
24h high/low: $791.54 / $764.89
Market cap: ~$104.9B �
Binance
BNB recent price trend
Daily BNB closing prices from Sep 27 to Oct 4, 2026.
BNB price
$786.8
Source: Investing.com
Technical levels
Support 1: $775–$780
Strong support: ~$730
Resistance 1: $800
Next resistance: $840–$850
Major resistance: ~$900
BNB is currently showing a mild bullish setup. RSI is around 58 and MACD is giving a buy signal; the 20- and 50-period moving averages are also below the current price. �
Investing.com
Bullish scenario: If BNB convincingly breaks $800, the next move could target $840–850. A break above that zone would make $900+ more interesting. �
FXEmpire
Bearish scenario: If it loses $775, momentum could weaken. A break below $730 would be a much more important bearish signal, with ~$645 mentioned as the next major support area. �
CoinMarketCap
My view
Short term: 🟢 Bullish, but $800 is the key confirmation level.
I would not call it a confirmed breakout until BNB gets above $800 with strong volume.
BNB also has some fundamental catalysts right now, including the upcoming quarterly burn and progress around a spot BNB ETF filing with staking. �
tradingkey.com +1
This is market analysis, not a guarantee or personal financial advice.#SECHaltsCryptoETFReviewsAmidFundingLapse #GreekPoliceBustCryptoScamRingArrest17 #FedOctoberRateHikeOddsFallTo17% #NvidiaHitsRecordHighUp2.4% #CanaryFilesAmendedS1ForPEPEETF
2
240
$GLMR
{spot}(GLMRUSDT)
Mức giá quan trọng
Hiện tại: ~$0.0128
Kháng cự ngay lập tức: ~$0.0140
Vùng bứt phá: ~$0.0140–$0.0145
Khả năng điều chỉnh/hỗ trợ: ~$0.0100–$0.0105
Hỗ trợ mạnh hơn: ~$0.0085–$0.0090
GLMR đã di chuyển từ khoảng $0.00864 lên mức cao gần $0.01403 trong dữ liệu hằng ngày gần nhất, cho thấy mức tăng đã rất mạnh. �
CoinCodex
Nhận định của tôi
Ngắn hạn: TÍCH CỰC, nhưng biến động cực cao.
Điều quan trọng là GLMR đã thực hiện một bước nhảy lớn rồi. Việc đuổi theo giá sau một cú bơm ~47% trong ngày mang rủi ro đảo chiều đáng kể. Mức tăng khối lượng cũng rất lớn, nên đây không chỉ là một cú “giật” khối lượng nhỏ. �
CoinGecko +1
Kịch bản lạc quan: Nếu phá vỡ và giữ vững thuyết phục trên $0.0140–$0.0145 có thể báo hiệu một đợt tăng tiếp theo.
Kịch bản bi quan: Nếu GLMR bị từ chối quanh $0.014 và rơi lại dưới $0.010, thì cú bơm hiện tại có thể đang mất dần động lực.
Kết luận: GLMR đang rất nóng vào lúc này, nhưng tôi sẽ theo dõi để có xác nhận hoặc chờ một nhịp điều chỉnh thay vì cho rằng cú tăng +47% sẽ tiếp diễn. Đây là phân tích thị trường, không phải cam kết hay tín hiệu mua hàng.#SECHaltsCryptoETFReviewsAmidFundingLapse #GreekPoliceBustCryptoScamRingArrest17 #FedOctoberRateHikeOddsFallTo17% #NvidiaHitsRecordHighUp2.4% #CanaryFilesAmendedS1ForPEPEETF
$GLMR
Mức giá quan trọng
Hiện tại: ~$0.0128
Kháng cự ngay lập tức: ~$0.0140
Vùng bứt phá: ~$0.0140–$0.0145
Khả năng điều chỉnh/hỗ trợ: ~$0.0100–$0.0105
Hỗ trợ mạnh hơn: ~$0.0085–$0.0090
GLMR đã di chuyển từ khoảng $0.00864 lên mức cao gần $0.01403 trong dữ liệu hằng ngày gần nhất, cho thấy mức tăng đã rất mạnh. �
CoinCodex
Nhận định của tôi
Ngắn hạn: TÍCH CỰC, nhưng biến động cực cao.
Điều quan trọng là GLMR đã thực hiện một bước nhảy lớn rồi. Việc đuổi theo giá sau một cú bơm ~47% trong ngày mang rủi ro đảo chiều đáng kể. Mức tăng khối lượng cũng rất lớn, nên đây không chỉ là một cú “giật” khối lượng nhỏ. �
CoinGecko +1
Kịch bản lạc quan: Nếu phá vỡ và giữ vững thuyết phục trên $0.0140–$0.0145 có thể báo hiệu một đợt tăng tiếp theo.
Kịch bản bi quan: Nếu GLMR bị từ chối quanh $0.014 và rơi lại dưới $0.010, thì cú bơm hiện tại có thể đang mất dần động lực.
Kết luận: GLMR đang rất nóng vào lúc này, nhưng tôi sẽ theo dõi để có xác nhận hoặc chờ một nhịp điều chỉnh thay vì cho rằng cú tăng +47% sẽ tiếp diễn. Đây là phân tích thị trường, không phải cam kết hay tín hiệu mua hàng.#SECHaltsCryptoETFReviewsAmidFundingLapse #GreekPoliceBustCryptoScamRingArrest17 #FedOctoberRateHikeOddsFallTo17% #NvidiaHitsRecordHighUp2.4% #CanaryFilesAmendedS1ForPEPEETF
Mức giá quan trọng
Hiện tại: ~$0.0128
Kháng cự ngay lập tức: ~$0.0140
Vùng bứt phá: ~$0.0140–$0.0145
Khả năng điều chỉnh/hỗ trợ: ~$0.0100–$0.0105
Hỗ trợ mạnh hơn: ~$0.0085–$0.0090
GLMR đã di chuyển từ khoảng $0.00864 lên mức cao gần $0.01403 trong dữ liệu hằng ngày gần nhất, cho thấy mức tăng đã rất mạnh. �
CoinCodex
Nhận định của tôi
Ngắn hạn: TÍCH CỰC, nhưng biến động cực cao.
Điều quan trọng là GLMR đã thực hiện một bước nhảy lớn rồi. Việc đuổi theo giá sau một cú bơm ~47% trong ngày mang rủi ro đảo chiều đáng kể. Mức tăng khối lượng cũng rất lớn, nên đây không chỉ là một cú “giật” khối lượng nhỏ. �
CoinGecko +1
Kịch bản lạc quan: Nếu phá vỡ và giữ vững thuyết phục trên $0.0140–$0.0145 có thể báo hiệu một đợt tăng tiếp theo.
Kịch bản bi quan: Nếu GLMR bị từ chối quanh $0.014 và rơi lại dưới $0.010, thì cú bơm hiện tại có thể đang mất dần động lực.
Kết luận: GLMR đang rất nóng vào lúc này, nhưng tôi sẽ theo dõi để có xác nhận hoặc chờ một nhịp điều chỉnh thay vì cho rằng cú tăng +47% sẽ tiếp diễn. Đây là phân tích thị trường, không phải cam kết hay tín hiệu mua hàng.#SECHaltsCryptoETFReviewsAmidFundingLapse #GreekPoliceBustCryptoScamRingArrest17 #FedOctoberRateHikeOddsFallTo17% #NvidiaHitsRecordHighUp2.4% #CanaryFilesAmendedS1ForPEPEETF
1
293
Xem bản dịch
$BTC
{spot}(BTCUSDT)
Analysis — October 4, 2026
Current price zone: ~$84.7K–$85K
Key resistance
$86K
$87K–$88K
A strong daily close above $88K could open the way toward $90K, then potentially $95K–$96K.
Key support
$83.8K–$84K
$82K–$82.5K
Below $82K, the $74K–$78K area becomes important.
Market structure: Moderately bullish. BTC is holding above important moving averages, while RSI is around the mid-60s, suggesting positive momentum without being deeply overbought.
My view: 🔥 Bullish above $88K breakout / cautious below $82K.
The $87K–$88K zone is the key area to watch.
This is market analysis for educational purposes, not financial advice.#SECHaltsCryptoETFReviewsAmidFundingLapse #GreekPoliceBustCryptoScamRingArrest17 #FedOctoberRateHikeOddsFallTo17% #NvidiaHitsRecordHighUp2.4% #CanaryFilesAmendedS1ForPEPEETF
$BTC
Analysis — October 4, 2026
Current price zone: ~$84.7K–$85K
Key resistance
$86K
$87K–$88K
A strong daily close above $88K could open the way toward $90K, then potentially $95K–$96K.
Key support
$83.8K–$84K
$82K–$82.5K
Below $82K, the $74K–$78K area becomes important.
Market structure: Moderately bullish. BTC is holding above important moving averages, while RSI is around the mid-60s, suggesting positive momentum without being deeply overbought.
My view: 🔥 Bullish above $88K breakout / cautious below $82K.
The $87K–$88K zone is the key area to watch.
This is market analysis for educational purposes, not financial advice.#SECHaltsCryptoETFReviewsAmidFundingLapse #GreekPoliceBustCryptoScamRingArrest17 #FedOctoberRateHikeOddsFallTo17% #NvidiaHitsRecordHighUp2.4% #CanaryFilesAmendedS1ForPEPEETF
Analysis — October 4, 2026
Current price zone: ~$84.7K–$85K
Key resistance
$86K
$87K–$88K
A strong daily close above $88K could open the way toward $90K, then potentially $95K–$96K.
Key support
$83.8K–$84K
$82K–$82.5K
Below $82K, the $74K–$78K area becomes important.
Market structure: Moderately bullish. BTC is holding above important moving averages, while RSI is around the mid-60s, suggesting positive momentum without being deeply overbought.
My view: 🔥 Bullish above $88K breakout / cautious below $82K.
The $87K–$88K zone is the key area to watch.
This is market analysis for educational purposes, not financial advice.#SECHaltsCryptoETFReviewsAmidFundingLapse #GreekPoliceBustCryptoScamRingArrest17 #FedOctoberRateHikeOddsFallTo17% #NvidiaHitsRecordHighUp2.4% #CanaryFilesAmendedS1ForPEPEETF
1
124
Đăng nhập để khám phá thêm nội dung
Tham gia cùng người dùng tiền mã hóa toàn cầu trên Binance Square
⚡️ Nhận thông tin mới nhất và hữu ích về tiền mã hóa.
💬 Được tin cậy bởi sàn giao dịch tiền mã hóa lớn nhất thế giới.
👍 Khám phá những thông tin chuyên sâu thực tế từ những nhà sáng tạo đã xác minh.
Email / Số điện thoại
Chủ đề thịnh hành
TheoDõiFOMC
137,965 lượt xem
701 đang thảo luận
#TheoDõiFOMC
🔥 FOMC lại bắt đầu trở thành tâm điểm của crypto
Bitcoin vừa bước vào tháng 10, nhưng câu chuyện lớn phía sau thị trường lúc này không chỉ là giá.
Các trader đang bắt đầu hướng sự chú ý về cuộc họp FOMC ngày 27–28/10. Sau một loạt phát biểu mới từ quan chức Fed, kỳ vọng về việc tăng lãi suất ngay trong tháng 10 đã giảm đáng kể.
Điều thú vị là trước đó thị trường từng đặt cược khá cao vào một đợt tăng tiếp theo.
Giờ thì mọi thứ lại quay sang chờ dữ liệu kinh tế và những phát biểu tiếp theo của Fed.
Với crypto, chỉ cần kỳ vọng lãi suất thay đổi mạnh là $BTC có thể lập tức biến động, rồi kéo theo cả thị trường altcoin.
Tháng 10 mới bắt đầu mà macro đã có chuyện để hóng rồi 👀
#Bitcoin #Crypto #Macro #Fed #BinanceSquare
X LEI
·0 lượt thích
·178 lượt xem
TinFed
124,352 lượt xem
504 đang thảo luận
BinanceLaunchesBinanceIntelligence
287,906 lượt xem
2,513 đang thảo luận