

Atta_e_Abbas110
3 Bài đăng

Atta_e_Abbas110
Báo cáo
Chặn người dùng
10 Đang theo dõi
22 Người theo dõi
14 Đã thích
Bài đăng
🧠 Quản lý rủi ro và biến động thị trường: Thanh khoản đang dịch chuyển về đâu?
$BTC vẫn giữ vị thế áp đảo với tỷ trọng trên 59%, trong khi lợi suất vĩ mô biến động, thị trường đang cho thấy sự phân hóa rõ nét: dòng vốn tổ chức ưu tiên sự an toàn, còn các nhà giao dịch năng động săn tìm biến động ở những altcoin có khối lượng giao dịch lớn.
Để điều hướng thành công trong những điều kiện thị trường này, điều quan trọng không phải là đoán chính xác đỉnh hay đáy, mà là thực hiện một khuôn khổ quản lý rủi ro có hệ thống.
Dưới đây là 3 quy tắc giao dịch mà mọi nhà giao dịch nên tuân theo ngay lúc này:
1️⃣ Quản lý ký quỹ hợp lý rất quan trọng (Ký quỹ biệt lập và ký quỹ chéo)
Trong những đợt biến động mạnh, sử dụng đòn bẩy quá mức với ký quỹ chéo có thể khiến toàn bộ số dư tài khoản của bạn gặp rủi ro. Sử dụng ký quỹ biệt lập giúp giới hạn mức thua lỗ cho từng vị thế và bảo vệ nguồn vốn cốt lõi của bạn.
2️⃣ Theo dõi thanh khoản sổ lệnh và bản đồ nhiệt
Đừng giao dịch một cách mù quáng khi giá tiến sát vùng kháng cự. Hãy xem bản đồ độ sâu để xác định vị trí thực tế của các tường bán và cụm thanh khoản trước khi đặt lệnh giới hạn. Những cú phá vỡ giả thường xảy ra khi thanh khoản suy giảm trong điều kiện khối lượng giao dịch thấp.
3️⃣ Ưu tiên bảo toàn vốn
Một chiến lược thắng lợi tập trung vào tiềm năng tăng giá, nhưng một chiến lược bền vững tập trung vào việc bảo vệ trước rủi ro giảm giá. Luôn tính toán quy mô vị thế dựa trên tỷ lệ thua lỗ tối đa có thể chấp nhận, chứ không phải lợi nhuận tiềm năng.
📌 Trọng tâm hiện tại và hoạt động cộng đồng:
Bạn đang nắm giữ các vị thế giao ngay trong giai đoạn tích lũy này, hay tích cực lướt sóng trước biến động ngắn hạn?
Chia sẻ cách thiết lập giao dịch và các mức giá quan trọng của bạn bên dưới nhé! 👇
$BTC $ETH
#CryptoTrading. #BinanceSquareFamily #writetoearn #RiskManagementMastery #MarketAnalysis
98
Xem bản dịch
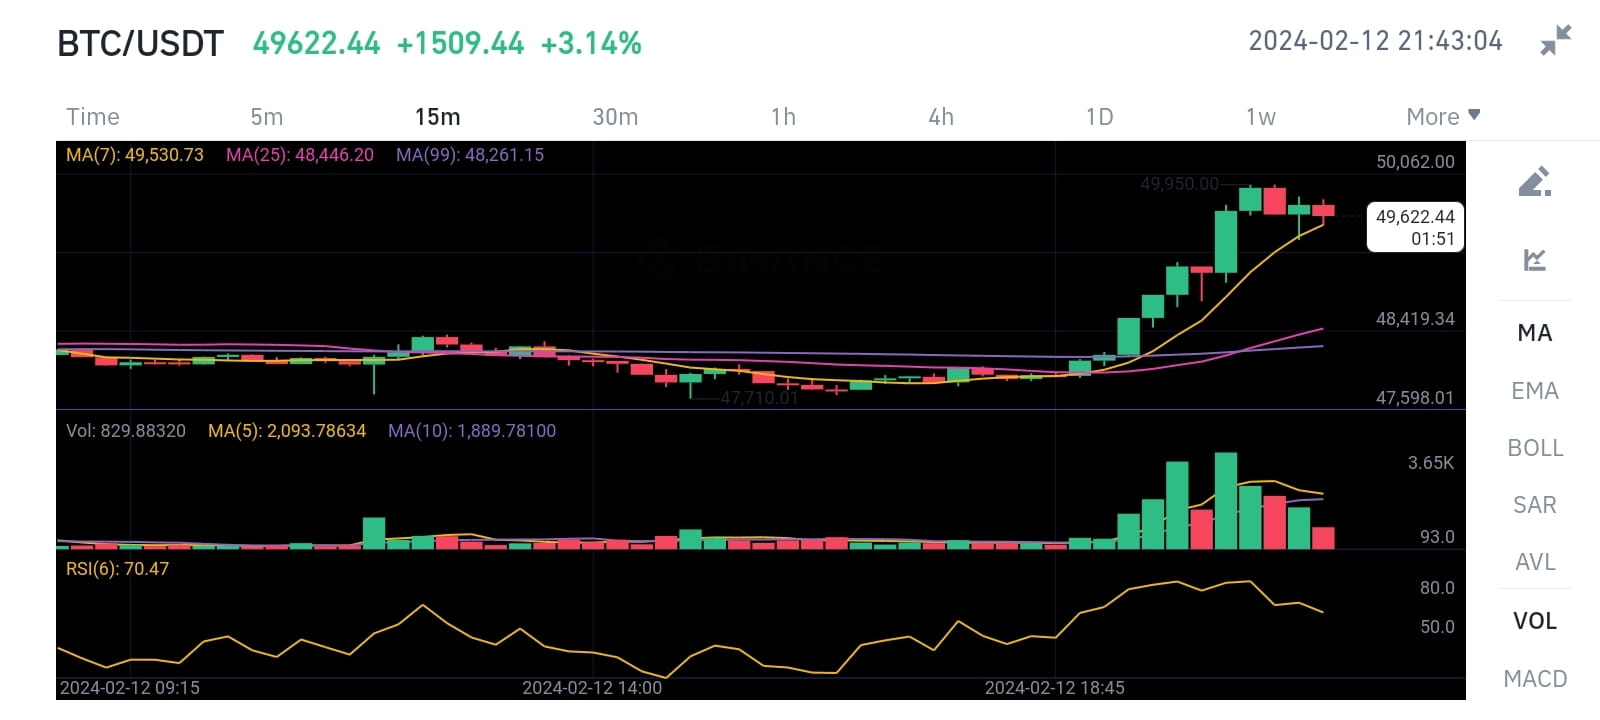
$BTC I can try to help you with that. Here is my analysis of the chart:
The chart shows the price movement of BTC/USDT (Bitcoin/Tether) trading pair on a 15-minute time frame.
The price is in an uptrend, as indicated by the higher highs and higher lows, and the moving averages (MA7, MA25, MA99) being in ascending order.
The support point is around 47,598.01, where the price had a consolidation before moving upwards. This level can act as a floor for the price, and if it breaks below it, it may signal a reversal of the trend.
The resistance point is at 50,062.00, where the highest price is marked. This level can act as a ceiling for the price, and if it breaks above it, it may signal a continuation of the trend.
The RSI (Relative Strength Index) is at 70.47, which is close to the overbought zone (above 70). This means that the price may be overvalued and due for a correction or a pullback.
The volume bars show that the buying volume is higher than the selling volume, which confirms the bullish sentiment of the market.
Based on this analysis, one possible trading strategy is to buy BTC/USDT at the support level of 47,598.01, and sell it at the resistance level of 50,062.00, or hold it until the trend changes. However, this is not a financial advice, and you should do your own research and risk management before making any trading decisions.
if you want more analysis like this you have to like comment
#Write2Earn
#TrendingTopic #BTC
7
984
Xem bản dịch
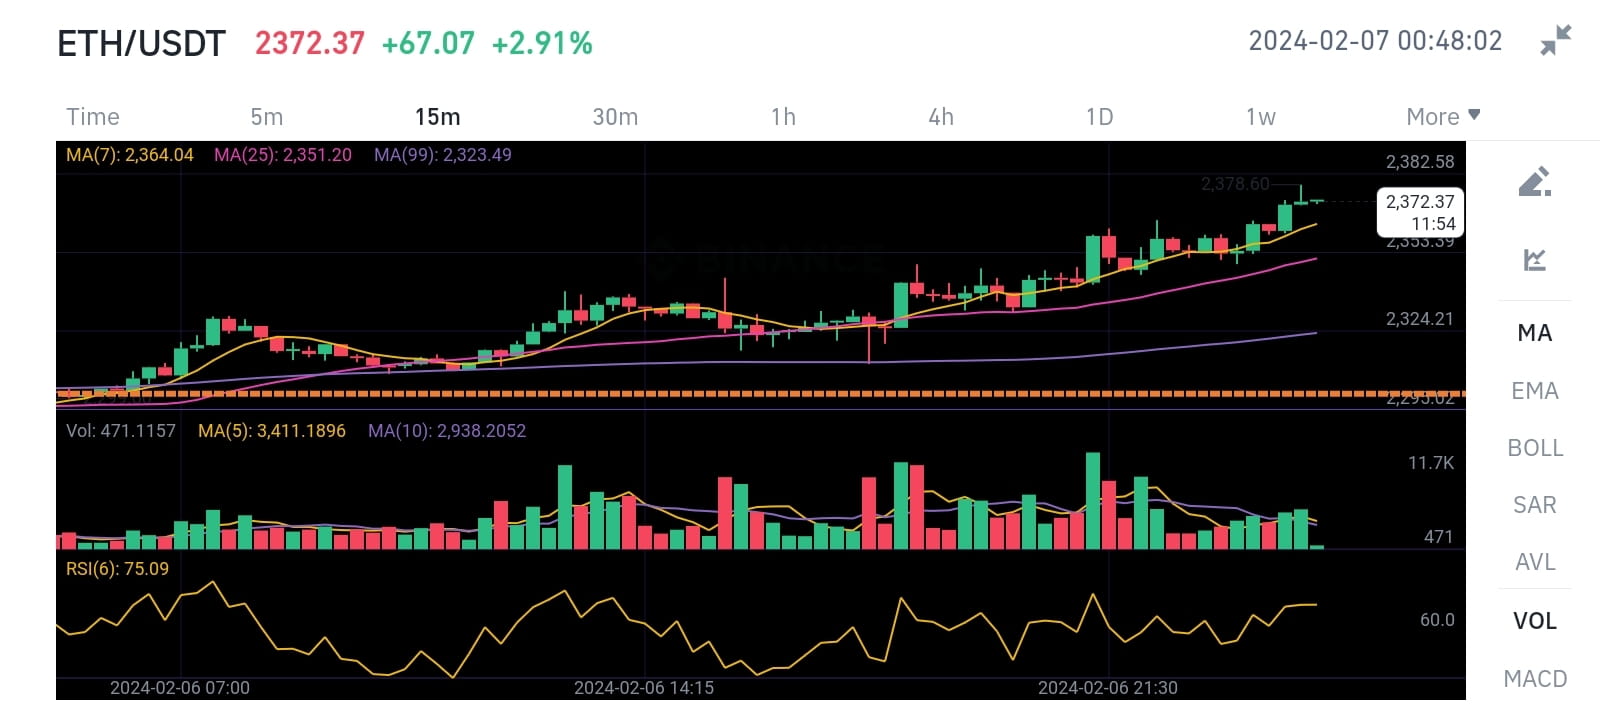
$ETH This is my technical analysis for this chart. I hope you find it helpful. 😊
The support can be identified around the price of 2324.21 USDT where the price has bounced back up previously. This level also coincides with the MA99 line, which adds to its strength as a support. If the price breaks below this level, it could indicate a bearish trend and the next support could be around 2300 USDT where the price has found support in the past.
The resistance point is likely near the current high in this image at 2372.37 USDT. This level is also close to the RSI overbought zone, which suggests that the price might face some selling pressure and pull back. If the price breaks above this level, it could indicate a bullish trend and the next resistance could be around 2400 USDT where the price has faced resistance in the past.#Write2Earn #Write2Earn #Write2Earn
7
2.1k
Đăng nhập để khám phá thêm nội dung
Tham gia cùng người dùng tiền mã hóa toàn cầu trên Binance Square
⚡️ Nhận thông tin mới nhất và hữu ích về tiền mã hóa.
💬 Được tin cậy bởi sàn giao dịch tiền mã hóa lớn nhất thế giới.
👍 Khám phá những thông tin chuyên sâu thực tế từ những nhà sáng tạo đã xác minh.
Email / Số điện thoại
Chủ đề thịnh hành
CanMicrosoftDeliverOnAI
368,268 lượt xem
2,906 đang thảo luận
Phiên 3 của mùa công bố kết quả kinh doanh: Google và Microsoft có vượt kỳ vọng không?
Binance Square Official
·141 lượt thích
·70.2k lượt xem
CanGoogleDefindItsCore
220,588 lượt xem
2,067 đang thảo luận
TinFed
366,877 lượt xem
997 đang thảo luận