

Deirdre Contrerras Q4OM
8 Bài đăng

Deirdre Contrerras Q4OM
Báo cáo
Chặn người dùng
Giao dịch mở
Trader tần suất thấp
{thời gian} năm
7 Đang theo dõi
3 Người theo dõi
1 Đã thích
Bài đăng
Danh mục đầu tư
·
--
Tăng giá
🚀
{spot}(IOSTUSDT)
(IOST) Triển vọng tương lai: Liệu nước đi tiếp theo có thể cao hơn không?
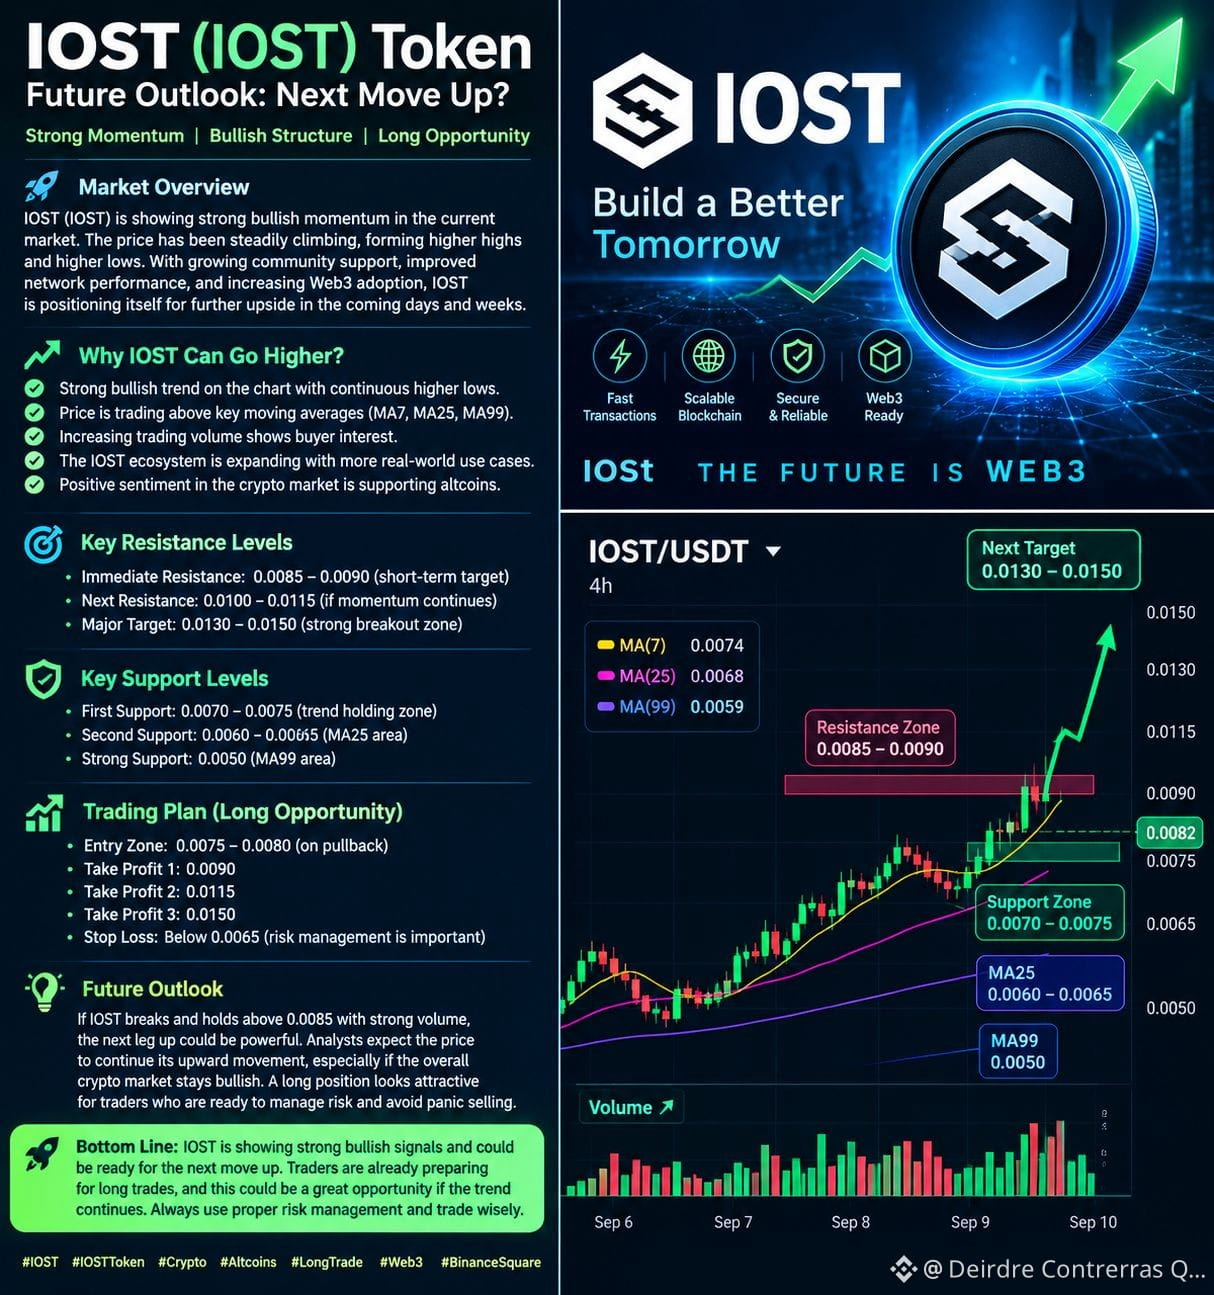
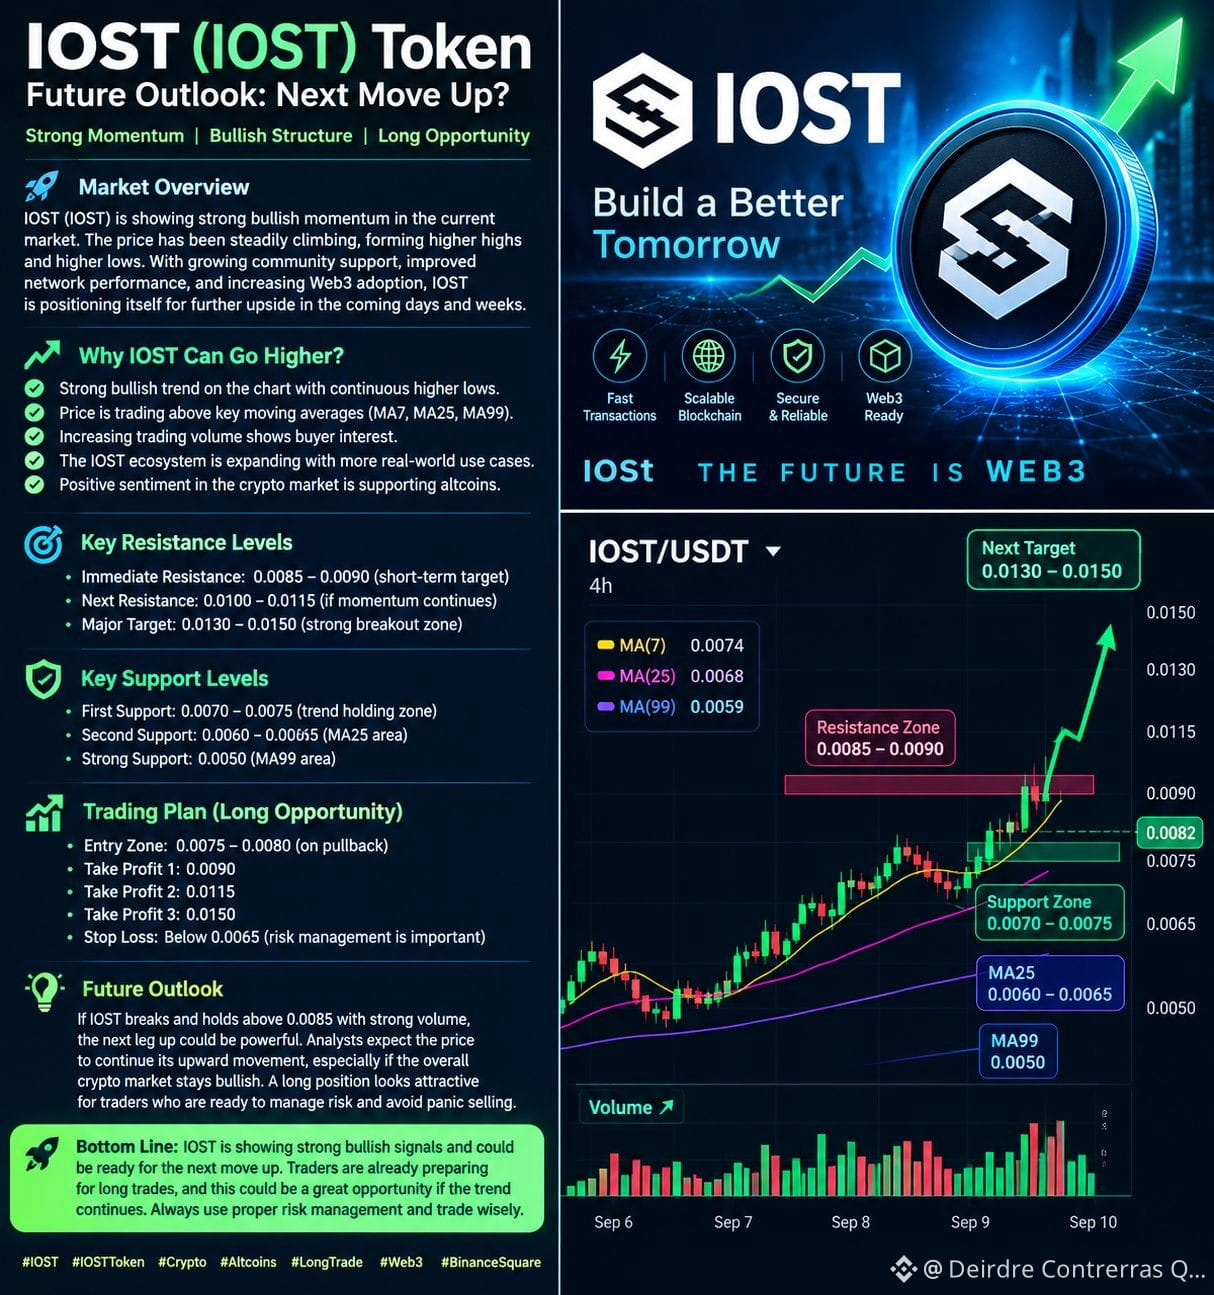
$IOST đang cho thấy một cấu trúc tăng giá đáng chú ý trên biểu đồ được cung cấp. Diễn biến giá gần đây đã được hỗ trợ bởi các đỉnh cao hơn và đáy cao hơn, trong khi hoạt động giao dịch cho thấy sự quan tâm ngày càng tăng từ phía người mua. Nếu đà này tiếp tục, $IOST có thể còn chỗ cho một đợt tăng tiếp theo.
📈 Vì sao $IOST có thể tăng cao hơn
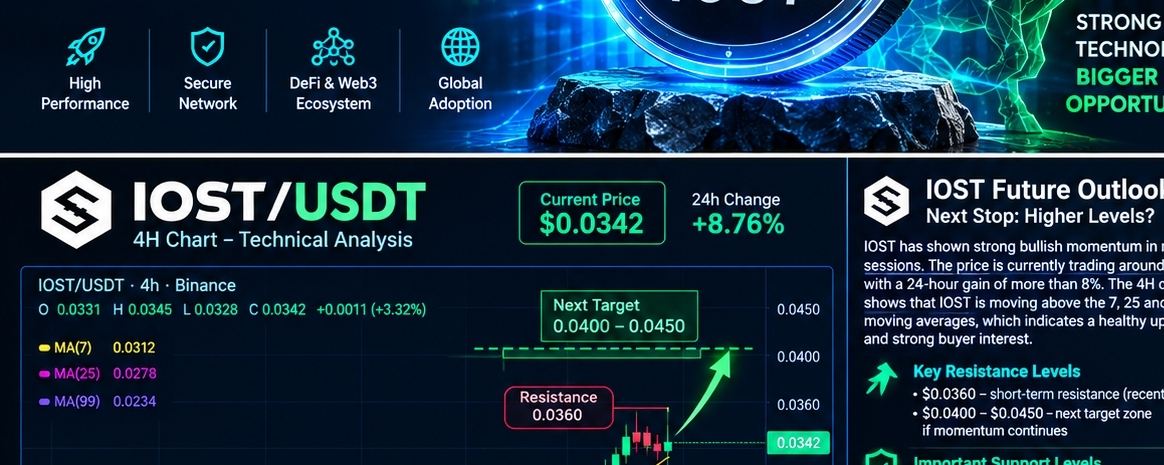
Biểu đồ cho thấy giá đang giao dịch cao hơn một số đường trung bình động quan trọng, bao gồm MA(7), MA(25) và MA(99). Cấu trúc này thường cho thấy động lượng ngắn hạn đang nghiêng về phía người mua.
Một yếu tố tích cực khác là khối lượng giao dịch tăng lên trong giai đoạn đi lên. Khối lượng mạnh kết hợp với việc vượt kháng cự có thể mang lại xác nhận tốt hơn cho khả năng tiếp diễn xu hướng tăng.
🎯 Các mốc quan trọng cần theo dõi
Kháng cự quan trọng đầu tiên nằm quanh $0.0360. Nếu có một cú breakout rõ ràng và duy trì đóng cửa vững chắc trên mức này, đặc biệt với khối lượng lớn, có thể mở đường hướng tới khu vực $0.0400–$0.0450.
Ở chiều ngược lại, vùng $0.0310–$0.0280 có thể được xem như một khu vực hỗ trợ quan trọng. Việc giữ được vùng này sẽ giúp duy trì cấu trúc tăng giá hiện tại.
🟢 Ý tưởng Long Setup
Các trader tìm cơ hội vị thế long có thể cân nhắc chờ xác nhận sau khi vượt kháng cự hoặc đợi một nhịp điều chỉnh có kiểm soát về gần hỗ trợ thay vì đuổi theo một cú bơm đột ngột.
Nếu IOST phá vỡ kháng cự với khối lượng mạnh và duy trì được đà breakout, khả năng tiếp diễn tăng giá sẽ cao hơn. Tuy nhiên, thị trường crypto có thể đảo chiều nhanh chóng, vì vậy quản lý rủi ro phù hợp và đặt mức cắt lỗ rõ ràng là rất quan trọng.
#IOST #IOSTUSDT #IOSTToken #Crypto #Altcoins #LongTrade #BinanceSquare #CryptoAnalysis
🚀
(IOST) Triển vọng tương lai: Liệu nước đi tiếp theo có thể cao hơn không?
$IOST đang cho thấy một cấu trúc tăng giá đáng chú ý trên biểu đồ được cung cấp. Diễn biến giá gần đây đã được hỗ trợ bởi các đỉnh cao hơn và đáy cao hơn, trong khi hoạt động giao dịch cho thấy sự quan tâm ngày càng tăng từ phía người mua. Nếu đà này tiếp tục, $IOST có thể còn chỗ cho một đợt tăng tiếp theo.
📈 Vì sao $IOST có thể tăng cao hơn
Biểu đồ cho thấy giá đang giao dịch cao hơn một số đường trung bình động quan trọng, bao gồm MA(7), MA(25) và MA(99). Cấu trúc này thường cho thấy động lượng ngắn hạn đang nghiêng về phía người mua.
Một yếu tố tích cực khác là khối lượng giao dịch tăng lên trong giai đoạn đi lên. Khối lượng mạnh kết hợp với việc vượt kháng cự có thể mang lại xác nhận tốt hơn cho khả năng tiếp diễn xu hướng tăng.
🎯 Các mốc quan trọng cần theo dõi
Kháng cự quan trọng đầu tiên nằm quanh $0.0360. Nếu có một cú breakout rõ ràng và duy trì đóng cửa vững chắc trên mức này, đặc biệt với khối lượng lớn, có thể mở đường hướng tới khu vực $0.0400–$0.0450.
Ở chiều ngược lại, vùng $0.0310–$0.0280 có thể được xem như một khu vực hỗ trợ quan trọng. Việc giữ được vùng này sẽ giúp duy trì cấu trúc tăng giá hiện tại.
🟢 Ý tưởng Long Setup
Các trader tìm cơ hội vị thế long có thể cân nhắc chờ xác nhận sau khi vượt kháng cự hoặc đợi một nhịp điều chỉnh có kiểm soát về gần hỗ trợ thay vì đuổi theo một cú bơm đột ngột.
Nếu IOST phá vỡ kháng cự với khối lượng mạnh và duy trì được đà breakout, khả năng tiếp diễn tăng giá sẽ cao hơn. Tuy nhiên, thị trường crypto có thể đảo chiều nhanh chóng, vì vậy quản lý rủi ro phù hợp và đặt mức cắt lỗ rõ ràng là rất quan trọng.
#IOST #IOSTUSDT #IOSTToken #Crypto #Altcoins #LongTrade #BinanceSquare #CryptoAnalysis
(IOST) Triển vọng tương lai: Liệu nước đi tiếp theo có thể cao hơn không?
$IOST đang cho thấy một cấu trúc tăng giá đáng chú ý trên biểu đồ được cung cấp. Diễn biến giá gần đây đã được hỗ trợ bởi các đỉnh cao hơn và đáy cao hơn, trong khi hoạt động giao dịch cho thấy sự quan tâm ngày càng tăng từ phía người mua. Nếu đà này tiếp tục, $IOST có thể còn chỗ cho một đợt tăng tiếp theo.
📈 Vì sao $IOST có thể tăng cao hơn
Biểu đồ cho thấy giá đang giao dịch cao hơn một số đường trung bình động quan trọng, bao gồm MA(7), MA(25) và MA(99). Cấu trúc này thường cho thấy động lượng ngắn hạn đang nghiêng về phía người mua.
Một yếu tố tích cực khác là khối lượng giao dịch tăng lên trong giai đoạn đi lên. Khối lượng mạnh kết hợp với việc vượt kháng cự có thể mang lại xác nhận tốt hơn cho khả năng tiếp diễn xu hướng tăng.
🎯 Các mốc quan trọng cần theo dõi
Kháng cự quan trọng đầu tiên nằm quanh $0.0360. Nếu có một cú breakout rõ ràng và duy trì đóng cửa vững chắc trên mức này, đặc biệt với khối lượng lớn, có thể mở đường hướng tới khu vực $0.0400–$0.0450.
Ở chiều ngược lại, vùng $0.0310–$0.0280 có thể được xem như một khu vực hỗ trợ quan trọng. Việc giữ được vùng này sẽ giúp duy trì cấu trúc tăng giá hiện tại.
🟢 Ý tưởng Long Setup
Các trader tìm cơ hội vị thế long có thể cân nhắc chờ xác nhận sau khi vượt kháng cự hoặc đợi một nhịp điều chỉnh có kiểm soát về gần hỗ trợ thay vì đuổi theo một cú bơm đột ngột.
Nếu IOST phá vỡ kháng cự với khối lượng mạnh và duy trì được đà breakout, khả năng tiếp diễn tăng giá sẽ cao hơn. Tuy nhiên, thị trường crypto có thể đảo chiều nhanh chóng, vì vậy quản lý rủi ro phù hợp và đặt mức cắt lỗ rõ ràng là rất quan trọng.
#IOST #IOSTUSDT #IOSTToken #Crypto #Altcoins #LongTrade #BinanceSquare #CryptoAnalysis
26
Bài viết
🚀 Triển vọng tương lai của IOST (IOST): Liệu bước tiếp theo có thể cao hơn?
IOST (IOST) đang cho thấy một cấu trúc thú vị có xu hướng tăng🚀 $IOST Triển vọng tương lai của IOST: Liệu bước tiếp theo có thể cao hơn?
$IOST (IOST) đang cho thấy một cấu trúc tăng giá khá thú vị trên biểu đồ cung cấp. Diễn biến giá gần đây được hỗ trợ bởi các đỉnh cao hơn và đáy cao hơn, trong khi hoạt động giao dịch cho thấy sự quan tâm ngày càng tăng từ phía người mua. Nếu đà này tiếp tục, IOST có thể còn dư địa cho một nhịp đi lên nữa.
📈 Vì sao $IOST Có thể đi lên
Biểu đồ cho thấy giá đang giao dịch cao hơn một số đường trung bình động quan trọng, bao gồm MA(7), MA(25) và MA(99). Cấu trúc này nhìn chung cho thấy động lượng ngắn hạn đang nghiêng về phía người mua.
🚀 Triển vọng tương lai của IOST (IOST): Liệu bước tiếp theo có thể cao hơn? IOST (IOST) đang cho thấy một cấu trúc thú vị có xu hướng tăng
🚀 $IOST Triển vọng tương lai của IOST: Liệu bước tiếp theo có thể cao hơn?
$IOST (IOST) đang cho thấy một cấu trúc tăng giá khá thú vị trên biểu đồ cung cấp. Diễn biến giá gần đây được hỗ trợ bởi các đỉnh cao hơn và đáy cao hơn, trong khi hoạt động giao dịch cho thấy sự quan tâm ngày càng tăng từ phía người mua. Nếu đà này tiếp tục, IOST có thể còn dư địa cho một nhịp đi lên nữa.
📈 Vì sao $IOST Có thể đi lên
Biểu đồ cho thấy giá đang giao dịch cao hơn một số đường trung bình động quan trọng, bao gồm MA(7), MA(25) và MA(99). Cấu trúc này nhìn chung cho thấy động lượng ngắn hạn đang nghiêng về phía người mua.
$IOST (IOST) đang cho thấy một cấu trúc tăng giá khá thú vị trên biểu đồ cung cấp. Diễn biến giá gần đây được hỗ trợ bởi các đỉnh cao hơn và đáy cao hơn, trong khi hoạt động giao dịch cho thấy sự quan tâm ngày càng tăng từ phía người mua. Nếu đà này tiếp tục, IOST có thể còn dư địa cho một nhịp đi lên nữa.
📈 Vì sao $IOST Có thể đi lên
Biểu đồ cho thấy giá đang giao dịch cao hơn một số đường trung bình động quan trọng, bao gồm MA(7), MA(25) và MA(99). Cấu trúc này nhìn chung cho thấy động lượng ngắn hạn đang nghiêng về phía người mua.
1
57
🚀 Triển vọng Tương lai của SOPH Token: Xu hướng Tăng liệu đã sẵn sàng cho một đợt tăng nữa?
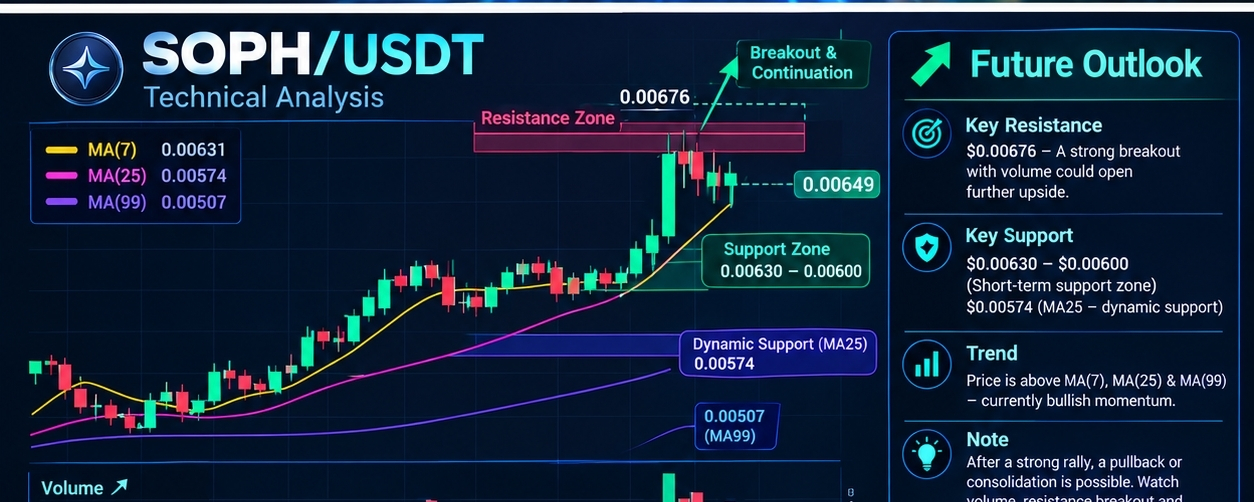
$SOPH /USDT đã thể hiện động lượng tăng mạnh trong phiên gần đây. Theo biểu đồ 15 phút được cung cấp, $SOPH đang giao dịch quanh $0.00649, trong khi mức cao gần đây đạt xấp xỉ $0.00676. Đồng thời, token cũng ghi nhận mức tăng hơn 56% trong 24 giờ, cho thấy nhu cầu mua mạnh.
Một trong những điểm quan trọng trên biểu đồ là giá hiện đang giao dịch cao hơn MA(7), MA(25) và MA(99). Đây là dấu hiệu tích cực cho xu hướng ngắn hạn. Các đường trung bình động lần lượt xấp xỉ $0.00631, $0.00574 và $0.00507, cho thấy hiện tại người mua đang nắm lợi thế.
📈 Kháng cự quan trọng đối với $SOPH
Khu vực $0.00676 là một mức kháng cự quan trọng vì giá gần đây đã từng bị từ chối tại đây. Nếu SOPH vượt lên trên mức này với khối lượng giao dịch mạnh và giữ vững nó, động lượng tăng có thể tiếp tục.
Sau khi có xác nhận bứt phá, nhà giao dịch có thể theo dõi các đỉnh mới và các mốc giá mang tính tâm lý. Tuy nhiên, các mục tiêu giá trong tương lai không nên được xem là chắc chắn.#SOPH #USIranTradeTankerStrikesEscalate #RussiaUkraineTradeStrikesKushnerWitkoffToKyiv
🚀 Triển vọng Tương lai của SOPH Token: Xu hướng Tăng liệu đã sẵn sàng cho một đợt tăng nữa?
$SOPH /USDT đã thể hiện động lượng tăng mạnh trong phiên gần đây. Theo biểu đồ 15 phút được cung cấp, $SOPH đang giao dịch quanh $0.00649, trong khi mức cao gần đây đạt xấp xỉ $0.00676. Đồng thời, token cũng ghi nhận mức tăng hơn 56% trong 24 giờ, cho thấy nhu cầu mua mạnh.
Một trong những điểm quan trọng trên biểu đồ là giá hiện đang giao dịch cao hơn MA(7), MA(25) và MA(99). Đây là dấu hiệu tích cực cho xu hướng ngắn hạn. Các đường trung bình động lần lượt xấp xỉ $0.00631, $0.00574 và $0.00507, cho thấy hiện tại người mua đang nắm lợi thế.
📈 Kháng cự quan trọng đối với $SOPH
Khu vực $0.00676 là một mức kháng cự quan trọng vì giá gần đây đã từng bị từ chối tại đây. Nếu SOPH vượt lên trên mức này với khối lượng giao dịch mạnh và giữ vững nó, động lượng tăng có thể tiếp tục.
Sau khi có xác nhận bứt phá, nhà giao dịch có thể theo dõi các đỉnh mới và các mốc giá mang tính tâm lý. Tuy nhiên, các mục tiêu giá trong tương lai không nên được xem là chắc chắn.#SOPH #USIranTradeTankerStrikesEscalate #RussiaUkraineTradeStrikesKushnerWitkoffToKyiv
$SOPH /USDT đã thể hiện động lượng tăng mạnh trong phiên gần đây. Theo biểu đồ 15 phút được cung cấp, $SOPH đang giao dịch quanh $0.00649, trong khi mức cao gần đây đạt xấp xỉ $0.00676. Đồng thời, token cũng ghi nhận mức tăng hơn 56% trong 24 giờ, cho thấy nhu cầu mua mạnh.
Một trong những điểm quan trọng trên biểu đồ là giá hiện đang giao dịch cao hơn MA(7), MA(25) và MA(99). Đây là dấu hiệu tích cực cho xu hướng ngắn hạn. Các đường trung bình động lần lượt xấp xỉ $0.00631, $0.00574 và $0.00507, cho thấy hiện tại người mua đang nắm lợi thế.
📈 Kháng cự quan trọng đối với $SOPH
Khu vực $0.00676 là một mức kháng cự quan trọng vì giá gần đây đã từng bị từ chối tại đây. Nếu SOPH vượt lên trên mức này với khối lượng giao dịch mạnh và giữ vững nó, động lượng tăng có thể tiếp tục.
Sau khi có xác nhận bứt phá, nhà giao dịch có thể theo dõi các đỉnh mới và các mốc giá mang tính tâm lý. Tuy nhiên, các mục tiêu giá trong tương lai không nên được xem là chắc chắn.#SOPH #USIranTradeTankerStrikesEscalate #RussiaUkraineTradeStrikesKushnerWitkoffToKyiv

50
Bài viết
Xem bản dịch
🚀 SOPH Token Future Outlook: Is the Bullish Trend Ready for Another Move?$SOPH /USDT has shown strong bullish momentum in the recent session. According to the provided 15-minute chart, $SOPH is trading around $0.00649, while the recent high reached approximately $0.00676. The token has also recorded a 56%+ 24-hour increase, showing strong buying interest.
One of the key points on the chart is that the price is currently trading above the MA(7), MA(25), and MA(99). This is a positive sign for the short-term trend. The moving averages are around $0.00631, $0.00574, and $0.00507, respectively, indicating that buyers currently have the upper hand.
📈 Key Resistance for $SOPH
The $0.00676 area is an important resistance level because the price recently faced rejection there. If SOPH breaks above this level with strong trading volume and holds it, the bullish momentum could continue.
After a confirmed breakout, traders may watch for new highs and psychological price levels. However, future price targets should not be considered guaranteed.
🛡️ Important Support Levels
In the short term, the $0.00630–$0.00600 area could act as an important support zone. If SOPH holds this area, the bullish structure may remain intact.
Below this zone, $0.00574, near the MA(25), is another important dynamic support. A move below this level could weaken the current bullish momentum and increase the possibility of a deeper correction.
🔮 Future Outlook
SOPH currently has a bullish short-term setup, but after such a strong rally, profit-taking and a temporary pullback are also possible. For better confirmation, traders should monitor trading volume, resistance breakouts, and candle closes.
If SOPH breaks $0.00676 with strong volume, the possibility of further bullish continuation could increase. On the other hand, repeated rejection from this level could lead to consolidation or a correction.
Bottom line: SOPH is currently showing strong momentum, but the next major move will likely depend on whether resistance breaks or support fails. Avoid FOMO and focus on confirmation and risk management. This article is for educational purposes only and is not financial advice.
#SOPH #Sophon #Crypto #BinanceSquare #Altcoins #CryptoAnalysis #SOPHUSDT #Web3
$
🚀 SOPH Token Future Outlook: Is the Bullish Trend Ready for Another Move?
$SOPH /USDT has shown strong bullish momentum in the recent session. According to the provided 15-minute chart, $SOPH is trading around $0.00649, while the recent high reached approximately $0.00676. The token has also recorded a 56%+ 24-hour increase, showing strong buying interest.
One of the key points on the chart is that the price is currently trading above the MA(7), MA(25), and MA(99). This is a positive sign for the short-term trend. The moving averages are around $0.00631, $0.00574, and $0.00507, respectively, indicating that buyers currently have the upper hand.
📈 Key Resistance for $SOPH
The $0.00676 area is an important resistance level because the price recently faced rejection there. If SOPH breaks above this level with strong trading volume and holds it, the bullish momentum could continue.
After a confirmed breakout, traders may watch for new highs and psychological price levels. However, future price targets should not be considered guaranteed.
🛡️ Important Support Levels
In the short term, the $0.00630–$0.00600 area could act as an important support zone. If SOPH holds this area, the bullish structure may remain intact.
Below this zone, $0.00574, near the MA(25), is another important dynamic support. A move below this level could weaken the current bullish momentum and increase the possibility of a deeper correction.
🔮 Future Outlook
SOPH currently has a bullish short-term setup, but after such a strong rally, profit-taking and a temporary pullback are also possible. For better confirmation, traders should monitor trading volume, resistance breakouts, and candle closes.
If SOPH breaks $0.00676 with strong volume, the possibility of further bullish continuation could increase. On the other hand, repeated rejection from this level could lead to consolidation or a correction.
Bottom line: SOPH is currently showing strong momentum, but the next major move will likely depend on whether resistance breaks or support fails. Avoid FOMO and focus on confirmation and risk management. This article is for educational purposes only and is not financial advice.
#SOPH #Sophon #Crypto #BinanceSquare #Altcoins #CryptoAnalysis #SOPHUSDT #Web3
$
One of the key points on the chart is that the price is currently trading above the MA(7), MA(25), and MA(99). This is a positive sign for the short-term trend. The moving averages are around $0.00631, $0.00574, and $0.00507, respectively, indicating that buyers currently have the upper hand.
📈 Key Resistance for $SOPH
The $0.00676 area is an important resistance level because the price recently faced rejection there. If SOPH breaks above this level with strong trading volume and holds it, the bullish momentum could continue.
After a confirmed breakout, traders may watch for new highs and psychological price levels. However, future price targets should not be considered guaranteed.
🛡️ Important Support Levels
In the short term, the $0.00630–$0.00600 area could act as an important support zone. If SOPH holds this area, the bullish structure may remain intact.
Below this zone, $0.00574, near the MA(25), is another important dynamic support. A move below this level could weaken the current bullish momentum and increase the possibility of a deeper correction.
🔮 Future Outlook
SOPH currently has a bullish short-term setup, but after such a strong rally, profit-taking and a temporary pullback are also possible. For better confirmation, traders should monitor trading volume, resistance breakouts, and candle closes.
If SOPH breaks $0.00676 with strong volume, the possibility of further bullish continuation could increase. On the other hand, repeated rejection from this level could lead to consolidation or a correction.
Bottom line: SOPH is currently showing strong momentum, but the next major move will likely depend on whether resistance breaks or support fails. Avoid FOMO and focus on confirmation and risk management. This article is for educational purposes only and is not financial advice.
#SOPH #Sophon #Crypto #BinanceSquare #Altcoins #CryptoAnalysis #SOPHUSDT #Web3
$
110
Xem bản dịch
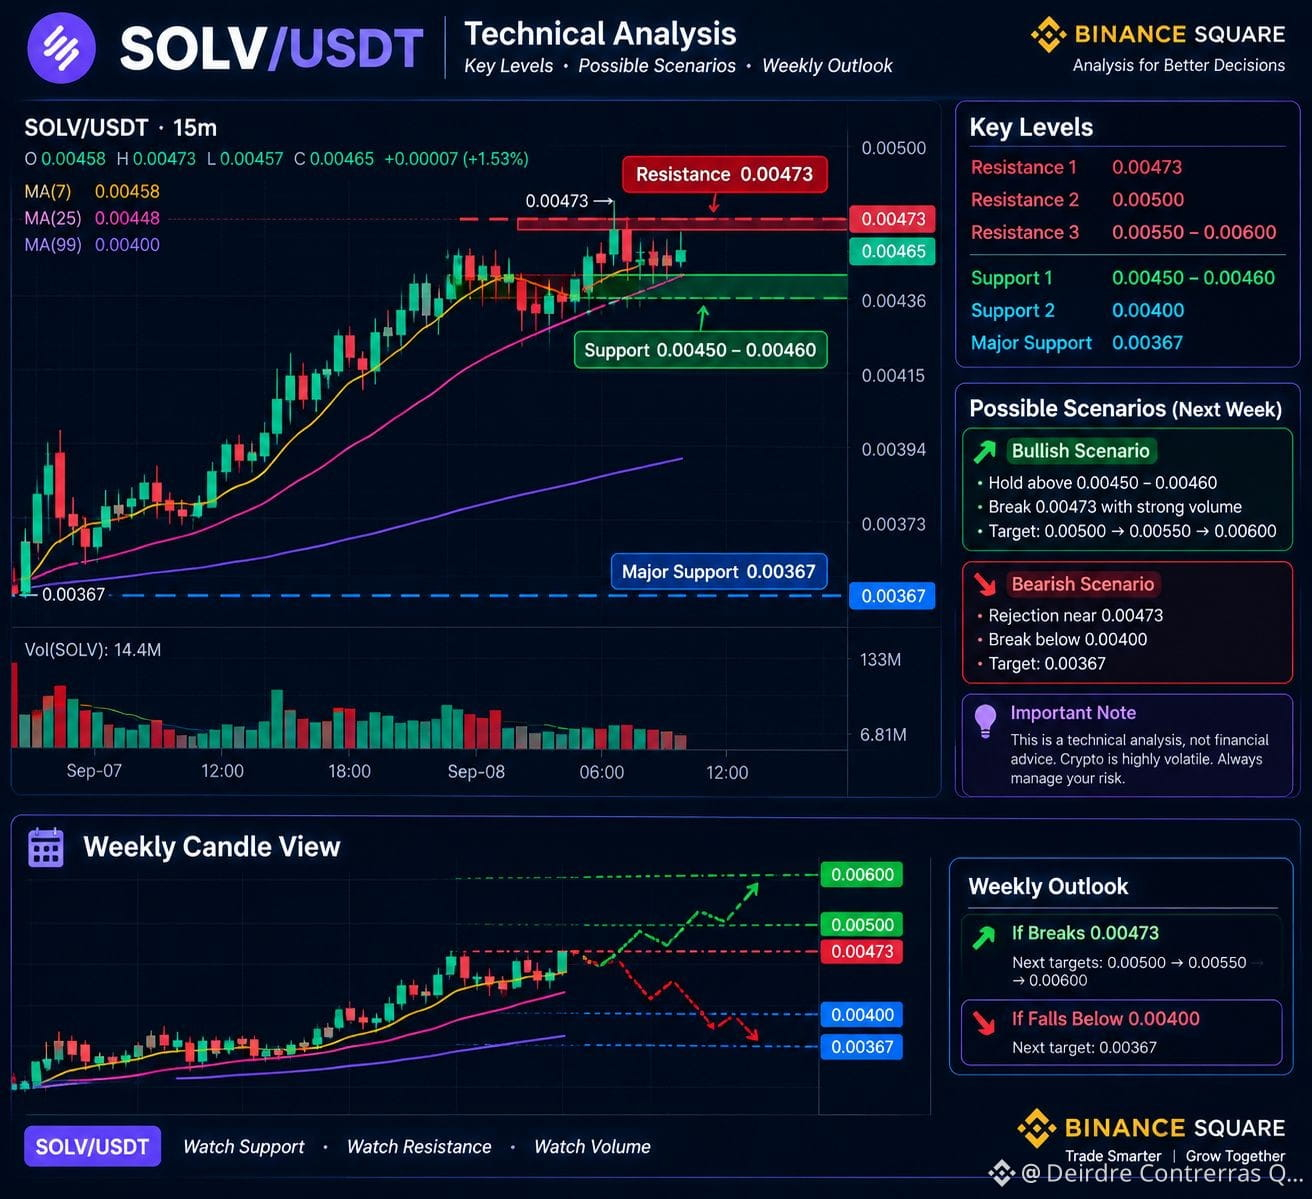
SOLV/USDT Technical Analysis: Can the Current Momentum Continue?
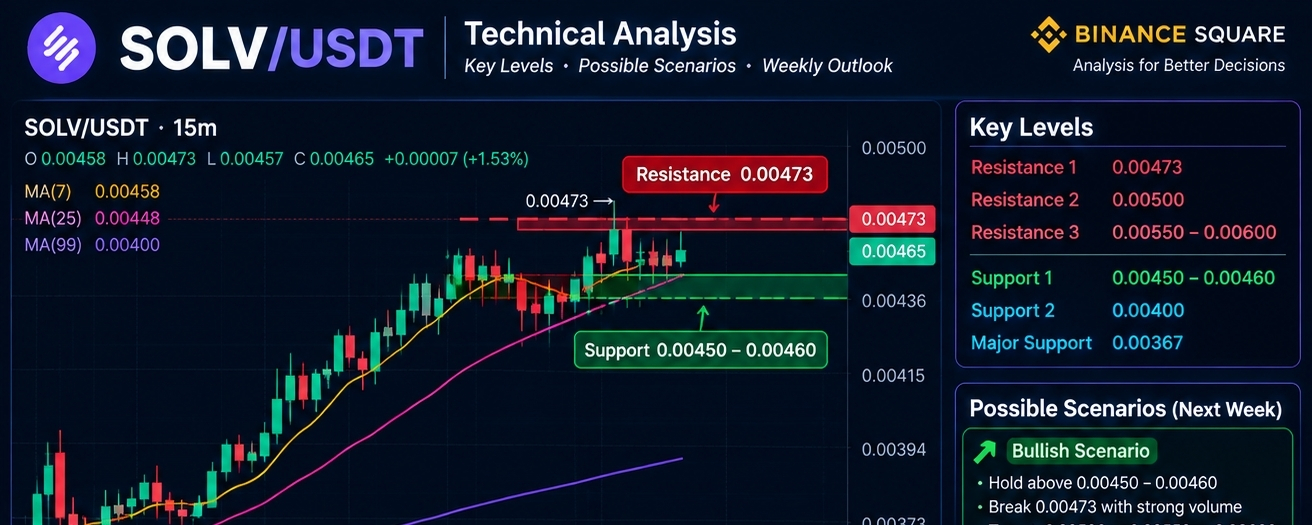
$SOLV /USDT has recently shown strong upward momentum on the 15-minute chart. At the time shown in the chart, $SOLV is trading around 0.00465 USDT, with a 24-hour high near 0.00473 and a low around 0.00367. The token has gained significantly during the recent move, making the current price action an interesting area to watch.
The most important point is the 0.00473 resistance zone. Price recently moved close to this level but faced some selling pressure, creating a small pullback. If $SOLV can break above 0.00473 with strong volume and maintain that level, it could indicate that buyers are still in control.#SOLV
#SolvProtocol
#SOLVUSDT
#Crypto
#DeFi
SOLV/USDT Technical Analysis: Can the Current Momentum Continue?
$SOLV /USDT has recently shown strong upward momentum on the 15-minute chart. At the time shown in the chart, $SOLV is trading around 0.00465 USDT, with a 24-hour high near 0.00473 and a low around 0.00367. The token has gained significantly during the recent move, making the current price action an interesting area to watch.
The most important point is the 0.00473 resistance zone. Price recently moved close to this level but faced some selling pressure, creating a small pullback. If $SOLV can break above 0.00473 with strong volume and maintain that level, it could indicate that buyers are still in control.#SOLV
#SolvProtocol
#SOLVUSDT
#Crypto
#DeFi
$SOLV /USDT has recently shown strong upward momentum on the 15-minute chart. At the time shown in the chart, $SOLV is trading around 0.00465 USDT, with a 24-hour high near 0.00473 and a low around 0.00367. The token has gained significantly during the recent move, making the current price action an interesting area to watch.
The most important point is the 0.00473 resistance zone. Price recently moved close to this level but faced some selling pressure, creating a small pullback. If $SOLV can break above 0.00473 with strong volume and maintain that level, it could indicate that buyers are still in control.#SOLV
#SolvProtocol
#SOLVUSDT
#Crypto
#DeFi
37
Bài viết
Xem bản dịch
SOLV/USDT Technical Analysis: Can the Current Momentum Continue$SOLV /USDT has recently shown strong upward momentum on the 15-minute chart. At the time shown in the chart, $SOLV is trading around 0.00465 USDT, with a 24-hour high near 0.00473 and a low around 0.00367. The token has gained significantly during the recent move, making the current price action an interesting area to watch.
The most important point is the 0.00473 resistance zone. Price recently moved close to this level but faced some selling pressure, creating a small pullback. If $SOLV can break above 0.00473 with strong volume and maintain that level, it could indicate that buyers are still in control.
Another positive sign is the position of the moving averages. The chart shows MA(7) around 0.00458, MA(25) around 0.00448, and MA(99) around 0.00400. The shorter moving averages are positioned above the longer-term average, which generally reflects positive short-term momentum. However, moving averages are lagging indicators and should not be considered a guarantee of future movement.
For the coming days, 0.00450–0.00460 can be an important short-term area to observe. If price remains above this zone, the bullish structure could remain intact. A successful breakout above 0.00473 could bring psychological levels such as 0.00500 into focus. If momentum and trading volume remain strong, higher levels such as 0.00550–0.00600 could become possible future areas of interest. These are scenarios, not confirmed targets.
On the other hand, SOLV could also experience a correction after its strong rise. If the price falls below the short-term moving averages and loses the 0.00400 area, the bullish momentum would weaken. The next major support visible from the chart is around 0.00367. A move toward this area would represent a much deeper correction compared with the current price.
Volume will therefore be an important factor. A breakout accompanied by increasing volume would generally provide stronger confirmation than a breakout occurring on weak volume. Similarly, a sharp decline with high selling volume could signal increased bearish pressure.
My Weekly View
For the next week, SOLV/USDT appears to have two possible scenarios. In a bullish scenario, holding above the current support area and breaking 0.00473 could open the way toward 0.00500 and potentially higher levels. In a bearish scenario, rejection near 0.00473 followed by a break below 0.00400 could push the price toward 0.00367.
Overall, SOLV is currently showing strong momentum, but after a rapid rise, volatility can remain high. Traders and investors should watch support, resistance, volume, and market conditions rather than relying on a single indicator.
#SOLV
#SolvProtocol
#SOLVUSDT
#Crypto
#DeFi
SOLV/USDT Technical Analysis: Can the Current Momentum Continue
$SOLV /USDT has recently shown strong upward momentum on the 15-minute chart. At the time shown in the chart, $SOLV is trading around 0.00465 USDT, with a 24-hour high near 0.00473 and a low around 0.00367. The token has gained significantly during the recent move, making the current price action an interesting area to watch.
The most important point is the 0.00473 resistance zone. Price recently moved close to this level but faced some selling pressure, creating a small pullback. If $SOLV can break above 0.00473 with strong volume and maintain that level, it could indicate that buyers are still in control.
Another positive sign is the position of the moving averages. The chart shows MA(7) around 0.00458, MA(25) around 0.00448, and MA(99) around 0.00400. The shorter moving averages are positioned above the longer-term average, which generally reflects positive short-term momentum. However, moving averages are lagging indicators and should not be considered a guarantee of future movement.
For the coming days, 0.00450–0.00460 can be an important short-term area to observe. If price remains above this zone, the bullish structure could remain intact. A successful breakout above 0.00473 could bring psychological levels such as 0.00500 into focus. If momentum and trading volume remain strong, higher levels such as 0.00550–0.00600 could become possible future areas of interest. These are scenarios, not confirmed targets.
On the other hand, SOLV could also experience a correction after its strong rise. If the price falls below the short-term moving averages and loses the 0.00400 area, the bullish momentum would weaken. The next major support visible from the chart is around 0.00367. A move toward this area would represent a much deeper correction compared with the current price.
Volume will therefore be an important factor. A breakout accompanied by increasing volume would generally provide stronger confirmation than a breakout occurring on weak volume. Similarly, a sharp decline with high selling volume could signal increased bearish pressure.
My Weekly View
For the next week, SOLV/USDT appears to have two possible scenarios. In a bullish scenario, holding above the current support area and breaking 0.00473 could open the way toward 0.00500 and potentially higher levels. In a bearish scenario, rejection near 0.00473 followed by a break below 0.00400 could push the price toward 0.00367.
Overall, SOLV is currently showing strong momentum, but after a rapid rise, volatility can remain high. Traders and investors should watch support, resistance, volume, and market conditions rather than relying on a single indicator.
#SOLV
#SolvProtocol
#SOLVUSDT
#Crypto
#DeFi
The most important point is the 0.00473 resistance zone. Price recently moved close to this level but faced some selling pressure, creating a small pullback. If $SOLV can break above 0.00473 with strong volume and maintain that level, it could indicate that buyers are still in control.
Another positive sign is the position of the moving averages. The chart shows MA(7) around 0.00458, MA(25) around 0.00448, and MA(99) around 0.00400. The shorter moving averages are positioned above the longer-term average, which generally reflects positive short-term momentum. However, moving averages are lagging indicators and should not be considered a guarantee of future movement.
For the coming days, 0.00450–0.00460 can be an important short-term area to observe. If price remains above this zone, the bullish structure could remain intact. A successful breakout above 0.00473 could bring psychological levels such as 0.00500 into focus. If momentum and trading volume remain strong, higher levels such as 0.00550–0.00600 could become possible future areas of interest. These are scenarios, not confirmed targets.
On the other hand, SOLV could also experience a correction after its strong rise. If the price falls below the short-term moving averages and loses the 0.00400 area, the bullish momentum would weaken. The next major support visible from the chart is around 0.00367. A move toward this area would represent a much deeper correction compared with the current price.
Volume will therefore be an important factor. A breakout accompanied by increasing volume would generally provide stronger confirmation than a breakout occurring on weak volume. Similarly, a sharp decline with high selling volume could signal increased bearish pressure.
My Weekly View
For the next week, SOLV/USDT appears to have two possible scenarios. In a bullish scenario, holding above the current support area and breaking 0.00473 could open the way toward 0.00500 and potentially higher levels. In a bearish scenario, rejection near 0.00473 followed by a break below 0.00400 could push the price toward 0.00367.
Overall, SOLV is currently showing strong momentum, but after a rapid rise, volatility can remain high. Traders and investors should watch support, resistance, volume, and market conditions rather than relying on a single indicator.
#SOLV
#SolvProtocol
#SOLVUSDT
#Crypto
#DeFi
77
Phân tích giá token CNPY: Liệu CNPY có thể tiếp tục đà tăng trưởng trong tương lai không?$CNPY hiện đang cho thấy hoạt động mạnh trên thị trường, thu hút sự chú ý từ các trader và nhà đầu tư crypto. Trong ảnh chụp thị trường được cung cấp, $CNPY đang giao dịch quanh $0.2478, trong khi diễn biến giá hiển thị cho thấy mức tăng đáng kể khoảng 124%. Mức biến động mạnh như vậy có thể cho thấy nhu cầu mua mạnh, nhưng cũng có thể làm gia tăng biến động và làm xuất hiện khả năng điều chỉnh giá.
Sổ lệnh được hiển thị trong biểu đồ mang đến một cái nhìn thú vị về mức độ quan tâm mua và bán hiện tại. Ở phía mua, có một số lệnh được đặt quanh vùng $0.248–$0.250. Một lệnh mua đặc biệt đáng chú ý xuất hiện quanh $0.24857, cho thấy khu vực này có thể trở thành một vùng hỗ trợ ngắn hạn quan trọng nếu người mua tiếp tục bảo vệ nó.
Phân tích giá token CNPY: Liệu CNPY có thể tiếp tục đà tăng trưởng trong tương lai không?
$CNPY hiện đang cho thấy hoạt động mạnh trên thị trường, thu hút sự chú ý từ các trader và nhà đầu tư crypto. Trong ảnh chụp thị trường được cung cấp, $CNPY đang giao dịch quanh $0.2478, trong khi diễn biến giá hiển thị cho thấy mức tăng đáng kể khoảng 124%. Mức biến động mạnh như vậy có thể cho thấy nhu cầu mua mạnh, nhưng cũng có thể làm gia tăng biến động và làm xuất hiện khả năng điều chỉnh giá.
Sổ lệnh được hiển thị trong biểu đồ mang đến một cái nhìn thú vị về mức độ quan tâm mua và bán hiện tại. Ở phía mua, có một số lệnh được đặt quanh vùng $0.248–$0.250. Một lệnh mua đặc biệt đáng chú ý xuất hiện quanh $0.24857, cho thấy khu vực này có thể trở thành một vùng hỗ trợ ngắn hạn quan trọng nếu người mua tiếp tục bảo vệ nó.
Sổ lệnh được hiển thị trong biểu đồ mang đến một cái nhìn thú vị về mức độ quan tâm mua và bán hiện tại. Ở phía mua, có một số lệnh được đặt quanh vùng $0.248–$0.250. Một lệnh mua đặc biệt đáng chú ý xuất hiện quanh $0.24857, cho thấy khu vực này có thể trở thành một vùng hỗ trợ ngắn hạn quan trọng nếu người mua tiếp tục bảo vệ nó.
540
Xem bản dịch
#MyFirstSquarePost New to Binance Square, thrilled to share and connect with everyone here!
#MyFirstSquarePost New to Binance Square, thrilled to share and connect with everyone here!
156
Đăng nhập để khám phá thêm nội dung
Tham gia cùng người dùng tiền mã hóa toàn cầu trên Binance Square
⚡️ Nhận thông tin mới nhất và hữu ích về tiền mã hóa.
💬 Được tin cậy bởi sàn giao dịch tiền mã hóa lớn nhất thế giới.
👍 Khám phá những thông tin chuyên sâu thực tế từ những nhà sáng tạo đã xác minh.
Email / Số điện thoại