

Satoshi_Nakamoto_0078
8 Bài đăng

Satoshi_Nakamoto_0078
Báo cáo
Chặn người dùng
Giao dịch mở
Trader tần suất thấp
{thời gian} năm
0 Đang theo dõi
0 Người theo dõi
1 Đã thích
Bài đăng
Danh mục đầu tư
Bài viết
Xem bản dịch
IOTA/USDT — The Quiet Accumulation Is No Longer Quiet. 👀⚡IOTA/USDT — The Quiet Accumulation Is No Longer Quiet. 👀⚡
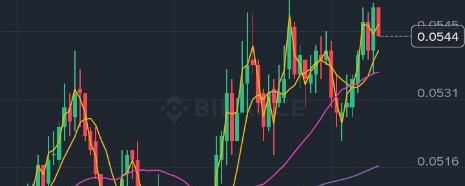
IOTA is showing a very interesting 15-minute structure: after falling to the $0.0491 area, price made a sharp recovery and pushed back toward the $0.0556 session high. At the moment shown in the chart, IOTA is around $0.0544, up 8.58% over 24 hours, with 24-hour volume of roughly 135.42M IOTA. The technical structure is notable because price is holding above MA(7) at $0.0541, MA(25) at $0.0536, and MA(99) at $0.0517 — meaning the short-, medium-, and longer-term averages shown on this timeframe are all sitting below price.
What makes the chart more interesting is the sequence: deep pullback → strong reversal → volume expansion → recovery above the moving averages → repeated tests of the upper range. The $0.0556 area is currently the clearest nearby resistance visible on the chart, while the $0.0541–$0.0536 zone becomes an important reference area if momentum starts cooling. A deeper move toward the $0.0517 region would represent a much larger loss of short-term momentum.
This move also appears consistent with broader technical momentum rather than a single obvious IOTA-specific news catalyst. A current CoinMarketCap analysis similarly attributes recent IOTA strength mainly to technical momentum, increased volume and broader altcoin rotation. �
CoinMarketCap
But here is the part many people miss: a strong green candle does not automatically mean a new trend has been confirmed. The real story is whether price can continue holding the higher structure after the initial surge. If volume fades while price repeatedly fails around the recent high, that can indicate that momentum is losing strength. On the other hand, continued higher highs and higher lows would show that buyers are maintaining control of the short-term structure.
IOTA itself has also undergone substantial technical development in 2026, including the Starfish consensus work and other protocol improvements reported by the IOTA Foundation. �
IOTA Blog
So the chart is not simply “IOTA is up 8.58%.” The more interesting observation is this: IOTA went from a $0.0491 intraday low to a $0.0556 high, while reclaiming multiple moving-average levels and maintaining elevated activity. Now the market is testing whether that recovery can develop into a sustained structure — or whether the recent surge eventually turns into a pullback.
IOTA/USDT — The Quiet Accumulation Is No Longer Quiet. 👀⚡
IOTA/USDT — The Quiet Accumulation Is No Longer Quiet. 👀⚡
IOTA is showing a very interesting 15-minute structure: after falling to the $0.0491 area, price made a sharp recovery and pushed back toward the $0.0556 session high. At the moment shown in the chart, IOTA is around $0.0544, up 8.58% over 24 hours, with 24-hour volume of roughly 135.42M IOTA. The technical structure is notable because price is holding above MA(7) at $0.0541, MA(25) at $0.0536, and MA(99) at $0.0517 — meaning the short-, medium-, and longer-term averages shown on this timeframe are all sitting below price.
What makes the chart more interesting is the sequence: deep pullback → strong reversal → volume expansion → recovery above the moving averages → repeated tests of the upper range. The $0.0556 area is currently the clearest nearby resistance visible on the chart, while the $0.0541–$0.0536 zone becomes an important reference area if momentum starts cooling. A deeper move toward the $0.0517 region would represent a much larger loss of short-term momentum.
This move also appears consistent with broader technical momentum rather than a single obvious IOTA-specific news catalyst. A current CoinMarketCap analysis similarly attributes recent IOTA strength mainly to technical momentum, increased volume and broader altcoin rotation. �
CoinMarketCap
But here is the part many people miss: a strong green candle does not automatically mean a new trend has been confirmed. The real story is whether price can continue holding the higher structure after the initial surge. If volume fades while price repeatedly fails around the recent high, that can indicate that momentum is losing strength. On the other hand, continued higher highs and higher lows would show that buyers are maintaining control of the short-term structure.
IOTA itself has also undergone substantial technical development in 2026, including the Starfish consensus work and other protocol improvements reported by the IOTA Foundation. �
IOTA Blog
So the chart is not simply “IOTA is up 8.58%.” The more interesting observation is this: IOTA went from a $0.0491 intraday low to a $0.0556 high, while reclaiming multiple moving-average levels and maintaining elevated activity. Now the market is testing whether that recovery can develop into a sustained structure — or whether the recent surge eventually turns into a pullback.
IOTA is showing a very interesting 15-minute structure: after falling to the $0.0491 area, price made a sharp recovery and pushed back toward the $0.0556 session high. At the moment shown in the chart, IOTA is around $0.0544, up 8.58% over 24 hours, with 24-hour volume of roughly 135.42M IOTA. The technical structure is notable because price is holding above MA(7) at $0.0541, MA(25) at $0.0536, and MA(99) at $0.0517 — meaning the short-, medium-, and longer-term averages shown on this timeframe are all sitting below price.
What makes the chart more interesting is the sequence: deep pullback → strong reversal → volume expansion → recovery above the moving averages → repeated tests of the upper range. The $0.0556 area is currently the clearest nearby resistance visible on the chart, while the $0.0541–$0.0536 zone becomes an important reference area if momentum starts cooling. A deeper move toward the $0.0517 region would represent a much larger loss of short-term momentum.
This move also appears consistent with broader technical momentum rather than a single obvious IOTA-specific news catalyst. A current CoinMarketCap analysis similarly attributes recent IOTA strength mainly to technical momentum, increased volume and broader altcoin rotation. �
CoinMarketCap
But here is the part many people miss: a strong green candle does not automatically mean a new trend has been confirmed. The real story is whether price can continue holding the higher structure after the initial surge. If volume fades while price repeatedly fails around the recent high, that can indicate that momentum is losing strength. On the other hand, continued higher highs and higher lows would show that buyers are maintaining control of the short-term structure.
IOTA itself has also undergone substantial technical development in 2026, including the Starfish consensus work and other protocol improvements reported by the IOTA Foundation. �
IOTA Blog
So the chart is not simply “IOTA is up 8.58%.” The more interesting observation is this: IOTA went from a $0.0491 intraday low to a $0.0556 high, while reclaiming multiple moving-average levels and maintaining elevated activity. Now the market is testing whether that recovery can develop into a sustained structure — or whether the recent surge eventually turns into a pullback.
76
·
--
Tăng giá
ALGO/USDT — Một cú bứt phá đột ngột, nhưng đây có phải chỉ là sự khởi đầu? 👀⚡
Algorand vừa bất ngờ trở thành một trong những đồng tiền thu hút sự chú ý. ALGO đang giao dịch quanh mức 0,1369 USD trên khung 15 phút, cho thấy một đợt tăng mạnh hơn 16% trong 24 giờ. Điều đáng chú ý không chỉ là mức tăng phần trăm — mà là tốc độ ALGO chuyển từ vùng tích lũy yên ắng quanh 0,115–0,120 USD sang một đợt bứt phá sắc nét hướng lên 0,1376 USD.
Biểu đồ thể hiện sự mở rộng rõ rệt cả về giá lẫn hoạt động giao dịch. ALGO cũng đang giao dịch cao hơn MA(7) ở 0,1337 USD, MA(25) ở 0,1318 USD và MA(99) ở 0,1221 USD, phản ánh động lượng mạnh trong ngắn hạn. Phân tích thị trường gần đây cũng mô tả rằng đợt tăng này chủ yếu được thúc đẩy bởi động lượng kỹ thuật và sự quan tâm trở lại của thị trường, thay vì bởi một thông báo cụ thể nào đó liên quan trực tiếp đến ALGO. �
CoinMarketCap
Nhưng câu hỏi thú vị ở đây là: Liệu một đợt tăng như vậy có thể tiếp tục, hay giá có thể đột ngột điều chỉnh ngược lại?
Sau một đợt tăng nhanh, việc điều chỉnh luôn có thể xảy ra. Vùng 0,1376 là đỉnh hiện tại của biểu đồ, trong khi các vùng 0,1337 và 0,1318 là những mốc tham chiếu kỹ thuật quan trọng nếu đà tăng suy yếu. Một đợt pullback tự nó không tự động đồng nghĩa với việc dự án là lừa đảo — và chỉ riêng từ biểu đồ này cũng chưa có bằng chứng nào chứng minh ALGO là gian lận. Gọi một đợt tăng là “pump and dump” sẽ cần bằng chứng thuyết phục hơn so với chỉ một sự tăng giá đột ngột.
Điều khiến ALGO trở nên đáng chú ý ngay lúc này là sự thay đổi của biểu đồ: tích lũy kéo dài → bứt phá → mở rộng khối lượng giao dịch → kiểm định đỉnh gần nhất.
Giai đoạn tiếp theo mới là lúc câu chuyện trở nên hấp dẫn. Liệu thị trường có duy trì đà tăng, hay các nhà giao dịch sẽ bắt đầu chốt lời và đẩy giá quay trở lại vùng trước đó?
Có một điều chắc chắn: ALGO đã chuyển từ trạng thái tương đối yên ắng sang trở thành một đồng tiền đáng theo dõi sát sao. 👀 #ALGO #ALGO_USDT #ALGO/USDT #Binance
ALGO/USDT — Một cú bứt phá đột ngột, nhưng đây có phải chỉ là sự khởi đầu? 👀⚡
Algorand vừa bất ngờ trở thành một trong những đồng tiền thu hút sự chú ý. ALGO đang giao dịch quanh mức 0,1369 USD trên khung 15 phút, cho thấy một đợt tăng mạnh hơn 16% trong 24 giờ. Điều đáng chú ý không chỉ là mức tăng phần trăm — mà là tốc độ ALGO chuyển từ vùng tích lũy yên ắng quanh 0,115–0,120 USD sang một đợt bứt phá sắc nét hướng lên 0,1376 USD.
Biểu đồ thể hiện sự mở rộng rõ rệt cả về giá lẫn hoạt động giao dịch. ALGO cũng đang giao dịch cao hơn MA(7) ở 0,1337 USD, MA(25) ở 0,1318 USD và MA(99) ở 0,1221 USD, phản ánh động lượng mạnh trong ngắn hạn. Phân tích thị trường gần đây cũng mô tả rằng đợt tăng này chủ yếu được thúc đẩy bởi động lượng kỹ thuật và sự quan tâm trở lại của thị trường, thay vì bởi một thông báo cụ thể nào đó liên quan trực tiếp đến ALGO. �
CoinMarketCap
Nhưng câu hỏi thú vị ở đây là: Liệu một đợt tăng như vậy có thể tiếp tục, hay giá có thể đột ngột điều chỉnh ngược lại?
Sau một đợt tăng nhanh, việc điều chỉnh luôn có thể xảy ra. Vùng 0,1376 là đỉnh hiện tại của biểu đồ, trong khi các vùng 0,1337 và 0,1318 là những mốc tham chiếu kỹ thuật quan trọng nếu đà tăng suy yếu. Một đợt pullback tự nó không tự động đồng nghĩa với việc dự án là lừa đảo — và chỉ riêng từ biểu đồ này cũng chưa có bằng chứng nào chứng minh ALGO là gian lận. Gọi một đợt tăng là “pump and dump” sẽ cần bằng chứng thuyết phục hơn so với chỉ một sự tăng giá đột ngột.
Điều khiến ALGO trở nên đáng chú ý ngay lúc này là sự thay đổi của biểu đồ: tích lũy kéo dài → bứt phá → mở rộng khối lượng giao dịch → kiểm định đỉnh gần nhất.
Giai đoạn tiếp theo mới là lúc câu chuyện trở nên hấp dẫn. Liệu thị trường có duy trì đà tăng, hay các nhà giao dịch sẽ bắt đầu chốt lời và đẩy giá quay trở lại vùng trước đó?
Có một điều chắc chắn: ALGO đã chuyển từ trạng thái tương đối yên ắng sang trở thành một đồng tiền đáng theo dõi sát sao. 👀 #ALGO #ALGO_USDT #ALGO/USDT #Binance
Algorand vừa bất ngờ trở thành một trong những đồng tiền thu hút sự chú ý. ALGO đang giao dịch quanh mức 0,1369 USD trên khung 15 phút, cho thấy một đợt tăng mạnh hơn 16% trong 24 giờ. Điều đáng chú ý không chỉ là mức tăng phần trăm — mà là tốc độ ALGO chuyển từ vùng tích lũy yên ắng quanh 0,115–0,120 USD sang một đợt bứt phá sắc nét hướng lên 0,1376 USD.
Biểu đồ thể hiện sự mở rộng rõ rệt cả về giá lẫn hoạt động giao dịch. ALGO cũng đang giao dịch cao hơn MA(7) ở 0,1337 USD, MA(25) ở 0,1318 USD và MA(99) ở 0,1221 USD, phản ánh động lượng mạnh trong ngắn hạn. Phân tích thị trường gần đây cũng mô tả rằng đợt tăng này chủ yếu được thúc đẩy bởi động lượng kỹ thuật và sự quan tâm trở lại của thị trường, thay vì bởi một thông báo cụ thể nào đó liên quan trực tiếp đến ALGO. �
CoinMarketCap
Nhưng câu hỏi thú vị ở đây là: Liệu một đợt tăng như vậy có thể tiếp tục, hay giá có thể đột ngột điều chỉnh ngược lại?
Sau một đợt tăng nhanh, việc điều chỉnh luôn có thể xảy ra. Vùng 0,1376 là đỉnh hiện tại của biểu đồ, trong khi các vùng 0,1337 và 0,1318 là những mốc tham chiếu kỹ thuật quan trọng nếu đà tăng suy yếu. Một đợt pullback tự nó không tự động đồng nghĩa với việc dự án là lừa đảo — và chỉ riêng từ biểu đồ này cũng chưa có bằng chứng nào chứng minh ALGO là gian lận. Gọi một đợt tăng là “pump and dump” sẽ cần bằng chứng thuyết phục hơn so với chỉ một sự tăng giá đột ngột.
Điều khiến ALGO trở nên đáng chú ý ngay lúc này là sự thay đổi của biểu đồ: tích lũy kéo dài → bứt phá → mở rộng khối lượng giao dịch → kiểm định đỉnh gần nhất.
Giai đoạn tiếp theo mới là lúc câu chuyện trở nên hấp dẫn. Liệu thị trường có duy trì đà tăng, hay các nhà giao dịch sẽ bắt đầu chốt lời và đẩy giá quay trở lại vùng trước đó?
Có một điều chắc chắn: ALGO đã chuyển từ trạng thái tương đối yên ắng sang trở thành một đồng tiền đáng theo dõi sát sao. 👀 #ALGO #ALGO_USDT #ALGO/USDT #Binance
67
·
--
Tăng giá
Xem bản dịch
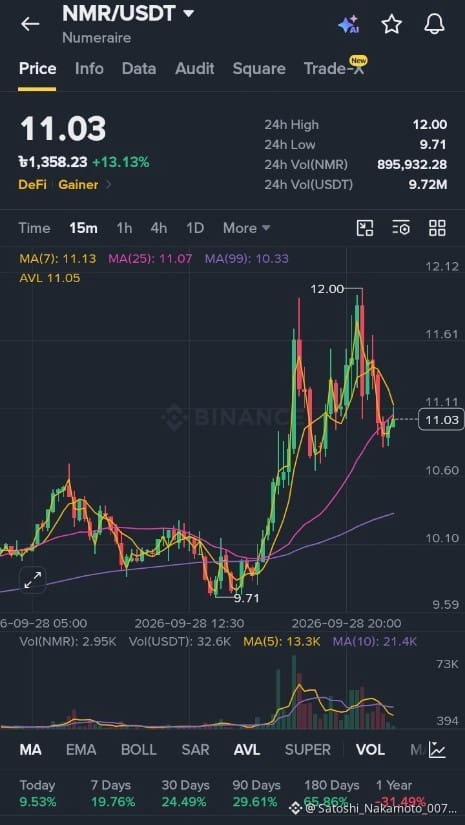
NMR is showing a surprisingly strong comeback on the 15-minute chart. The price is currently around $11.03, up approximately 13.13% over the last 24 hours, after moving from a 24-hour low of $9.71 to a high of $12.00.
What makes this move interesting is the speed of the recovery. From the $9.71 area, NMR pushed sharply higher, broke above the $10–$11 region, and reached the psychological $12 level before pulling back. Trading activity also expanded significantly during the move, showing that the rally came with a noticeable increase in market participation.
The technical structure is also worth watching. MA(99) is around $10.33, while MA(25) is around $11.07 and MA(7) is around $11.13. This means the current price is sitting close to the short-term moving averages after a major upward move. The $12.00 area now stands out as the recent high, while the $11.00–$10.60 zone becomes an important area to monitor if the momentum cools down.
The most surprising part? NMR spent much of the earlier session trading around the $10 area, then suddenly accelerated toward $12. That kind of transition—from quiet consolidation to explosive volatility—is exactly what makes this chart interesting to watch.
NMR is definitely back on the radar. Now the key question is not simply how high it can go, but whether the market can maintain the momentum and volume behind this move.#NMRBullish #NMR #NMR/USDT #Binance
NMR is showing a surprisingly strong comeback on the 15-minute chart. The price is currently around $11.03, up approximately 13.13% over the last 24 hours, after moving from a 24-hour low of $9.71 to a high of $12.00.
What makes this move interesting is the speed of the recovery. From the $9.71 area, NMR pushed sharply higher, broke above the $10–$11 region, and reached the psychological $12 level before pulling back. Trading activity also expanded significantly during the move, showing that the rally came with a noticeable increase in market participation.
The technical structure is also worth watching. MA(99) is around $10.33, while MA(25) is around $11.07 and MA(7) is around $11.13. This means the current price is sitting close to the short-term moving averages after a major upward move. The $12.00 area now stands out as the recent high, while the $11.00–$10.60 zone becomes an important area to monitor if the momentum cools down.
The most surprising part? NMR spent much of the earlier session trading around the $10 area, then suddenly accelerated toward $12. That kind of transition—from quiet consolidation to explosive volatility—is exactly what makes this chart interesting to watch.
NMR is definitely back on the radar. Now the key question is not simply how high it can go, but whether the market can maintain the momentum and volume behind this move.#NMRBullish #NMR #NMR/USDT #Binance
What makes this move interesting is the speed of the recovery. From the $9.71 area, NMR pushed sharply higher, broke above the $10–$11 region, and reached the psychological $12 level before pulling back. Trading activity also expanded significantly during the move, showing that the rally came with a noticeable increase in market participation.
The technical structure is also worth watching. MA(99) is around $10.33, while MA(25) is around $11.07 and MA(7) is around $11.13. This means the current price is sitting close to the short-term moving averages after a major upward move. The $12.00 area now stands out as the recent high, while the $11.00–$10.60 zone becomes an important area to monitor if the momentum cools down.
The most surprising part? NMR spent much of the earlier session trading around the $10 area, then suddenly accelerated toward $12. That kind of transition—from quiet consolidation to explosive volatility—is exactly what makes this chart interesting to watch.
NMR is definitely back on the radar. Now the key question is not simply how high it can go, but whether the market can maintain the momentum and volume behind this move.#NMRBullish #NMR #NMR/USDT #Binance
133
Xem bản dịch
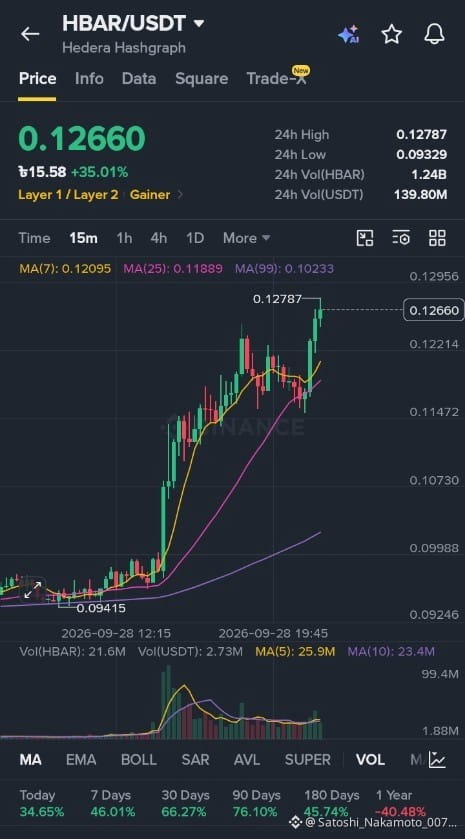
HBAR/USDT has entered a powerful momentum phase. On the 15-minute chart, HBAR is trading around 0.12660 USDT, up approximately 35.01% in 24 hours, while the market has pushed toward a fresh intraday high of 0.12787. The structure is clearly showing strong upward momentum, with price holding well above the MA(7) at 0.12095, MA(25) at 0.11889, and MA(99) at 0.10233. This strong alignment highlights the intensity of the current move. What makes this setup stand out is the combination of a major breakout, sustained price strength, and elevated trading volume. The 0.12787–0.12956 zone is now an important area to watch, while the 0.12214 and 0.11889 regions provide key chart references if momentum cools down. After such a rapid move, volatility can increase sharply, so the next candles and volume confirmation will be critical. This is no longer a quiet chart — HBAR has clearly awakened, and the market is now watching to see whether this momentum can sustain itself.#hbar #HBARUSD #HBARUSDT #HBAR/BTC #Binance
HBAR/USDT has entered a powerful momentum phase. On the 15-minute chart, HBAR is trading around 0.12660 USDT, up approximately 35.01% in 24 hours, while the market has pushed toward a fresh intraday high of 0.12787. The structure is clearly showing strong upward momentum, with price holding well above the MA(7) at 0.12095, MA(25) at 0.11889, and MA(99) at 0.10233. This strong alignment highlights the intensity of the current move. What makes this setup stand out is the combination of a major breakout, sustained price strength, and elevated trading volume. The 0.12787–0.12956 zone is now an important area to watch, while the 0.12214 and 0.11889 regions provide key chart references if momentum cools down. After such a rapid move, volatility can increase sharply, so the next candles and volume confirmation will be critical. This is no longer a quiet chart — HBAR has clearly awakened, and the market is now watching to see whether this momentum can sustain itself.#hbar #HBARUSD #HBARUSDT #HBAR/BTC #Binance
51
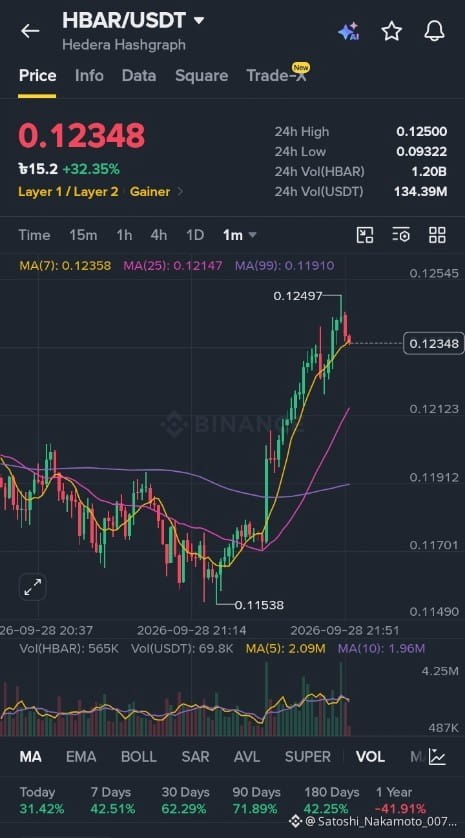
HBAR/USDT đang thể hiện một biến động tăng mạnh trong ngắn hạn trên biểu đồ 1 phút. Giá hiện tại vào khoảng 0.12348 USDT, với mức tăng 24 giờ là 32.35%, cho thấy động lực mua vào mạnh. Gần đây, giá đã chạm mức cao khoảng 0.12497, nhưng sau đó điều chỉnh nhẹ, điều này cho thấy có một lực bán nhất định gần vùng kháng cự 0.12500. Các đường trung bình động cũng đang ở xu hướng tích cực: MA(7) là 0.12358, MA(25) là 0.12147 và MA(99) là 0.11910. Vì giá hiện tại đang cao hơn cả ba đường trung bình động, xu hướng ngắn hạn vẫn là tăng. Tuy nhiên, do đây chỉ là biểu đồ 1 phút và giá đã tăng mạnh rồi, biến động mạnh và các nhịp điều chỉnh nhanh là có thể xảy ra. Có thể theo dõi vùng 0.121–0.122 như một khu vực hỗ trợ gần đó, trong khi 0.12500 là vùng kháng cự quan trọng. Nhìn chung, biểu đồ cho thấy đà tăng mạnh, nhưng cần có sự xác nhận từ các khung thời gian cao hơn và khối lượng giao dịch trước khi đưa ra bất kỳ quyết định giao dịch nào.#HBARUSD #HBARPrice #HBARUSDT #hbar #Binance
HBAR/USDT đang thể hiện một biến động tăng mạnh trong ngắn hạn trên biểu đồ 1 phút. Giá hiện tại vào khoảng 0.12348 USDT, với mức tăng 24 giờ là 32.35%, cho thấy động lực mua vào mạnh. Gần đây, giá đã chạm mức cao khoảng 0.12497, nhưng sau đó điều chỉnh nhẹ, điều này cho thấy có một lực bán nhất định gần vùng kháng cự 0.12500. Các đường trung bình động cũng đang ở xu hướng tích cực: MA(7) là 0.12358, MA(25) là 0.12147 và MA(99) là 0.11910. Vì giá hiện tại đang cao hơn cả ba đường trung bình động, xu hướng ngắn hạn vẫn là tăng. Tuy nhiên, do đây chỉ là biểu đồ 1 phút và giá đã tăng mạnh rồi, biến động mạnh và các nhịp điều chỉnh nhanh là có thể xảy ra. Có thể theo dõi vùng 0.121–0.122 như một khu vực hỗ trợ gần đó, trong khi 0.12500 là vùng kháng cự quan trọng. Nhìn chung, biểu đồ cho thấy đà tăng mạnh, nhưng cần có sự xác nhận từ các khung thời gian cao hơn và khối lượng giao dịch trước khi đưa ra bất kỳ quyết định giao dịch nào.#HBARUSD #HBARPrice #HBARUSDT #hbar #Binance
65
Xem bản dịch
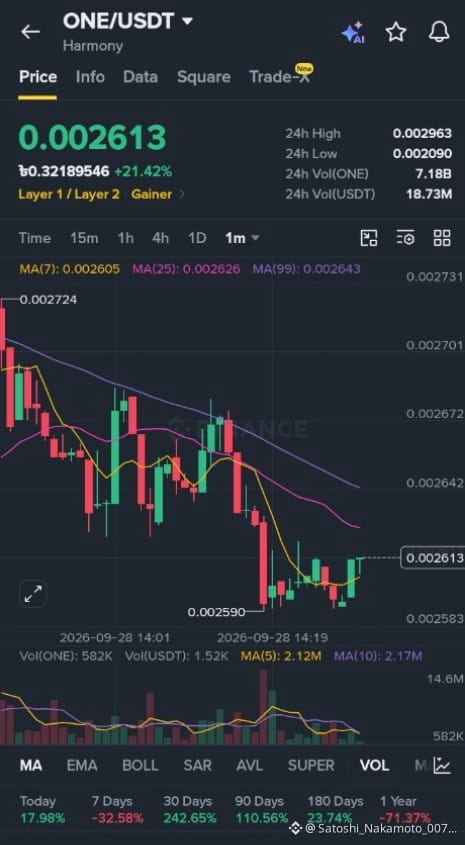
ONE has shown strong short-term recovery, with the price currently around 0.002613 USDT.
The coin is up about 21.42% over the last 24 hours, showing strong recent buying activity.
The price bounced from around 0.002590, which indicates some buying support at the recent low.
The latest candles show a small upward move, suggesting that buyers are trying to regain short-term momentum.The overall short-term trend still looks weak because the price is below the MA(25) at 0.002626 and MA(99) at 0.002643.
The moving averages are generally pointing downward, which indicates that the broader short-term trend remains bearish.
ONE is down around 32.58% over 7 days and about 71.37% over 1 year, showing significant previous weakness.
The current bounce is still relatively small compared with the previous decline, so a reversal has not yet been confirmed.
The price may face resistance around 0.002626–0.002643, followed by the 0.002672 area.#Binance #ONE/USDT #BTC走势分析
ONE has shown strong short-term recovery, with the price currently around 0.002613 USDT.
The coin is up about 21.42% over the last 24 hours, showing strong recent buying activity.
The price bounced from around 0.002590, which indicates some buying support at the recent low.
The latest candles show a small upward move, suggesting that buyers are trying to regain short-term momentum.The overall short-term trend still looks weak because the price is below the MA(25) at 0.002626 and MA(99) at 0.002643.
The moving averages are generally pointing downward, which indicates that the broader short-term trend remains bearish.
ONE is down around 32.58% over 7 days and about 71.37% over 1 year, showing significant previous weakness.
The current bounce is still relatively small compared with the previous decline, so a reversal has not yet been confirmed.
The price may face resistance around 0.002626–0.002643, followed by the 0.002672 area.#Binance #ONE/USDT #BTC走势分析
The coin is up about 21.42% over the last 24 hours, showing strong recent buying activity.
The price bounced from around 0.002590, which indicates some buying support at the recent low.
The latest candles show a small upward move, suggesting that buyers are trying to regain short-term momentum.The overall short-term trend still looks weak because the price is below the MA(25) at 0.002626 and MA(99) at 0.002643.
The moving averages are generally pointing downward, which indicates that the broader short-term trend remains bearish.
ONE is down around 32.58% over 7 days and about 71.37% over 1 year, showing significant previous weakness.
The current bounce is still relatively small compared with the previous decline, so a reversal has not yet been confirmed.
The price may face resistance around 0.002626–0.002643, followed by the 0.002672 area.#Binance #ONE/USDT #BTC走势分析
257
Xem bản dịch
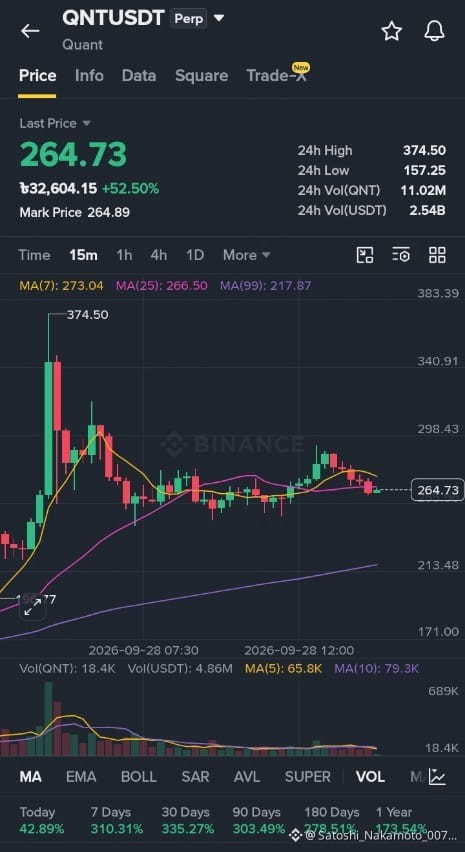
“The QNT/USDT chart shows a strong upward movement in price over the last 24 hours. The current price is around 264.73 USDT, while the 24-hour high is 374.50 USDT and the low is 157.25 USDT. The chart indicates that QNT experienced significant volatility, with a sharp rise followed by a period of consolidation. The 7-period moving average is around 273.04, while the 25-period moving average is around 266.50. Trading volume increased significantly during the major price movement and then gradually decreased. Overall, the chart shows strong recent momentum but also high volatility.”#TrendingTopic #UNI📈
“The QNT/USDT chart shows a strong upward movement in price over the last 24 hours. The current price is around 264.73 USDT, while the 24-hour high is 374.50 USDT and the low is 157.25 USDT. The chart indicates that QNT experienced significant volatility, with a sharp rise followed by a period of consolidation. The 7-period moving average is around 273.04, while the 25-period moving average is around 266.50. Trading volume increased significantly during the major price movement and then gradually decreased. Overall, the chart shows strong recent momentum but also high volatility.”#TrendingTopic #UNI📈
74
Xem bản dịch
“Every trade is a lesson. Stay patient, manage risk, and never let emotions control your decisions. Small losses are part of the journey; what matters is learning, improving, and staying disciplined.”
“Every trade is a lesson. Stay patient, manage risk, and never let emotions control your decisions. Small losses are part of the journey; what matters is learning, improving, and staying disciplined.”
1
162
Đăng nhập để khám phá thêm nội dung
Tham gia cùng người dùng tiền mã hóa toàn cầu trên Binance Square
⚡️ Nhận thông tin mới nhất và hữu ích về tiền mã hóa.
💬 Được tin cậy bởi sàn giao dịch tiền mã hóa lớn nhất thế giới.
👍 Khám phá những thông tin chuyên sâu thực tế từ những nhà sáng tạo đã xác minh.
Email / Số điện thoại