

Crypto Trader 343
275 Bài đăng

Crypto Trader 343
Báo cáo
Chặn người dùng
Thanks for Sporting Me. and Follow me For More.....
1 Đang theo dõi
25 Người theo dõi
260 Đã thích
Bài đăng
Bài viết
Xem bản dịch
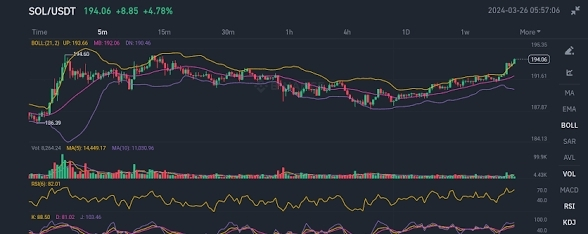
SOL/USD Technical Analysis📊 $SOL /USD Technical Analysis
{spot}(SOLUSDT)
Solana ($SOL ) vs US Dollar — October 28, 2026
1. Current Market Overview
Solana (SOL) is showing short-term bullish momentum, but the price is approaching resistance where a pullback could occur.
Current price: Approximately $102.90
24-hour change: Approximately +1.6% to +3.3%, depending on the data source and timestamp.
Short-term trend: Bullish
Market condition: Potentially overbought on shorter timeframes.
Overall bias: Bullish, but confirmation is needed before entering a trade.
2. Important Support and Resistance Levels
Level Price (USD) Significance
Resistance 3 $112.79 Major upside target
Resistance 2 $106.28 Secondary resistance
Resistance 1 $103.56 Immediate resistance
Current Price $102.90 Current market area
Support 1 $99.13 Immediate support
Support 2 $96.72 Secondary support
Support 3 $91.07 Major support
These levels are based on published daily technical analysis and may change as the market moves.
3. Technical Indicator Analysis
Moving averages: Shorter-term moving averages are generally indicating bullish momentum.
RSI: Some intraday readings are above 70, suggesting overbought conditions and the possibility of a short-term pullback.
MACD: Positive readings on several intraday analyses support the current bullish momentum.
Trend strength: ADX readings above 25 in the cited intraday analysis indicate a relatively strong trend, although ADX alone does not establish direction.
4. Trading Scenarios
🟢 Scenario A: Bullish Trade (BUY)
Entry condition:
Wait for a confirmed breakout above $103.56.
Look for a successful retest of the breakout level.
Potential targets:
TP1: $106.28
TP2: $110.00
TP3: $112.79
Stop-loss idea: Below the confirmed retest low.
Risk: A breakout without strong buying volume could turn into a false breakout.
🔴 Scenario B: Bearish Trade (SELL)
Entry condition:
Watch for rejection near $103.50–$104.00.
Look for a break below $99.13 for stronger bearish confirmation.
Potential targets:
TP1: $96.72
TP2: $94.00
TP3: $91.07
Stop-loss idea: Above the rejection high.
Risk: Strong buying pressure could invalidate the bearish setup.
These are conditional scenarios, not guaranteed price predictions.
5. My Trading Recommendation
Trading Factor Assessment
Short-term direction Bullish
Immediate resistance $103.56
Immediate support $99.13
Buying immediately Risky near resistance
Buying after breakout confirmation Potential opportunity
Selling Wait for bearish confirmation
My preferred approach
I would wait for confirmation rather than enter immediately.
BUY: If SOL breaks above $103.56 and successfully retests the level.
SELL: If SOL fails at resistance and bearish momentum develops.
NO TRADE: If the price continues moving sideways between support and resistance.
The market can move sharply in either direction, so use a stop-loss and avoid excessive leverage.
Note: The analysis uses published market data available on October 28, 2026. Verify the live price and chart before trading.
---
📈 Let me know your trading timeframe
Which timeframe do you trade?
1. 5-minute chart (scalping)
2. 15-minute chart
3. 1-hour chart
4. 4-hour chart
5. Daily chart (long-term)
Tell me your timeframe, and I can provide a more focused SOL/USD entry, stop-loss, and take-profit setup.
#EarningsSeason #solana
SOL/USD Technical Analysis
📊 $SOL /USD Technical Analysis
Solana ($SOL ) vs US Dollar — October 28, 2026
1. Current Market Overview
Solana (SOL) is showing short-term bullish momentum, but the price is approaching resistance where a pullback could occur.
Current price: Approximately $102.90
24-hour change: Approximately +1.6% to +3.3%, depending on the data source and timestamp.
Short-term trend: Bullish
Market condition: Potentially overbought on shorter timeframes.
Overall bias: Bullish, but confirmation is needed before entering a trade.
2. Important Support and Resistance Levels
Level Price (USD) Significance
Resistance 3 $112.79 Major upside target
Resistance 2 $106.28 Secondary resistance
Resistance 1 $103.56 Immediate resistance
Current Price $102.90 Current market area
Support 1 $99.13 Immediate support
Support 2 $96.72 Secondary support
Support 3 $91.07 Major support
These levels are based on published daily technical analysis and may change as the market moves.
3. Technical Indicator Analysis
Moving averages: Shorter-term moving averages are generally indicating bullish momentum.
RSI: Some intraday readings are above 70, suggesting overbought conditions and the possibility of a short-term pullback.
MACD: Positive readings on several intraday analyses support the current bullish momentum.
Trend strength: ADX readings above 25 in the cited intraday analysis indicate a relatively strong trend, although ADX alone does not establish direction.
4. Trading Scenarios
🟢 Scenario A: Bullish Trade (BUY)
Entry condition:
Wait for a confirmed breakout above $103.56.
Look for a successful retest of the breakout level.
Potential targets:
TP1: $106.28
TP2: $110.00
TP3: $112.79
Stop-loss idea: Below the confirmed retest low.
Risk: A breakout without strong buying volume could turn into a false breakout.
🔴 Scenario B: Bearish Trade (SELL)
Entry condition:
Watch for rejection near $103.50–$104.00.
Look for a break below $99.13 for stronger bearish confirmation.
Potential targets:
TP1: $96.72
TP2: $94.00
TP3: $91.07
Stop-loss idea: Above the rejection high.
Risk: Strong buying pressure could invalidate the bearish setup.
These are conditional scenarios, not guaranteed price predictions.
5. My Trading Recommendation
Trading Factor Assessment
Short-term direction Bullish
Immediate resistance $103.56
Immediate support $99.13
Buying immediately Risky near resistance
Buying after breakout confirmation Potential opportunity
Selling Wait for bearish confirmation
My preferred approach
I would wait for confirmation rather than enter immediately.
BUY: If SOL breaks above $103.56 and successfully retests the level.
SELL: If SOL fails at resistance and bearish momentum develops.
NO TRADE: If the price continues moving sideways between support and resistance.
The market can move sharply in either direction, so use a stop-loss and avoid excessive leverage.
Note: The analysis uses published market data available on October 28, 2026. Verify the live price and chart before trading.
---
📈 Let me know your trading timeframe
Which timeframe do you trade?
1. 5-minute chart (scalping)
2. 15-minute chart
3. 1-hour chart
4. 4-hour chart
5. Daily chart (long-term)
Tell me your timeframe, and I can provide a more focused SOL/USD entry, stop-loss, and take-profit setup.
#EarningsSeason #solana
27
Bài viết
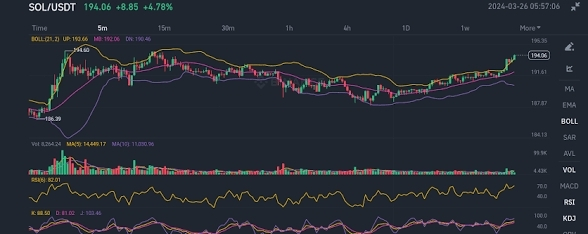
Phân tích kỹ thuật SOL/USD📊 Phân tích kỹ thuật $SOL /USD
Solana (SOL) so với Đô la Mỹ — Ngày 28 tháng 10 năm 2026
1. Tổng quan thị trường hiện tại
Solana ($SOL ) đang có đà tăng trong ngắn hạn, nhưng giá đang tiến đến vùng kháng cự, nơi có thể xảy ra nhịp điều chỉnh.
Giá hiện tại: Khoảng $102.90
Biến động trong 24 giờ: Khoảng +1.6% đến +3.3%, tùy thuộc vào nguồn dữ liệu và thời điểm ghi nhận.
Xu hướng ngắn hạn: Tăng giá
Tình trạng thị trường: Có thể đang quá mua trên các khung thời gian ngắn hơn.
Xu hướng tổng thể: Tăng giá, nhưng cần xác nhận trước khi vào lệnh.
Phân tích kỹ thuật SOL/USD
📊 Phân tích kỹ thuật $SOL /USD
Solana (SOL) so với Đô la Mỹ — Ngày 28 tháng 10 năm 2026
1. Tổng quan thị trường hiện tại
Solana ($SOL ) đang có đà tăng trong ngắn hạn, nhưng giá đang tiến đến vùng kháng cự, nơi có thể xảy ra nhịp điều chỉnh.
Giá hiện tại: Khoảng $102.90
Biến động trong 24 giờ: Khoảng +1.6% đến +3.3%, tùy thuộc vào nguồn dữ liệu và thời điểm ghi nhận.
Xu hướng ngắn hạn: Tăng giá
Tình trạng thị trường: Có thể đang quá mua trên các khung thời gian ngắn hơn.
Xu hướng tổng thể: Tăng giá, nhưng cần xác nhận trước khi vào lệnh.
36
Bài viết
Xem bản dịch
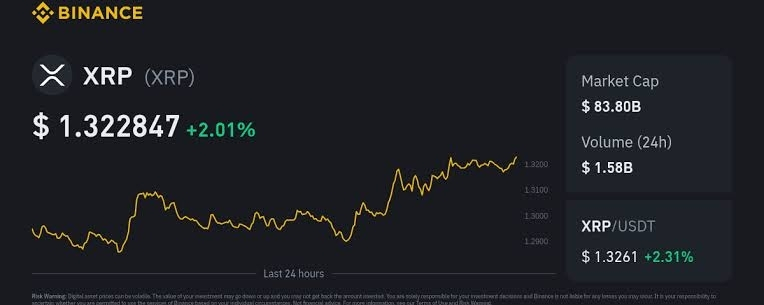
XRP/USD Technical Analysis📊 $XRP /USD Technical Analysis
{spot}(XRPUSDT)
Date: October 28, 2026
1. Current Market Overview
According to the latest available technical data, $XRP /USD is trading around $1.32–$1.33. The short-term outlook is cautiously bullish, although the medium-term trend remains under pressure.
Indicator Current Analysis
Current Price Approximately $1.33
Short-Term Trend Bullish
Medium-Term Trend Bearish
Daily RSI Approximately 45
Immediate Support $1.3145
Immediate Resistance $1.345
Overall Bias Cautiously Bullish
The daily RSI is near 45, suggesting momentum is relatively neutral rather than strongly bullish or bearish.
2. Important Support and Resistance Levels
These levels are based on technical data available on October 28, 2026.
Level Price (USD) Significance
Resistance 3 $1.399 Major resistance
Resistance 2 $1.366 Strong resistance
Resistance 1 $1.345 Immediate resistance
Current Price $1.328 Approximate market price
Support 1 $1.3145 Immediate support
Support 2 $1.2925 Secondary support
Support 3 $1.2579 Major support
Source:
3. BUY Setup 🟢
A potential buying opportunity could develop if XRP breaks above resistance.
Possible entry conditions:
XRP breaks above $1.345.
A 1-hour candle closes above resistance.
Buying volume increases.
Price successfully retests the breakout level.
Potential targets:
Trading Parameter Price
Entry Above $1.345 after confirmation
Take Profit 1 $1.366
Take Profit 2 $1.399
Stop Loss Below the breakout structure
My view: Avoid buying immediately before a breakout is confirmed. A false breakout could quickly reverse the price.
4. SELL Setup 🔴
A bearish setup could develop if XRP loses its immediate support.
Possible entry conditions:
XRP breaks below $1.3145.
A 1-hour candle closes below support.
Selling pressure increases.
Trading Parameter Price
Entry Below $1.3145 after confirmation
Take Profit 1 $1.2925
Take Profit 2 $1.2579
Stop Loss Above the breakdown structure
These are potential trading scenarios, not guaranteed price movements.
5. Bullish vs. Bearish Scenarios
🟢 Bullish Scenario
If XRP breaks above $1.345 and holds that level, the next potential targets are:
Target 1: $1.366
Target 2: $1.399
A breakout accompanied by increased volume would strengthen the bullish case.
🔴 Bearish Scenario
If XRP breaks below $1.3145, the next potential support levels are:
Target 1: $1.2925
Target 2: $1.2579
A sustained move below support would weaken the short-term bullish outlook.
🟡 Neutral Scenario
If XRP remains between $1.3145 and $1.345, the market may continue consolidating.
In that situation, waiting for a confirmed breakout or breakdown may be preferable.
6. My Trading Recommendation 🎯
Based on the available technical data, I would focus on these two levels:
BUY signal: A confirmed breakout above $1.345.
SELL signal: A confirmed breakdown below $1.3145.
WAIT: If XRP remains between these levels without clear momentum.
Remember that cryptocurrency prices can change rapidly. Always verify the current price on your exchange, use a stop-loss, and avoid excessive leverage.
---
📈 Which XRP/USD Trading Timeframe Do You Use?
Choose one option:
1. 15-minute chart — Scalping
2. 1-hour chart — Intraday trading
3. 4-hour chart — Swing trading
4. Daily chart — Long-term trend
Reply with 1, 2, 3, or 4, and I will provide a more focused XRP/USD trading plan with entry, stop-loss, and take-profit levels.
#EarningsSeason #XRPPredictions
XRP/USD Technical Analysis
📊 $XRP /USD Technical Analysis
Date: October 28, 2026
1. Current Market Overview
According to the latest available technical data, $XRP /USD is trading around $1.32–$1.33. The short-term outlook is cautiously bullish, although the medium-term trend remains under pressure.
Indicator Current Analysis
Current Price Approximately $1.33
Short-Term Trend Bullish
Medium-Term Trend Bearish
Daily RSI Approximately 45
Immediate Support $1.3145
Immediate Resistance $1.345
Overall Bias Cautiously Bullish
The daily RSI is near 45, suggesting momentum is relatively neutral rather than strongly bullish or bearish.
2. Important Support and Resistance Levels
These levels are based on technical data available on October 28, 2026.
Level Price (USD) Significance
Resistance 3 $1.399 Major resistance
Resistance 2 $1.366 Strong resistance
Resistance 1 $1.345 Immediate resistance
Current Price $1.328 Approximate market price
Support 1 $1.3145 Immediate support
Support 2 $1.2925 Secondary support
Support 3 $1.2579 Major support
Source:
3. BUY Setup 🟢
A potential buying opportunity could develop if XRP breaks above resistance.
Possible entry conditions:
XRP breaks above $1.345.
A 1-hour candle closes above resistance.
Buying volume increases.
Price successfully retests the breakout level.
Potential targets:
Trading Parameter Price
Entry Above $1.345 after confirmation
Take Profit 1 $1.366
Take Profit 2 $1.399
Stop Loss Below the breakout structure
My view: Avoid buying immediately before a breakout is confirmed. A false breakout could quickly reverse the price.
4. SELL Setup 🔴
A bearish setup could develop if XRP loses its immediate support.
Possible entry conditions:
XRP breaks below $1.3145.
A 1-hour candle closes below support.
Selling pressure increases.
Trading Parameter Price
Entry Below $1.3145 after confirmation
Take Profit 1 $1.2925
Take Profit 2 $1.2579
Stop Loss Above the breakdown structure
These are potential trading scenarios, not guaranteed price movements.
5. Bullish vs. Bearish Scenarios
🟢 Bullish Scenario
If XRP breaks above $1.345 and holds that level, the next potential targets are:
Target 1: $1.366
Target 2: $1.399
A breakout accompanied by increased volume would strengthen the bullish case.
🔴 Bearish Scenario
If XRP breaks below $1.3145, the next potential support levels are:
Target 1: $1.2925
Target 2: $1.2579
A sustained move below support would weaken the short-term bullish outlook.
🟡 Neutral Scenario
If XRP remains between $1.3145 and $1.345, the market may continue consolidating.
In that situation, waiting for a confirmed breakout or breakdown may be preferable.
6. My Trading Recommendation 🎯
Based on the available technical data, I would focus on these two levels:
BUY signal: A confirmed breakout above $1.345.
SELL signal: A confirmed breakdown below $1.3145.
WAIT: If XRP remains between these levels without clear momentum.
Remember that cryptocurrency prices can change rapidly. Always verify the current price on your exchange, use a stop-loss, and avoid excessive leverage.
---
📈 Which XRP/USD Trading Timeframe Do You Use?
Choose one option:
1. 15-minute chart — Scalping
2. 1-hour chart — Intraday trading
3. 4-hour chart — Swing trading
4. Daily chart — Long-term trend
Reply with 1, 2, 3, or 4, and I will provide a more focused XRP/USD trading plan with entry, stop-loss, and take-profit levels.
#EarningsSeason #XRPPredictions
62
Bài viết
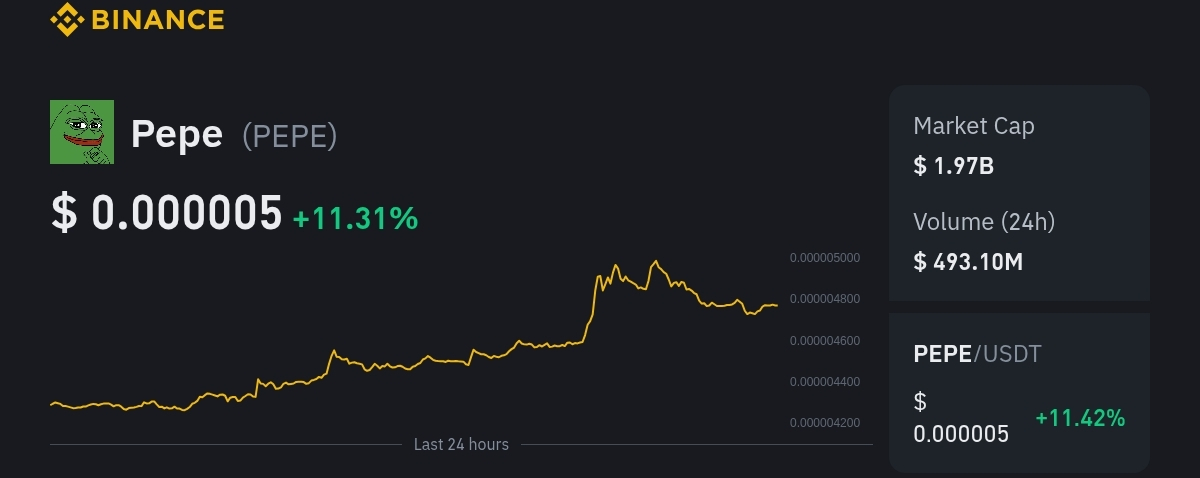
Phân tích kỹ thuật PEPE/USD📊 $PEPE /USD Phân tích kỹ thuật
Ngày: 28 tháng 10 năm 2026
1. Tổng quan thị trường
PEPE/USD đang cho thấy xu hướng có thể tăng giá, nhưng vẫn có khả năng điều chỉnh trong ngắn hạn.
Chỉ báo Phân tích
Xu hướng thị trường Thiên hướng tăng giá
Loại thị trường Meme coin biến động cao
Rủi ro giao dịch Cao
Chiến lược Chờ xác nhận phá vỡ
2. Các mức hỗ trợ và kháng cự quan trọng
Mức Giá (USD) Ý nghĩa
Kháng cự 3 $0.00000568 Kháng cự mạnh
Kháng cự 2 $0.00000532 Kháng cự thứ cấp
Kháng cự 1 $0.00000509 Kháng cự gần nhất
Phân tích kỹ thuật PEPE/USD
📊 $PEPE /USD Phân tích kỹ thuật
Ngày: 28 tháng 10 năm 2026
1. Tổng quan thị trường
PEPE/USD đang cho thấy xu hướng có thể tăng giá, nhưng vẫn có khả năng điều chỉnh trong ngắn hạn.
Chỉ báo Phân tích
Xu hướng thị trường Thiên hướng tăng giá
Loại thị trường Meme coin biến động cao
Rủi ro giao dịch Cao
Chiến lược Chờ xác nhận phá vỡ
2. Các mức hỗ trợ và kháng cự quan trọng
Mức Giá (USD) Ý nghĩa
Kháng cự 3 $0.00000568 Kháng cự mạnh
Kháng cự 2 $0.00000532 Kháng cự thứ cấp
Kháng cự 1 $0.00000509 Kháng cự gần nhất
1
71
Bài viết
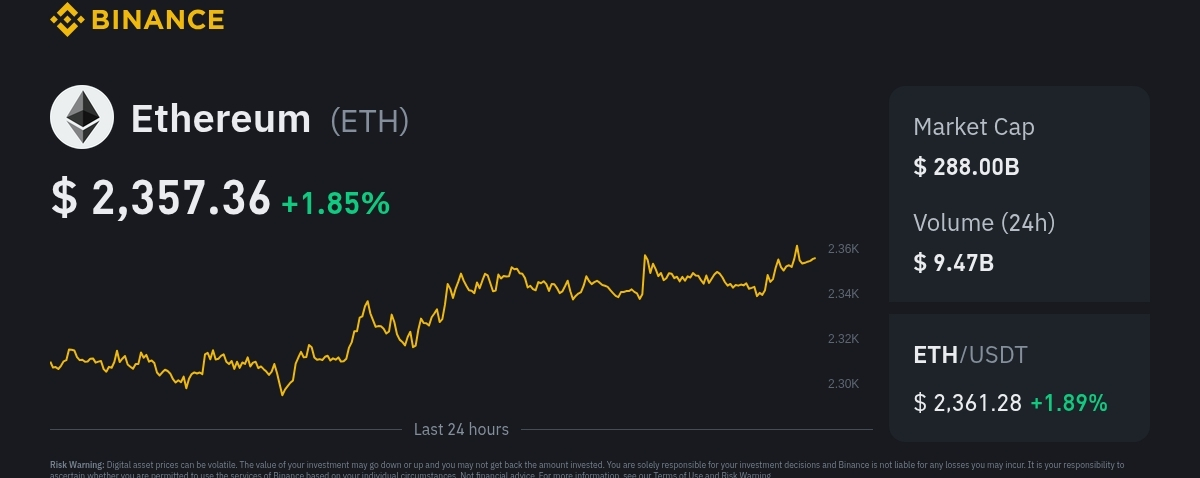
Phân tích kỹ thuật ETH/USDT📊 $ETH /USDT Phân tích kỹ thuật
Ngày: 28 tháng 10 năm 2026
Cặp giao dịch: Ethereum / Tether (ETH/USDT)
1. Tình hình thị trường hiện tại
Theo phân tích thị trường mới nhất hiện có, Ethereum đang giao dịch quanh mức $2,340–$2,350. ETH đang phục hồi trong ngắn hạn, nhưng xu hướng chung trên biểu đồ ngày vẫn yếu.
Chỉ báo Phân tích
Giá hiện tại Khoảng $2,345
Xu hướng ngắn hạn Giảm đến trung lập
Xu hướng ngày Giảm giá
RSI (ngày) Khoảng 37
Hỗ trợ gần nhất $2,300–$2,315
Kháng cự gần nhất $2,370–$2,400
Tâm lý thị trường Thận trọng / giảm giá
Phân tích kỹ thuật ETH/USDT
📊 $ETH /USDT Phân tích kỹ thuật
Ngày: 28 tháng 10 năm 2026
Cặp giao dịch: Ethereum / Tether (ETH/USDT)
1. Tình hình thị trường hiện tại
Theo phân tích thị trường mới nhất hiện có, Ethereum đang giao dịch quanh mức $2,340–$2,350. ETH đang phục hồi trong ngắn hạn, nhưng xu hướng chung trên biểu đồ ngày vẫn yếu.
Chỉ báo Phân tích
Giá hiện tại Khoảng $2,345
Xu hướng ngắn hạn Giảm đến trung lập
Xu hướng ngày Giảm giá
RSI (ngày) Khoảng 37
Hỗ trợ gần nhất $2,300–$2,315
Kháng cự gần nhất $2,370–$2,400
Tâm lý thị trường Thận trọng / giảm giá
73
Bài viết
Xem bản dịch
BTC/USD Technical Analysis — October 27, 2026📊 $BTC /USD Technical Analysis — October 27, 2026
{spot}(BTCUSDT)
Current market bias: 🐻 Bearish (Short-term)
Bitcoin is facing selling pressure and is trading around $79,400–$79,600 according to the latest available market data. The price has fallen below the important $80,000 psychological level, and technical indicators suggest that further downside is possible.
1. Current Market Overview
Indicator Current Analysis
Trading Pair BTC/USD
Current Price Around $79,500
Short-Term Trend 🔴 Bearish
RSI (14) Around 40
MACD Bearish
Immediate Support $79,300
Stronger Support $78,600
Immediate Resistance $80,000–$80,700
Next Resistance $81,400
Market Sentiment Sellers have the advantage
Prices are approximate and may change rapidly.
2. Important Support and Resistance Levels
🟢 Support Levels
These are the levels where buyers might attempt to enter the market.
Support 1: $79,300
Support 2: $78,600
Support 3: $77,100–$77,800
If BTC breaks below $79,300 with strong selling volume, the price could move toward $78,600.
If $78,600 also fails to hold, the next downside area could be $77,800 or lower.
🔴 Resistance Levels
These are the levels where selling pressure could emerge.
Resistance 1: $80,000
Resistance 2: $80,700
Resistance 3: $81,400
Major Resistance: $81,800–$82,000
BTC needs to recover above $80,700 and sustain that level to improve its short-term bullish outlook.
A break above $81,400 could open the door to a stronger recovery.
3. Technical Indicator Analysis
RSI (14): Around 40
Momentum is weak.
Sellers currently have the advantage.
RSI is approaching oversold territory but does not, by itself, confirm a reversal.
MACD: Bearish
Momentum remains negative.
Downside pressure could continue unless momentum starts improving.
Moving Averages: Bearish
BTC is trading below its short-term moving averages.
The $80,700–$81,800 area could act as resistance during a recovery.
---
4. BTC/USD Trading Scenarios
🔴 Scenario A: SELL Setup
Preferred direction: Short, subject to confirmation.
Parameter Potential Level
Entry Zone $79,250–$79,400
Stop Loss $79,950
Take Profit 1 $78,900
Take Profit 2 $78,600
Take Profit 3 $77,800
Confirmation required:
BTC breaks below $79,300.
A 15-minute candle closes below support.
A retest of $79,300 fails.
⚠️ Avoid entering a short trade immediately after a sharp drop without confirmation. Price could rebound from support.
🟢 Scenario B: BUY Setup
A buy trade becomes more attractive if BTC reclaims important resistance levels.
Parameter Potential Level
Entry Zone $80,050–$80,200
Stop Loss $79,600
Take Profit 1 $80,700
Take Profit 2 $81,000
Take Profit 3 $81,400
Confirmation required:
BTC breaks above $80,000.
A 15-minute candle closes above resistance.
Price successfully retests the breakout area.
This bullish setup becomes invalid if BTC fails to hold the breakout and falls back below support.
These are illustrative trading scenarios, not confirmed live entry signals.
---
5. My Final BTC/USD Prediction
Based on the available technical data:
Market Condition Possible Direction
BTC stays below $80,000 Bearish
BTC breaks below $79,300 Potential move toward $78,600
BTC breaks below $78,600 Further downside risk
BTC reclaims $80,700 Recovery becomes more likely
BTC breaks above $81,400 Bullish momentum may strengthen
🎯 My Trading Bias
Short-term: Bearish.
The more cautious approach is to wait for confirmation around $79,300 support or $80,000 resistance rather than entering a trade based on price alone.
Risk management: Risk no more than 1% of your trading capital on a single trade, and be especially careful with leverage during volatile market conditions.
---
📈 Would you like a more precise trading setup?
I can analyze BTC/USD using one of these timeframes:
1. ⚡ 5-minute chart — scalping 2. 📊 15-minute chart — short-term trading 3. 📈 1-hour chart — intraday trading 4. 🌎 4-hour chart — swing trading
#BTC #FOMCWatch
BTC/USD Technical Analysis — October 27, 2026
📊 $BTC /USD Technical Analysis — October 27, 2026
Current market bias: 🐻 Bearish (Short-term)
Bitcoin is facing selling pressure and is trading around $79,400–$79,600 according to the latest available market data. The price has fallen below the important $80,000 psychological level, and technical indicators suggest that further downside is possible.
1. Current Market Overview
Indicator Current Analysis
Trading Pair BTC/USD
Current Price Around $79,500
Short-Term Trend 🔴 Bearish
RSI (14) Around 40
MACD Bearish
Immediate Support $79,300
Stronger Support $78,600
Immediate Resistance $80,000–$80,700
Next Resistance $81,400
Market Sentiment Sellers have the advantage
Prices are approximate and may change rapidly.
2. Important Support and Resistance Levels
🟢 Support Levels
These are the levels where buyers might attempt to enter the market.
Support 1: $79,300
Support 2: $78,600
Support 3: $77,100–$77,800
If BTC breaks below $79,300 with strong selling volume, the price could move toward $78,600.
If $78,600 also fails to hold, the next downside area could be $77,800 or lower.
🔴 Resistance Levels
These are the levels where selling pressure could emerge.
Resistance 1: $80,000
Resistance 2: $80,700
Resistance 3: $81,400
Major Resistance: $81,800–$82,000
BTC needs to recover above $80,700 and sustain that level to improve its short-term bullish outlook.
A break above $81,400 could open the door to a stronger recovery.
3. Technical Indicator Analysis
RSI (14): Around 40
Momentum is weak.
Sellers currently have the advantage.
RSI is approaching oversold territory but does not, by itself, confirm a reversal.
MACD: Bearish
Momentum remains negative.
Downside pressure could continue unless momentum starts improving.
Moving Averages: Bearish
BTC is trading below its short-term moving averages.
The $80,700–$81,800 area could act as resistance during a recovery.
---
4. BTC/USD Trading Scenarios
🔴 Scenario A: SELL Setup
Preferred direction: Short, subject to confirmation.
Parameter Potential Level
Entry Zone $79,250–$79,400
Stop Loss $79,950
Take Profit 1 $78,900
Take Profit 2 $78,600
Take Profit 3 $77,800
Confirmation required:
BTC breaks below $79,300.
A 15-minute candle closes below support.
A retest of $79,300 fails.
⚠️ Avoid entering a short trade immediately after a sharp drop without confirmation. Price could rebound from support.
🟢 Scenario B: BUY Setup
A buy trade becomes more attractive if BTC reclaims important resistance levels.
Parameter Potential Level
Entry Zone $80,050–$80,200
Stop Loss $79,600
Take Profit 1 $80,700
Take Profit 2 $81,000
Take Profit 3 $81,400
Confirmation required:
BTC breaks above $80,000.
A 15-minute candle closes above resistance.
Price successfully retests the breakout area.
This bullish setup becomes invalid if BTC fails to hold the breakout and falls back below support.
These are illustrative trading scenarios, not confirmed live entry signals.
---
5. My Final BTC/USD Prediction
Based on the available technical data:
Market Condition Possible Direction
BTC stays below $80,000 Bearish
BTC breaks below $79,300 Potential move toward $78,600
BTC breaks below $78,600 Further downside risk
BTC reclaims $80,700 Recovery becomes more likely
BTC breaks above $81,400 Bullish momentum may strengthen
🎯 My Trading Bias
Short-term: Bearish.
The more cautious approach is to wait for confirmation around $79,300 support or $80,000 resistance rather than entering a trade based on price alone.
Risk management: Risk no more than 1% of your trading capital on a single trade, and be especially careful with leverage during volatile market conditions.
---
📈 Would you like a more precise trading setup?
I can analyze BTC/USD using one of these timeframes:
1. ⚡ 5-minute chart — scalping 2. 📊 15-minute chart — short-term trading 3. 📈 1-hour chart — intraday trading 4. 🌎 4-hour chart — swing trading
#BTC #FOMCWatch
59

Bài viết
Phân tích LTC/USD — ngày 27 tháng 10 năm 2026📊 $LTC /USD — Phân tích ngày 27 tháng 10 năm 2026
Xu hướng thị trường hiện tại: Giảm 📉
Litecoin (LTC/USD) đang giao dịch quanh mức $56.20–$56.50. Diễn biến giá gần đây cho thấy áp lực bán, với các chỉ báo kỹ thuật nghiêng về khả năng giảm thêm, trừ khi bên mua giành lại các mức kháng cự gần đó.
Litecoin
1. Tổng quan thị trường hiện tại
Chỉ báo Giá trị hiện tại
Giá LTC/USD $56.20–$56.50
Mức cao nhất trong 24 giờ $57.11–$57.15
Mức thấp nhất trong 24 giờ $55.92–$56.01
Xu hướng thị trường Giảm
RSI (14) Khoảng 36–46, tùy thuộc vào nguồn
MACD Giảm
Phân tích LTC/USD — ngày 27 tháng 10 năm 2026
📊 $LTC /USD — Phân tích ngày 27 tháng 10 năm 2026
Xu hướng thị trường hiện tại: Giảm 📉
Litecoin (LTC/USD) đang giao dịch quanh mức $56.20–$56.50. Diễn biến giá gần đây cho thấy áp lực bán, với các chỉ báo kỹ thuật nghiêng về khả năng giảm thêm, trừ khi bên mua giành lại các mức kháng cự gần đó.
Litecoin
1. Tổng quan thị trường hiện tại
Chỉ báo Giá trị hiện tại
Giá LTC/USD $56.20–$56.50
Mức cao nhất trong 24 giờ $57.11–$57.15
Mức thấp nhất trong 24 giờ $55.92–$56.01
Xu hướng thị trường Giảm
RSI (14) Khoảng 36–46, tùy thuộc vào nguồn
MACD Giảm
92
📊 $BTC /USD Phân tích kỹ thuật — Ngày 27 tháng 10 năm 2026
{future}(BTCUSDT)
Bitcoin (BTC/USD) đang giao dịch quanh mức $79,800–$80,000, dựa trên dữ liệu thị trường mới nhất hiện có. Xu hướng ngắn hạn có vẻ yếu, trong khi triển vọng ngày và tuần cho thấy một số tiềm năng tăng giá. Điều này tạo nên một thị trường nhiều chiều, vì vậy cần có tín hiệu xác nhận trước khi vào lệnh.
1. Tổng quan thị trường hiện tại
Chỉ báo Phân tích
Giá $BTC /USD ~$79,800–$80,000
Xu hướng ngắn hạn Giảm
Xu hướng ngày Trái chiều / có khả năng tăng
Xu hướng tuần Thiên hướng tăng
Hỗ trợ gần nhất $79,400
Hỗ trợ mạnh hơn $78,100
Kháng cự gần nhất $81,200
Kháng cự chính $82,600
Tình trạng thị trường Tích lũy
Các mức này chỉ mang tính ước tính và dựa trên những chỉ báo kỹ thuật mới nhất hiện có.
2. Các mức hỗ trợ và kháng cự quan trọng
🟢 Các mức hỗ trợ
Hãy theo dõi các mức này nếu BTC/USD giảm.
$79,400: Mức hỗ trợ gần nhất.
$78,100: Mức hỗ trợ quan trọng tiếp theo.
$77,800: Mức hỗ trợ bổ sung ở phía dưới.
$75,000: Vùng hỗ trợ thấp hơn nếu áp lực bán gia tăng.
Nếu giá phá xuống dưới $79,400, khả năng giá tiến về $78,100 có thể tăng lên. Nếu tiếp tục phá xuống dưới mức này, các vùng hỗ trợ thấp hơn có thể bị kiểm tra.
🔴 Các mức kháng cự
Hãy theo dõi các mức này nếu BTC/USD tăng.
$80,800: Vùng kháng cự ngắn hạn.
$81,200: Mức bứt phá quan trọng.
$82,600: Mức kháng cự chính tiếp theo.
$84,500: Vùng kháng cự cao hơn.
Nếu giá duy trì trên $81,200, triển vọng tăng giá có thể được cải thiện, đặc biệt khi được hỗ trợ bởi khối lượng giao dịch lớn.
---
3. Các kịch bản giao dịch BTC/USD
🟢 Kịch bản A: Thiết lập MUA
Cân nhắc thiết lập vị thế mua tiềm năng nếu Bitcoin xác nhận xu hướng tăng.
Điều kiện:
BTC vượt lên trên $81,200.
Nến 15 phút hoặc 1 giờ đóng cửa trên mức kháng cự.
Giá kiểm tra lại mức vừa bứt phá và giữ vững trên đó.
Kế hoạch giao dịch tham khảo:
Thông số Mức giá
Điểm vào lệnh $81,250–$81,500 sau khi có xác nhận
Cắt lỗ $80,700
Mục tiêu 1 $82,000
Mục tiêu 2 $82,600
Mục tiêu 3 $84,000
Đây là các mức giá giả định, không phải tín hiệu giao dịch theo thời gian thực. Hãy chờ giá xác nhận thay vì mua chỉ vì giá đang tăng.
#BinancePick #EarningsSeason
📊 $BTC /USD Phân tích kỹ thuật — Ngày 27 tháng 10 năm 2026
Bitcoin (BTC/USD) đang giao dịch quanh mức $79,800–$80,000, dựa trên dữ liệu thị trường mới nhất hiện có. Xu hướng ngắn hạn có vẻ yếu, trong khi triển vọng ngày và tuần cho thấy một số tiềm năng tăng giá. Điều này tạo nên một thị trường nhiều chiều, vì vậy cần có tín hiệu xác nhận trước khi vào lệnh.
1. Tổng quan thị trường hiện tại
Chỉ báo Phân tích
Giá $BTC /USD ~$79,800–$80,000
Xu hướng ngắn hạn Giảm
Xu hướng ngày Trái chiều / có khả năng tăng
Xu hướng tuần Thiên hướng tăng
Hỗ trợ gần nhất $79,400
Hỗ trợ mạnh hơn $78,100
Kháng cự gần nhất $81,200
Kháng cự chính $82,600
Tình trạng thị trường Tích lũy
Các mức này chỉ mang tính ước tính và dựa trên những chỉ báo kỹ thuật mới nhất hiện có.
2. Các mức hỗ trợ và kháng cự quan trọng
🟢 Các mức hỗ trợ
Hãy theo dõi các mức này nếu BTC/USD giảm.
$79,400: Mức hỗ trợ gần nhất.
$78,100: Mức hỗ trợ quan trọng tiếp theo.
$77,800: Mức hỗ trợ bổ sung ở phía dưới.
$75,000: Vùng hỗ trợ thấp hơn nếu áp lực bán gia tăng.
Nếu giá phá xuống dưới $79,400, khả năng giá tiến về $78,100 có thể tăng lên. Nếu tiếp tục phá xuống dưới mức này, các vùng hỗ trợ thấp hơn có thể bị kiểm tra.
🔴 Các mức kháng cự
Hãy theo dõi các mức này nếu BTC/USD tăng.
$80,800: Vùng kháng cự ngắn hạn.
$81,200: Mức bứt phá quan trọng.
$82,600: Mức kháng cự chính tiếp theo.
$84,500: Vùng kháng cự cao hơn.
Nếu giá duy trì trên $81,200, triển vọng tăng giá có thể được cải thiện, đặc biệt khi được hỗ trợ bởi khối lượng giao dịch lớn.
---
3. Các kịch bản giao dịch BTC/USD
🟢 Kịch bản A: Thiết lập MUA
Cân nhắc thiết lập vị thế mua tiềm năng nếu Bitcoin xác nhận xu hướng tăng.
Điều kiện:
BTC vượt lên trên $81,200.
Nến 15 phút hoặc 1 giờ đóng cửa trên mức kháng cự.
Giá kiểm tra lại mức vừa bứt phá và giữ vững trên đó.
Kế hoạch giao dịch tham khảo:
Thông số Mức giá
Điểm vào lệnh $81,250–$81,500 sau khi có xác nhận
Cắt lỗ $80,700
Mục tiêu 1 $82,000
Mục tiêu 2 $82,600
Mục tiêu 3 $84,000
Đây là các mức giá giả định, không phải tín hiệu giao dịch theo thời gian thực. Hãy chờ giá xác nhận thay vì mua chỉ vì giá đang tăng.
#BinancePick #EarningsSeason
69
📊 $ETH /USDT Phân tích kỹ thuật
Ngày: 26 tháng 10 năm 2026
{future}(ETHUSDT)
Hãy cùng phân tích Ethereum (ETH/USDT) để tìm kiếm các cơ hội giao dịch MUA và BÁN TIỀM NĂNG.
Quan trọng: Trong cuộc trò chuyện này, tôi không có nguồn cấp dữ liệu giá ETH/USDT trực tiếp đã được xác minh, vì vậy tôi không thể xác nhận giá hiện tại hoặc các mức hỗ trợ và kháng cự chính xác trong ngày hôm nay. Các chiến lược dưới đây có điều kiện, không phải tín hiệu giao dịch trực tiếp.
1. 🟢 Thiết lập MUA (Long)
Cân nhắc thiết lập MUA nếu Ethereum cho thấy động lượng tăng và phá vỡ ngưỡng kháng cự.
Tín hiệu xác nhận:
Nến 15 phút hoặc 1 giờ đóng cửa phía trên ngưỡng kháng cự.
Khối lượng giao dịch tăng trong thời điểm phá vỡ.
Giá kiểm tra lại ngưỡng kháng cự thành công và giữ được như một mức hỗ trợ.
RSI vượt lên trên 50, củng cố động lượng tăng.
Điểm vào tiềm năng: Sau khi xác nhận phá vỡ và kiểm tra lại thành công.
Các mức chốt lời:
TP1: Điểm vào + 1%
TP2: Điểm vào + 2%
TP3: Điểm vào + 3%
Cắt lỗ: Đặt dưới đáy của nhịp kiểm tra lại hoặc mức hỗ trợ liên quan.
2. 🔴 Thiết lập BÁN (Short)
Cân nhắc thiết lập BÁN nếu Ethereum phá vỡ ngưỡng hỗ trợ và áp lực bán gia tăng.
Tín hiệu xác nhận:
Nến 15 phút hoặc 1 giờ đóng cửa dưới ngưỡng hỗ trợ.
Khối lượng bán tăng.
Giá kiểm tra lại ngưỡng hỗ trợ nhưng không thể vượt lên trên.
RSI giảm xuống dưới 50, củng cố động lượng giảm.
Điểm vào tiềm năng: Sau khi xác nhận phá vỡ xuống và kiểm tra lại thất bại.
Các mức chốt lời:
TP1: Điểm vào − 1%
TP2: Điểm vào − 2%
TP3: Điểm vào − 3%
Cắt lỗ: Đặt trên đỉnh của nhịp kiểm tra lại hoặc mức kháng cự liên quan.
3. Quyết định giao dịch ETH/USDT
Điều kiện thị trường Hành động tiềm năng
Giá phá vỡ ngưỡng kháng cự Cân nhắc MUA
Giá phá vỡ ngưỡng hỗ trợ Cân nhắc BÁN
Giá đi ngang Chờ xác nhận
Phá vỡ giả lên hoặc xuống Tránh đuổi theo giá
Quản lý rủi ro
Không mạo hiểm quá 1% vốn giao dịch cho một lệnh.
Hướng đến tỷ lệ rủi ro/lợi nhuận tối thiểu là 1:2.
Tránh sử dụng đòn bẩy quá mức.
Luôn sử dụng lệnh cắt lỗ.
📊 $ETH /USDT Phân tích kỹ thuật
Ngày: 26 tháng 10 năm 2026
Hãy cùng phân tích Ethereum (ETH/USDT) để tìm kiếm các cơ hội giao dịch MUA và BÁN TIỀM NĂNG.
Quan trọng: Trong cuộc trò chuyện này, tôi không có nguồn cấp dữ liệu giá ETH/USDT trực tiếp đã được xác minh, vì vậy tôi không thể xác nhận giá hiện tại hoặc các mức hỗ trợ và kháng cự chính xác trong ngày hôm nay. Các chiến lược dưới đây có điều kiện, không phải tín hiệu giao dịch trực tiếp.
1. 🟢 Thiết lập MUA (Long)
Cân nhắc thiết lập MUA nếu Ethereum cho thấy động lượng tăng và phá vỡ ngưỡng kháng cự.
Tín hiệu xác nhận:
Nến 15 phút hoặc 1 giờ đóng cửa phía trên ngưỡng kháng cự.
Khối lượng giao dịch tăng trong thời điểm phá vỡ.
Giá kiểm tra lại ngưỡng kháng cự thành công và giữ được như một mức hỗ trợ.
RSI vượt lên trên 50, củng cố động lượng tăng.
Điểm vào tiềm năng: Sau khi xác nhận phá vỡ và kiểm tra lại thành công.
Các mức chốt lời:
TP1: Điểm vào + 1%
TP2: Điểm vào + 2%
TP3: Điểm vào + 3%
Cắt lỗ: Đặt dưới đáy của nhịp kiểm tra lại hoặc mức hỗ trợ liên quan.
2. 🔴 Thiết lập BÁN (Short)
Cân nhắc thiết lập BÁN nếu Ethereum phá vỡ ngưỡng hỗ trợ và áp lực bán gia tăng.
Tín hiệu xác nhận:
Nến 15 phút hoặc 1 giờ đóng cửa dưới ngưỡng hỗ trợ.
Khối lượng bán tăng.
Giá kiểm tra lại ngưỡng hỗ trợ nhưng không thể vượt lên trên.
RSI giảm xuống dưới 50, củng cố động lượng giảm.
Điểm vào tiềm năng: Sau khi xác nhận phá vỡ xuống và kiểm tra lại thất bại.
Các mức chốt lời:
TP1: Điểm vào − 1%
TP2: Điểm vào − 2%
TP3: Điểm vào − 3%
Cắt lỗ: Đặt trên đỉnh của nhịp kiểm tra lại hoặc mức kháng cự liên quan.
3. Quyết định giao dịch ETH/USDT
Điều kiện thị trường Hành động tiềm năng
Giá phá vỡ ngưỡng kháng cự Cân nhắc MUA
Giá phá vỡ ngưỡng hỗ trợ Cân nhắc BÁN
Giá đi ngang Chờ xác nhận
Phá vỡ giả lên hoặc xuống Tránh đuổi theo giá
Quản lý rủi ro
Không mạo hiểm quá 1% vốn giao dịch cho một lệnh.
Hướng đến tỷ lệ rủi ro/lợi nhuận tối thiểu là 1:2.
Tránh sử dụng đòn bẩy quá mức.
Luôn sử dụng lệnh cắt lỗ.
60
Xem bản dịch
📊 $BTC /USDT Technical Analysis — October 26, 2026
{future}(BTCUSDT)
Bitcoin (BTC/USDT) technical analysis for short-term trading.
Important: I don't have a verified live BTC/USDT price feed in this chat. The price levels below are illustrative levels from the previous analysis, not confirmed current market prices. Please verify them on your exchange before trading.
1. Key Support and Resistance Levels
LevelPrice (USDT)SignificanceResistance 3$84,000Major resistanceResistance 2$82,500Secondary resistanceResistance 1$81,000Short-term breakout levelMarket Zone$80,000Potential decision areaSupport 1$79,000Immediate supportSupport 2$78,000Potential downside targetSupport 3$76,000Major support zone
2. 🔴 SHORT Scenario
A short setup could develop if Bitcoin breaks below $79,000 and confirms the breakdown.
Potential trade setup:
Entry: Below $79,000 after confirmation and a successful retest
Take Profit 1: $78,000
Take Profit 2: $77,000
Take Profit 3: $76,000–$76,500
Stop Loss: Above the relevant resistance or retest high
Confirmation signals:
A 15-minute or 1-hour candle closes below support.
Selling volume increases.
The price retests $79,000 and fails to reclaim it.
Avoid entering immediately after a sudden price drop without confirmation.
3. 🟢 LONG Scenario
A potential long setup could develop if Bitcoin breaks above $81,000 and successfully retests that level as support.
Potential trade setup:
Entry: Above $81,000 after a confirmed breakout and retest
Take Profit 1: $82,000
Take Profit 2: $82,500
Take Profit 3: $84,000
Stop Loss: Below the retest low or relevant support
Confirmation signals:
A 1-hour candle closes above resistance.
Buying volume increases.
The price holds above $81,000 after the breakout.
A brief wick above resistance is not sufficient confirmation of a breakout.
4. 📈 Trading Strategy
BTC/USDT ConditionPossible ActionPrice breaks below $79,000Look for a SHORT setupPrice remains between $79,000 and $81,000Wait for confirmationPrice breaks above $81,000Look for a LONG setupPrice shows a false
📊 $BTC /USDT Technical Analysis — October 26, 2026
Bitcoin (BTC/USDT) technical analysis for short-term trading.
Important: I don't have a verified live BTC/USDT price feed in this chat. The price levels below are illustrative levels from the previous analysis, not confirmed current market prices. Please verify them on your exchange before trading.
1. Key Support and Resistance Levels
LevelPrice (USDT)SignificanceResistance 3$84,000Major resistanceResistance 2$82,500Secondary resistanceResistance 1$81,000Short-term breakout levelMarket Zone$80,000Potential decision areaSupport 1$79,000Immediate supportSupport 2$78,000Potential downside targetSupport 3$76,000Major support zone
2. 🔴 SHORT Scenario
A short setup could develop if Bitcoin breaks below $79,000 and confirms the breakdown.
Potential trade setup:
Entry: Below $79,000 after confirmation and a successful retest
Take Profit 1: $78,000
Take Profit 2: $77,000
Take Profit 3: $76,000–$76,500
Stop Loss: Above the relevant resistance or retest high
Confirmation signals:
A 15-minute or 1-hour candle closes below support.
Selling volume increases.
The price retests $79,000 and fails to reclaim it.
Avoid entering immediately after a sudden price drop without confirmation.
3. 🟢 LONG Scenario
A potential long setup could develop if Bitcoin breaks above $81,000 and successfully retests that level as support.
Potential trade setup:
Entry: Above $81,000 after a confirmed breakout and retest
Take Profit 1: $82,000
Take Profit 2: $82,500
Take Profit 3: $84,000
Stop Loss: Below the retest low or relevant support
Confirmation signals:
A 1-hour candle closes above resistance.
Buying volume increases.
The price holds above $81,000 after the breakout.
A brief wick above resistance is not sufficient confirmation of a breakout.
4. 📈 Trading Strategy
BTC/USDT ConditionPossible ActionPrice breaks below $79,000Look for a SHORT setupPrice remains between $79,000 and $81,000Wait for confirmationPrice breaks above $81,000Look for a LONG setupPrice shows a false
74
·
--
Tăng giá
Giá vàng hôm nay lại ghi nhận sự giảm mạnh
Giá vàng mỗi chỉ giảm 12 nghìn 489 đồng, còn 455 nghìn 327 đồng, vàng 10 gram rẻ hơn 11 nghìn 240 đồng
#GOLD #GOLD_UPDATE
Giá vàng hôm nay lại ghi nhận sự giảm mạnh
Giá vàng mỗi chỉ giảm 12 nghìn 489 đồng, còn 455 nghìn 327 đồng, vàng 10 gram rẻ hơn 11 nghìn 240 đồng
#GOLD #GOLD_UPDATE
Giá vàng mỗi chỉ giảm 12 nghìn 489 đồng, còn 455 nghìn 327 đồng, vàng 10 gram rẻ hơn 11 nghìn 240 đồng
#GOLD #GOLD_UPDATE

166
Giá vàng trên thị trường quốc tế giảm mạnh
Giá vàng đã giảm 157 đô la xuống còn 5023 đô la mỗi ounce
#GOLD #GOLD_UPDATE
Giá vàng trên thị trường quốc tế giảm mạnh
Giá vàng đã giảm 157 đô la xuống còn 5023 đô la mỗi ounce
#GOLD #GOLD_UPDATE
Giá vàng đã giảm 157 đô la xuống còn 5023 đô la mỗi ounce
#GOLD #GOLD_UPDATE

123
Giá vàng ở Pakistan lại giảm
Vào ngày 6 tháng 3 năm 2026, giá vàng ở Pakistan đã ghi nhận một lần nữa giảm, phù hợp với xu hướng giảm trên thị trường toàn cầu.
Theo Hiệp hội Thủ công mỹ nghệ và Kim hoàn Pakistan, giá vàng mỗi tola đã giảm 3.400 rupee, đưa giá mới lên 533.762 rupee mỗi tola.
Tương tự, vàng 10 gram đã giảm 2.915 rupee và được bán với giá 457.614 rupee. Trước đó, vào thứ Năm, giá vàng mỗi tola đã lên tới 537.162 rupee, giảm 2.800 rupee trong ngày đó.
Giá vàng trên thị trường toàn cầu cũng giảm 34 đô la, xuống còn 5.110 đô la mỗi ounce, bao gồm cả mức phí bảo hiểm 20 đô la.
Mặt khác, giá bạc đã tăng nhẹ và bạc mỗi tola đã tăng 104 rupee, đạt 8.914 rupee.
#GOLD #GOLD_UPDATE #GoldenOpportunity

3
194
Nếu eo biển Hormuz đóng cửa, giá dầu có thể đạt 150 đô la mỗi thùng trong 2 đến 3 tuần, Bộ trưởng Năng lượng Qatar đã cảnh báo
#oil #OilMarket #OilPrice
Nếu eo biển Hormuz đóng cửa, giá dầu có thể đạt 150 đô la mỗi thùng trong 2 đến 3 tuần, Bộ trưởng Năng lượng Qatar đã cảnh báo
#oil #OilMarket #OilPrice
#oil #OilMarket #OilPrice

2
250
Iran đã tăng giá dầu thô lên 84 đô la mỗi thùng sau các cuộc tấn công
Trung Quốc cũng đã ra lệnh ngừng xuất khẩu diesel và xăng cho các nhà máy lọc dầu lớn của quốc gia này
#OilMarket #OilAlert
Iran đã tăng giá dầu thô lên 84 đô la mỗi thùng sau các cuộc tấn công
Trung Quốc cũng đã ra lệnh ngừng xuất khẩu diesel và xăng cho các nhà máy lọc dầu lớn của quốc gia này
#OilMarket #OilAlert
Trung Quốc cũng đã ra lệnh ngừng xuất khẩu diesel và xăng cho các nhà máy lọc dầu lớn của quốc gia này
#OilMarket #OilAlert

2
154
Sau khi giảm giá trên thị trường toàn cầu, vàng ở Pakistan cũng rẻ hơn
Giá mỗi lượng giảm 3400 rupee xuống còn 5 lakh 33 nghìn 762 rupee, vàng 10 gram giảm 2915 rupee
#GOLD #GOLD_UPDATE
Sau khi giảm giá trên thị trường toàn cầu, vàng ở Pakistan cũng rẻ hơn
Giá mỗi lượng giảm 3400 rupee xuống còn 5 lakh 33 nghìn 762 rupee, vàng 10 gram giảm 2915 rupee
#GOLD #GOLD_UPDATE
Giá mỗi lượng giảm 3400 rupee xuống còn 5 lakh 33 nghìn 762 rupee, vàng 10 gram giảm 2915 rupee
#GOLD #GOLD_UPDATE

8
Vàng ở Pakistan giảm 10 nghìn rupee mỗi tola
Giá đã trở thành 5 lakh 39 nghìn 962 rupee, 10 gram vàng giảm 8573 rupee
#GOLD #GOLD_UPDATE
Vàng ở Pakistan giảm 10 nghìn rupee mỗi tola
Giá đã trở thành 5 lakh 39 nghìn 962 rupee, 10 gram vàng giảm 8573 rupee
#GOLD #GOLD_UPDATE
Giá đã trở thành 5 lakh 39 nghìn 962 rupee, 10 gram vàng giảm 8573 rupee
#GOLD #GOLD_UPDATE

2
341
7 ngày liên tiếp tăng giá, giá vàng đã giảm
Vàng giảm 700 rupee xuống còn 5 lakh 40 nghìn 562 rupee,
Giá vàng trên thị trường thế giới giảm 7 đô la xuống còn 5178 đô la mỗi ounce
#GOLD #GOLD_UPDATE
7 ngày liên tiếp tăng giá, giá vàng đã giảm
Vàng giảm 700 rupee xuống còn 5 lakh 40 nghìn 562 rupee,
Giá vàng trên thị trường thế giới giảm 7 đô la xuống còn 5178 đô la mỗi ounce
#GOLD #GOLD_UPDATE
Vàng giảm 700 rupee xuống còn 5 lakh 40 nghìn 562 rupee,
Giá vàng trên thị trường thế giới giảm 7 đô la xuống còn 5178 đô la mỗi ounce
#GOLD #GOLD_UPDATE

3
359
Giá vàng mỗi chỉ tăng thêm 1300 rupee, đã lên 541262 rupee
Giá vàng mỗi 10 gram cũng tăng 1114 rupee, giá bạc mỗi chỉ đã lên 9554 rupee
#GOLD #GOLD_UPDATE
Giá vàng mỗi chỉ tăng thêm 1300 rupee, đã lên 541262 rupee
Giá vàng mỗi 10 gram cũng tăng 1114 rupee, giá bạc mỗi chỉ đã lên 9554 rupee
#GOLD #GOLD_UPDATE
Giá vàng mỗi 10 gram cũng tăng 1114 rupee, giá bạc mỗi chỉ đã lên 9554 rupee
#GOLD #GOLD_UPDATE

3
380
Giá vàng tăng mạnh
Vàng mỗi chỉ tăng 3 nghìn rupee lên 536 nghìn 562 rupee
Giá vàng trên thị trường quốc tế tăng 30 đô la, đạt 5138 đô la mỗi ounce
#GOLD #GoldRate #GOLD_UPDATE
Giá vàng tăng mạnh
Vàng mỗi chỉ tăng 3 nghìn rupee lên 536 nghìn 562 rupee
Giá vàng trên thị trường quốc tế tăng 30 đô la, đạt 5138 đô la mỗi ounce
#GOLD #GoldRate #GOLD_UPDATE
Vàng mỗi chỉ tăng 3 nghìn rupee lên 536 nghìn 562 rupee
Giá vàng trên thị trường quốc tế tăng 30 đô la, đạt 5138 đô la mỗi ounce
#GOLD #GoldRate #GOLD_UPDATE

2
212
Đăng nhập để khám phá thêm nội dung
Tham gia cùng người dùng tiền mã hóa toàn cầu trên Binance Square
⚡️ Nhận thông tin mới nhất và hữu ích về tiền mã hóa.
💬 Được tin cậy bởi sàn giao dịch tiền mã hóa lớn nhất thế giới.
👍 Khám phá những thông tin chuyên sâu thực tế từ những nhà sáng tạo đã xác minh.
Email / Số điện thoại
Chủ đề thịnh hành
CanMicrosoftDeliverOnAI
452,941 lượt xem
3,336 đang thảo luận
Phiên 3 của mùa công bố kết quả kinh doanh: Google và Microsoft có vượt kỳ vọng không?
Binance Square Official
·148 lượt thích
·80.8k lượt xem
CanGoogleDefindItsCore
280,809 lượt xem
2,354 đang thảo luận
TinFed
367,609 lượt xem
1,000 đang thảo luận