
CryptoYaan
24 Bài đăng

CryptoYaan
Báo cáo
Chặn người dùng
CryptoYaan.com turns the noise of the crypto market into clear, scored trade setups with real risk management. Free to start. Educational, not financial advice.
0 Đang theo dõi
2 Người theo dõi
27 Đã thích
Bài đăng
·
--
Tăng giá
#fomcwatching
Quyết định FOMC
Cục Dự trữ Liên bang Mỹ (Fed) đã giữ nguyên biên độ mục tiêu lãi suất quỹ liên bang ở mức 3,50%–3,75%. Đây là cuộc họp thứ năm liên tiếp không có điều chỉnh.
Thông điệp chính
Fed thừa nhận rằng lạm phát đã hạ nhiệt so với các đỉnh cao trước đó nhưng nhấn mạnh rằng vẫn chưa “giành chiến thắng”. Tuyên bố cho thấy Ủy ban vẫn sẵn sàng thắt chặt chính sách trở lại nếu các áp lực lạm phát tái xuất hiện, đặc biệt trong bối cảnh còn nhiều bất định quanh giá năng lượng và các rủi ro khác.
Diễn giải ban đầu của thị trường
Thị trường đang xem đây là quan điểm “diều hâu giữ nguyên” hơn là “dovish”:
📈 Lợi suất trái phiếu: có khả năng duy trì ở mức cao hoặc nhích tăng thêm. 💵 Đồng USD: hỗ trợ ở mức vừa phải. 🟡 Vàng: có thể chịu một số áp lực. 📊 Chứng khoán: phản ứng ngay lập tức có thể trái chiều; nhà đầu tư sẽ tập trung vào phát biểu của Chủ tịch trong cuộc họp báo trước khi quyết định hướng đi.
Điều quan trọng tiếp theo
Xúc tác lớn nhất là cuộc họp báo của Chủ tịch Kevin Warsh. Thị trường sẽ lắng nghe để tìm câu trả lời cho các câu hỏi như:
Liệu ông có gợi ý rằng khả năng sẽ có thêm một đợt tăng lãi suất trong năm nay không? Những điều kiện nào sẽ biện minh cho việc tăng lãi suất? Lạm phát có còn là mối lo ngại chi phối không? Fed nhìn nhận tăng trưởng và thị trường lao động như thế nào?
Những câu trả lời này thường tác động mạnh hơn đến thị trường so với chính bản tuyên bố.
#fomcwatching
Quyết định FOMC
Cục Dự trữ Liên bang Mỹ (Fed) đã giữ nguyên biên độ mục tiêu lãi suất quỹ liên bang ở mức 3,50%–3,75%. Đây là cuộc họp thứ năm liên tiếp không có điều chỉnh.
Thông điệp chính
Fed thừa nhận rằng lạm phát đã hạ nhiệt so với các đỉnh cao trước đó nhưng nhấn mạnh rằng vẫn chưa “giành chiến thắng”. Tuyên bố cho thấy Ủy ban vẫn sẵn sàng thắt chặt chính sách trở lại nếu các áp lực lạm phát tái xuất hiện, đặc biệt trong bối cảnh còn nhiều bất định quanh giá năng lượng và các rủi ro khác.
Diễn giải ban đầu của thị trường
Thị trường đang xem đây là quan điểm “diều hâu giữ nguyên” hơn là “dovish”:
📈 Lợi suất trái phiếu: có khả năng duy trì ở mức cao hoặc nhích tăng thêm. 💵 Đồng USD: hỗ trợ ở mức vừa phải. 🟡 Vàng: có thể chịu một số áp lực. 📊 Chứng khoán: phản ứng ngay lập tức có thể trái chiều; nhà đầu tư sẽ tập trung vào phát biểu của Chủ tịch trong cuộc họp báo trước khi quyết định hướng đi.
Điều quan trọng tiếp theo
Xúc tác lớn nhất là cuộc họp báo của Chủ tịch Kevin Warsh. Thị trường sẽ lắng nghe để tìm câu trả lời cho các câu hỏi như:
Liệu ông có gợi ý rằng khả năng sẽ có thêm một đợt tăng lãi suất trong năm nay không? Những điều kiện nào sẽ biện minh cho việc tăng lãi suất? Lạm phát có còn là mối lo ngại chi phối không? Fed nhìn nhận tăng trưởng và thị trường lao động như thế nào?
Những câu trả lời này thường tác động mạnh hơn đến thị trường so với chính bản tuyên bố.
Quyết định FOMC
Cục Dự trữ Liên bang Mỹ (Fed) đã giữ nguyên biên độ mục tiêu lãi suất quỹ liên bang ở mức 3,50%–3,75%. Đây là cuộc họp thứ năm liên tiếp không có điều chỉnh.
Thông điệp chính
Fed thừa nhận rằng lạm phát đã hạ nhiệt so với các đỉnh cao trước đó nhưng nhấn mạnh rằng vẫn chưa “giành chiến thắng”. Tuyên bố cho thấy Ủy ban vẫn sẵn sàng thắt chặt chính sách trở lại nếu các áp lực lạm phát tái xuất hiện, đặc biệt trong bối cảnh còn nhiều bất định quanh giá năng lượng và các rủi ro khác.
Diễn giải ban đầu của thị trường
Thị trường đang xem đây là quan điểm “diều hâu giữ nguyên” hơn là “dovish”:
📈 Lợi suất trái phiếu: có khả năng duy trì ở mức cao hoặc nhích tăng thêm. 💵 Đồng USD: hỗ trợ ở mức vừa phải. 🟡 Vàng: có thể chịu một số áp lực. 📊 Chứng khoán: phản ứng ngay lập tức có thể trái chiều; nhà đầu tư sẽ tập trung vào phát biểu của Chủ tịch trong cuộc họp báo trước khi quyết định hướng đi.
Điều quan trọng tiếp theo
Xúc tác lớn nhất là cuộc họp báo của Chủ tịch Kevin Warsh. Thị trường sẽ lắng nghe để tìm câu trả lời cho các câu hỏi như:
Liệu ông có gợi ý rằng khả năng sẽ có thêm một đợt tăng lãi suất trong năm nay không? Những điều kiện nào sẽ biện minh cho việc tăng lãi suất? Lạm phát có còn là mối lo ngại chi phối không? Fed nhìn nhận tăng trưởng và thị trường lao động như thế nào?
Những câu trả lời này thường tác động mạnh hơn đến thị trường so với chính bản tuyên bố.
1
2
125
·
--
Tăng giá
📊
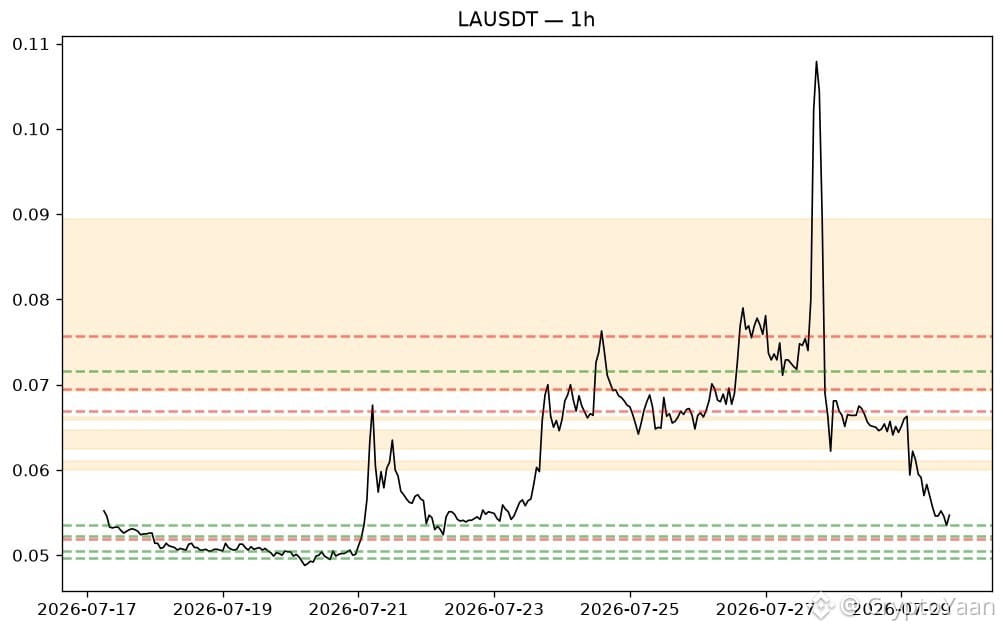
$LA - 1h (Binance)
➡️
Xu hướng: đi ngang / chuyển tiếp, không có cấu trúc hướng rõ ràng
⚡
Động lượng: nghiêng giảm (RSI 35.8)
🏷️
Giá: 0.0547
🔴
Kháng cự: 0.0605 (fair value gap), 0.0636 (fair value gap), 0.0660 (fair value gap), 0.0670 (khu thanh khoản)
🟢
Hỗ trợ: 0.0536 (khu thanh khoản), 0.0523 (khu thanh khoản), 0.0505 (khu thanh khoản), 0.0497 (khu thanh khoản)
🟢
KỊCH BẢN LONG Chờ nhịp điều chỉnh về 0.0535-0.0538 (khu thanh khoản) với tín hiệu đảo chiều tăng trước khi vào lệnh. Xác nhận cần tìm: nến engulfing tăng, hammer, hoặc phản ứng từ chối với râu dưới dài tại vùng này trên khung 15m-1h; lý tưởng là đồng thời có sự phá vỡ đỉnh swing gần nhất ở khung thời gian thấp hơn (thay đổi cấu trúc) và RSI quay đầu đi lên.
🎯
Mục tiêu: 0.0605, sau đó 0.0636.
🛑
Cắt lỗ: dưới 0.0528.
{spot}(LAUSDT)
Kiểm tra đa sàn: BINANCE: 0.0547 | xu hướng: đi ngang / chuyển tiếp | RSI: 35.8 BYBIT: 0.0546 | xu hướng: giảm (LH/LL) | RSI: 34.7 Chênh lệch giá giữa sàn: 0.202% | Đồng thuận xu hướng: không
🎯
Thiết lập:
🔴
SHORT - pullback theo xu hướng (short) 59/100
⚪🕐
1h: - , 4h: - , 1d:▼
🎯
Vào lệnh ≈ 0.05535 ·
🛑
Cắt lỗ 0.0595158 (1.5×ATR) · Mục tiêu 0.0511842 / 0.0470184 / 0.0428526 (1R/2R/3R)
🧩
Vì sao: xu hướng khung thời gian lớn hơn (+12), chồng EMA (+15), động lượng MACD (+5), gần vùng kháng cự (+17), đồng thuận đa khung (+5), nằm dưới VWAP (+5)
⚖️
Kế hoạch rủi ro (với rủi ro 3% tài khoản): Cắt lỗ cách điểm vào 7.00% → quy mô vị thế ≈ 42.9% tài khoản (spot). Hợp đồng tương lai @ 25x: ~1.7% tài khoản làm ký quỹ; gần đúng mức thanh lý 0.0572872.
⚠️
Đòn bẩy 25x thì bị thanh lý trước khi chạm cắt lỗ - giữ đòn bẩy ≤ 8x cho mức cắt lỗ này.
ℹ️
Nội dung mang tính giáo dục - tự xác nhận trước khi hành động.
#CryptoTradingInsights #LA
📊
$LA - 1h (Binance)
➡️
Xu hướng: đi ngang / chuyển tiếp, không có cấu trúc hướng rõ ràng
⚡
Động lượng: nghiêng giảm (RSI 35.8)
🏷️
Giá: 0.0547
🔴
Kháng cự: 0.0605 (fair value gap), 0.0636 (fair value gap), 0.0660 (fair value gap), 0.0670 (khu thanh khoản)
🟢
Hỗ trợ: 0.0536 (khu thanh khoản), 0.0523 (khu thanh khoản), 0.0505 (khu thanh khoản), 0.0497 (khu thanh khoản)
🟢
KỊCH BẢN LONG Chờ nhịp điều chỉnh về 0.0535-0.0538 (khu thanh khoản) với tín hiệu đảo chiều tăng trước khi vào lệnh. Xác nhận cần tìm: nến engulfing tăng, hammer, hoặc phản ứng từ chối với râu dưới dài tại vùng này trên khung 15m-1h; lý tưởng là đồng thời có sự phá vỡ đỉnh swing gần nhất ở khung thời gian thấp hơn (thay đổi cấu trúc) và RSI quay đầu đi lên.
🎯
Mục tiêu: 0.0605, sau đó 0.0636.
🛑
Cắt lỗ: dưới 0.0528.
Kiểm tra đa sàn: BINANCE: 0.0547 | xu hướng: đi ngang / chuyển tiếp | RSI: 35.8 BYBIT: 0.0546 | xu hướng: giảm (LH/LL) | RSI: 34.7 Chênh lệch giá giữa sàn: 0.202% | Đồng thuận xu hướng: không
🎯
Thiết lập:
🔴
SHORT - pullback theo xu hướng (short) 59/100
⚪🕐
1h: - , 4h: - , 1d:▼
🎯
Vào lệnh ≈ 0.05535 ·
🛑
Cắt lỗ 0.0595158 (1.5×ATR) · Mục tiêu 0.0511842 / 0.0470184 / 0.0428526 (1R/2R/3R)
🧩
Vì sao: xu hướng khung thời gian lớn hơn (+12), chồng EMA (+15), động lượng MACD (+5), gần vùng kháng cự (+17), đồng thuận đa khung (+5), nằm dưới VWAP (+5)
⚖️
Kế hoạch rủi ro (với rủi ro 3% tài khoản): Cắt lỗ cách điểm vào 7.00% → quy mô vị thế ≈ 42.9% tài khoản (spot). Hợp đồng tương lai @ 25x: ~1.7% tài khoản làm ký quỹ; gần đúng mức thanh lý 0.0572872.
⚠️
Đòn bẩy 25x thì bị thanh lý trước khi chạm cắt lỗ - giữ đòn bẩy ≤ 8x cho mức cắt lỗ này.
ℹ️
Nội dung mang tính giáo dục - tự xác nhận trước khi hành động.
#CryptoTradingInsights #LA
$LA - 1h (Binance)
➡️
Xu hướng: đi ngang / chuyển tiếp, không có cấu trúc hướng rõ ràng
⚡
Động lượng: nghiêng giảm (RSI 35.8)
🏷️
Giá: 0.0547
🔴
Kháng cự: 0.0605 (fair value gap), 0.0636 (fair value gap), 0.0660 (fair value gap), 0.0670 (khu thanh khoản)
🟢
Hỗ trợ: 0.0536 (khu thanh khoản), 0.0523 (khu thanh khoản), 0.0505 (khu thanh khoản), 0.0497 (khu thanh khoản)
🟢
KỊCH BẢN LONG Chờ nhịp điều chỉnh về 0.0535-0.0538 (khu thanh khoản) với tín hiệu đảo chiều tăng trước khi vào lệnh. Xác nhận cần tìm: nến engulfing tăng, hammer, hoặc phản ứng từ chối với râu dưới dài tại vùng này trên khung 15m-1h; lý tưởng là đồng thời có sự phá vỡ đỉnh swing gần nhất ở khung thời gian thấp hơn (thay đổi cấu trúc) và RSI quay đầu đi lên.
🎯
Mục tiêu: 0.0605, sau đó 0.0636.
🛑
Cắt lỗ: dưới 0.0528.
Kiểm tra đa sàn: BINANCE: 0.0547 | xu hướng: đi ngang / chuyển tiếp | RSI: 35.8 BYBIT: 0.0546 | xu hướng: giảm (LH/LL) | RSI: 34.7 Chênh lệch giá giữa sàn: 0.202% | Đồng thuận xu hướng: không
🎯
Thiết lập:
🔴
SHORT - pullback theo xu hướng (short) 59/100
⚪🕐
1h: - , 4h: - , 1d:▼
🎯
Vào lệnh ≈ 0.05535 ·
🛑
Cắt lỗ 0.0595158 (1.5×ATR) · Mục tiêu 0.0511842 / 0.0470184 / 0.0428526 (1R/2R/3R)
🧩
Vì sao: xu hướng khung thời gian lớn hơn (+12), chồng EMA (+15), động lượng MACD (+5), gần vùng kháng cự (+17), đồng thuận đa khung (+5), nằm dưới VWAP (+5)
⚖️
Kế hoạch rủi ro (với rủi ro 3% tài khoản): Cắt lỗ cách điểm vào 7.00% → quy mô vị thế ≈ 42.9% tài khoản (spot). Hợp đồng tương lai @ 25x: ~1.7% tài khoản làm ký quỹ; gần đúng mức thanh lý 0.0572872.
⚠️
Đòn bẩy 25x thì bị thanh lý trước khi chạm cắt lỗ - giữ đòn bẩy ≤ 8x cho mức cắt lỗ này.
ℹ️
Nội dung mang tính giáo dục - tự xác nhận trước khi hành động.
#CryptoTradingInsights #LA
1
16
·
--
Tăng giá
📊
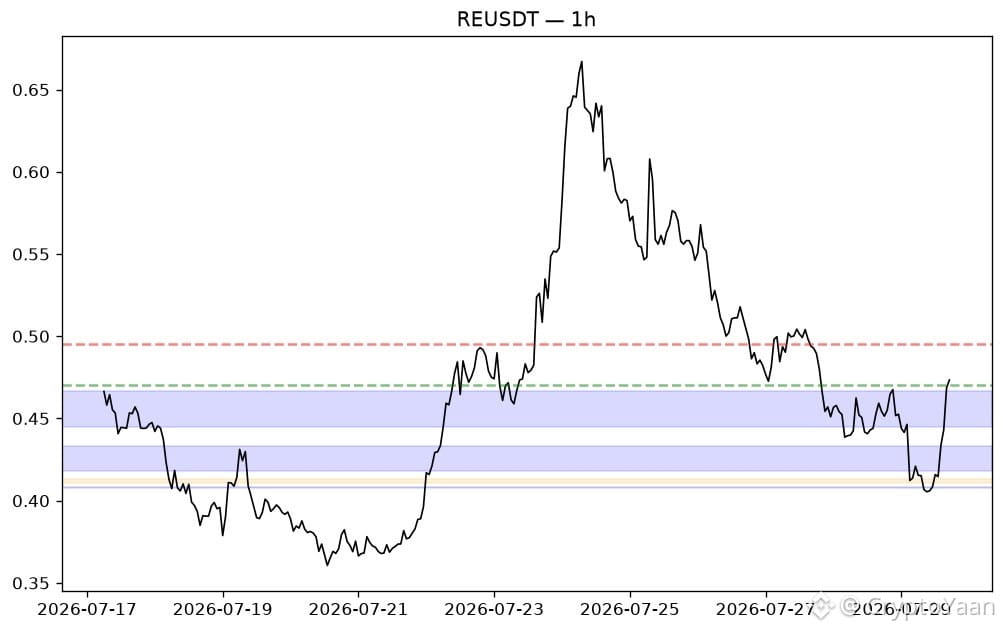
$RE - 1h (Binance)
➡️
Xu hướng: đi ngang / chuyển tiếp, không có cấu trúc hướng rõ ràng
⚡
Đà: đang ở vùng quá mua (RSI 82.2)
🏷️
Giá: 0.4734
🔴
Kháng cự: 0.4954 (pool thanh khoản)
🟢
Hỗ trợ: 0.4702 (pool thanh khoản), 0.4558 (gap giá trị hợp lý), 0.4255 (gap giá trị hợp lý), 0.4081 (gap giá trị hợp lý)
🟢
KỊCH BẢN LONG: Chờ nhịp điều chỉnh về 0.4697-0.4716 (pool thanh khoản) kèm tín hiệu đảo chiều tăng trước khi vào lệnh. Xác nhận cần tìm: nến engulfing tăng, nến búa, hoặc tín hiệu bị từ chối với bóng dưới dài tại vùng này trên khung 15m-1h; lý tưởng là đồng thời có sự phá vỡ đỉnh swing thấp nhất ở khung thời gian thấp gần nhất (thay đổi cấu trúc) và RSI quay đầu đi lên.
🎯
Mục tiêu: 0.4954, sau đó 0.4829.
🛑
Cắt lỗ: thấp hơn 0.4631.
🔴
KỊCH BẢN SHORT: Chờ sự từ chối gần 0.4939-0.4959 (pool thanh khoản) kèm tín hiệu đảo chiều giảm trước khi vào lệnh. Xác nhận cần tìm: nến engulfing giảm, nến sao băng, hoặc tín hiệu bị từ chối với bóng trên dài tại vùng này trên khung 15m-1h; lý tưởng là đồng thời có sự phá vỡ đáy swing thấp nhất ở khung thời gian thấp gần nhất (thay đổi cấu trúc) và RSI quay đầu đi xuống.
🎯
Mục tiêu: 0.4702, sau đó 0.4558.
🛑
Cắt lỗ: cao hơn 0.5028.
ℹ️
Kiểm tra đa sàn: BINANCE: 0.4734 | xu hướng: đi ngang / chuyển tiếp | RSI: 82.2 OKX: 0.4737 | xu hướng: đi ngang / chuyển tiếp | RSI: 82.9 Chênh lệch giá: 0.072% | Đồng thuận xu hướng: yes
🎯
Thiết lập:
🔴
SHORT - đảo chiều do quá mua tại kháng cự 68/100
🟡🕐
1h: - , 4h:▼, 1d:▼
🎯
Vào lệnh ≈ 0.4849
🛑
Stop 0.503623 (1.5×ATR) · Targets 0.466177 / 0.447454 / 0.428731 (1R/2R/3R)
🧩
Lý do: xu hướng khung thời gian cao hơn (+25), EMA stack (+15), RSI (+10), gần kháng cự (+8), đồng thuận đa khung (+10)
⚖️
Kế hoạch rủi ro (rủi ro 3% tài khoản): Stop cách giá vào lệnh 3.72% → cỡ vị thế ≈ 80.7% tài khoản (spot). Futures @ 25x: ~3.2% tài khoản làm ký quỹ; xấp xỉ thanh lý 0.501872.
⚠️
Với 25x, giá thanh lý chạm trước stop của bạn - giữ đòn bẩy ≤ 15x cho stop này.
ℹ️
Nội dung mang tính giáo dục - hãy tự xác nhận trước khi hành động.
{spot}(REUSDT)
📊
$RE - 1h (Binance)
➡️
Xu hướng: đi ngang / chuyển tiếp, không có cấu trúc hướng rõ ràng
⚡
Đà: đang ở vùng quá mua (RSI 82.2)
🏷️
Giá: 0.4734
🔴
Kháng cự: 0.4954 (pool thanh khoản)
🟢
Hỗ trợ: 0.4702 (pool thanh khoản), 0.4558 (gap giá trị hợp lý), 0.4255 (gap giá trị hợp lý), 0.4081 (gap giá trị hợp lý)
🟢
KỊCH BẢN LONG: Chờ nhịp điều chỉnh về 0.4697-0.4716 (pool thanh khoản) kèm tín hiệu đảo chiều tăng trước khi vào lệnh. Xác nhận cần tìm: nến engulfing tăng, nến búa, hoặc tín hiệu bị từ chối với bóng dưới dài tại vùng này trên khung 15m-1h; lý tưởng là đồng thời có sự phá vỡ đỉnh swing thấp nhất ở khung thời gian thấp gần nhất (thay đổi cấu trúc) và RSI quay đầu đi lên.
🎯
Mục tiêu: 0.4954, sau đó 0.4829.
🛑
Cắt lỗ: thấp hơn 0.4631.
🔴
KỊCH BẢN SHORT: Chờ sự từ chối gần 0.4939-0.4959 (pool thanh khoản) kèm tín hiệu đảo chiều giảm trước khi vào lệnh. Xác nhận cần tìm: nến engulfing giảm, nến sao băng, hoặc tín hiệu bị từ chối với bóng trên dài tại vùng này trên khung 15m-1h; lý tưởng là đồng thời có sự phá vỡ đáy swing thấp nhất ở khung thời gian thấp gần nhất (thay đổi cấu trúc) và RSI quay đầu đi xuống.
🎯
Mục tiêu: 0.4702, sau đó 0.4558.
🛑
Cắt lỗ: cao hơn 0.5028.
ℹ️
Kiểm tra đa sàn: BINANCE: 0.4734 | xu hướng: đi ngang / chuyển tiếp | RSI: 82.2 OKX: 0.4737 | xu hướng: đi ngang / chuyển tiếp | RSI: 82.9 Chênh lệch giá: 0.072% | Đồng thuận xu hướng: yes
🎯
Thiết lập:
🔴
SHORT - đảo chiều do quá mua tại kháng cự 68/100
🟡🕐
1h: - , 4h:▼, 1d:▼
🎯
Vào lệnh ≈ 0.4849
🛑
Stop 0.503623 (1.5×ATR) · Targets 0.466177 / 0.447454 / 0.428731 (1R/2R/3R)
🧩
Lý do: xu hướng khung thời gian cao hơn (+25), EMA stack (+15), RSI (+10), gần kháng cự (+8), đồng thuận đa khung (+10)
⚖️
Kế hoạch rủi ro (rủi ro 3% tài khoản): Stop cách giá vào lệnh 3.72% → cỡ vị thế ≈ 80.7% tài khoản (spot). Futures @ 25x: ~3.2% tài khoản làm ký quỹ; xấp xỉ thanh lý 0.501872.
⚠️
Với 25x, giá thanh lý chạm trước stop của bạn - giữ đòn bẩy ≤ 15x cho stop này.
ℹ️
Nội dung mang tính giáo dục - hãy tự xác nhận trước khi hành động.
$RE - 1h (Binance)
➡️
Xu hướng: đi ngang / chuyển tiếp, không có cấu trúc hướng rõ ràng
⚡
Đà: đang ở vùng quá mua (RSI 82.2)
🏷️
Giá: 0.4734
🔴
Kháng cự: 0.4954 (pool thanh khoản)
🟢
Hỗ trợ: 0.4702 (pool thanh khoản), 0.4558 (gap giá trị hợp lý), 0.4255 (gap giá trị hợp lý), 0.4081 (gap giá trị hợp lý)
🟢
KỊCH BẢN LONG: Chờ nhịp điều chỉnh về 0.4697-0.4716 (pool thanh khoản) kèm tín hiệu đảo chiều tăng trước khi vào lệnh. Xác nhận cần tìm: nến engulfing tăng, nến búa, hoặc tín hiệu bị từ chối với bóng dưới dài tại vùng này trên khung 15m-1h; lý tưởng là đồng thời có sự phá vỡ đỉnh swing thấp nhất ở khung thời gian thấp gần nhất (thay đổi cấu trúc) và RSI quay đầu đi lên.
🎯
Mục tiêu: 0.4954, sau đó 0.4829.
🛑
Cắt lỗ: thấp hơn 0.4631.
🔴
KỊCH BẢN SHORT: Chờ sự từ chối gần 0.4939-0.4959 (pool thanh khoản) kèm tín hiệu đảo chiều giảm trước khi vào lệnh. Xác nhận cần tìm: nến engulfing giảm, nến sao băng, hoặc tín hiệu bị từ chối với bóng trên dài tại vùng này trên khung 15m-1h; lý tưởng là đồng thời có sự phá vỡ đáy swing thấp nhất ở khung thời gian thấp gần nhất (thay đổi cấu trúc) và RSI quay đầu đi xuống.
🎯
Mục tiêu: 0.4702, sau đó 0.4558.
🛑
Cắt lỗ: cao hơn 0.5028.
ℹ️
Kiểm tra đa sàn: BINANCE: 0.4734 | xu hướng: đi ngang / chuyển tiếp | RSI: 82.2 OKX: 0.4737 | xu hướng: đi ngang / chuyển tiếp | RSI: 82.9 Chênh lệch giá: 0.072% | Đồng thuận xu hướng: yes
🎯
Thiết lập:
🔴
SHORT - đảo chiều do quá mua tại kháng cự 68/100
🟡🕐
1h: - , 4h:▼, 1d:▼
🎯
Vào lệnh ≈ 0.4849
🛑
Stop 0.503623 (1.5×ATR) · Targets 0.466177 / 0.447454 / 0.428731 (1R/2R/3R)
🧩
Lý do: xu hướng khung thời gian cao hơn (+25), EMA stack (+15), RSI (+10), gần kháng cự (+8), đồng thuận đa khung (+10)
⚖️
Kế hoạch rủi ro (rủi ro 3% tài khoản): Stop cách giá vào lệnh 3.72% → cỡ vị thế ≈ 80.7% tài khoản (spot). Futures @ 25x: ~3.2% tài khoản làm ký quỹ; xấp xỉ thanh lý 0.501872.
⚠️
Với 25x, giá thanh lý chạm trước stop của bạn - giữ đòn bẩy ≤ 15x cho stop này.
ℹ️
Nội dung mang tính giáo dục - hãy tự xác nhận trước khi hành động.
1
120
·
--
Bài viết
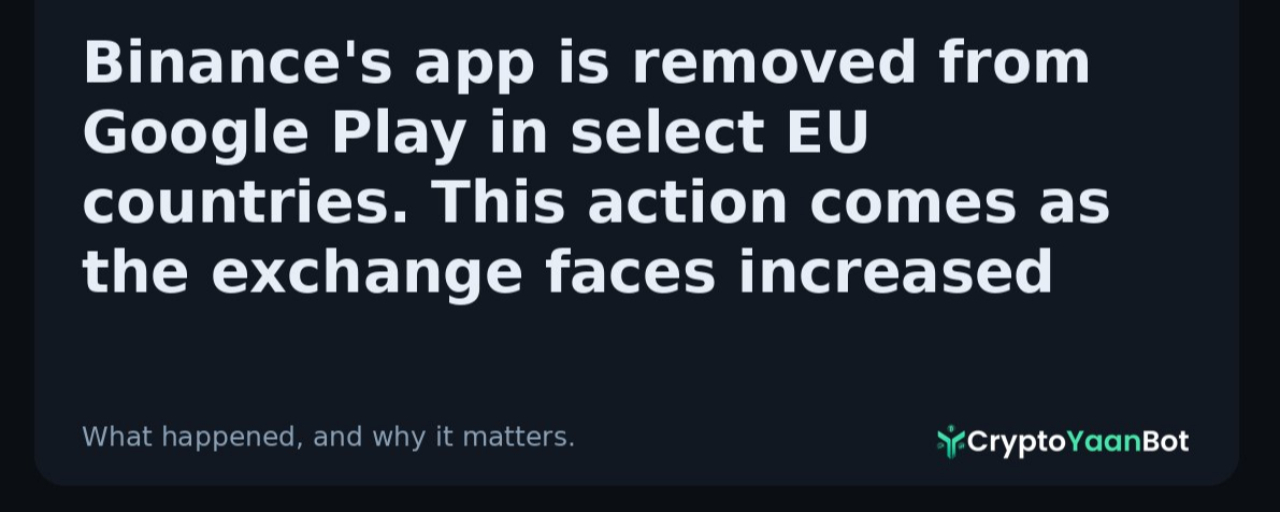
Tin nhanh: Ứng dụng Binance bị gỡ khỏi Google Play ở một số nơi tại châu Âu giữa áp lực tuân thủ MiCAỨng dụng Android của Binance đã biến mất khỏi Cửa hàng Google Play ở một số thị trường thuộc Liên minh châu Âu, đánh dấu thách thức mới nhất đối với sàn giao dịch tiền mã hóa lớn nhất thế giới khi họ đang trong quá trình thích nghi với khuôn khổ quản lý mới của khối. Mặc dù ứng dụng vẫn còn sẵn ở một số khu vực pháp lý và thông qua các kênh phân phối thay thế, việc không còn trên Google Play đã làm dấy lên những câu hỏi mới về mức độ tuân thủ quy định của Binance và bức tranh đang thay đổi đối với các nền tảng tiền mã hóa hoạt động tại châu Âu.
Việc gỡ bỏ diễn ra ngay sau khi Liên minh châu Âu chính thức triển khai đầy đủ quy định về Thị trường trong Tài sản Crypto (MiCA), một khuôn khổ mang tính bước ngoặt nhằm thiết lập các quy tắc nhất quán cho các nhà cung cấp dịch vụ tài sản crypto trên toàn bộ các quốc gia thành viên EU. Theo MiCA, các sàn giao dịch muốn hoạt động trên toàn khối phải xin giấy ủy quyền với tư cách là Nhà cung cấp dịch vụ tài sản crypto (CASP) từ cơ quan quản lý quốc gia, từ đó cho phép họ “passport” (cấp phép/ủy quyền liên thông) dịch vụ của mình trên toàn EU.
Tin nhanh: Ứng dụng Binance bị gỡ khỏi Google Play ở một số nơi tại châu Âu giữa áp lực tuân thủ MiCA
Ứng dụng Android của Binance đã biến mất khỏi Cửa hàng Google Play ở một số thị trường thuộc Liên minh châu Âu, đánh dấu thách thức mới nhất đối với sàn giao dịch tiền mã hóa lớn nhất thế giới khi họ đang trong quá trình thích nghi với khuôn khổ quản lý mới của khối. Mặc dù ứng dụng vẫn còn sẵn ở một số khu vực pháp lý và thông qua các kênh phân phối thay thế, việc không còn trên Google Play đã làm dấy lên những câu hỏi mới về mức độ tuân thủ quy định của Binance và bức tranh đang thay đổi đối với các nền tảng tiền mã hóa hoạt động tại châu Âu.
Việc gỡ bỏ diễn ra ngay sau khi Liên minh châu Âu chính thức triển khai đầy đủ quy định về Thị trường trong Tài sản Crypto (MiCA), một khuôn khổ mang tính bước ngoặt nhằm thiết lập các quy tắc nhất quán cho các nhà cung cấp dịch vụ tài sản crypto trên toàn bộ các quốc gia thành viên EU. Theo MiCA, các sàn giao dịch muốn hoạt động trên toàn khối phải xin giấy ủy quyền với tư cách là Nhà cung cấp dịch vụ tài sản crypto (CASP) từ cơ quan quản lý quốc gia, từ đó cho phép họ “passport” (cấp phép/ủy quyền liên thông) dịch vụ của mình trên toàn EU.
Việc gỡ bỏ diễn ra ngay sau khi Liên minh châu Âu chính thức triển khai đầy đủ quy định về Thị trường trong Tài sản Crypto (MiCA), một khuôn khổ mang tính bước ngoặt nhằm thiết lập các quy tắc nhất quán cho các nhà cung cấp dịch vụ tài sản crypto trên toàn bộ các quốc gia thành viên EU. Theo MiCA, các sàn giao dịch muốn hoạt động trên toàn khối phải xin giấy ủy quyền với tư cách là Nhà cung cấp dịch vụ tài sản crypto (CASP) từ cơ quan quản lý quốc gia, từ đó cho phép họ “passport” (cấp phép/ủy quyền liên thông) dịch vụ của mình trên toàn EU.
1
7
·
--

Bài viết
Cấu trúc thị trường ngày FOMC: Điều mà Bitcoin 63K USD, lợi suất đang rút lui và xác suất tăng lãi suất 38% đang mách bảoQuyết định của Cục Dự trữ Liên bang (Fed) hôm nay là kiểu sự kiện thưởng cho những nhà giao dịch đọc cấu trúc và trừng phạt những nhà giao dịch giao dịch theo ý kiến. Hãy cùng xem dữ liệu thực sự cho thấy điều gì trước khi công bố.
Bức tranh vĩ mô. Hai tuần trước, thị trường gán xác suất 10,7% cho việc tăng lãi suất tại cuộc họp này. Tính đến ngày 24 tháng 7, con số đó đã tăng lên 38%. Có ba yếu tố thúc đẩy việc định giá lại: giá dầu thô phục hồi do căng thẳng Mỹ–Iran bùng lên khiến lo ngại lạm phát quay trở lại; tân Chủ tịch Fed Kevin Warsh nói thẳng rằng ủy ban “không có dung sai đối với lạm phát cao duy trì dai dẳng”; và biểu đồ chấm (dot plot) tháng 6 cho thấy 9 trong số 18 quan chức đã ghi nhận trước 1 lần tăng lãi suất vào năm 2026. Lãi suất quỹ liên bang (fed funds rate) đã dao động ở mức 3,50–3,75% trong bốn phiên họp liên tiếp. Liệu chuỗi này có kết thúc vào hôm nay hay không là một câu hỏi bỏ ngỏ thực sự—điều khá hiếm đối với một cuộc họp FOMC trong giai đoạn này.
Cấu trúc thị trường ngày FOMC: Điều mà Bitcoin 63K USD, lợi suất đang rút lui và xác suất tăng lãi suất 38% đang mách bảo
Quyết định của Cục Dự trữ Liên bang (Fed) hôm nay là kiểu sự kiện thưởng cho những nhà giao dịch đọc cấu trúc và trừng phạt những nhà giao dịch giao dịch theo ý kiến. Hãy cùng xem dữ liệu thực sự cho thấy điều gì trước khi công bố.
Bức tranh vĩ mô. Hai tuần trước, thị trường gán xác suất 10,7% cho việc tăng lãi suất tại cuộc họp này. Tính đến ngày 24 tháng 7, con số đó đã tăng lên 38%. Có ba yếu tố thúc đẩy việc định giá lại: giá dầu thô phục hồi do căng thẳng Mỹ–Iran bùng lên khiến lo ngại lạm phát quay trở lại; tân Chủ tịch Fed Kevin Warsh nói thẳng rằng ủy ban “không có dung sai đối với lạm phát cao duy trì dai dẳng”; và biểu đồ chấm (dot plot) tháng 6 cho thấy 9 trong số 18 quan chức đã ghi nhận trước 1 lần tăng lãi suất vào năm 2026. Lãi suất quỹ liên bang (fed funds rate) đã dao động ở mức 3,50–3,75% trong bốn phiên họp liên tiếp. Liệu chuỗi này có kết thúc vào hôm nay hay không là một câu hỏi bỏ ngỏ thực sự—điều khá hiếm đối với một cuộc họp FOMC trong giai đoạn này.
Bức tranh vĩ mô. Hai tuần trước, thị trường gán xác suất 10,7% cho việc tăng lãi suất tại cuộc họp này. Tính đến ngày 24 tháng 7, con số đó đã tăng lên 38%. Có ba yếu tố thúc đẩy việc định giá lại: giá dầu thô phục hồi do căng thẳng Mỹ–Iran bùng lên khiến lo ngại lạm phát quay trở lại; tân Chủ tịch Fed Kevin Warsh nói thẳng rằng ủy ban “không có dung sai đối với lạm phát cao duy trì dai dẳng”; và biểu đồ chấm (dot plot) tháng 6 cho thấy 9 trong số 18 quan chức đã ghi nhận trước 1 lần tăng lãi suất vào năm 2026. Lãi suất quỹ liên bang (fed funds rate) đã dao động ở mức 3,50–3,75% trong bốn phiên họp liên tiếp. Liệu chuỗi này có kết thúc vào hôm nay hay không là một câu hỏi bỏ ngỏ thực sự—điều khá hiếm đối với một cuộc họp FOMC trong giai đoạn này.
1
57
·
--
Tăng giá
#bnbsmartchaintoundergohardfork
Hard Fork sắp tới trên BNB Smart Chain là một bước tiến lớn khác nhằm nâng cao hiệu suất mạng, khả năng mở rộng và trải nghiệm tổng thể dành cho nhà phát triển cũng như người dùng.
⚡ Thực thi nhanh hơn
🔒 Độ tin cậy mạng mạnh mẽ hơn
🌐 Hạ tầng tốt hơn cho các ứng dụng DeFi, GameFi, AI và Web3
Mọi lần nâng cấp mạng thành công đều củng cố hệ sinh thái và tạo ra những cơ hội mới cho cả nhà xây dựng, nhà đầu tư và người dùng. Đổi mới không bao giờ dừng lại trên BNB Smart Chain, và hard fork này thể hiện cam kết của đội ngũ đối với việc liên tục cải tiến. Các nâng cấp hard fork gần đây tập trung vào việc giảm thời gian tạo khối và cải thiện hiệu quả thực thi để hỗ trợ các ứng dụng on-chain phản hồi nhanh hơn.
#BNBChain #BNB #Blockchain #Web3
{future}(BNBUSDT)
#bnbsmartchaintoundergohardfork
Hard Fork sắp tới trên BNB Smart Chain là một bước tiến lớn khác nhằm nâng cao hiệu suất mạng, khả năng mở rộng và trải nghiệm tổng thể dành cho nhà phát triển cũng như người dùng.
⚡ Thực thi nhanh hơn
🔒 Độ tin cậy mạng mạnh mẽ hơn
🌐 Hạ tầng tốt hơn cho các ứng dụng DeFi, GameFi, AI và Web3
Mọi lần nâng cấp mạng thành công đều củng cố hệ sinh thái và tạo ra những cơ hội mới cho cả nhà xây dựng, nhà đầu tư và người dùng. Đổi mới không bao giờ dừng lại trên BNB Smart Chain, và hard fork này thể hiện cam kết của đội ngũ đối với việc liên tục cải tiến. Các nâng cấp hard fork gần đây tập trung vào việc giảm thời gian tạo khối và cải thiện hiệu quả thực thi để hỗ trợ các ứng dụng on-chain phản hồi nhanh hơn.
#BNBChain #BNB #Blockchain #Web3
Hard Fork sắp tới trên BNB Smart Chain là một bước tiến lớn khác nhằm nâng cao hiệu suất mạng, khả năng mở rộng và trải nghiệm tổng thể dành cho nhà phát triển cũng như người dùng.
⚡ Thực thi nhanh hơn
🔒 Độ tin cậy mạng mạnh mẽ hơn
🌐 Hạ tầng tốt hơn cho các ứng dụng DeFi, GameFi, AI và Web3
Mọi lần nâng cấp mạng thành công đều củng cố hệ sinh thái và tạo ra những cơ hội mới cho cả nhà xây dựng, nhà đầu tư và người dùng. Đổi mới không bao giờ dừng lại trên BNB Smart Chain, và hard fork này thể hiện cam kết của đội ngũ đối với việc liên tục cải tiến. Các nâng cấp hard fork gần đây tập trung vào việc giảm thời gian tạo khối và cải thiện hiệu quả thực thi để hỗ trợ các ứng dụng on-chain phản hồi nhanh hơn.
#BNBChain #BNB #Blockchain #Web3
1
2
136
·
--
Ngày ra quyết định của Fed, và thị trường không coi đó là một thủ tục. Xác suất tăng lãi suất đã tăng từ 10,7% vào ngày 15/7 lên 38% vào ngày 24/7. Việc định giá lại đó là lý do #USTreasuryYieldsRetreat xuất hiện trên màn hình của ai cũng hôm nay: trái phiếu phản ứng trước, crypto phản ứng sau.
Bức tranh hiện tại: $BTC đang giữ ở mức cao hơn “bậc kệ” 63K là 63,8K, $ETH bị kẹt khi thử nghiệm vùng 1.900–1.950, Chỉ số Fear and Greed ở mức 28. Tiền đang lẩn trong các đồng major, đúng như cuộc #BitcoinDominanceRisesTo59% đang diễn ra theo thời gian thực. Nỗi sợ cộng với vị thế phòng thủ đồng nghĩa sẽ có “nhiên liệu co bóp” nếu Fed giữ với ngôn từ mềm, và một bài kiểm tra cứng mức 63K nếu Warsh gây bất ngờ với một đợt tăng lãi suất.
Lên kế hoạch cho kịch bản, không phải dự đoán: xác định bạn sẽ làm gì nếu $63K được giữ, và bạn sẽ làm gì nếu nó bị phá vỡ kèm khối lượng. Quy mô biến động sẽ tăng gấp ba, vì trong các ngày FOMC nó thường xảy ra như vậy.
Sau phần họp báo, $BTC sẽ thoát ra khỏi biên này theo hướng nào: kiểm tra lại $62K hay đẩy lên $66K?
#USTreasuryYieldsRetreat #BitcoinDominanceRisesTo59% #BTC #FOMC #CryptoTrading
{spot}(BTCUSDT)
{spot}(ETHUSDT)
Không phải lời khuyên tài chính.
Ngày ra quyết định của Fed, và thị trường không coi đó là một thủ tục. Xác suất tăng lãi suất đã tăng từ 10,7% vào ngày 15/7 lên 38% vào ngày 24/7. Việc định giá lại đó là lý do #USTreasuryYieldsRetreat xuất hiện trên màn hình của ai cũng hôm nay: trái phiếu phản ứng trước, crypto phản ứng sau.
Bức tranh hiện tại: $BTC đang giữ ở mức cao hơn “bậc kệ” 63K là 63,8K, $ETH bị kẹt khi thử nghiệm vùng 1.900–1.950, Chỉ số Fear and Greed ở mức 28. Tiền đang lẩn trong các đồng major, đúng như cuộc #BitcoinDominanceRisesTo59% đang diễn ra theo thời gian thực. Nỗi sợ cộng với vị thế phòng thủ đồng nghĩa sẽ có “nhiên liệu co bóp” nếu Fed giữ với ngôn từ mềm, và một bài kiểm tra cứng mức 63K nếu Warsh gây bất ngờ với một đợt tăng lãi suất.
Lên kế hoạch cho kịch bản, không phải dự đoán: xác định bạn sẽ làm gì nếu $63K được giữ, và bạn sẽ làm gì nếu nó bị phá vỡ kèm khối lượng. Quy mô biến động sẽ tăng gấp ba, vì trong các ngày FOMC nó thường xảy ra như vậy.
Sau phần họp báo, $BTC sẽ thoát ra khỏi biên này theo hướng nào: kiểm tra lại $62K hay đẩy lên $66K?
#USTreasuryYieldsRetreat #BitcoinDominanceRisesTo59% #BTC #FOMC #CryptoTrading
Không phải lời khuyên tài chính.
Bức tranh hiện tại: $BTC đang giữ ở mức cao hơn “bậc kệ” 63K là 63,8K, $ETH bị kẹt khi thử nghiệm vùng 1.900–1.950, Chỉ số Fear and Greed ở mức 28. Tiền đang lẩn trong các đồng major, đúng như cuộc #BitcoinDominanceRisesTo59% đang diễn ra theo thời gian thực. Nỗi sợ cộng với vị thế phòng thủ đồng nghĩa sẽ có “nhiên liệu co bóp” nếu Fed giữ với ngôn từ mềm, và một bài kiểm tra cứng mức 63K nếu Warsh gây bất ngờ với một đợt tăng lãi suất.
Lên kế hoạch cho kịch bản, không phải dự đoán: xác định bạn sẽ làm gì nếu $63K được giữ, và bạn sẽ làm gì nếu nó bị phá vỡ kèm khối lượng. Quy mô biến động sẽ tăng gấp ba, vì trong các ngày FOMC nó thường xảy ra như vậy.
Sau phần họp báo, $BTC sẽ thoát ra khỏi biên này theo hướng nào: kiểm tra lại $62K hay đẩy lên $66K?
#USTreasuryYieldsRetreat #BitcoinDominanceRisesTo59% #BTC #FOMC #CryptoTrading
Không phải lời khuyên tài chính.
1
57
·
--
Tăng giá
📊
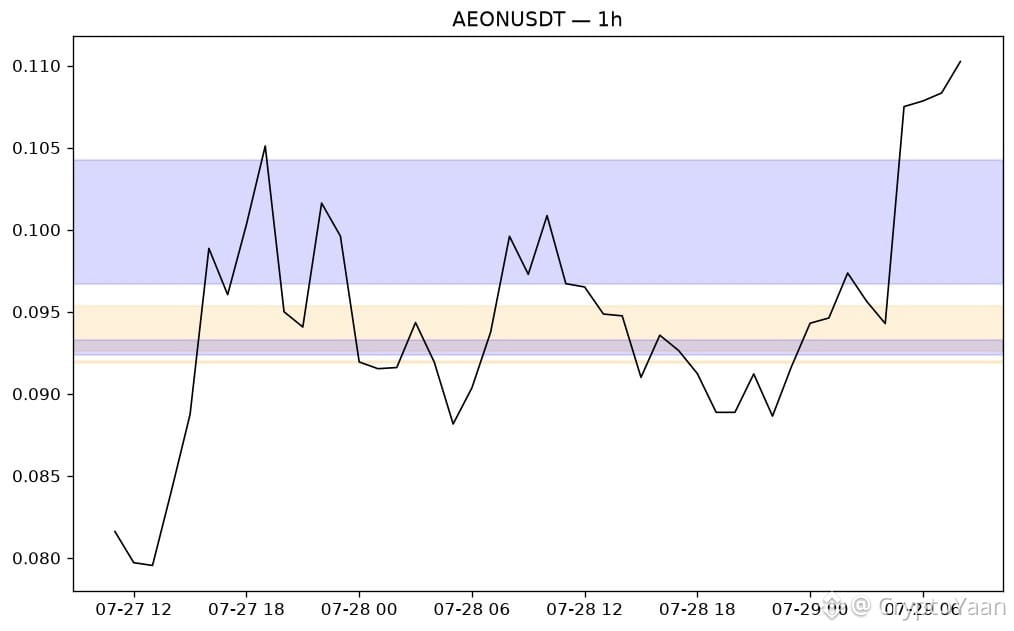
$AEON - 1h
📈
Xu hướng: tăng, hình thành các đỉnh cao hơn và đáy cao hơn
⚡
Động lượng: đang ở vùng quá mua (RSI 77.1)
🏷️
Giá: 0.1103
🔴
Kháng cự: không xác định rõ trong phạm vi gần đây
🟢
Hỗ trợ: 0.1005 (khoảng trống giá trị hợp lý), 0.0928 (khoảng trống giá trị hợp lý)
🟢
Thiết lập LONG: Chờ điều chỉnh về 0.1004-0.1008 (khoảng trống giá trị hợp lý) kèm tín hiệu đảo chiều tăng trước khi vào lệnh. Xác nhận cần tìm: nến engulfing tăng, nến búa, hoặc tín hiệu bị từ chối với bóng dưới dài tại vùng này trên khung 15m-1h; lý tưởng là đồng thời với việc phá vỡ đỉnh swing khung thời gian thấp gần nhất (thay đổi cấu trúc) và RSI quay đầu đi lên.
🎯
Mục tiêu: 0.1114, rồi 0.1125.
🛑
Cắt lỗ: dưới 0.0990.
🔴
Thiết lập SHORT: Hiện tại không xác định được vùng cung (supply) lân cận rõ ràng để vào lệnh short.
ℹ️
Chỉ mang tính giáo dục - không phải lời khuyên tài chính. Luôn tự quản lý rủi ro của bạn. Đối chiếu đa sàn: OKX: 0.1103 | xu hướng: tăng (HH/HL) | RSI: 77.2 | biên độ giá giữa các sàn: 0.0% | sự đồng thuận xu hướng: có
⏸️
Hiện chưa có thiết lập rõ ràng (điểm tốt nhất 38/100). Tốt hơn là chờ giá chạm một mức hoặc chờ động lượng xác nhận thay vì ép vào một lệnh.
📊
$AEON - 1h
📈
Xu hướng: tăng, hình thành các đỉnh cao hơn và đáy cao hơn
⚡
Động lượng: đang ở vùng quá mua (RSI 77.1)
🏷️
Giá: 0.1103
🔴
Kháng cự: không xác định rõ trong phạm vi gần đây
🟢
Hỗ trợ: 0.1005 (khoảng trống giá trị hợp lý), 0.0928 (khoảng trống giá trị hợp lý)
🟢
Thiết lập LONG: Chờ điều chỉnh về 0.1004-0.1008 (khoảng trống giá trị hợp lý) kèm tín hiệu đảo chiều tăng trước khi vào lệnh. Xác nhận cần tìm: nến engulfing tăng, nến búa, hoặc tín hiệu bị từ chối với bóng dưới dài tại vùng này trên khung 15m-1h; lý tưởng là đồng thời với việc phá vỡ đỉnh swing khung thời gian thấp gần nhất (thay đổi cấu trúc) và RSI quay đầu đi lên.
🎯
Mục tiêu: 0.1114, rồi 0.1125.
🛑
Cắt lỗ: dưới 0.0990.
🔴
Thiết lập SHORT: Hiện tại không xác định được vùng cung (supply) lân cận rõ ràng để vào lệnh short.
ℹ️
Chỉ mang tính giáo dục - không phải lời khuyên tài chính. Luôn tự quản lý rủi ro của bạn. Đối chiếu đa sàn: OKX: 0.1103 | xu hướng: tăng (HH/HL) | RSI: 77.2 | biên độ giá giữa các sàn: 0.0% | sự đồng thuận xu hướng: có
⏸️
Hiện chưa có thiết lập rõ ràng (điểm tốt nhất 38/100). Tốt hơn là chờ giá chạm một mức hoặc chờ động lượng xác nhận thay vì ép vào một lệnh.
$AEON - 1h
📈
Xu hướng: tăng, hình thành các đỉnh cao hơn và đáy cao hơn
⚡
Động lượng: đang ở vùng quá mua (RSI 77.1)
🏷️
Giá: 0.1103
🔴
Kháng cự: không xác định rõ trong phạm vi gần đây
🟢
Hỗ trợ: 0.1005 (khoảng trống giá trị hợp lý), 0.0928 (khoảng trống giá trị hợp lý)
🟢
Thiết lập LONG: Chờ điều chỉnh về 0.1004-0.1008 (khoảng trống giá trị hợp lý) kèm tín hiệu đảo chiều tăng trước khi vào lệnh. Xác nhận cần tìm: nến engulfing tăng, nến búa, hoặc tín hiệu bị từ chối với bóng dưới dài tại vùng này trên khung 15m-1h; lý tưởng là đồng thời với việc phá vỡ đỉnh swing khung thời gian thấp gần nhất (thay đổi cấu trúc) và RSI quay đầu đi lên.
🎯
Mục tiêu: 0.1114, rồi 0.1125.
🛑
Cắt lỗ: dưới 0.0990.
🔴
Thiết lập SHORT: Hiện tại không xác định được vùng cung (supply) lân cận rõ ràng để vào lệnh short.
ℹ️
Chỉ mang tính giáo dục - không phải lời khuyên tài chính. Luôn tự quản lý rủi ro của bạn. Đối chiếu đa sàn: OKX: 0.1103 | xu hướng: tăng (HH/HL) | RSI: 77.2 | biên độ giá giữa các sàn: 0.0% | sự đồng thuận xu hướng: có
⏸️
Hiện chưa có thiết lập rõ ràng (điểm tốt nhất 38/100). Tốt hơn là chờ giá chạm một mức hoặc chờ động lượng xác nhận thay vì ép vào một lệnh.
1
33
·
--
Tăng giá
📊
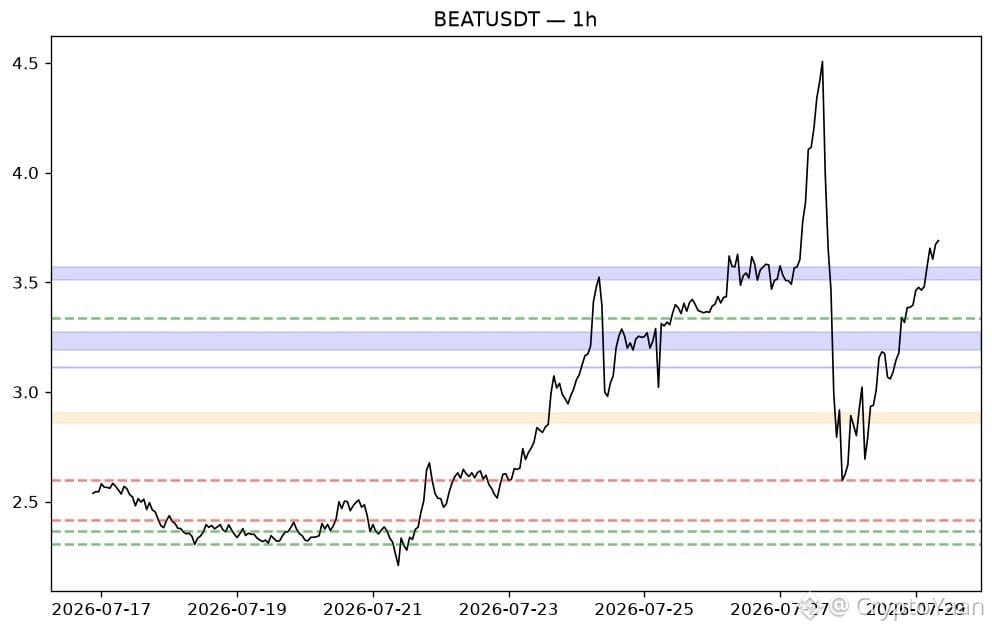
$BEAT - 1h
📈
Xu hướng: tăng, hình thành các đỉnh cao hơn và đáy cao hơn
⚡
Động lượng: đang ở vùng quá mua (RSI 87.5)
🏷️
Giá: 3.6898
🔴
Kháng cự: chưa xác định rõ trong phạm vi gần đây
🟢
Hỗ trợ: 3.5402 (khoảng trống giá trị hợp lý), 3.3351 (bể thanh khoản), 3.2321 (khoảng trống giá trị hợp lý), 3.1120 (khoảng trống giá trị hợp lý)
🟢
KỊCH BẢN LONG Chờ nhịp điều chỉnh về 3.5366-3.5508 (khoảng trống giá trị hợp lý) kèm tín hiệu đảo chiều tăng trước khi vào lệnh. Các tín hiệu cần tìm để xác nhận: nến nhấn chìm tăng (bullish engulfing), nến búa (hammer) hoặc sự từ chối bằng râu dưới dài tại vùng này trên biểu đồ khung 15m-1h, lý tưởng là cùng với việc phá vỡ đỉnh swing gần nhất ở khung thời gian thấp hơn (thay đổi cấu trúc) và RSI quay đầu đi lên.
🎯
Mục tiêu: 3.7267, sau đó 3.7636.
🛑
Cắt lỗ: dưới 3.4871.
🔴
KỊCH BẢN SHORT Chưa xác định được vùng cung (supply) rõ ràng ở gần để vào lệnh short ngay lúc này.
ℹ️
Chỉ mang tính giáo dục - không phải lời khuyên tài chính. Luôn tự quản lý rủi ro của bạn. Kiểm tra đa sàn: (cặp này chỉ có sẵn trên một nền tảng)
⏸️
Hiện chưa có thiết lập sạch (điểm tốt nhất 50/100). Tốt hơn là chờ giá chạm tới một mức hoặc chờ động lượng xác nhận trước khi ép vào giao dịch.
📊
$BEAT - 1h
📈
Xu hướng: tăng, hình thành các đỉnh cao hơn và đáy cao hơn
⚡
Động lượng: đang ở vùng quá mua (RSI 87.5)
🏷️
Giá: 3.6898
🔴
Kháng cự: chưa xác định rõ trong phạm vi gần đây
🟢
Hỗ trợ: 3.5402 (khoảng trống giá trị hợp lý), 3.3351 (bể thanh khoản), 3.2321 (khoảng trống giá trị hợp lý), 3.1120 (khoảng trống giá trị hợp lý)
🟢
KỊCH BẢN LONG Chờ nhịp điều chỉnh về 3.5366-3.5508 (khoảng trống giá trị hợp lý) kèm tín hiệu đảo chiều tăng trước khi vào lệnh. Các tín hiệu cần tìm để xác nhận: nến nhấn chìm tăng (bullish engulfing), nến búa (hammer) hoặc sự từ chối bằng râu dưới dài tại vùng này trên biểu đồ khung 15m-1h, lý tưởng là cùng với việc phá vỡ đỉnh swing gần nhất ở khung thời gian thấp hơn (thay đổi cấu trúc) và RSI quay đầu đi lên.
🎯
Mục tiêu: 3.7267, sau đó 3.7636.
🛑
Cắt lỗ: dưới 3.4871.
🔴
KỊCH BẢN SHORT Chưa xác định được vùng cung (supply) rõ ràng ở gần để vào lệnh short ngay lúc này.
ℹ️
Chỉ mang tính giáo dục - không phải lời khuyên tài chính. Luôn tự quản lý rủi ro của bạn. Kiểm tra đa sàn: (cặp này chỉ có sẵn trên một nền tảng)
⏸️
Hiện chưa có thiết lập sạch (điểm tốt nhất 50/100). Tốt hơn là chờ giá chạm tới một mức hoặc chờ động lượng xác nhận trước khi ép vào giao dịch.
$BEAT - 1h
📈
Xu hướng: tăng, hình thành các đỉnh cao hơn và đáy cao hơn
⚡
Động lượng: đang ở vùng quá mua (RSI 87.5)
🏷️
Giá: 3.6898
🔴
Kháng cự: chưa xác định rõ trong phạm vi gần đây
🟢
Hỗ trợ: 3.5402 (khoảng trống giá trị hợp lý), 3.3351 (bể thanh khoản), 3.2321 (khoảng trống giá trị hợp lý), 3.1120 (khoảng trống giá trị hợp lý)
🟢
KỊCH BẢN LONG Chờ nhịp điều chỉnh về 3.5366-3.5508 (khoảng trống giá trị hợp lý) kèm tín hiệu đảo chiều tăng trước khi vào lệnh. Các tín hiệu cần tìm để xác nhận: nến nhấn chìm tăng (bullish engulfing), nến búa (hammer) hoặc sự từ chối bằng râu dưới dài tại vùng này trên biểu đồ khung 15m-1h, lý tưởng là cùng với việc phá vỡ đỉnh swing gần nhất ở khung thời gian thấp hơn (thay đổi cấu trúc) và RSI quay đầu đi lên.
🎯
Mục tiêu: 3.7267, sau đó 3.7636.
🛑
Cắt lỗ: dưới 3.4871.
🔴
KỊCH BẢN SHORT Chưa xác định được vùng cung (supply) rõ ràng ở gần để vào lệnh short ngay lúc này.
ℹ️
Chỉ mang tính giáo dục - không phải lời khuyên tài chính. Luôn tự quản lý rủi ro của bạn. Kiểm tra đa sàn: (cặp này chỉ có sẵn trên một nền tảng)
⏸️
Hiện chưa có thiết lập sạch (điểm tốt nhất 50/100). Tốt hơn là chờ giá chạm tới một mức hoặc chờ động lượng xác nhận trước khi ép vào giao dịch.
1
72
·
--
📊
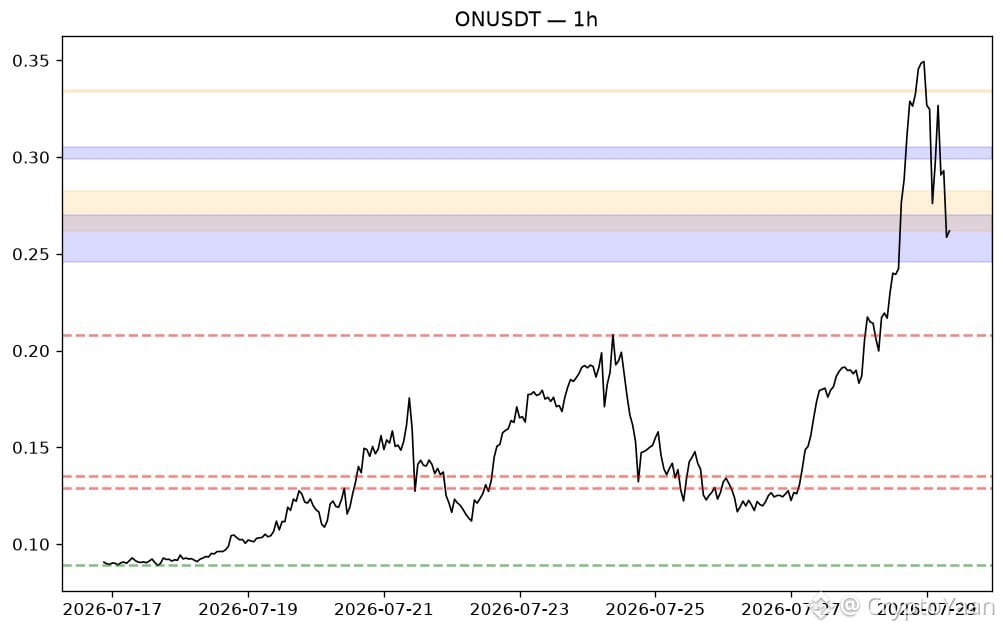
$ON - 1h
➡️
Xu hướng: đi ngang / chuyển tiếp, không có cấu trúc định hướng rõ ràng
⚡
Động lượng: nghiêng giảm (RSI 35.1)
🏷️
Giá: 0.2619
🔴
Kháng cự: 0.2721 (fair value gap), 0.3342 (fair value gap)
🟢
Hỗ trợ: 0.2580 (fair value gap), 0.0890 (liquidity pool)
🟢
Thiết lập MUA (LONG): Chờ nhịp điều chỉnh về 0.2577-0.2587 (fair value gap) cùng tín hiệu đảo chiều tăng trước khi vào lệnh. Tín hiệu cần tìm: nến engulfing tăng, hammer, hoặc bị từ chối mạnh bởi bóng dưới dài tại vùng này trên biểu đồ 15m-1h; lý tưởng là đồng thời có sự phá vỡ đỉnh swing gần nhất ở khung thời gian thấp hơn (thay đổi cấu trúc) và RSI quay đầu đi lên.
🎯
Mục tiêu: 0.2721, sau đó 0.3342.
🛑
Cắt lỗ: dưới 0.2541.
🔴
Thiết lập BÁN (SHORT): Chờ tín hiệu bị từ chối gần 0.2713-0.2724 (fair value gap) kèm tín hiệu đảo chiều giảm trước khi vào lệnh. Tín hiệu cần tìm: nến engulfing giảm, shooting star, hoặc bị từ chối mạnh bởi bóng trên dài tại vùng này trên biểu đồ 15m-1h; lý tưởng là đồng thời có sự phá vỡ đáy swing gần nhất ở khung thời gian thấp hơn (thay đổi cấu trúc) và RSI quay đầu đi xuống.
🎯
Mục tiêu: 0.2580, sau đó 0.0890.
🛑
Cắt lỗ: trên 0.2762.
ℹ️
Chỉ mang tính giáo dục - không phải lời khuyên tài chính. Luôn tự quản lý rủi ro của bạn. Kiểm tra đa sàn: (cặp này chỉ có sẵn trên một nền tảng)
🎯
Thiết lập:
🟢
LONG - pullback theo xu hướng (long) 61/100
⚪🕐
1h: - , 4h: - , 1d:▲
🎯
Vào lệnh ≈ 0.25796 ·
🛑
Cắt lỗ 0.211563 (1.5×ATR) · Mục tiêu 0.304357 / 0.350755 / 0.397152 (1R/2R/3R)
🧩
Lý do: xu hướng khung lớn (+12), EMA xếp chồng (+15), RSI (+6), gần vùng hỗ trợ (+18), sự đồng thuận đa khung thời gian (+5), nằm trên VWAP (+5)
⚖️
Kế hoạch rủi ro (rủi ro tài khoản 3%): Cắt lỗ cách giá vào lệnh 21.93% → quy mô vị thế ≈ 13.7% tài khoản (spot). Futures @ 25x: ~0.5% tài khoản làm ký quỹ; xấp xỉ thanh lý tại 0.248931.
⚠️
Ở mức 25x thì chạm thanh lý trước khi chạm cắt lỗ - giữ đòn bẩy ≤ 3x cho cắt lỗ này.
ℹ️
Nội dung chỉ mang tính giáo dục - hãy tự xác nhận trước khi hành động.
📊
$ON - 1h
➡️
Xu hướng: đi ngang / chuyển tiếp, không có cấu trúc định hướng rõ ràng
⚡
Động lượng: nghiêng giảm (RSI 35.1)
🏷️
Giá: 0.2619
🔴
Kháng cự: 0.2721 (fair value gap), 0.3342 (fair value gap)
🟢
Hỗ trợ: 0.2580 (fair value gap), 0.0890 (liquidity pool)
🟢
Thiết lập MUA (LONG): Chờ nhịp điều chỉnh về 0.2577-0.2587 (fair value gap) cùng tín hiệu đảo chiều tăng trước khi vào lệnh. Tín hiệu cần tìm: nến engulfing tăng, hammer, hoặc bị từ chối mạnh bởi bóng dưới dài tại vùng này trên biểu đồ 15m-1h; lý tưởng là đồng thời có sự phá vỡ đỉnh swing gần nhất ở khung thời gian thấp hơn (thay đổi cấu trúc) và RSI quay đầu đi lên.
🎯
Mục tiêu: 0.2721, sau đó 0.3342.
🛑
Cắt lỗ: dưới 0.2541.
🔴
Thiết lập BÁN (SHORT): Chờ tín hiệu bị từ chối gần 0.2713-0.2724 (fair value gap) kèm tín hiệu đảo chiều giảm trước khi vào lệnh. Tín hiệu cần tìm: nến engulfing giảm, shooting star, hoặc bị từ chối mạnh bởi bóng trên dài tại vùng này trên biểu đồ 15m-1h; lý tưởng là đồng thời có sự phá vỡ đáy swing gần nhất ở khung thời gian thấp hơn (thay đổi cấu trúc) và RSI quay đầu đi xuống.
🎯
Mục tiêu: 0.2580, sau đó 0.0890.
🛑
Cắt lỗ: trên 0.2762.
ℹ️
Chỉ mang tính giáo dục - không phải lời khuyên tài chính. Luôn tự quản lý rủi ro của bạn. Kiểm tra đa sàn: (cặp này chỉ có sẵn trên một nền tảng)
🎯
Thiết lập:
🟢
LONG - pullback theo xu hướng (long) 61/100
⚪🕐
1h: - , 4h: - , 1d:▲
🎯
Vào lệnh ≈ 0.25796 ·
🛑
Cắt lỗ 0.211563 (1.5×ATR) · Mục tiêu 0.304357 / 0.350755 / 0.397152 (1R/2R/3R)
🧩
Lý do: xu hướng khung lớn (+12), EMA xếp chồng (+15), RSI (+6), gần vùng hỗ trợ (+18), sự đồng thuận đa khung thời gian (+5), nằm trên VWAP (+5)
⚖️
Kế hoạch rủi ro (rủi ro tài khoản 3%): Cắt lỗ cách giá vào lệnh 21.93% → quy mô vị thế ≈ 13.7% tài khoản (spot). Futures @ 25x: ~0.5% tài khoản làm ký quỹ; xấp xỉ thanh lý tại 0.248931.
⚠️
Ở mức 25x thì chạm thanh lý trước khi chạm cắt lỗ - giữ đòn bẩy ≤ 3x cho cắt lỗ này.
ℹ️
Nội dung chỉ mang tính giáo dục - hãy tự xác nhận trước khi hành động.
$ON - 1h
➡️
Xu hướng: đi ngang / chuyển tiếp, không có cấu trúc định hướng rõ ràng
⚡
Động lượng: nghiêng giảm (RSI 35.1)
🏷️
Giá: 0.2619
🔴
Kháng cự: 0.2721 (fair value gap), 0.3342 (fair value gap)
🟢
Hỗ trợ: 0.2580 (fair value gap), 0.0890 (liquidity pool)
🟢
Thiết lập MUA (LONG): Chờ nhịp điều chỉnh về 0.2577-0.2587 (fair value gap) cùng tín hiệu đảo chiều tăng trước khi vào lệnh. Tín hiệu cần tìm: nến engulfing tăng, hammer, hoặc bị từ chối mạnh bởi bóng dưới dài tại vùng này trên biểu đồ 15m-1h; lý tưởng là đồng thời có sự phá vỡ đỉnh swing gần nhất ở khung thời gian thấp hơn (thay đổi cấu trúc) và RSI quay đầu đi lên.
🎯
Mục tiêu: 0.2721, sau đó 0.3342.
🛑
Cắt lỗ: dưới 0.2541.
🔴
Thiết lập BÁN (SHORT): Chờ tín hiệu bị từ chối gần 0.2713-0.2724 (fair value gap) kèm tín hiệu đảo chiều giảm trước khi vào lệnh. Tín hiệu cần tìm: nến engulfing giảm, shooting star, hoặc bị từ chối mạnh bởi bóng trên dài tại vùng này trên biểu đồ 15m-1h; lý tưởng là đồng thời có sự phá vỡ đáy swing gần nhất ở khung thời gian thấp hơn (thay đổi cấu trúc) và RSI quay đầu đi xuống.
🎯
Mục tiêu: 0.2580, sau đó 0.0890.
🛑
Cắt lỗ: trên 0.2762.
ℹ️
Chỉ mang tính giáo dục - không phải lời khuyên tài chính. Luôn tự quản lý rủi ro của bạn. Kiểm tra đa sàn: (cặp này chỉ có sẵn trên một nền tảng)
🎯
Thiết lập:
🟢
LONG - pullback theo xu hướng (long) 61/100
⚪🕐
1h: - , 4h: - , 1d:▲
🎯
Vào lệnh ≈ 0.25796 ·
🛑
Cắt lỗ 0.211563 (1.5×ATR) · Mục tiêu 0.304357 / 0.350755 / 0.397152 (1R/2R/3R)
🧩
Lý do: xu hướng khung lớn (+12), EMA xếp chồng (+15), RSI (+6), gần vùng hỗ trợ (+18), sự đồng thuận đa khung thời gian (+5), nằm trên VWAP (+5)
⚖️
Kế hoạch rủi ro (rủi ro tài khoản 3%): Cắt lỗ cách giá vào lệnh 21.93% → quy mô vị thế ≈ 13.7% tài khoản (spot). Futures @ 25x: ~0.5% tài khoản làm ký quỹ; xấp xỉ thanh lý tại 0.248931.
⚠️
Ở mức 25x thì chạm thanh lý trước khi chạm cắt lỗ - giữ đòn bẩy ≤ 3x cho cắt lỗ này.
ℹ️
Nội dung chỉ mang tính giáo dục - hãy tự xác nhận trước khi hành động.
1
103
·
--
Tăng giá
📊
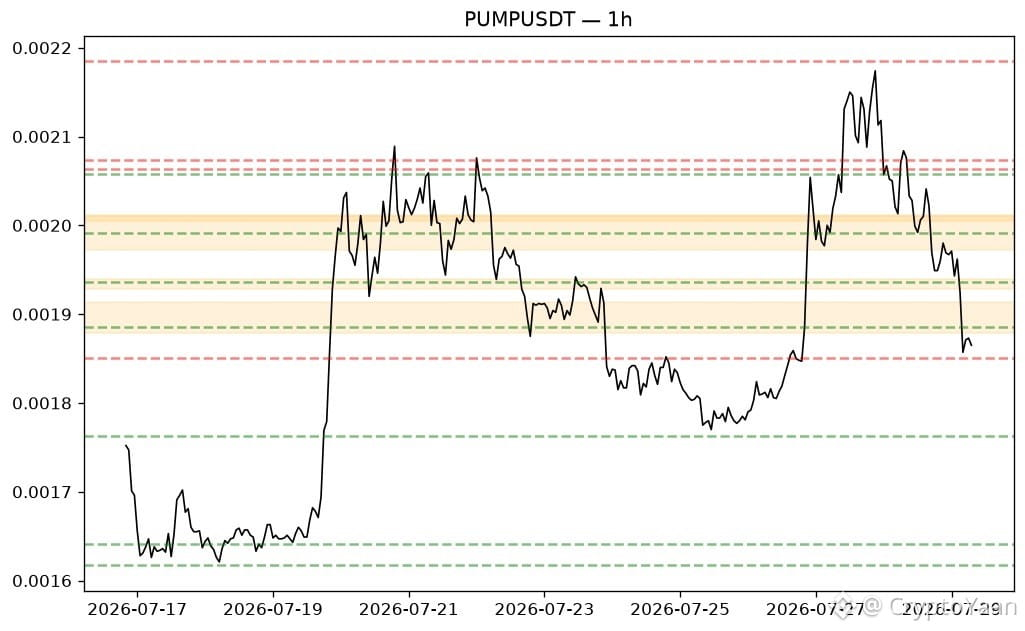
$PUMP - 1h (Binance)
📉
Xu hướng: giảm, hình thành đỉnh thấp hơn và đáy thấp hơn
⚡
Động lượng: rơi vào vùng quá bán (RSI 28.7)
🏷️
Giá: 0.0019
🔴
Kháng cự: 0.0019 (khoảng trống giá hợp lý), 0.0019 (khoảng trống giá hợp lý), 0.0020 (khoảng trống giá hợp lý), 0.0020 (khoảng trống giá hợp lý)
🟢
Hỗ trợ: 0.0018 (bể thanh khoản), 0.0016 (bể thanh khoản), 0.0016 (bể thanh khoản)
🟢
Kịch bản LONG Chờ giá điều chỉnh về 0.0018-0.0018 (bể thanh khoản) kèm tín hiệu đảo chiều tăng trước khi vào lệnh. Xác nhận cần tìm: nến engulfing tăng, nến búa, hoặc tín hiệu bị từ chối bằng bóng dưới dài tại vùng này trên khung 15m-1h; lý tưởng là đồng thời có sự phá vỡ đỉnh swing thấp hơn gần nhất ở khung thời gian thấp hơn (thay đổi cấu trúc) và RSI quay đầu đi lên.
🎯
Mục tiêu: 0.0019, sau đó 0.0019.
🛑
Cắt lỗ: thấp hơn 0.0017.
🔴
Kịch bản SHORT Chờ giá bị từ chối gần 0.0019-0.0019 (khoảng trống giá hợp lý) kèm tín hiệu đảo chiều giảm trước khi vào lệnh. Xác nhận cần tìm: nến engulfing giảm, nến sao băng, hoặc tín hiệu bị từ chối bằng bóng trên dài tại vùng này trên khung 15m-1h; lý tưởng là đồng thời có sự phá vỡ đáy swing thấp hơn gần nhất ở khung thời gian thấp hơn (thay đổi cấu trúc) và RSI quay đầu đi xuống.
🎯
Mục tiêu: 0.0018, sau đó 0.0016.
🛑
Cắt lỗ: cao hơn 0.0019.
ℹ️
Chỉ mang tính giáo dục - không phải lời khuyên tài chính. Luôn tự quản lý rủi ro của bạn. Kiểm tra đa sàn: BINANCE: 0.0019 | xu hướng: giảm (LH/LL) | RSI: 28.7 BYBIT: 0.0019 | xu hướng: giảm (LH/LL) | RSI: 29.2 OKX: 0.0019 | xu hướng: giảm (LH/LL) | RSI: 28.7 Biên độ giá giữa sàn: 0.054% | Sự đồng thuận xu hướng: yes
⏸️
Hiện chưa có thiết lập rõ ràng (điểm tốt nhất 41/100). Tốt hơn là chờ giá chạm một mức hoặc động lượng xác nhận trước khi ép vào một lệnh.
📊
$PUMP - 1h (Binance)
📉
Xu hướng: giảm, hình thành đỉnh thấp hơn và đáy thấp hơn
⚡
Động lượng: rơi vào vùng quá bán (RSI 28.7)
🏷️
Giá: 0.0019
🔴
Kháng cự: 0.0019 (khoảng trống giá hợp lý), 0.0019 (khoảng trống giá hợp lý), 0.0020 (khoảng trống giá hợp lý), 0.0020 (khoảng trống giá hợp lý)
🟢
Hỗ trợ: 0.0018 (bể thanh khoản), 0.0016 (bể thanh khoản), 0.0016 (bể thanh khoản)
🟢
Kịch bản LONG Chờ giá điều chỉnh về 0.0018-0.0018 (bể thanh khoản) kèm tín hiệu đảo chiều tăng trước khi vào lệnh. Xác nhận cần tìm: nến engulfing tăng, nến búa, hoặc tín hiệu bị từ chối bằng bóng dưới dài tại vùng này trên khung 15m-1h; lý tưởng là đồng thời có sự phá vỡ đỉnh swing thấp hơn gần nhất ở khung thời gian thấp hơn (thay đổi cấu trúc) và RSI quay đầu đi lên.
🎯
Mục tiêu: 0.0019, sau đó 0.0019.
🛑
Cắt lỗ: thấp hơn 0.0017.
🔴
Kịch bản SHORT Chờ giá bị từ chối gần 0.0019-0.0019 (khoảng trống giá hợp lý) kèm tín hiệu đảo chiều giảm trước khi vào lệnh. Xác nhận cần tìm: nến engulfing giảm, nến sao băng, hoặc tín hiệu bị từ chối bằng bóng trên dài tại vùng này trên khung 15m-1h; lý tưởng là đồng thời có sự phá vỡ đáy swing thấp hơn gần nhất ở khung thời gian thấp hơn (thay đổi cấu trúc) và RSI quay đầu đi xuống.
🎯
Mục tiêu: 0.0018, sau đó 0.0016.
🛑
Cắt lỗ: cao hơn 0.0019.
ℹ️
Chỉ mang tính giáo dục - không phải lời khuyên tài chính. Luôn tự quản lý rủi ro của bạn. Kiểm tra đa sàn: BINANCE: 0.0019 | xu hướng: giảm (LH/LL) | RSI: 28.7 BYBIT: 0.0019 | xu hướng: giảm (LH/LL) | RSI: 29.2 OKX: 0.0019 | xu hướng: giảm (LH/LL) | RSI: 28.7 Biên độ giá giữa sàn: 0.054% | Sự đồng thuận xu hướng: yes
⏸️
Hiện chưa có thiết lập rõ ràng (điểm tốt nhất 41/100). Tốt hơn là chờ giá chạm một mức hoặc động lượng xác nhận trước khi ép vào một lệnh.
$PUMP - 1h (Binance)
📉
Xu hướng: giảm, hình thành đỉnh thấp hơn và đáy thấp hơn
⚡
Động lượng: rơi vào vùng quá bán (RSI 28.7)
🏷️
Giá: 0.0019
🔴
Kháng cự: 0.0019 (khoảng trống giá hợp lý), 0.0019 (khoảng trống giá hợp lý), 0.0020 (khoảng trống giá hợp lý), 0.0020 (khoảng trống giá hợp lý)
🟢
Hỗ trợ: 0.0018 (bể thanh khoản), 0.0016 (bể thanh khoản), 0.0016 (bể thanh khoản)
🟢
Kịch bản LONG Chờ giá điều chỉnh về 0.0018-0.0018 (bể thanh khoản) kèm tín hiệu đảo chiều tăng trước khi vào lệnh. Xác nhận cần tìm: nến engulfing tăng, nến búa, hoặc tín hiệu bị từ chối bằng bóng dưới dài tại vùng này trên khung 15m-1h; lý tưởng là đồng thời có sự phá vỡ đỉnh swing thấp hơn gần nhất ở khung thời gian thấp hơn (thay đổi cấu trúc) và RSI quay đầu đi lên.
🎯
Mục tiêu: 0.0019, sau đó 0.0019.
🛑
Cắt lỗ: thấp hơn 0.0017.
🔴
Kịch bản SHORT Chờ giá bị từ chối gần 0.0019-0.0019 (khoảng trống giá hợp lý) kèm tín hiệu đảo chiều giảm trước khi vào lệnh. Xác nhận cần tìm: nến engulfing giảm, nến sao băng, hoặc tín hiệu bị từ chối bằng bóng trên dài tại vùng này trên khung 15m-1h; lý tưởng là đồng thời có sự phá vỡ đáy swing thấp hơn gần nhất ở khung thời gian thấp hơn (thay đổi cấu trúc) và RSI quay đầu đi xuống.
🎯
Mục tiêu: 0.0018, sau đó 0.0016.
🛑
Cắt lỗ: cao hơn 0.0019.
ℹ️
Chỉ mang tính giáo dục - không phải lời khuyên tài chính. Luôn tự quản lý rủi ro của bạn. Kiểm tra đa sàn: BINANCE: 0.0019 | xu hướng: giảm (LH/LL) | RSI: 28.7 BYBIT: 0.0019 | xu hướng: giảm (LH/LL) | RSI: 29.2 OKX: 0.0019 | xu hướng: giảm (LH/LL) | RSI: 28.7 Biên độ giá giữa sàn: 0.054% | Sự đồng thuận xu hướng: yes
⏸️
Hiện chưa có thiết lập rõ ràng (điểm tốt nhất 41/100). Tốt hơn là chờ giá chạm một mức hoặc động lượng xác nhận trước khi ép vào một lệnh.
1
127
·
--
Tăng giá
📰Bản tin nhanh
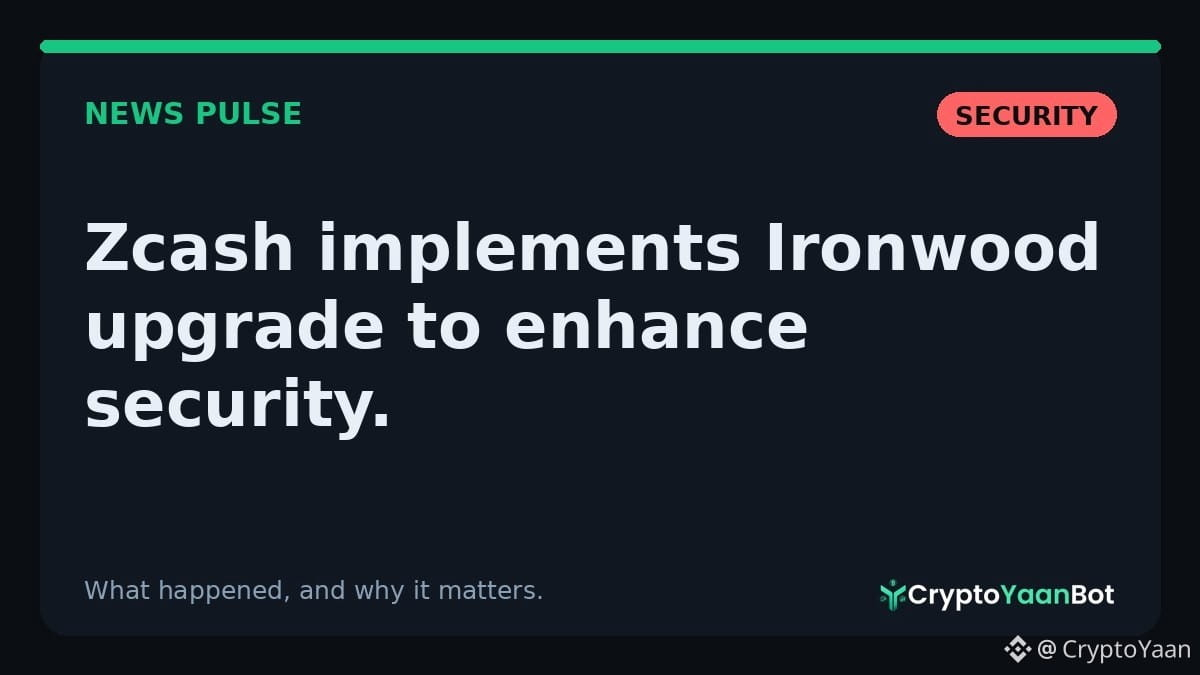
🔒$ZEC triển khai nâng cấp Ironwood để tăng cường bảo mật. Nâng cấp Ironwood thay thế “Orchard shielded pool” dễ bị tổn thương và giới thiệu các biện pháp mới nhằm bảo vệ nguồn cung Zcash khỏi hành vi làm giả. Cập nhật này rất quan trọng để duy trì niềm tin vào tính toàn vẹn của tiền mã hóa. Tại sao điều này quan trọng: Nâng cấp bảo mật là yếu tố then chốt để ngăn chặn các lỗ hổng tiềm ẩn và duy trì sự tin tưởng của người dùng vào mạng lưới.
#zec #cryptonews #cryptoyaan
📰Bản tin nhanh
🔒$ZEC triển khai nâng cấp Ironwood để tăng cường bảo mật. Nâng cấp Ironwood thay thế “Orchard shielded pool” dễ bị tổn thương và giới thiệu các biện pháp mới nhằm bảo vệ nguồn cung Zcash khỏi hành vi làm giả. Cập nhật này rất quan trọng để duy trì niềm tin vào tính toàn vẹn của tiền mã hóa. Tại sao điều này quan trọng: Nâng cấp bảo mật là yếu tố then chốt để ngăn chặn các lỗ hổng tiềm ẩn và duy trì sự tin tưởng của người dùng vào mạng lưới.
#zec #cryptonews #cryptoyaan
🔒$ZEC triển khai nâng cấp Ironwood để tăng cường bảo mật. Nâng cấp Ironwood thay thế “Orchard shielded pool” dễ bị tổn thương và giới thiệu các biện pháp mới nhằm bảo vệ nguồn cung Zcash khỏi hành vi làm giả. Cập nhật này rất quan trọng để duy trì niềm tin vào tính toàn vẹn của tiền mã hóa. Tại sao điều này quan trọng: Nâng cấp bảo mật là yếu tố then chốt để ngăn chặn các lỗ hổng tiềm ẩn và duy trì sự tin tưởng của người dùng vào mạng lưới.
#zec #cryptonews #cryptoyaan
1
66
·
--
Tăng giá
$ETH - DÀI · xu hướng pullback (dài) 82/100
🎯
entry ≈ 1896.9 ·
🛑
stop 1852.82 · các mục tiêu 1940.98 / 1985.05 / 2029.13
⚖️
dừng lỗ cách 2.32% · giữ đòn bẩy ≤ 25x
$ETH - DÀI · xu hướng pullback (dài) 82/100
🎯
entry ≈ 1896.9 ·
🛑
stop 1852.82 · các mục tiêu 1940.98 / 1985.05 / 2029.13
⚖️
dừng lỗ cách 2.32% · giữ đòn bẩy ≤ 25x
🎯
entry ≈ 1896.9 ·
🛑
stop 1852.82 · các mục tiêu 1940.98 / 1985.05 / 2029.13
⚖️
dừng lỗ cách 2.32% · giữ đòn bẩy ≤ 25x
1
22
·
--
Tăng giá
🟢
$LTC - LONG · điều chỉnh theo xu hướng (long) 85/100
🎯
giá vào ≈ 46.295 ·
🛑
dừng lỗ 45.421 · mục tiêu 47.169 / 48.043 / 48.917
⚖️
dừng lỗ cách xa 1,89% · giữ đòn bẩy ≤ 30x
🟢
$LTC - LONG · điều chỉnh theo xu hướng (long) 85/100
🎯
giá vào ≈ 46.295 ·
🛑
dừng lỗ 45.421 · mục tiêu 47.169 / 48.043 / 48.917
⚖️
dừng lỗ cách xa 1,89% · giữ đòn bẩy ≤ 30x
$LTC - LONG · điều chỉnh theo xu hướng (long) 85/100
🎯
giá vào ≈ 46.295 ·
🛑
dừng lỗ 45.421 · mục tiêu 47.169 / 48.043 / 48.917
⚖️
dừng lỗ cách xa 1,89% · giữ đòn bẩy ≤ 30x
1
7
·
--
Tăng giá
🟢
$ONDO - DÀI · pullback theo xu hướng (dài) 88/100
🎯
entry ≈ 0.39645 ·
🛑
stop 0.378145 · các mục tiêu 0.414755 / 0.433061 / 0.451366
⚖️
stop cách 4.62% · giữ đòn bẩy ≤ 13x
🟢
$ONDO - DÀI · pullback theo xu hướng (dài) 88/100
🎯
entry ≈ 0.39645 ·
🛑
stop 0.378145 · các mục tiêu 0.414755 / 0.433061 / 0.451366
⚖️
stop cách 4.62% · giữ đòn bẩy ≤ 13x
$ONDO - DÀI · pullback theo xu hướng (dài) 88/100
🎯
entry ≈ 0.39645 ·
🛑
stop 0.378145 · các mục tiêu 0.414755 / 0.433061 / 0.451366
⚖️
stop cách 4.62% · giữ đòn bẩy ≤ 13x
2
35
·
--
📰 Tin nhanh
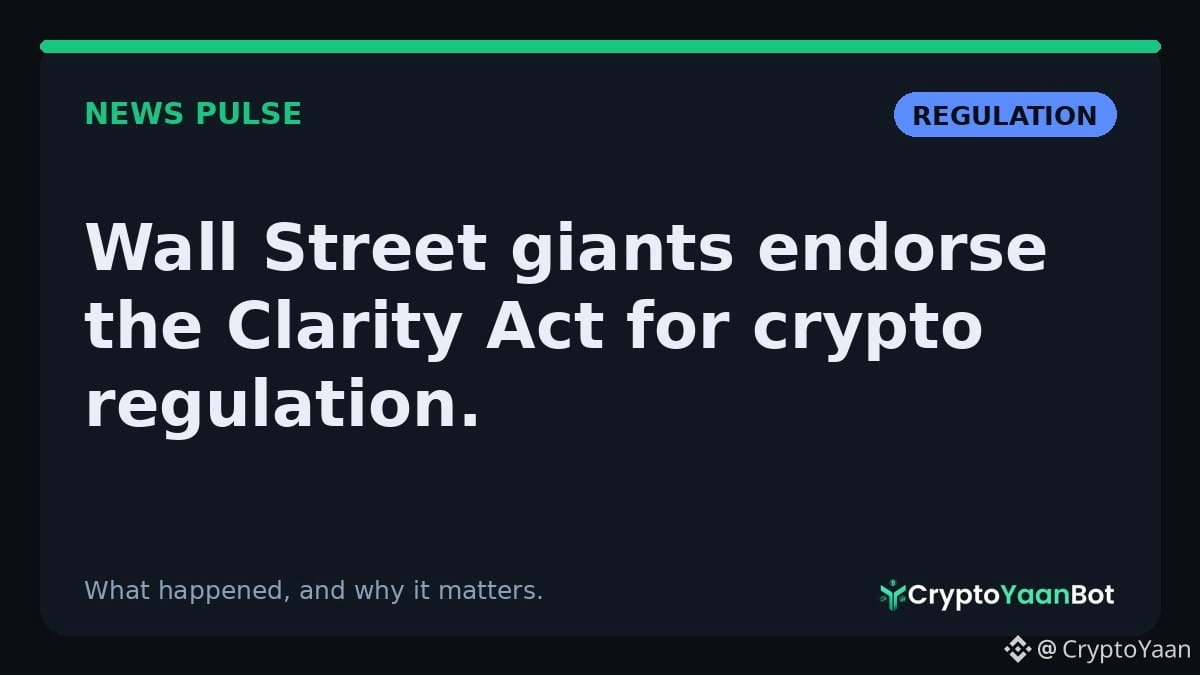
⚖️ Các “ông lớn” Phố Wall ủng hộ Đạo luật Clarity về quản lý tiền mã hóa.
BlackRock, Fidelity và các công ty lớn khác đã công khai ủng hộ đạo luật quan trọng này khi mốc thời gian của Thượng viện để xem xét đang đến gần. Sự ủng hộ này có thể tác động đáng kể đến bức tranh quản lý trong tương lai đối với tiền mã hóa tại Mỹ.
Vì sao điều này quan trọng: Việc các doanh nghiệp có ảnh hưởng lớn hậu thuẫn có thể làm tăng khả năng thông qua dự luật, qua đó ảnh hưởng đến sự ổn định của thị trường và niềm tin của nhà đầu tư.
#WallStreet #CryptoNews $BTC #cryptocurrencynews
📰 Tin nhanh
⚖️ Các “ông lớn” Phố Wall ủng hộ Đạo luật Clarity về quản lý tiền mã hóa.
BlackRock, Fidelity và các công ty lớn khác đã công khai ủng hộ đạo luật quan trọng này khi mốc thời gian của Thượng viện để xem xét đang đến gần. Sự ủng hộ này có thể tác động đáng kể đến bức tranh quản lý trong tương lai đối với tiền mã hóa tại Mỹ.
Vì sao điều này quan trọng: Việc các doanh nghiệp có ảnh hưởng lớn hậu thuẫn có thể làm tăng khả năng thông qua dự luật, qua đó ảnh hưởng đến sự ổn định của thị trường và niềm tin của nhà đầu tư.
#WallStreet #CryptoNews $BTC #cryptocurrencynews
⚖️ Các “ông lớn” Phố Wall ủng hộ Đạo luật Clarity về quản lý tiền mã hóa.
BlackRock, Fidelity và các công ty lớn khác đã công khai ủng hộ đạo luật quan trọng này khi mốc thời gian của Thượng viện để xem xét đang đến gần. Sự ủng hộ này có thể tác động đáng kể đến bức tranh quản lý trong tương lai đối với tiền mã hóa tại Mỹ.
Vì sao điều này quan trọng: Việc các doanh nghiệp có ảnh hưởng lớn hậu thuẫn có thể làm tăng khả năng thông qua dự luật, qua đó ảnh hưởng đến sự ổn định của thị trường và niềm tin của nhà đầu tư.
#WallStreet #CryptoNews $BTC #cryptocurrencynews
1
24
·
--
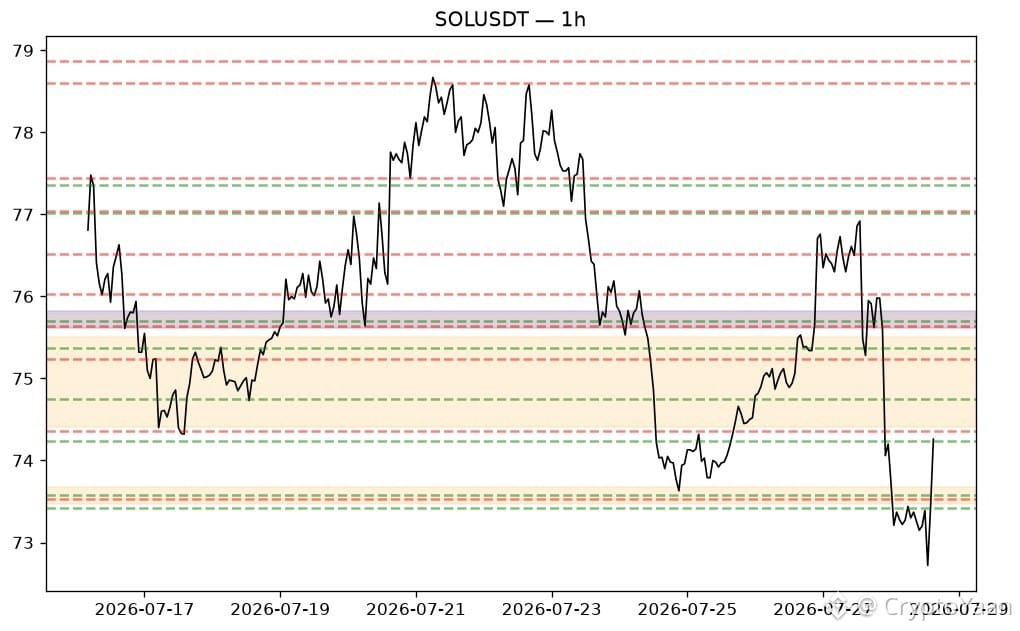
$SOL - 1h (Binance)
📉
Xu hướng: giảm (bearish), hình thành các đỉnh thấp hơn và đáy thấp hơn
⚡
Động lượng: nghiêng về tăng (RSI 65.4)
🏷️
Giá: 74.2600
🔴
Kháng cự: 74.3600 (bể thanh khoản), 75.0967 (khoảng trống giá hợp lý + bể thanh khoản), 75.6725 (bể thanh khoản + khoảng trống giá hợp lý), 76.0350 (bể thanh khoản)
🟢
Hỗ trợ: 74.2400 (bể thanh khoản), 73.5000 (bể thanh khoản)
🟢
KỊCH BẢN LONG: Chờ nhịp điều chỉnh về 74.1658-74.4627 (bể thanh khoản) với tín hiệu đảo chiều tăng trước khi vào lệnh. Xác nhận cần tìm: nến engulfing tăng, nến búa, hoặc tín hiệu bị từ chối với bóng dưới dài tại vùng này trên khung 15m-1h, lý tưởng là cùng với việc phá vỡ đỉnh swing thấp hơn gần nhất của khung thời gian thấp hơn (thay đổi cấu trúc) và RSI quay đầu tăng.
🎯
Mục tiêu: 74.3600, sau đó 75.0967.
🛑
Cắt lỗ: dưới 73.1264.
🔴
KỊCH BẢN SHORT: Chờ sự từ chối ở gần 74.1369-74.4344 (bể thanh khoản) với tín hiệu đảo chiều giảm trước khi vào lệnh. Xác nhận cần tìm: nến engulfing giảm, sao băng, hoặc tín hiệu bị từ chối với bóng trên dài tại vùng này trên khung 15m-1h, lý tưởng là cùng với việc phá vỡ đáy swing thấp hơn gần nhất của khung thời gian thấp hơn (thay đổi cấu trúc) và RSI quay đầu giảm.
🎯
Mục tiêu: 74.2400, sau đó 73.5000.
🛑
Cắt lỗ: trên 75.4754.
ℹ️
Chỉ mang tính giáo dục - không phải lời khuyên tài chính. Luôn tự quản lý rủi ro của bạn. Đa sàn: BINANCE: 74.2500 | xu hướng: giảm (LH/LL) | RSI: 65.3 BYBIT: 74.2500 | xu hướng: giảm (LH/LL) | RSI: 65.4 OKX: 74.2500 | xu hướng: giảm (LH/LL) | RSI: 64.8 Chênh lệch giá sàn: 0.0% | Sự đồng thuận xu hướng: yes
⏸️
Hiện chưa có kịch bản rõ ràng (điểm tốt nhất 46/100). Tốt hơn là chờ giá đạt đến một mức hoặc đợi động lượng xác nhận trước khi ép giao dịch.
$SOL - 1h (Binance)
📉
Xu hướng: giảm (bearish), hình thành các đỉnh thấp hơn và đáy thấp hơn
⚡
Động lượng: nghiêng về tăng (RSI 65.4)
🏷️
Giá: 74.2600
🔴
Kháng cự: 74.3600 (bể thanh khoản), 75.0967 (khoảng trống giá hợp lý + bể thanh khoản), 75.6725 (bể thanh khoản + khoảng trống giá hợp lý), 76.0350 (bể thanh khoản)
🟢
Hỗ trợ: 74.2400 (bể thanh khoản), 73.5000 (bể thanh khoản)
🟢
KỊCH BẢN LONG: Chờ nhịp điều chỉnh về 74.1658-74.4627 (bể thanh khoản) với tín hiệu đảo chiều tăng trước khi vào lệnh. Xác nhận cần tìm: nến engulfing tăng, nến búa, hoặc tín hiệu bị từ chối với bóng dưới dài tại vùng này trên khung 15m-1h, lý tưởng là cùng với việc phá vỡ đỉnh swing thấp hơn gần nhất của khung thời gian thấp hơn (thay đổi cấu trúc) và RSI quay đầu tăng.
🎯
Mục tiêu: 74.3600, sau đó 75.0967.
🛑
Cắt lỗ: dưới 73.1264.
🔴
KỊCH BẢN SHORT: Chờ sự từ chối ở gần 74.1369-74.4344 (bể thanh khoản) với tín hiệu đảo chiều giảm trước khi vào lệnh. Xác nhận cần tìm: nến engulfing giảm, sao băng, hoặc tín hiệu bị từ chối với bóng trên dài tại vùng này trên khung 15m-1h, lý tưởng là cùng với việc phá vỡ đáy swing thấp hơn gần nhất của khung thời gian thấp hơn (thay đổi cấu trúc) và RSI quay đầu giảm.
🎯
Mục tiêu: 74.2400, sau đó 73.5000.
🛑
Cắt lỗ: trên 75.4754.
ℹ️
Chỉ mang tính giáo dục - không phải lời khuyên tài chính. Luôn tự quản lý rủi ro của bạn. Đa sàn: BINANCE: 74.2500 | xu hướng: giảm (LH/LL) | RSI: 65.3 BYBIT: 74.2500 | xu hướng: giảm (LH/LL) | RSI: 65.4 OKX: 74.2500 | xu hướng: giảm (LH/LL) | RSI: 64.8 Chênh lệch giá sàn: 0.0% | Sự đồng thuận xu hướng: yes
⏸️
Hiện chưa có kịch bản rõ ràng (điểm tốt nhất 46/100). Tốt hơn là chờ giá đạt đến một mức hoặc đợi động lượng xác nhận trước khi ép giao dịch.
📉
Xu hướng: giảm (bearish), hình thành các đỉnh thấp hơn và đáy thấp hơn
⚡
Động lượng: nghiêng về tăng (RSI 65.4)
🏷️
Giá: 74.2600
🔴
Kháng cự: 74.3600 (bể thanh khoản), 75.0967 (khoảng trống giá hợp lý + bể thanh khoản), 75.6725 (bể thanh khoản + khoảng trống giá hợp lý), 76.0350 (bể thanh khoản)
🟢
Hỗ trợ: 74.2400 (bể thanh khoản), 73.5000 (bể thanh khoản)
🟢
KỊCH BẢN LONG: Chờ nhịp điều chỉnh về 74.1658-74.4627 (bể thanh khoản) với tín hiệu đảo chiều tăng trước khi vào lệnh. Xác nhận cần tìm: nến engulfing tăng, nến búa, hoặc tín hiệu bị từ chối với bóng dưới dài tại vùng này trên khung 15m-1h, lý tưởng là cùng với việc phá vỡ đỉnh swing thấp hơn gần nhất của khung thời gian thấp hơn (thay đổi cấu trúc) và RSI quay đầu tăng.
🎯
Mục tiêu: 74.3600, sau đó 75.0967.
🛑
Cắt lỗ: dưới 73.1264.
🔴
KỊCH BẢN SHORT: Chờ sự từ chối ở gần 74.1369-74.4344 (bể thanh khoản) với tín hiệu đảo chiều giảm trước khi vào lệnh. Xác nhận cần tìm: nến engulfing giảm, sao băng, hoặc tín hiệu bị từ chối với bóng trên dài tại vùng này trên khung 15m-1h, lý tưởng là cùng với việc phá vỡ đáy swing thấp hơn gần nhất của khung thời gian thấp hơn (thay đổi cấu trúc) và RSI quay đầu giảm.
🎯
Mục tiêu: 74.2400, sau đó 73.5000.
🛑
Cắt lỗ: trên 75.4754.
ℹ️
Chỉ mang tính giáo dục - không phải lời khuyên tài chính. Luôn tự quản lý rủi ro của bạn. Đa sàn: BINANCE: 74.2500 | xu hướng: giảm (LH/LL) | RSI: 65.3 BYBIT: 74.2500 | xu hướng: giảm (LH/LL) | RSI: 65.4 OKX: 74.2500 | xu hướng: giảm (LH/LL) | RSI: 64.8 Chênh lệch giá sàn: 0.0% | Sự đồng thuận xu hướng: yes
⏸️
Hiện chưa có kịch bản rõ ràng (điểm tốt nhất 46/100). Tốt hơn là chờ giá đạt đến một mức hoặc đợi động lượng xác nhận trước khi ép giao dịch.
1
48
·
--
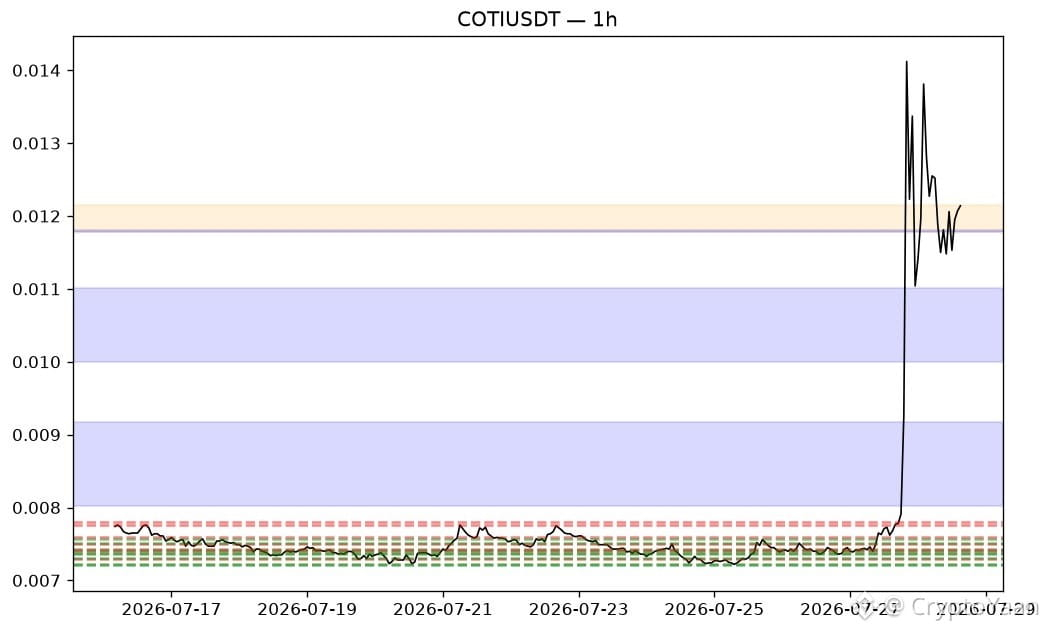
$COTI - 1h (Binance)
➡️
Xu hướng: đi ngang / chuyển tiếp, không có cấu trúc hướng rõ ràng
⚡
Động lượng: trung tính (RSI 51.3)
🏷️
Giá: 0.0121
🔴
Kháng cự: chưa xác định rõ trong vùng gần đây
🟢
Hỗ trợ: 0.0118 (khoảng trống giá trị hợp lý), 0.0105 (khoảng trống giá trị hợp lý), 0.0086 (khoảng trống giá trị hợp lý), 0.0076 (bể thanh khoản)
🟢
Thiết lập LONG: Chờ nhịp điều chỉnh về 0.0118-0.0118 (khoảng trống giá trị hợp lý) và xuất hiện tín hiệu đảo chiều tăng trước khi vào lệnh. Xác nhận cần tìm: nến bullish engulfing, hammer, hoặc dấu hiệu bị từ chối ở đuôi nến dưới dài tại vùng này trên biểu đồ 15m-1h, lý tưởng là đi kèm với việc phá vỡ đỉnh swing khung thời gian thấp nhất gần nhất (thay đổi cấu trúc) và RSI quay đầu đi lên.
🎯
Mục tiêu: 0.0123, sau đó 0.0124.
🛑
Cắt lỗ: dưới 0.0116.
🔴
Thiết lập SHORT: Chưa xác định được vùng cung gần đó để vào lệnh short ngay lúc này.
ℹ️
Chỉ mang tính giáo dục - không phải lời khuyên tài chính. Luôn tự quản lý rủi ro của bạn. Kiểm tra nhiều sàn: BINANCE: 0.0121 | xu hướng: đi ngang / chuyển tiếp | RSI: 51.3 Chênh lệch giá sàn giao dịch: 0.0% | Sự đồng thuận xu hướng: có
🎯
Thiết lập:
🟢
LONG - điều chỉnh theo xu hướng (long) 59/100
⚪🕐
1h: - , 4h:▲, 1d: -
🎯
Vào lệnh ≈ 0.011795 ·
🛑
Cắt lỗ 0.0100894 (1.5×ATR) · Mục tiêu 0.0135006 / 0.0152062 / 0.0169118 (1R/2R/3R)
🧩
Lý do: xu hướng khung thời gian cao hơn (+12), chuỗi EMA (+15), RSI (+6), gần hỗ trợ (+16), đồng thuận đa khung thời gian (+5), nằm trên VWAP (+5)
⚖️
Kế hoạch rủi ro (rủi ro 3% tài khoản): Cắt lỗ cách giá vào 16.90% → quy mô vị thế ≈ 17.7% tài khoản (spot). Futures @ 25x: ~0.7% tài khoản làm ký quỹ; xấp xỉ thanh lý tại 0.0113822.
⚠️
Với 25x thì bị thanh lý trước khi chạm cắt lỗ - giữ đòn bẩy ≤ 4x cho cắt lỗ này.
ℹ️
Nội dung chỉ mang tính giáo dục - tự xác nhận trước khi hành động.
$COTI - 1h (Binance)
➡️
Xu hướng: đi ngang / chuyển tiếp, không có cấu trúc hướng rõ ràng
⚡
Động lượng: trung tính (RSI 51.3)
🏷️
Giá: 0.0121
🔴
Kháng cự: chưa xác định rõ trong vùng gần đây
🟢
Hỗ trợ: 0.0118 (khoảng trống giá trị hợp lý), 0.0105 (khoảng trống giá trị hợp lý), 0.0086 (khoảng trống giá trị hợp lý), 0.0076 (bể thanh khoản)
🟢
Thiết lập LONG: Chờ nhịp điều chỉnh về 0.0118-0.0118 (khoảng trống giá trị hợp lý) và xuất hiện tín hiệu đảo chiều tăng trước khi vào lệnh. Xác nhận cần tìm: nến bullish engulfing, hammer, hoặc dấu hiệu bị từ chối ở đuôi nến dưới dài tại vùng này trên biểu đồ 15m-1h, lý tưởng là đi kèm với việc phá vỡ đỉnh swing khung thời gian thấp nhất gần nhất (thay đổi cấu trúc) và RSI quay đầu đi lên.
🎯
Mục tiêu: 0.0123, sau đó 0.0124.
🛑
Cắt lỗ: dưới 0.0116.
🔴
Thiết lập SHORT: Chưa xác định được vùng cung gần đó để vào lệnh short ngay lúc này.
ℹ️
Chỉ mang tính giáo dục - không phải lời khuyên tài chính. Luôn tự quản lý rủi ro của bạn. Kiểm tra nhiều sàn: BINANCE: 0.0121 | xu hướng: đi ngang / chuyển tiếp | RSI: 51.3 Chênh lệch giá sàn giao dịch: 0.0% | Sự đồng thuận xu hướng: có
🎯
Thiết lập:
🟢
LONG - điều chỉnh theo xu hướng (long) 59/100
⚪🕐
1h: - , 4h:▲, 1d: -
🎯
Vào lệnh ≈ 0.011795 ·
🛑
Cắt lỗ 0.0100894 (1.5×ATR) · Mục tiêu 0.0135006 / 0.0152062 / 0.0169118 (1R/2R/3R)
🧩
Lý do: xu hướng khung thời gian cao hơn (+12), chuỗi EMA (+15), RSI (+6), gần hỗ trợ (+16), đồng thuận đa khung thời gian (+5), nằm trên VWAP (+5)
⚖️
Kế hoạch rủi ro (rủi ro 3% tài khoản): Cắt lỗ cách giá vào 16.90% → quy mô vị thế ≈ 17.7% tài khoản (spot). Futures @ 25x: ~0.7% tài khoản làm ký quỹ; xấp xỉ thanh lý tại 0.0113822.
⚠️
Với 25x thì bị thanh lý trước khi chạm cắt lỗ - giữ đòn bẩy ≤ 4x cho cắt lỗ này.
ℹ️
Nội dung chỉ mang tính giáo dục - tự xác nhận trước khi hành động.
➡️
Xu hướng: đi ngang / chuyển tiếp, không có cấu trúc hướng rõ ràng
⚡
Động lượng: trung tính (RSI 51.3)
🏷️
Giá: 0.0121
🔴
Kháng cự: chưa xác định rõ trong vùng gần đây
🟢
Hỗ trợ: 0.0118 (khoảng trống giá trị hợp lý), 0.0105 (khoảng trống giá trị hợp lý), 0.0086 (khoảng trống giá trị hợp lý), 0.0076 (bể thanh khoản)
🟢
Thiết lập LONG: Chờ nhịp điều chỉnh về 0.0118-0.0118 (khoảng trống giá trị hợp lý) và xuất hiện tín hiệu đảo chiều tăng trước khi vào lệnh. Xác nhận cần tìm: nến bullish engulfing, hammer, hoặc dấu hiệu bị từ chối ở đuôi nến dưới dài tại vùng này trên biểu đồ 15m-1h, lý tưởng là đi kèm với việc phá vỡ đỉnh swing khung thời gian thấp nhất gần nhất (thay đổi cấu trúc) và RSI quay đầu đi lên.
🎯
Mục tiêu: 0.0123, sau đó 0.0124.
🛑
Cắt lỗ: dưới 0.0116.
🔴
Thiết lập SHORT: Chưa xác định được vùng cung gần đó để vào lệnh short ngay lúc này.
ℹ️
Chỉ mang tính giáo dục - không phải lời khuyên tài chính. Luôn tự quản lý rủi ro của bạn. Kiểm tra nhiều sàn: BINANCE: 0.0121 | xu hướng: đi ngang / chuyển tiếp | RSI: 51.3 Chênh lệch giá sàn giao dịch: 0.0% | Sự đồng thuận xu hướng: có
🎯
Thiết lập:
🟢
LONG - điều chỉnh theo xu hướng (long) 59/100
⚪🕐
1h: - , 4h:▲, 1d: -
🎯
Vào lệnh ≈ 0.011795 ·
🛑
Cắt lỗ 0.0100894 (1.5×ATR) · Mục tiêu 0.0135006 / 0.0152062 / 0.0169118 (1R/2R/3R)
🧩
Lý do: xu hướng khung thời gian cao hơn (+12), chuỗi EMA (+15), RSI (+6), gần hỗ trợ (+16), đồng thuận đa khung thời gian (+5), nằm trên VWAP (+5)
⚖️
Kế hoạch rủi ro (rủi ro 3% tài khoản): Cắt lỗ cách giá vào 16.90% → quy mô vị thế ≈ 17.7% tài khoản (spot). Futures @ 25x: ~0.7% tài khoản làm ký quỹ; xấp xỉ thanh lý tại 0.0113822.
⚠️
Với 25x thì bị thanh lý trước khi chạm cắt lỗ - giữ đòn bẩy ≤ 4x cho cắt lỗ này.
ℹ️
Nội dung chỉ mang tính giáo dục - tự xác nhận trước khi hành động.
1
70
·
--
📰
Tin nhanh
⚖️
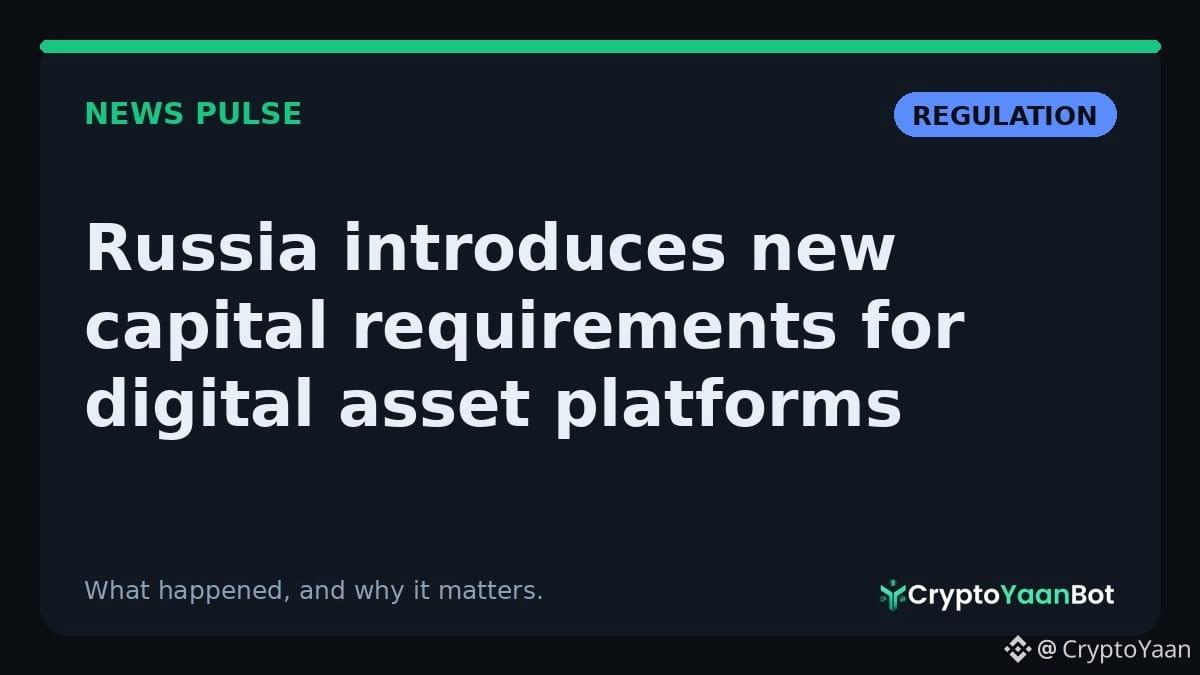
Nga đưa ra yêu cầu vốn mới cho các nền tảng tài sản kỹ thuật số Dự thảo quy định của ngân hàng trung ương yêu cầu các nền tảng tài sản kỹ thuật số phải duy trì tối đa 2,8 triệu USD vốn lưu động. Động thái này diễn ra như một phần của khung pháp lý rộng hơn dự kiến sẽ được triển khai vào mùa thu. Tại sao điều này quan trọng: Các quy định này có thể ảnh hưởng đáng kể đến cách các doanh nghiệp crypto hoạt động tại Nga, đồng thời có thể tác động đến động lực thị trường và chi phí tuân thủ.
#CryptoNews $BTC $ETH #SOL #Russia
📰
Tin nhanh
⚖️
Nga đưa ra yêu cầu vốn mới cho các nền tảng tài sản kỹ thuật số Dự thảo quy định của ngân hàng trung ương yêu cầu các nền tảng tài sản kỹ thuật số phải duy trì tối đa 2,8 triệu USD vốn lưu động. Động thái này diễn ra như một phần của khung pháp lý rộng hơn dự kiến sẽ được triển khai vào mùa thu. Tại sao điều này quan trọng: Các quy định này có thể ảnh hưởng đáng kể đến cách các doanh nghiệp crypto hoạt động tại Nga, đồng thời có thể tác động đến động lực thị trường và chi phí tuân thủ.
#CryptoNews $BTC $ETH #SOL #Russia
Tin nhanh
⚖️
Nga đưa ra yêu cầu vốn mới cho các nền tảng tài sản kỹ thuật số Dự thảo quy định của ngân hàng trung ương yêu cầu các nền tảng tài sản kỹ thuật số phải duy trì tối đa 2,8 triệu USD vốn lưu động. Động thái này diễn ra như một phần của khung pháp lý rộng hơn dự kiến sẽ được triển khai vào mùa thu. Tại sao điều này quan trọng: Các quy định này có thể ảnh hưởng đáng kể đến cách các doanh nghiệp crypto hoạt động tại Nga, đồng thời có thể tác động đến động lực thị trường và chi phí tuân thủ.
#CryptoNews $BTC $ETH #SOL #Russia
1
24
·
--
Chỉ số nỗi sợ vừa tăng vọt gần 20% và ai cũng đang nhìn vào cùng một con số. Dưới đây là điều con số đó đang che giấu.
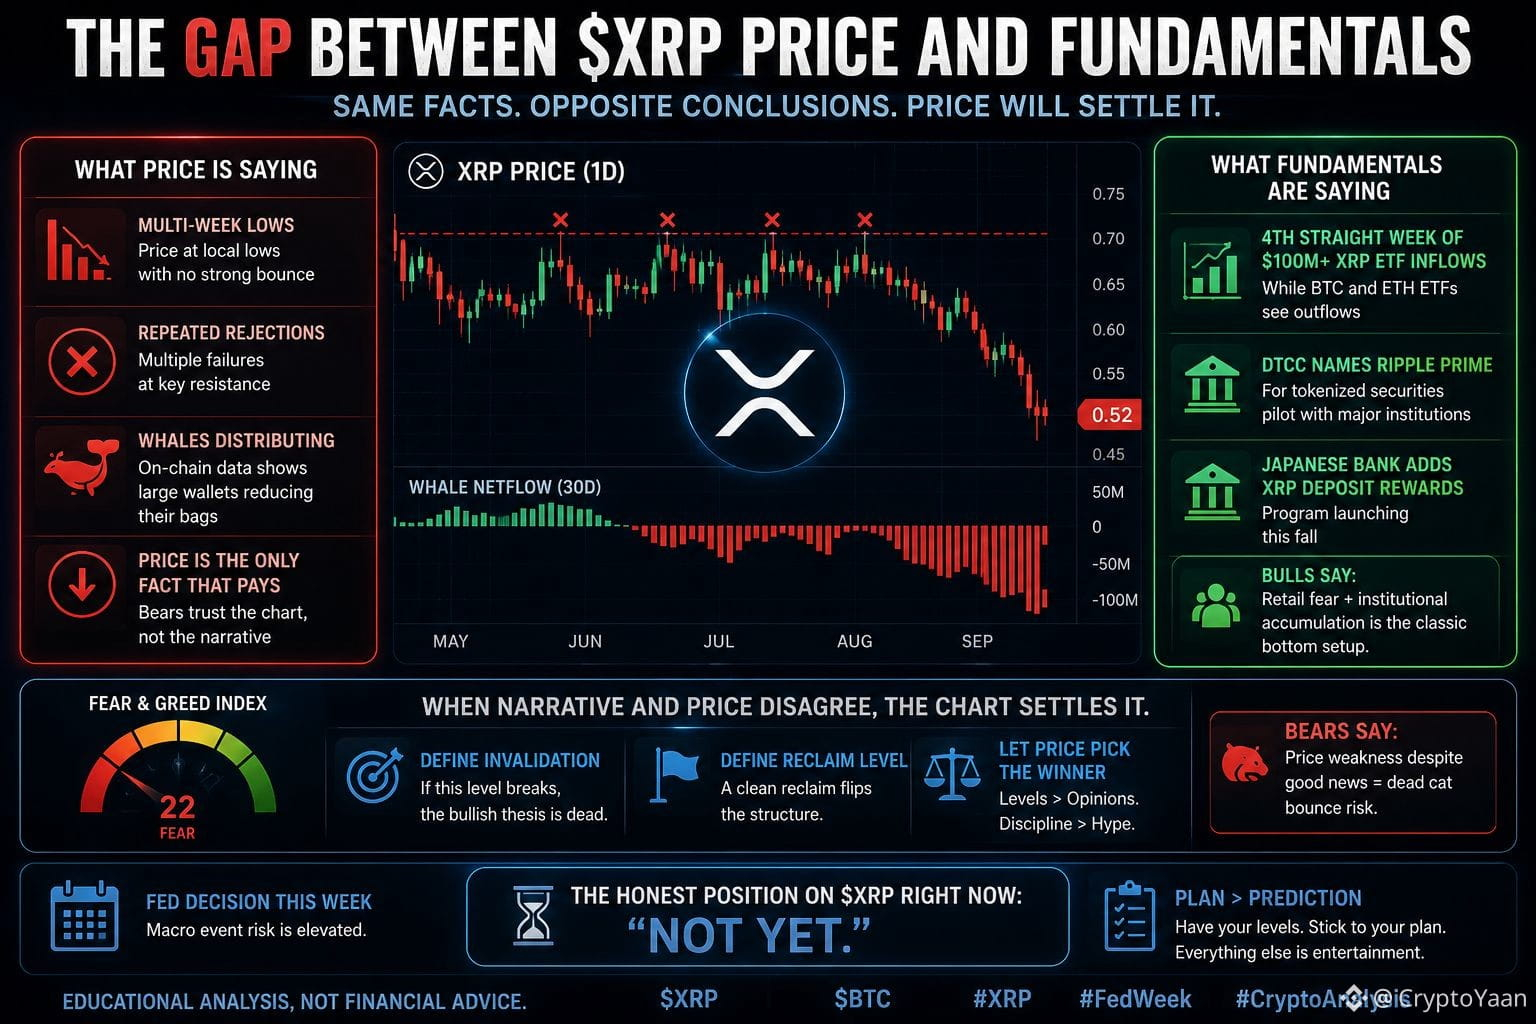
Trong CÙNG một phiên hôm nay: $ZEC đã nhảy 10% sau khi vá một lỗi nghiêm trọng, NEAR phục hồi 3 USDT, và LAB sụp đổ 77%, xóa sạch 6B USD. Trong khi đó $XRP ghi nhận mức thấp nhất trong 15 tuần và $BTC đang giữ quanh mức thấp khoảng 63 nghìn USD trước quyết định của Fed.
Đó không phải "một thị trường đầy sợ hãi". Đó là bốn thị trường hoàn toàn khác nhau nhưng cùng khoác một chỉ số.
Chỉ số sợ hãi đo cảm xúc đám đông, không phải thiết lập của bạn. Những ngày như thế này, lợi thế lại khá nhàm chán: chấm điểm từng biểu đồ dựa trên giá trị riêng, điều chỉnh quy mô vị thế theo biến động hiện tại, và để các cảnh báo theo dõi các mốc trong khi bạn không hành động theo cảm tính.
Chúng tôi đã chạy thang điểm 0–100 cho các đồng chính hôm nay và khoảng chênh lệch giữa biểu đồ tốt nhất và tệ nhất là cực lớn. Cùng một thị trường, nhưng giao dịch lại rất khác nhau.
Chỉ số nỗi sợ đang khiến BẠN muốn làm gì ngay lúc này? Cảm hứng đó đáng để xem xét trước khi hành động.
Không phải lời khuyên tài chính.
#BitcoinFearGaugeSurgesNearly20% #XRPHits15WeekLow #FedWeek #CryptoTrading
Chỉ số nỗi sợ vừa tăng vọt gần 20% và ai cũng đang nhìn vào cùng một con số. Dưới đây là điều con số đó đang che giấu.
Trong CÙNG một phiên hôm nay: $ZEC đã nhảy 10% sau khi vá một lỗi nghiêm trọng, NEAR phục hồi 3 USDT, và LAB sụp đổ 77%, xóa sạch 6B USD. Trong khi đó $XRP ghi nhận mức thấp nhất trong 15 tuần và $BTC đang giữ quanh mức thấp khoảng 63 nghìn USD trước quyết định của Fed.
Đó không phải "một thị trường đầy sợ hãi". Đó là bốn thị trường hoàn toàn khác nhau nhưng cùng khoác một chỉ số.
Chỉ số sợ hãi đo cảm xúc đám đông, không phải thiết lập của bạn. Những ngày như thế này, lợi thế lại khá nhàm chán: chấm điểm từng biểu đồ dựa trên giá trị riêng, điều chỉnh quy mô vị thế theo biến động hiện tại, và để các cảnh báo theo dõi các mốc trong khi bạn không hành động theo cảm tính.
Chúng tôi đã chạy thang điểm 0–100 cho các đồng chính hôm nay và khoảng chênh lệch giữa biểu đồ tốt nhất và tệ nhất là cực lớn. Cùng một thị trường, nhưng giao dịch lại rất khác nhau.
Chỉ số nỗi sợ đang khiến BẠN muốn làm gì ngay lúc này? Cảm hứng đó đáng để xem xét trước khi hành động.
Không phải lời khuyên tài chính.
#BitcoinFearGaugeSurgesNearly20% #XRPHits15WeekLow #FedWeek #CryptoTrading
Trong CÙNG một phiên hôm nay: $ZEC đã nhảy 10% sau khi vá một lỗi nghiêm trọng, NEAR phục hồi 3 USDT, và LAB sụp đổ 77%, xóa sạch 6B USD. Trong khi đó $XRP ghi nhận mức thấp nhất trong 15 tuần và $BTC đang giữ quanh mức thấp khoảng 63 nghìn USD trước quyết định của Fed.
Đó không phải "một thị trường đầy sợ hãi". Đó là bốn thị trường hoàn toàn khác nhau nhưng cùng khoác một chỉ số.
Chỉ số sợ hãi đo cảm xúc đám đông, không phải thiết lập của bạn. Những ngày như thế này, lợi thế lại khá nhàm chán: chấm điểm từng biểu đồ dựa trên giá trị riêng, điều chỉnh quy mô vị thế theo biến động hiện tại, và để các cảnh báo theo dõi các mốc trong khi bạn không hành động theo cảm tính.
Chúng tôi đã chạy thang điểm 0–100 cho các đồng chính hôm nay và khoảng chênh lệch giữa biểu đồ tốt nhất và tệ nhất là cực lớn. Cùng một thị trường, nhưng giao dịch lại rất khác nhau.
Chỉ số nỗi sợ đang khiến BẠN muốn làm gì ngay lúc này? Cảm hứng đó đáng để xem xét trước khi hành động.
Không phải lời khuyên tài chính.
#BitcoinFearGaugeSurgesNearly20% #XRPHits15WeekLow #FedWeek #CryptoTrading
1
199
Đăng nhập để khám phá thêm nội dung
Tham gia cùng người dùng tiền mã hóa toàn cầu trên Binance Square
⚡️ Nhận thông tin mới nhất và hữu ích về tiền mã hóa.
💬 Được tin cậy bởi sàn giao dịch tiền mã hóa lớn nhất thế giới.
👍 Khám phá những thông tin chuyên sâu thực tế từ những nhà sáng tạo đã xác minh.
Email / Số điện thoại
Chủ đề thịnh hành
CPIWatch
87.4M lượt xem
504,235 đang thảo luận
Chia sẻ & Nhận thưởng Lưu lượng truy cập trong Chiến dịch Hashtag Xu hướng của chúng tôi
✨Chủ đề: CPI có kích hoạt đợt tăng lãi suất không?
👉Cách tham gia:
Đăng một bài viết ngắn hoặc bài viết với hashtag #CPIWatch
Tạo nội dung dựa trên hai góc độ dưới đây:
- Bảng lương phi nông nghiệp vượt kỳ vọng và CPI sắp được công bố—bạn nghĩ Fed sẽ tăng lãi suất hay giữ nguyên?
- Tăng giá hay giảm giá? Chia sẻ quan điểm của bạn và trưng bày cổ phiếu hoặc giao dịch/nắm giữ vàng của bạn với widget chia sẻ giao dịch của chúng tôi.
🚀Thời gian chiến dịch:
- 2026-09-11 3:00 - 2026-09-12 9:00 UTC
🎁Phần thưởng:
- Các bài đăng đủ điều kiện tuân thủ các hướng dẫn trên và có hơn 100 từ sẽ được xem xét và có thể nhận một lượt tăng lưu lượng truy cập ngẫu nhiên từ 500 đến 3,000 lượt xem. Bạn sẽ nhận được thông báo từ thư ký feed của chúng tôi nếu bài đăng của bạn được chọn.
- Cơ hội để bài viết của bạn được đăng trên Binance Square Official
Cần ý tưởng cho bài đăng của bạn? Truy cập trang chủ đề #CPIWatch hoặc Square Guide on How to Post for Better Reach.
Binance Square Official
·619 lượt thích
·1.7M lượt xem
TheoDõiFOMC
73,884 lượt xem
490 đang thảo luận
45NgayTuDoTaiChinh
894,659 lượt xem
3,028 đang thảo luận