
CLYTHERONIX 1
234 Bài đăng

CLYTHERONIX 1
Báo cáo
Chặn người dùng
Smarter Plays, Sharper Insights 𓃦
0 Đang theo dõi
1 Người theo dõi
8 Đã thích
Bài đăng
Xem bản dịch
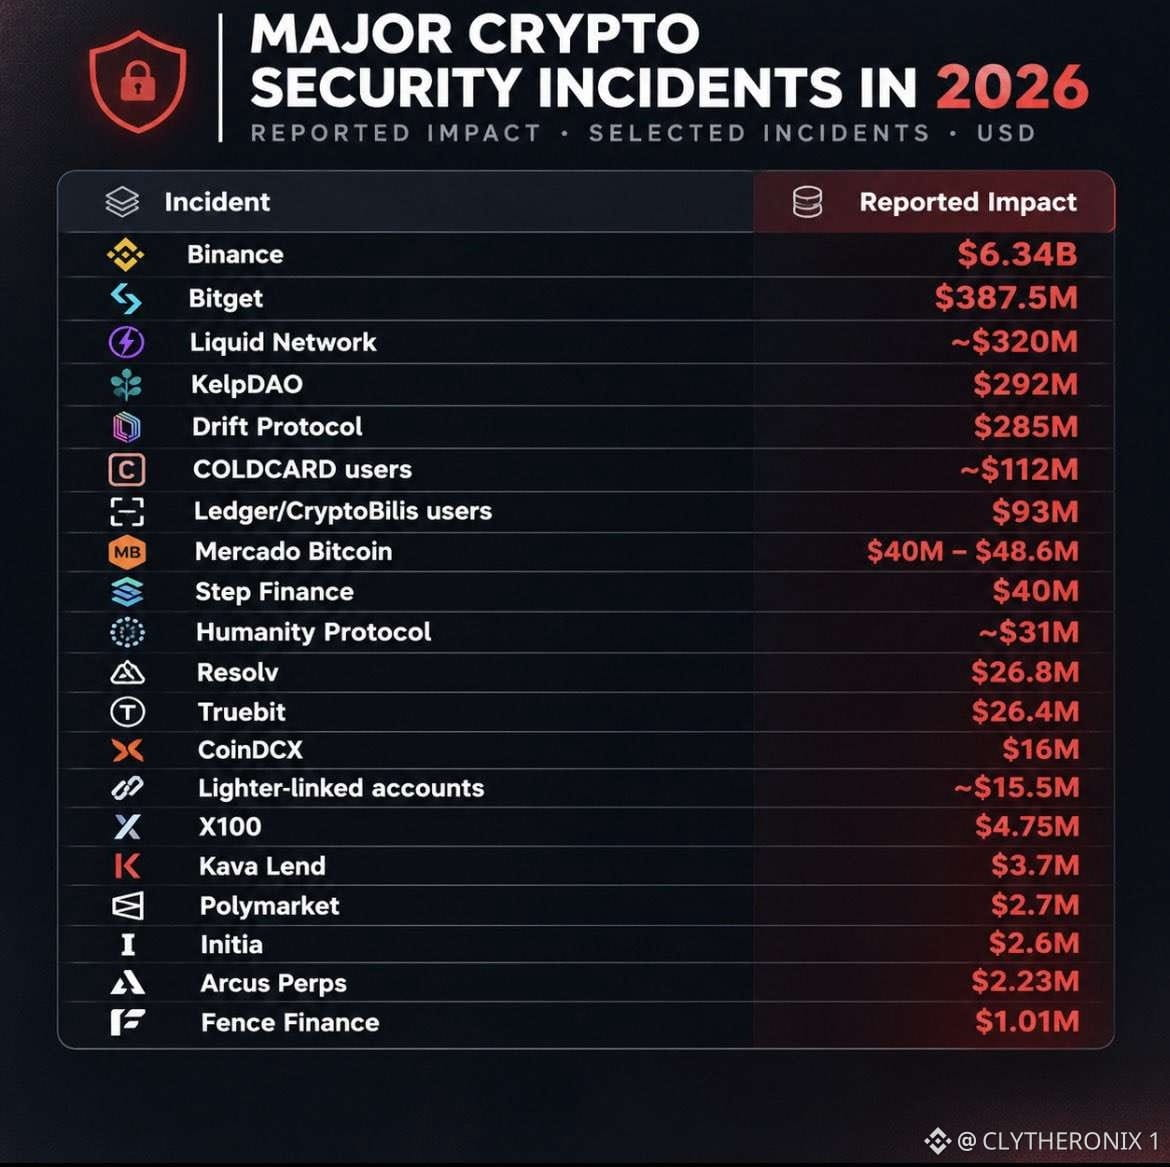
2026 CRYPTO SECURITY LOSSES RAISE CONCERNS OVER INDUSTRY SAFETY
The scale of reported crypto losses in 2026 is raising serious concerns about digital asset security. Major incidents involving Binance ($6.34B), Bitget ($387.5M), and Liquid Network (approximately $320M) show how exchanges, protocols and individual users remain exposed to attacks.
WHERE THE RISKS ARE GROWING
Centralized exchanges remain exposed to major security breaches, highlighting the risks of keeping large balances on trading platforms. Self custody is not completely safe either. Reported incidents involving COLDCARD ($112M) and Ledger and CryptoBiliis users ($93M) show how phishing, supply chain attacks, and targeted compromises can affect wallet users.
DeFi protocols, liquid staking platforms such as KelpDAO ($292M), and cross chain bridges also face risks from smart contract vulnerabilities and infrastructure exploits.
In my view, crypto security must go beyond basic password protection and wallet storage. Users and platforms need stronger verification, careful transaction approval, and continuous security monitoring as attack methods become more sophisticated.
DISCLAIMER: This overview reflects reported security data and is not financial or security advice.
#Macro Insights#
2026 CRYPTO SECURITY LOSSES RAISE CONCERNS OVER INDUSTRY SAFETY
The scale of reported crypto losses in 2026 is raising serious concerns about digital asset security. Major incidents involving Binance ($6.34B), Bitget ($387.5M), and Liquid Network (approximately $320M) show how exchanges, protocols and individual users remain exposed to attacks.
WHERE THE RISKS ARE GROWING
Centralized exchanges remain exposed to major security breaches, highlighting the risks of keeping large balances on trading platforms. Self custody is not completely safe either. Reported incidents involving COLDCARD ($112M) and Ledger and CryptoBiliis users ($93M) show how phishing, supply chain attacks, and targeted compromises can affect wallet users.
DeFi protocols, liquid staking platforms such as KelpDAO ($292M), and cross chain bridges also face risks from smart contract vulnerabilities and infrastructure exploits.
In my view, crypto security must go beyond basic password protection and wallet storage. Users and platforms need stronger verification, careful transaction approval, and continuous security monitoring as attack methods become more sophisticated.
DISCLAIMER: This overview reflects reported security data and is not financial or security advice.
#Macro Insights#
The scale of reported crypto losses in 2026 is raising serious concerns about digital asset security. Major incidents involving Binance ($6.34B), Bitget ($387.5M), and Liquid Network (approximately $320M) show how exchanges, protocols and individual users remain exposed to attacks.
WHERE THE RISKS ARE GROWING
Centralized exchanges remain exposed to major security breaches, highlighting the risks of keeping large balances on trading platforms. Self custody is not completely safe either. Reported incidents involving COLDCARD ($112M) and Ledger and CryptoBiliis users ($93M) show how phishing, supply chain attacks, and targeted compromises can affect wallet users.
DeFi protocols, liquid staking platforms such as KelpDAO ($292M), and cross chain bridges also face risks from smart contract vulnerabilities and infrastructure exploits.
In my view, crypto security must go beyond basic password protection and wallet storage. Users and platforms need stronger verification, careful transaction approval, and continuous security monitoring as attack methods become more sophisticated.
DISCLAIMER: This overview reflects reported security data and is not financial or security advice.
#Macro Insights#
61
Xem bản dịch
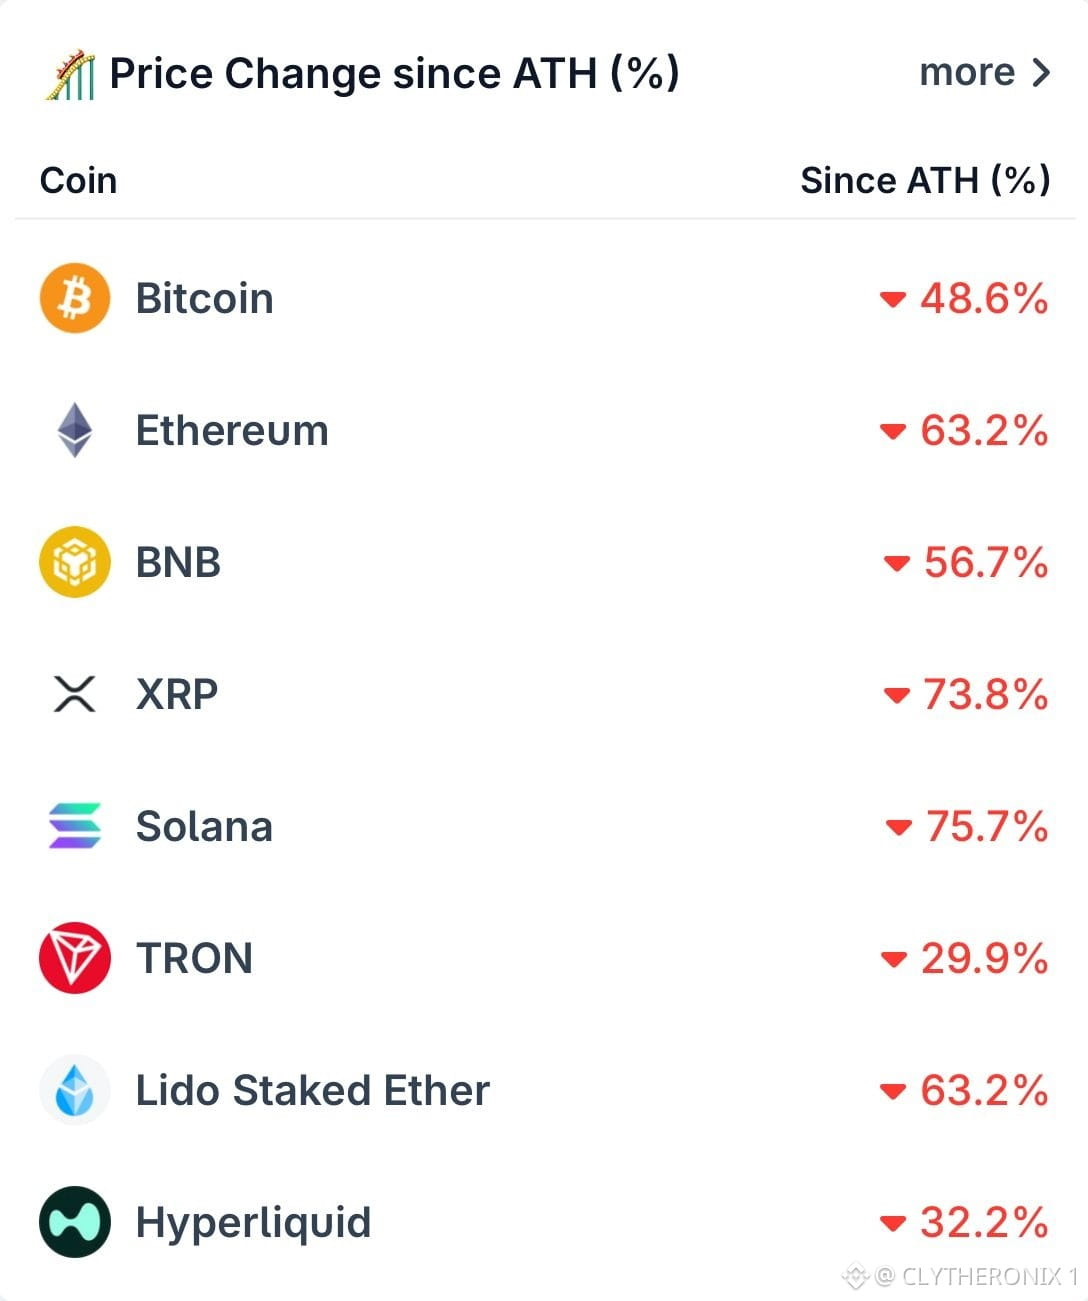
BITCOIN IS NOW 50% DOWN FROM ATH.
This is the classic "buy the dip" that captures the imagination of crypto investors every cycle!
But, a 50% fall for $BTC requires a 100% gain to return to the previous high. For example, an asset that drops from $100 to $50 must double for buyers at $50 to break even. A 48.6% decline requires a recovery of about 94.6%, or roughly 1.95 times.
THE RISK BEHIND THE OPPORTUNITY
The deeper the loss, the larger the recovery needed. A 75% decline requires a 300% gain just to return to the starting price. An asset trading far below its all-time high is not automatically cheap.
Recovery may take months or years, and some assets may never regain previous highs if market conditions or fundamentals change.
A decline can also deepen before recovery begins. An asset already down 50% can fall another 50%, leaving buyers with a larger loss.
Buying a dip requires more than measuring how far the price has fallen. Investors should assess the project, market conditions, and risk before entering.
DISCLAIMER: This is my personal research, not financial advice.
#Bitcoin Price Prediction: What is Bitcoins next move?#
BITCOIN IS NOW 50% DOWN FROM ATH.
This is the classic "buy the dip" that captures the imagination of crypto investors every cycle!
But, a 50% fall for $BTC requires a 100% gain to return to the previous high. For example, an asset that drops from $100 to $50 must double for buyers at $50 to break even. A 48.6% decline requires a recovery of about 94.6%, or roughly 1.95 times.
THE RISK BEHIND THE OPPORTUNITY
The deeper the loss, the larger the recovery needed. A 75% decline requires a 300% gain just to return to the starting price. An asset trading far below its all-time high is not automatically cheap.
Recovery may take months or years, and some assets may never regain previous highs if market conditions or fundamentals change.
A decline can also deepen before recovery begins. An asset already down 50% can fall another 50%, leaving buyers with a larger loss.
Buying a dip requires more than measuring how far the price has fallen. Investors should assess the project, market conditions, and risk before entering.
DISCLAIMER: This is my personal research, not financial advice.
#Bitcoin Price Prediction: What is Bitcoins next move?#
This is the classic "buy the dip" that captures the imagination of crypto investors every cycle!
But, a 50% fall for $BTC requires a 100% gain to return to the previous high. For example, an asset that drops from $100 to $50 must double for buyers at $50 to break even. A 48.6% decline requires a recovery of about 94.6%, or roughly 1.95 times.
THE RISK BEHIND THE OPPORTUNITY
The deeper the loss, the larger the recovery needed. A 75% decline requires a 300% gain just to return to the starting price. An asset trading far below its all-time high is not automatically cheap.
Recovery may take months or years, and some assets may never regain previous highs if market conditions or fundamentals change.
A decline can also deepen before recovery begins. An asset already down 50% can fall another 50%, leaving buyers with a larger loss.
Buying a dip requires more than measuring how far the price has fallen. Investors should assess the project, market conditions, and risk before entering.
DISCLAIMER: This is my personal research, not financial advice.
#Bitcoin Price Prediction: What is Bitcoins next move?#
53
Xem bản dịch
IS WINTERMUTE LINKED TO THIS TON WALLET?
2.48M GRAM SENT TO EXCHANGES
Between November 1 and 14, a TON wallet identified as UQDQp9s8gsduffBq4sP4VbncBx25HgvxUHuUemLlZ76dMICS transferred 2.48 million GRAM to KuCoin and Gate through 85 transactions.
1. KuCoin: 1.39M GRAM
2. Gate: 1.09M GRAM
The activity raises questions about a possible connection to Wintermute, one of the cryptocurrency industry's largest market makers, providing liquidity across more than 60 exchanges.
TRACING THE WINTERMUTE CONNECTION
We started with Arkham Intelligence, a blockchain analytics platform that labels wallet addresses linked to known entities, including Wintermute.
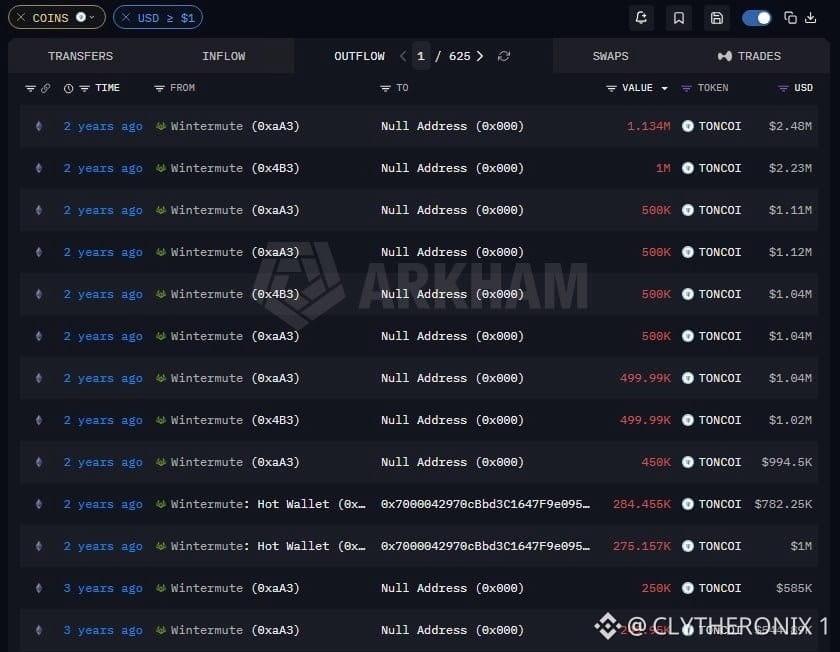
In 2024, an $ETH wallet labelled by Arkham as Wintermute burned 1.134 million wrapped TONCOIN to bridge funds back to TON.
The bridge recipient later transferred 155,604 GRAM to another TON wallet, UQAoF4hojDwh3ggyJBGVXe1JwSXx6iIPZJ95fmHOZgQkYPp9. Interestingly, this wallet also sent GRAM directly to the newer wallet, UQDQ…MICS.
THE SHARED EXCHANGE DEPOSIT CLUE
We compared the exchange deposit activities of both wallets and found that they used identical deposit addresses and memos at Bybit, KuCoin, and Gate.
Exchange deposit memos identify the customer account that should receive incoming funds.
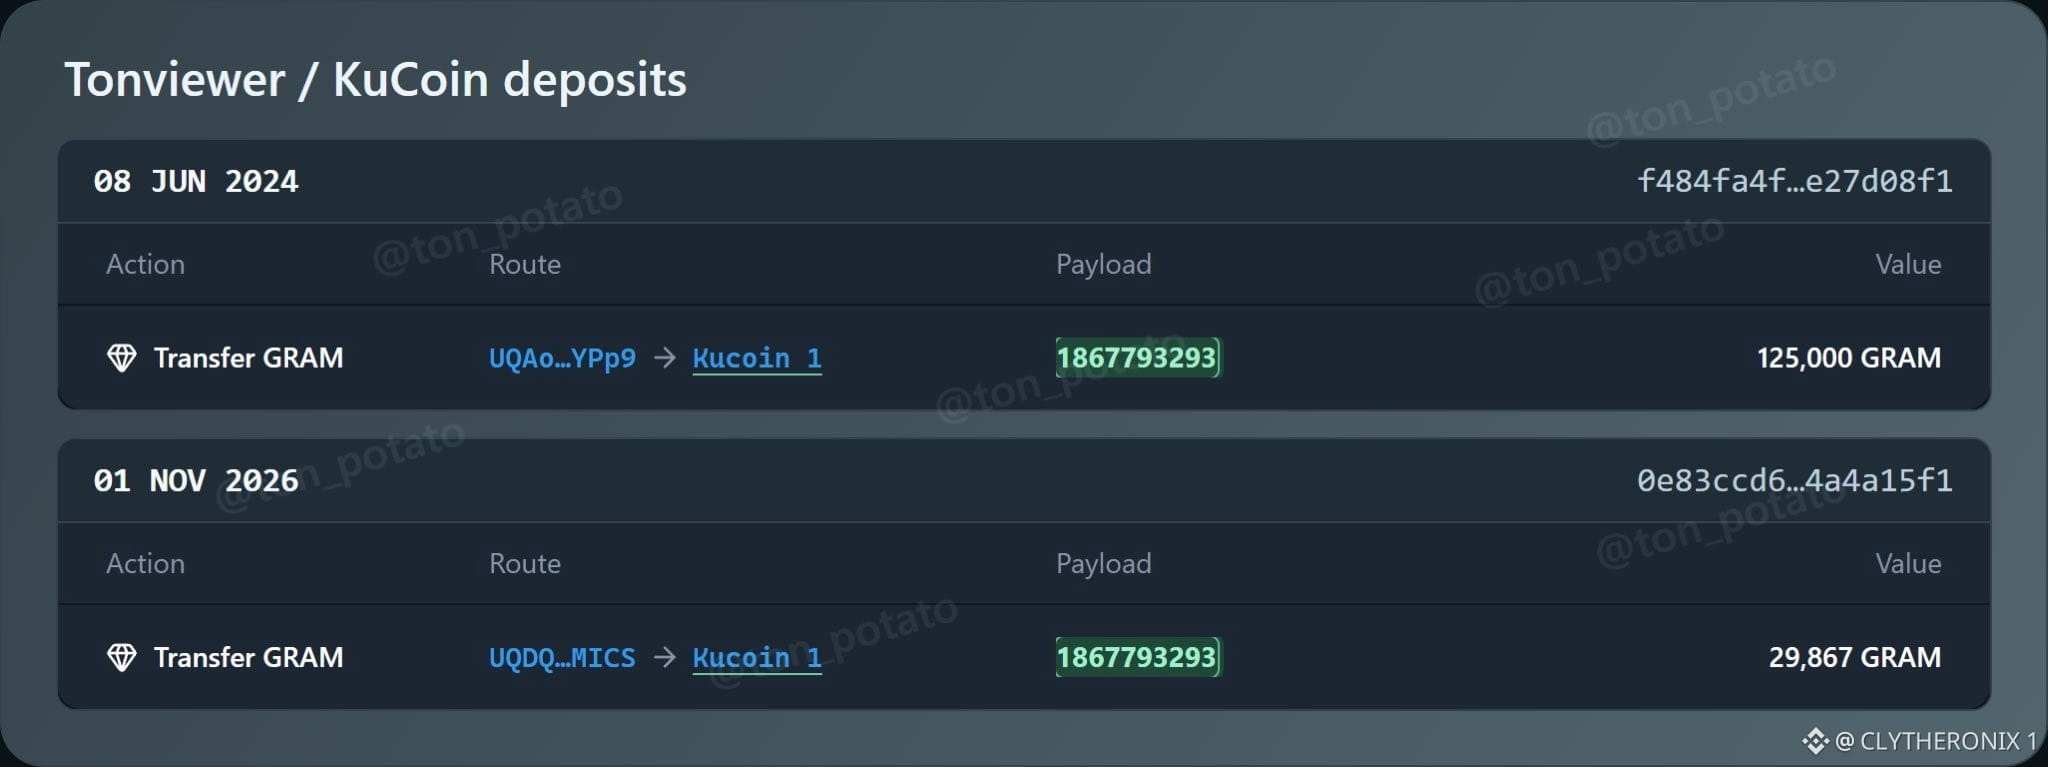
One notable example is KuCoin memo 1867793293, which appeared in transactions from both wallets more than two years apart, according to Tonviewer records.
This shared deposit infrastructure, combined with the earlier transaction trail, provides a notable link between the wallets and the address attributed to Wintermute.
WHAT DOES THIS ACTUALLY PROVE?
The evidence suggests a possible connection, but it does not establish that Wintermute controls UQDQ…MICS or directed its recent GRAM transfers.
Shared exchange deposit details may indicate a common exchange account or intermediary. The actual wallet controller and what happened to the $GRAM after reaching the exchanges remain unknown.
#Macro Insights#
IS WINTERMUTE LINKED TO THIS TON WALLET?
2.48M GRAM SENT TO EXCHANGES
Between November 1 and 14, a TON wallet identified as UQDQp9s8gsduffBq4sP4VbncBx25HgvxUHuUemLlZ76dMICS transferred 2.48 million GRAM to KuCoin and Gate through 85 transactions.
1. KuCoin: 1.39M GRAM
2. Gate: 1.09M GRAM
The activity raises questions about a possible connection to Wintermute, one of the cryptocurrency industry's largest market makers, providing liquidity across more than 60 exchanges.
TRACING THE WINTERMUTE CONNECTION
We started with Arkham Intelligence, a blockchain analytics platform that labels wallet addresses linked to known entities, including Wintermute.
In 2024, an $ETH wallet labelled by Arkham as Wintermute burned 1.134 million wrapped TONCOIN to bridge funds back to TON.
The bridge recipient later transferred 155,604 GRAM to another TON wallet, UQAoF4hojDwh3ggyJBGVXe1JwSXx6iIPZJ95fmHOZgQkYPp9. Interestingly, this wallet also sent GRAM directly to the newer wallet, UQDQ…MICS.
THE SHARED EXCHANGE DEPOSIT CLUE
We compared the exchange deposit activities of both wallets and found that they used identical deposit addresses and memos at Bybit, KuCoin, and Gate.
Exchange deposit memos identify the customer account that should receive incoming funds.
One notable example is KuCoin memo 1867793293, which appeared in transactions from both wallets more than two years apart, according to Tonviewer records.
This shared deposit infrastructure, combined with the earlier transaction trail, provides a notable link between the wallets and the address attributed to Wintermute.
WHAT DOES THIS ACTUALLY PROVE?
The evidence suggests a possible connection, but it does not establish that Wintermute controls UQDQ…MICS or directed its recent GRAM transfers.
Shared exchange deposit details may indicate a common exchange account or intermediary. The actual wallet controller and what happened to the $GRAM after reaching the exchanges remain unknown.
#Macro Insights#
2.48M GRAM SENT TO EXCHANGES
Between November 1 and 14, a TON wallet identified as UQDQp9s8gsduffBq4sP4VbncBx25HgvxUHuUemLlZ76dMICS transferred 2.48 million GRAM to KuCoin and Gate through 85 transactions.
1. KuCoin: 1.39M GRAM
2. Gate: 1.09M GRAM
The activity raises questions about a possible connection to Wintermute, one of the cryptocurrency industry's largest market makers, providing liquidity across more than 60 exchanges.
TRACING THE WINTERMUTE CONNECTION
We started with Arkham Intelligence, a blockchain analytics platform that labels wallet addresses linked to known entities, including Wintermute.
In 2024, an $ETH wallet labelled by Arkham as Wintermute burned 1.134 million wrapped TONCOIN to bridge funds back to TON.
The bridge recipient later transferred 155,604 GRAM to another TON wallet, UQAoF4hojDwh3ggyJBGVXe1JwSXx6iIPZJ95fmHOZgQkYPp9. Interestingly, this wallet also sent GRAM directly to the newer wallet, UQDQ…MICS.
THE SHARED EXCHANGE DEPOSIT CLUE
We compared the exchange deposit activities of both wallets and found that they used identical deposit addresses and memos at Bybit, KuCoin, and Gate.
Exchange deposit memos identify the customer account that should receive incoming funds.
One notable example is KuCoin memo 1867793293, which appeared in transactions from both wallets more than two years apart, according to Tonviewer records.
This shared deposit infrastructure, combined with the earlier transaction trail, provides a notable link between the wallets and the address attributed to Wintermute.
WHAT DOES THIS ACTUALLY PROVE?
The evidence suggests a possible connection, but it does not establish that Wintermute controls UQDQ…MICS or directed its recent GRAM transfers.
Shared exchange deposit details may indicate a common exchange account or intermediary. The actual wallet controller and what happened to the $GRAM after reaching the exchanges remain unknown.
#Macro Insights#
67
Xem bản dịch
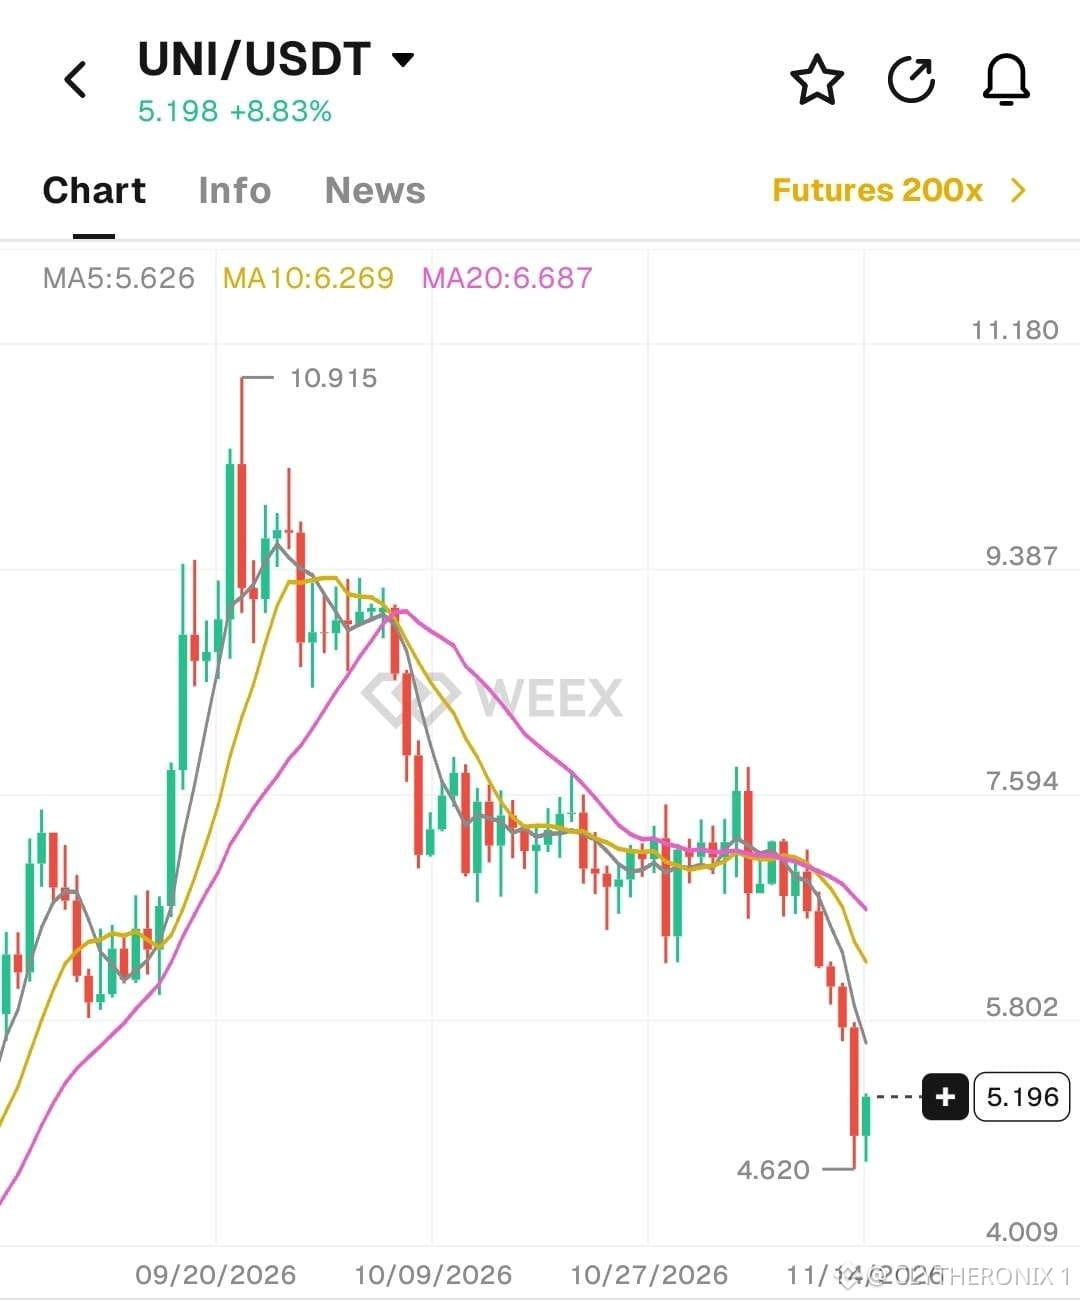
WEEX UNI AIRDROP: HOW I COMPLETED THE TASKS AND UNLOCKED MY REWARDS.
I discovered the WEEX $UNI airdrop through the Events section of the app and registered immediately on the official UNI Airdrop: Share $50K page.
(https://www.weex.com/events/promo/uni-airdrop-1112)
As a beginner, the process was quite straightforward once I got started.
I clicked Register Now, made a net deposit of over 100 USDT, and completed my first UNI spot trade. This qualified me for the 10 USDT bonus and first trade protection of up to 50 USDT if the trade resulted in a loss.
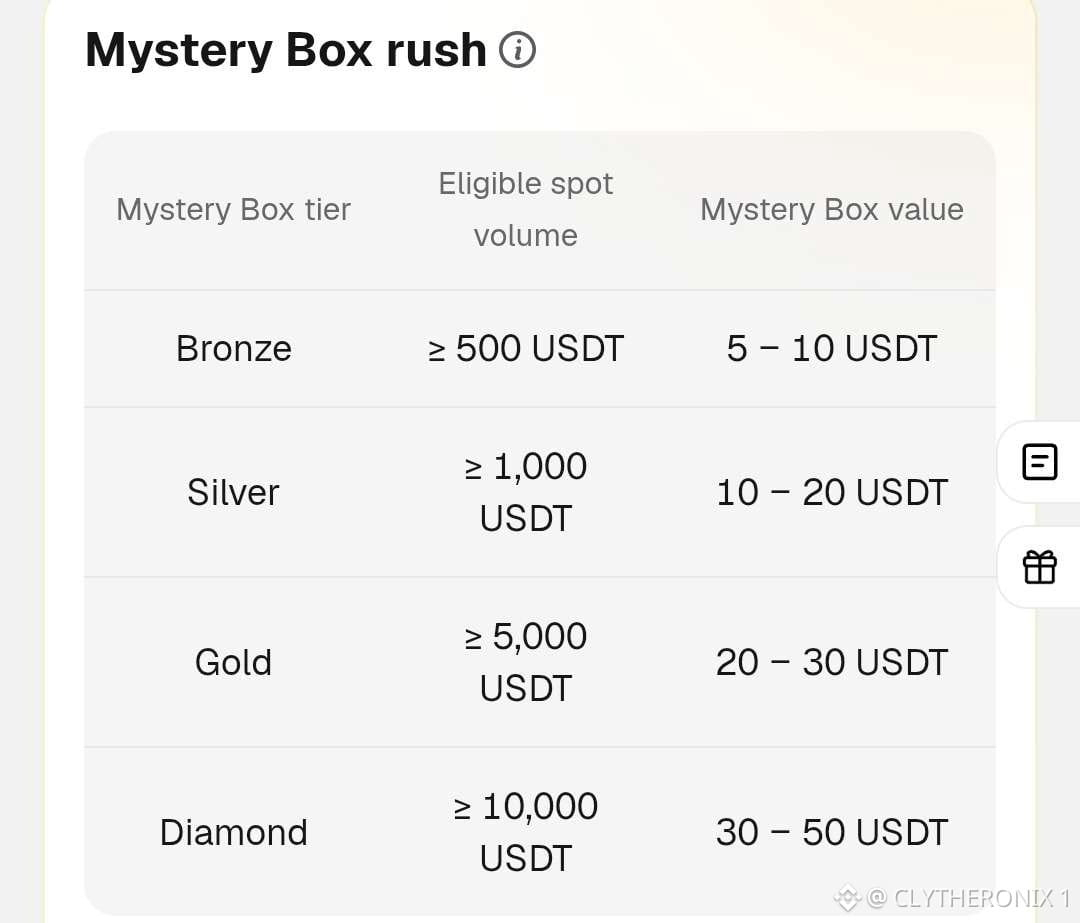
The screenshots show the exact tasks and mystery box reward table. The Bronze tier requires 500 USDT in trading volume and offers a reward between 5 and 10 USDT, while higher tiers require more trading volume.
One important thing to understand is that only trading volume accumulated after registration counts. Also, new users can receive only one reward across the events.
I started with a small first trade to understand how the protection works, then gradually added more trading volume towards unlocking the mystery box.
You can easily track your progress directly from the event page. The only part that needed extra attention was understanding net deposits. It means total deposits minus withdrawals, while internal transfers do not count.
Once I understood the requirements, everything became much easier.
Overall, it is a simple campaign for new users, but make sure you read the rules carefully, understand the requirements, and trade responsibly. Always check the event page for the latest countdown and updates.
Remember, this is not financial advice.
#Macro Insights#
WEEX UNI AIRDROP: HOW I COMPLETED THE TASKS AND UNLOCKED MY REWARDS.
I discovered the WEEX $UNI airdrop through the Events section of the app and registered immediately on the official UNI Airdrop: Share $50K page.
(https://www.weex.com/events/promo/uni-airdrop-1112)
As a beginner, the process was quite straightforward once I got started.
I clicked Register Now, made a net deposit of over 100 USDT, and completed my first UNI spot trade. This qualified me for the 10 USDT bonus and first trade protection of up to 50 USDT if the trade resulted in a loss.
The screenshots show the exact tasks and mystery box reward table. The Bronze tier requires 500 USDT in trading volume and offers a reward between 5 and 10 USDT, while higher tiers require more trading volume.
One important thing to understand is that only trading volume accumulated after registration counts. Also, new users can receive only one reward across the events.
I started with a small first trade to understand how the protection works, then gradually added more trading volume towards unlocking the mystery box.
You can easily track your progress directly from the event page. The only part that needed extra attention was understanding net deposits. It means total deposits minus withdrawals, while internal transfers do not count.
Once I understood the requirements, everything became much easier.
Overall, it is a simple campaign for new users, but make sure you read the rules carefully, understand the requirements, and trade responsibly. Always check the event page for the latest countdown and updates.
Remember, this is not financial advice.
#Macro Insights#
I discovered the WEEX $UNI airdrop through the Events section of the app and registered immediately on the official UNI Airdrop: Share $50K page.
(https://www.weex.com/events/promo/uni-airdrop-1112)
As a beginner, the process was quite straightforward once I got started.
I clicked Register Now, made a net deposit of over 100 USDT, and completed my first UNI spot trade. This qualified me for the 10 USDT bonus and first trade protection of up to 50 USDT if the trade resulted in a loss.
The screenshots show the exact tasks and mystery box reward table. The Bronze tier requires 500 USDT in trading volume and offers a reward between 5 and 10 USDT, while higher tiers require more trading volume.
One important thing to understand is that only trading volume accumulated after registration counts. Also, new users can receive only one reward across the events.
I started with a small first trade to understand how the protection works, then gradually added more trading volume towards unlocking the mystery box.
You can easily track your progress directly from the event page. The only part that needed extra attention was understanding net deposits. It means total deposits minus withdrawals, while internal transfers do not count.
Once I understood the requirements, everything became much easier.
Overall, it is a simple campaign for new users, but make sure you read the rules carefully, understand the requirements, and trade responsibly. Always check the event page for the latest countdown and updates.
Remember, this is not financial advice.
#Macro Insights#

Xem bản dịch
HOW TO QUALIFY AS A VALID USER AND SECURE YOUR MY AGE APP WHITELIST
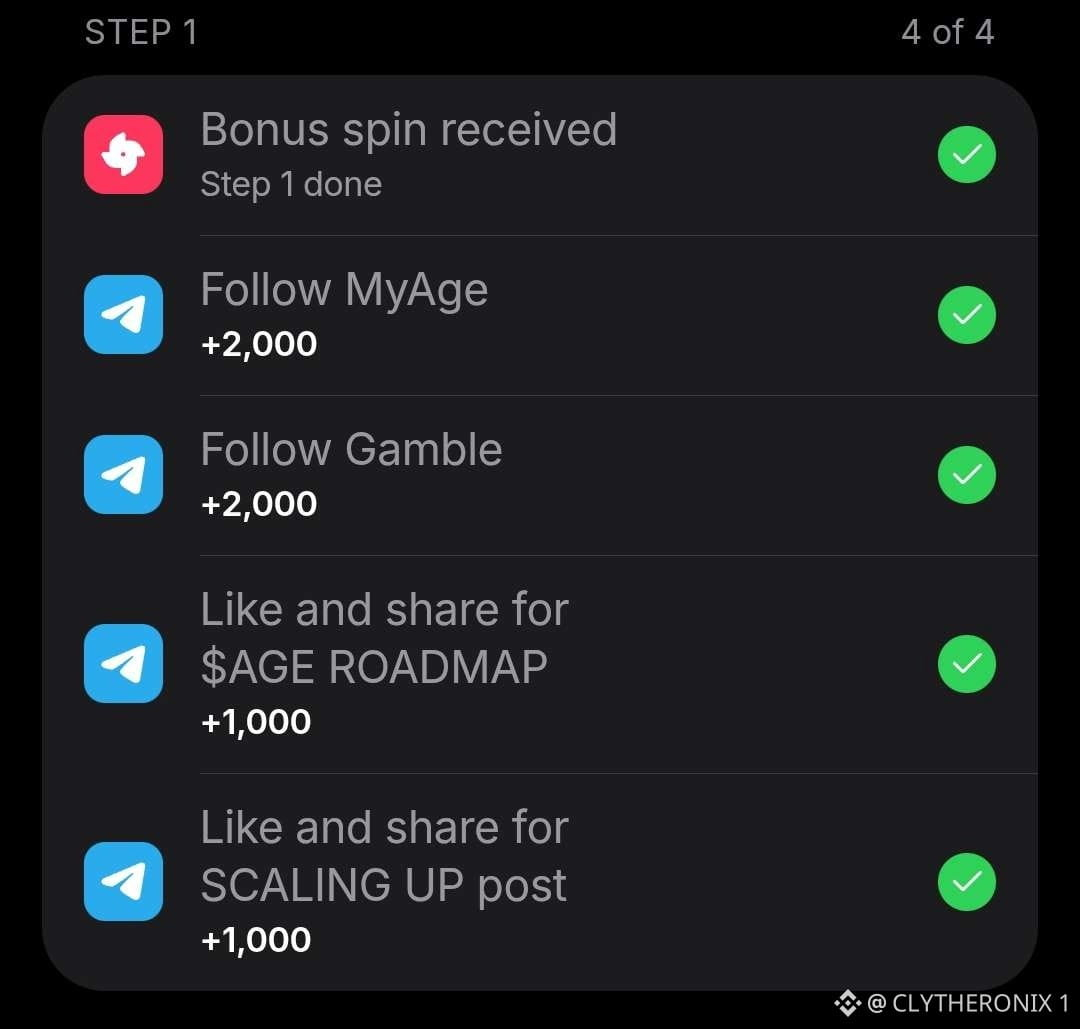
To qualify as a valid user and secure your whitelist spot on My Age App, make sure you complete the following steps.
1. COMPLETE THE FIRST 5 TASKS
The first five tasks are important because they help validate you as a genuine user.
In the past 48 hours, the My Age App team has reportedly removed 11,942 Sybil accounts. These accounts lost a total of 433.6M $AGE, 1,218 $GRAM, and 4,724 passes.
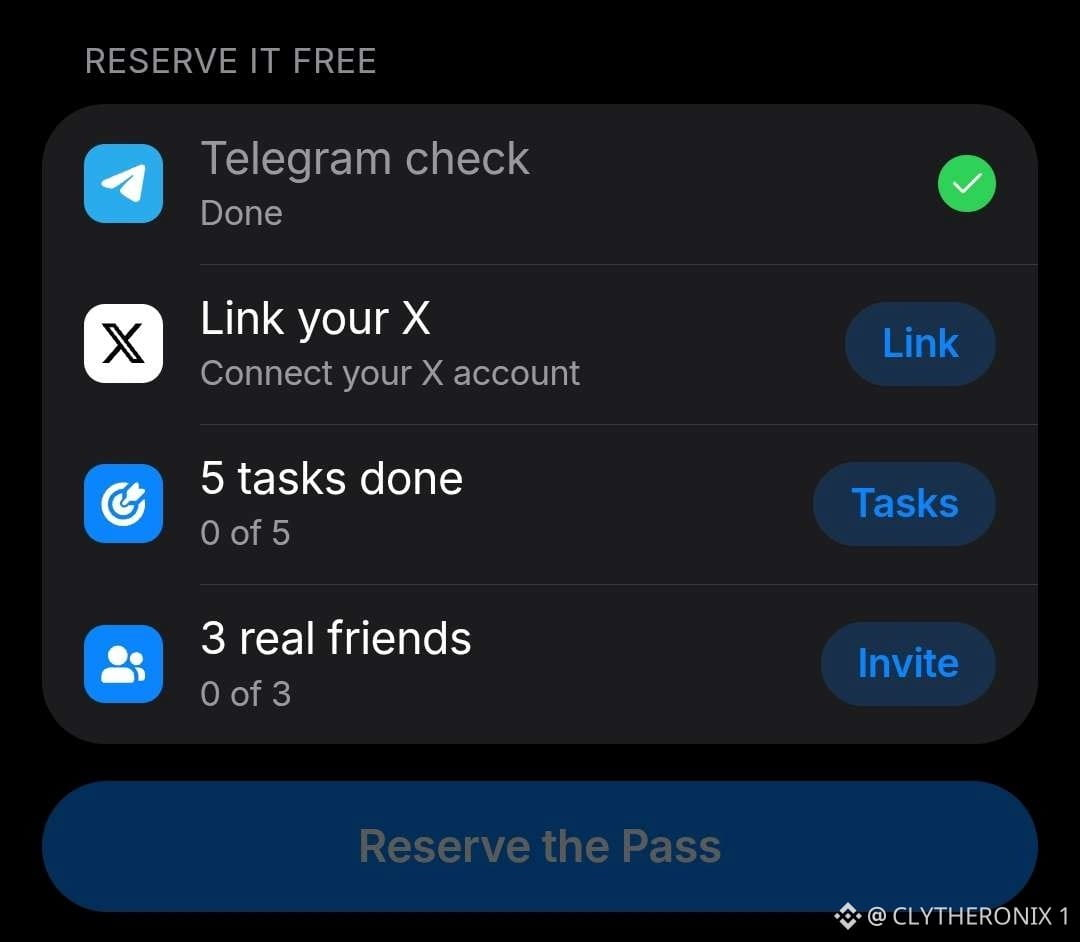
To avoid missing out, ensure you complete all five tasks shown in the attached image.
2. RESERVE YOUR WHITELIST SPOT
To reserve your whitelist spot, complete all four requirements:
1. Complete the Telegram verification.
2. Link your X account.
3. Complete the first five tasks.
4. Invite at least 3 friends.
⏰️ IMPORTANT: Don't just join the app and leave. Complete the required tasks, verify yourself, and reserve your whitelist spot.
Make sure everything is completed so you don't miss out!
⇒ link in comments.
HOW TO QUALIFY AS A VALID USER AND SECURE YOUR MY AGE APP WHITELIST
To qualify as a valid user and secure your whitelist spot on My Age App, make sure you complete the following steps.
1. COMPLETE THE FIRST 5 TASKS
The first five tasks are important because they help validate you as a genuine user.
In the past 48 hours, the My Age App team has reportedly removed 11,942 Sybil accounts. These accounts lost a total of 433.6M $AGE, 1,218 $GRAM, and 4,724 passes.
To avoid missing out, ensure you complete all five tasks shown in the attached image.
2. RESERVE YOUR WHITELIST SPOT
To reserve your whitelist spot, complete all four requirements:
1. Complete the Telegram verification.
2. Link your X account.
3. Complete the first five tasks.
4. Invite at least 3 friends.
⏰️ IMPORTANT: Don't just join the app and leave. Complete the required tasks, verify yourself, and reserve your whitelist spot.
Make sure everything is completed so you don't miss out!
⇒ link in comments.
To qualify as a valid user and secure your whitelist spot on My Age App, make sure you complete the following steps.
1. COMPLETE THE FIRST 5 TASKS
The first five tasks are important because they help validate you as a genuine user.
In the past 48 hours, the My Age App team has reportedly removed 11,942 Sybil accounts. These accounts lost a total of 433.6M $AGE, 1,218 $GRAM, and 4,724 passes.
To avoid missing out, ensure you complete all five tasks shown in the attached image.
2. RESERVE YOUR WHITELIST SPOT
To reserve your whitelist spot, complete all four requirements:
1. Complete the Telegram verification.
2. Link your X account.
3. Complete the first five tasks.
4. Invite at least 3 friends.
⏰️ IMPORTANT: Don't just join the app and leave. Complete the required tasks, verify yourself, and reserve your whitelist spot.
Make sure everything is completed so you don't miss out!
⇒ link in comments.
52
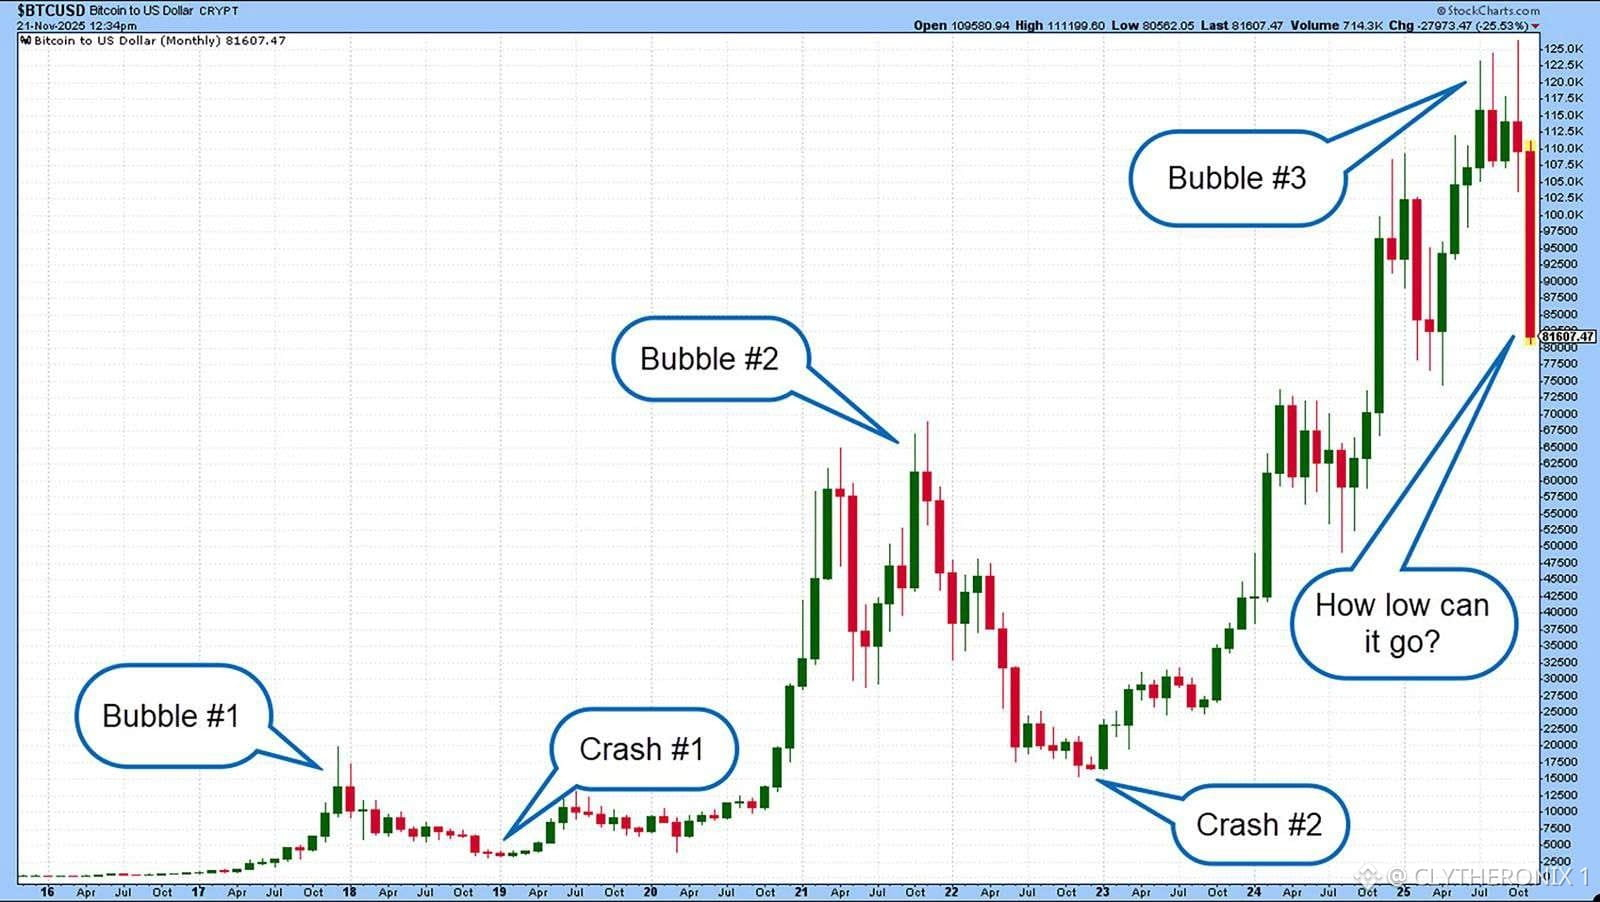
Nhu cầu Bitcoin giảm xuống mức thấp nhất trong 9 tháng là một dấu hiệu cảnh báo, nhưng điều đó không đồng nghĩa đáy đã hình thành.
Tôi đang theo dõi vùng giá từ 58.500 USD đến 63.000 USD như một vùng đáy tiềm năng. Mốc 58.500 USD đặc biệt quan trọng vì gần với giá thực hiện của Bitcoin và mức đáy trong tháng 6.
Tuy nhiên, để xác nhận cần nhiều hơn là giá được hỗ trợ. Dòng vốn rút khỏi ETF cần chậm lại, nhu cầu giao ngay phải phục hồi và những người nắm giữ dài hạn nên tiếp tục tích lũy.
Nếu $BTC thủng mốc 58.500 USD, giá vẫn có thể giảm sâu hơn. Hiện tại, tôi muốn chờ áp lực mua mạnh hơn thay vì vội vàng tuyên bố đáy đã hình thành.
#Phân tích giá BTC#
Nhu cầu Bitcoin giảm xuống mức thấp nhất trong 9 tháng là một dấu hiệu cảnh báo, nhưng điều đó không đồng nghĩa đáy đã hình thành.
Tôi đang theo dõi vùng giá từ 58.500 USD đến 63.000 USD như một vùng đáy tiềm năng. Mốc 58.500 USD đặc biệt quan trọng vì gần với giá thực hiện của Bitcoin và mức đáy trong tháng 6.
Tuy nhiên, để xác nhận cần nhiều hơn là giá được hỗ trợ. Dòng vốn rút khỏi ETF cần chậm lại, nhu cầu giao ngay phải phục hồi và những người nắm giữ dài hạn nên tiếp tục tích lũy.
Nếu $BTC thủng mốc 58.500 USD, giá vẫn có thể giảm sâu hơn. Hiện tại, tôi muốn chờ áp lực mua mạnh hơn thay vì vội vàng tuyên bố đáy đã hình thành.
#Phân tích giá BTC#
Tôi đang theo dõi vùng giá từ 58.500 USD đến 63.000 USD như một vùng đáy tiềm năng. Mốc 58.500 USD đặc biệt quan trọng vì gần với giá thực hiện của Bitcoin và mức đáy trong tháng 6.
Tuy nhiên, để xác nhận cần nhiều hơn là giá được hỗ trợ. Dòng vốn rút khỏi ETF cần chậm lại, nhu cầu giao ngay phải phục hồi và những người nắm giữ dài hạn nên tiếp tục tích lũy.
Nếu $BTC thủng mốc 58.500 USD, giá vẫn có thể giảm sâu hơn. Hiện tại, tôi muốn chờ áp lực mua mạnh hơn thay vì vội vàng tuyên bố đáy đã hình thành.
#Phân tích giá BTC#
75
Xem bản dịch
BERACHAIN REBOUNDS 9.18% AS PRICE TESTS SHORT TERM RECOVERY.
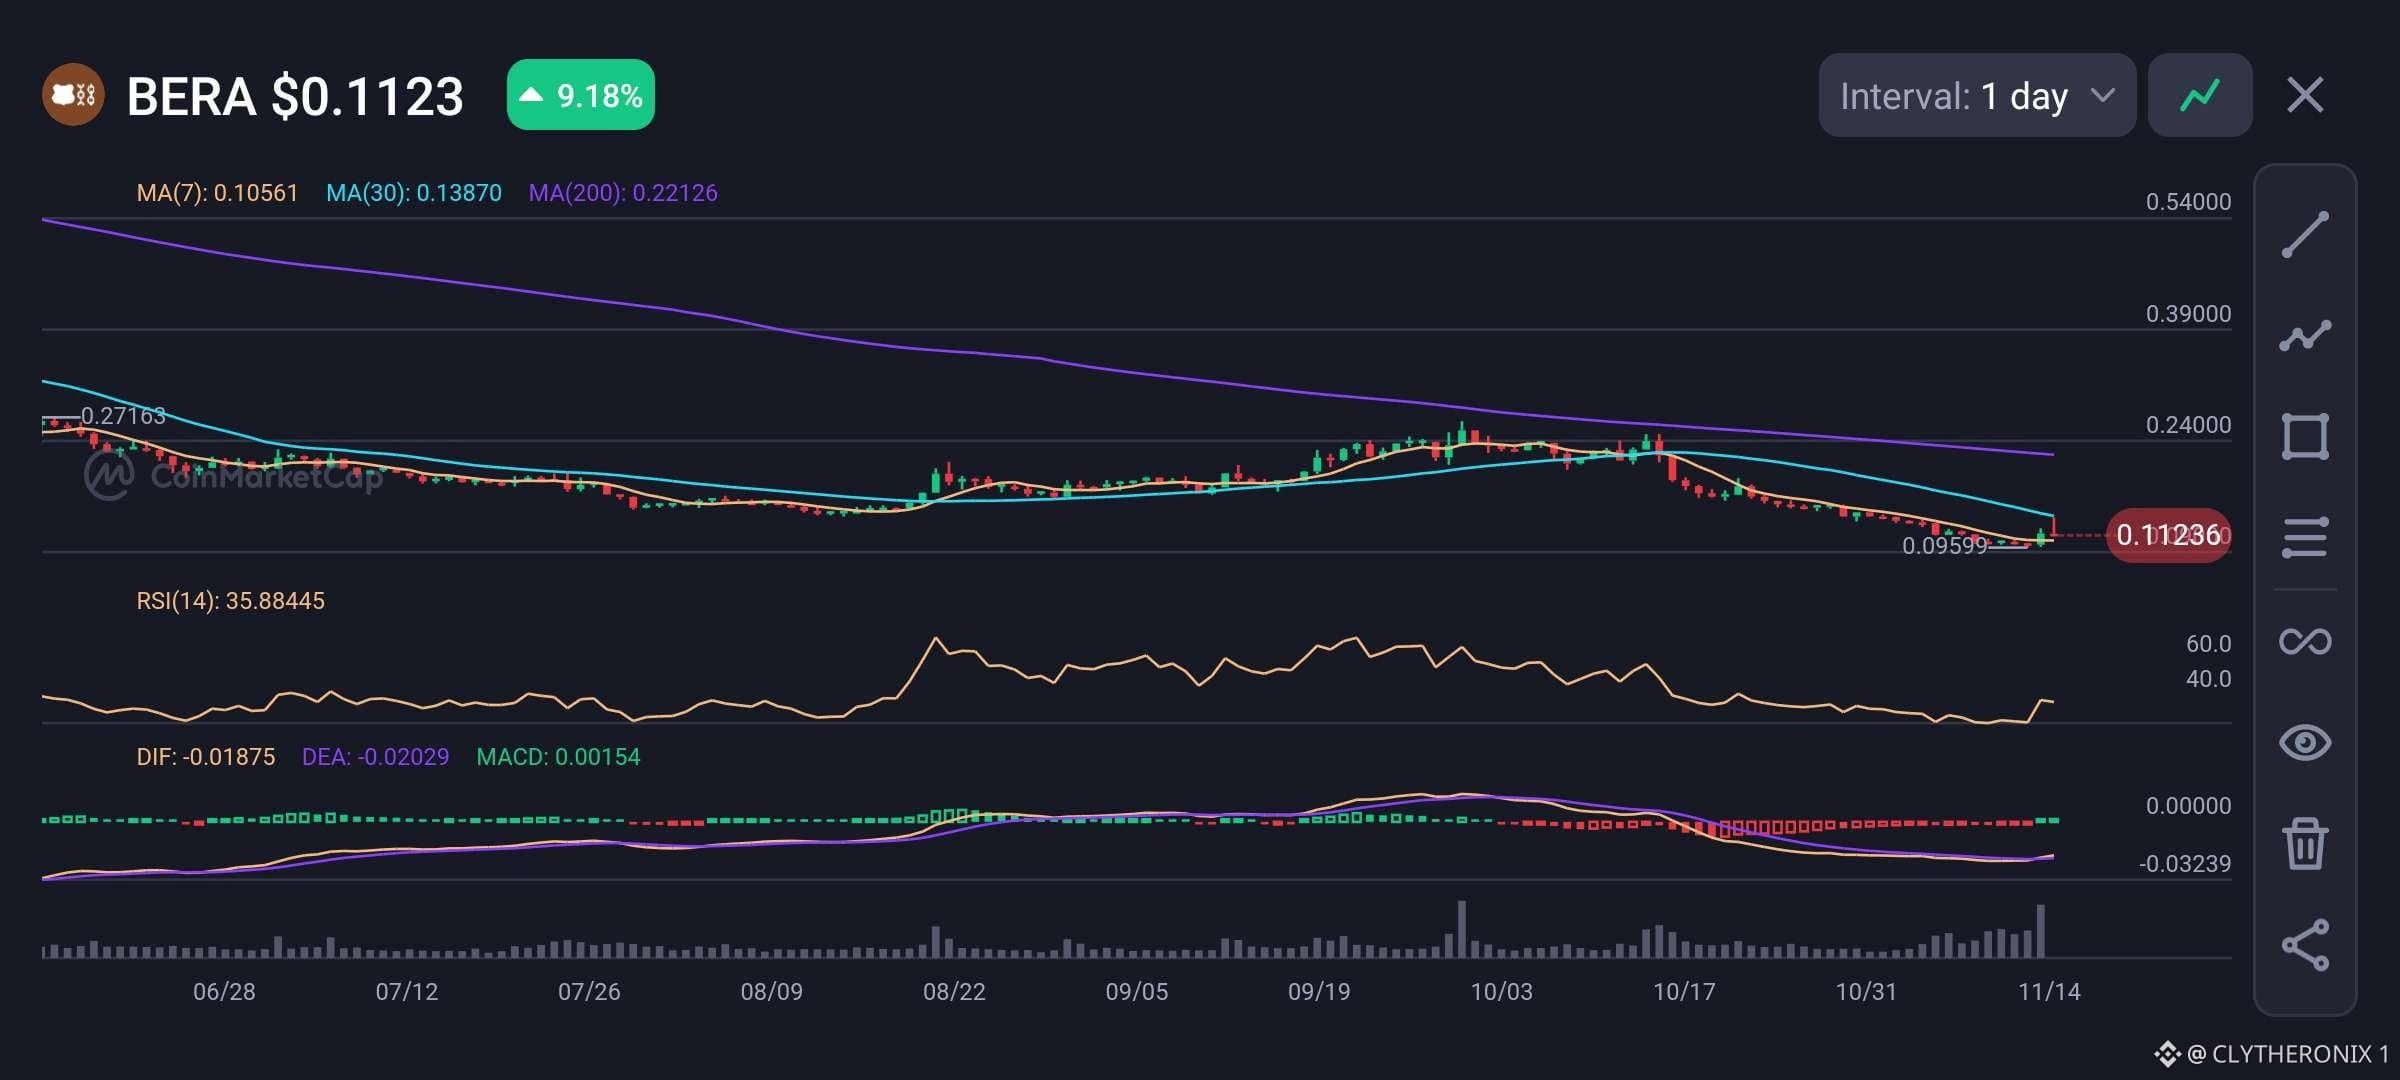
I observed $BERA trading at $0.1123, up 9.18% on the daily chart following a prolonged decline towards the $0.09599 support zone. The recovery suggests renewed buying interest after weeks of downward pressure.
Price is now above MA(7) at $0.10561 but remains below MA(30) at $0.13870 and MA(200) at $0.22126. RSI(14) sits at 35.88, showing weak momentum despite the latest recovery.
Meanwhile, MACD shows DIF at -0.01875 above DEA at -0.02029, with a positive histogram of 0.00154, indicating an early bullish crossover.
In my view, $BERA is showing initial signs of recovery, but its broader trend remains bearish. The $0.09599 level is the immediate support to watch, while $0.13870 is the next major resistance. A sustained move above MA(30) could strengthen the recovery, while failure to hold current levels may expose the recent support again.
DISCLAIMER: This is my personal market analysis, not financial advice.
#Altcoin Season#
BERACHAIN REBOUNDS 9.18% AS PRICE TESTS SHORT TERM RECOVERY.
I observed $BERA trading at $0.1123, up 9.18% on the daily chart following a prolonged decline towards the $0.09599 support zone. The recovery suggests renewed buying interest after weeks of downward pressure.
Price is now above MA(7) at $0.10561 but remains below MA(30) at $0.13870 and MA(200) at $0.22126. RSI(14) sits at 35.88, showing weak momentum despite the latest recovery.
Meanwhile, MACD shows DIF at -0.01875 above DEA at -0.02029, with a positive histogram of 0.00154, indicating an early bullish crossover.
In my view, $BERA is showing initial signs of recovery, but its broader trend remains bearish. The $0.09599 level is the immediate support to watch, while $0.13870 is the next major resistance. A sustained move above MA(30) could strengthen the recovery, while failure to hold current levels may expose the recent support again.
DISCLAIMER: This is my personal market analysis, not financial advice.
#Altcoin Season#
I observed $BERA trading at $0.1123, up 9.18% on the daily chart following a prolonged decline towards the $0.09599 support zone. The recovery suggests renewed buying interest after weeks of downward pressure.
Price is now above MA(7) at $0.10561 but remains below MA(30) at $0.13870 and MA(200) at $0.22126. RSI(14) sits at 35.88, showing weak momentum despite the latest recovery.
Meanwhile, MACD shows DIF at -0.01875 above DEA at -0.02029, with a positive histogram of 0.00154, indicating an early bullish crossover.
In my view, $BERA is showing initial signs of recovery, but its broader trend remains bearish. The $0.09599 level is the immediate support to watch, while $0.13870 is the next major resistance. A sustained move above MA(30) could strengthen the recovery, while failure to hold current levels may expose the recent support again.
DISCLAIMER: This is my personal market analysis, not financial advice.
#Altcoin Season#
65
Xem bản dịch
AKEDO SURGES 311% AS BUYING MOMENTUM RETURNS.
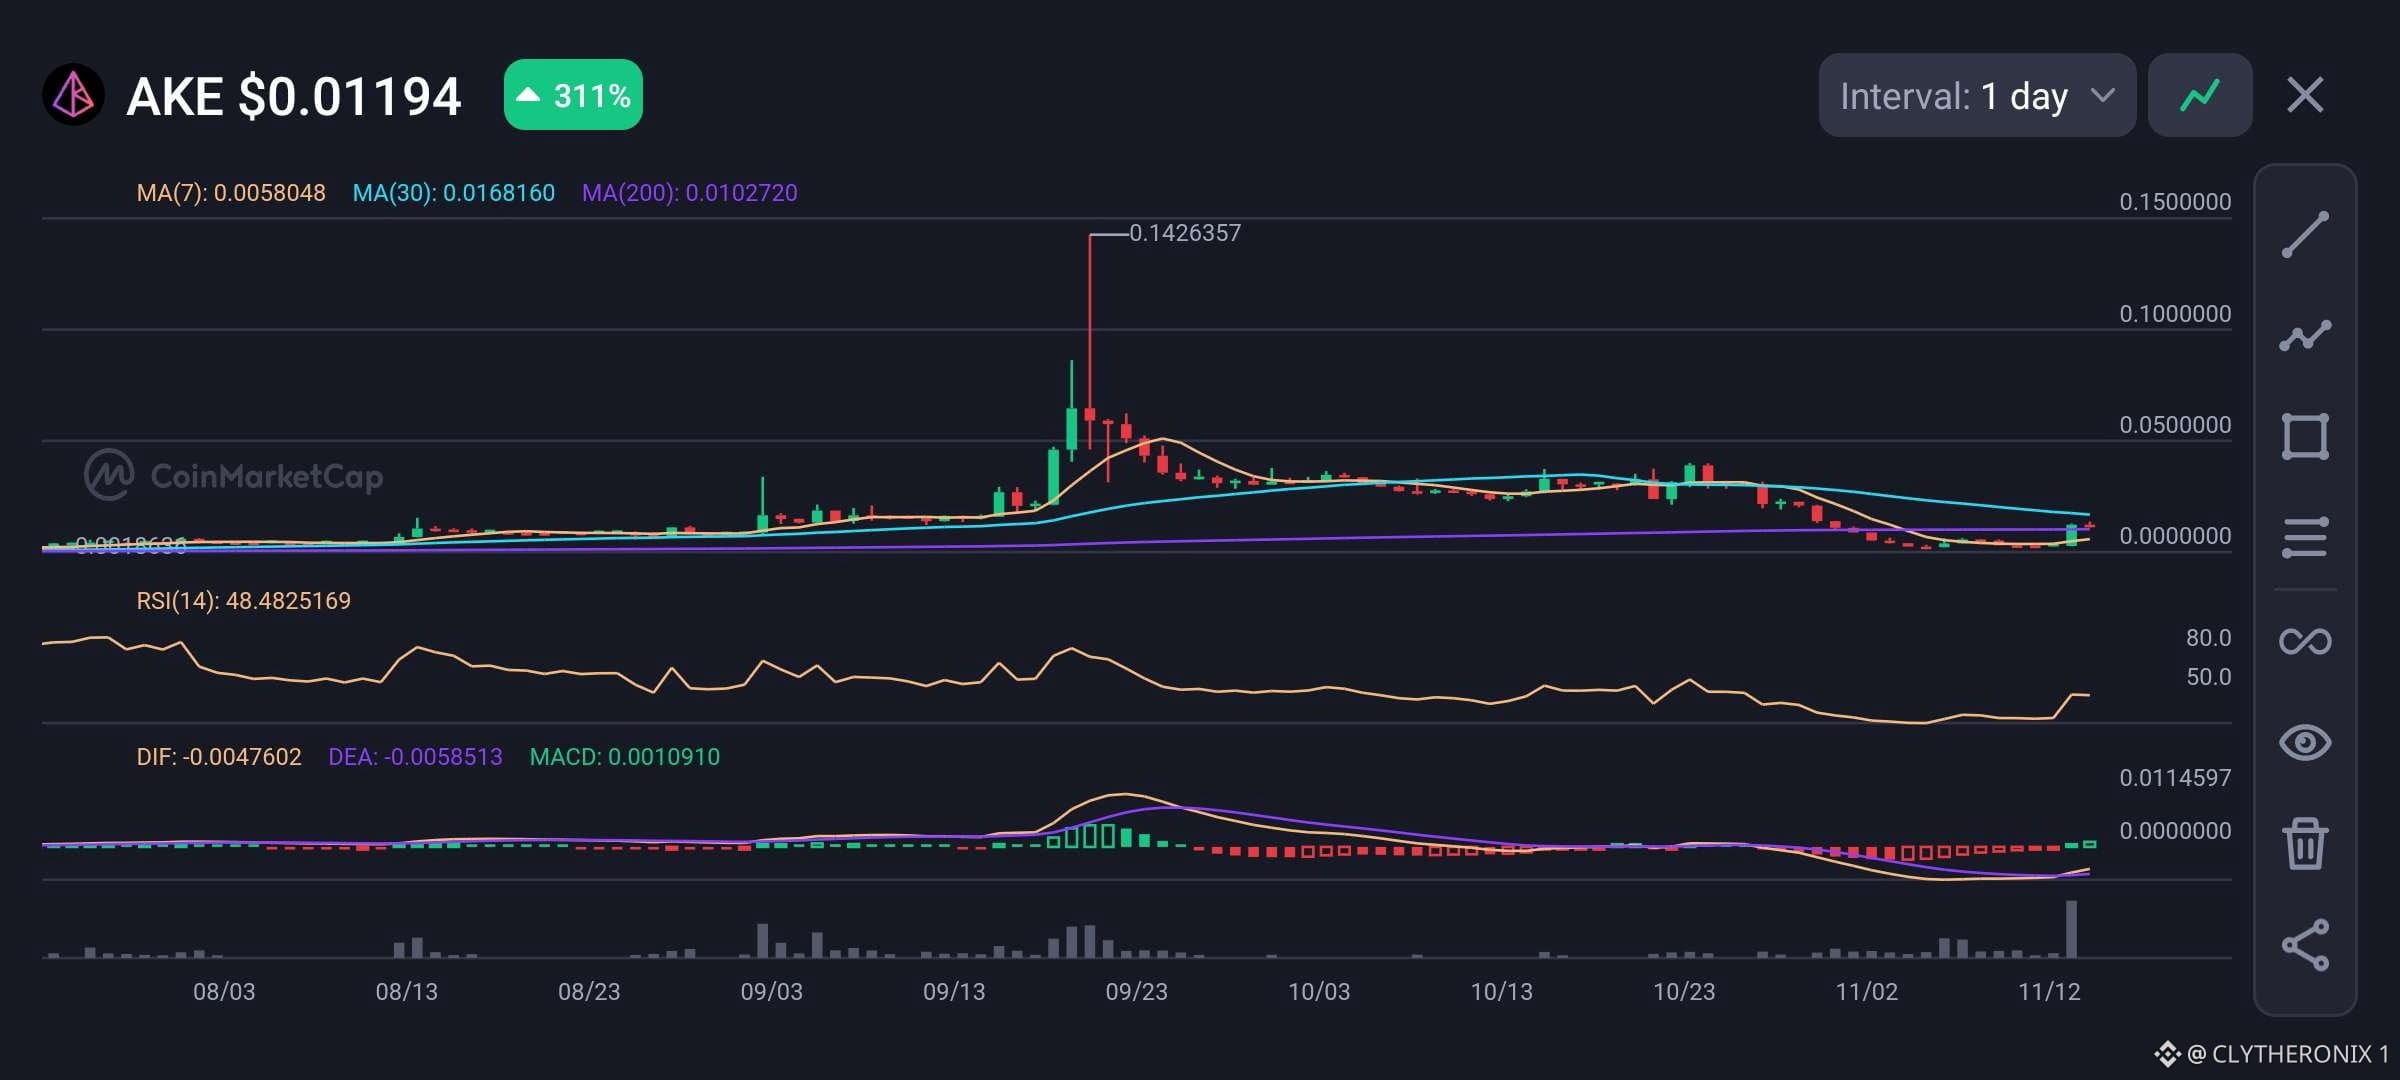
$AKE is currently trading at $0.01194, up 311% in 24 hours following a strong recovery from its $0.001963 support zone. The rally has pushed price above the 200-day moving average at $0.01027, signalling improving momentum.
Price is now above MA(7) at $0.00580 and MA(200), but remains below MA(30) at $0.01681. The MACD histogram has turned positive at 0.001091, with DIF above DEA, confirming a bullish crossover. Meanwhile, RSI at 48.48 remains neutral, leaving room for further movement.
In my view, $AKE is showing signs of a possible trend reversal after its prolonged consolidation. However, sustaining this rally will depend on continued buying pressure.
Support now sits around $0.01027, while resistance stands at $0.01681. A daily close above this level could strengthen the recovery. Traders should also watch volume to determine whether the current momentum is sustainable.
DISCLAIMER: This is my personal market analysis, not financial advice.
#Altcoin Season#
AKEDO SURGES 311% AS BUYING MOMENTUM RETURNS.
$AKE is currently trading at $0.01194, up 311% in 24 hours following a strong recovery from its $0.001963 support zone. The rally has pushed price above the 200-day moving average at $0.01027, signalling improving momentum.
Price is now above MA(7) at $0.00580 and MA(200), but remains below MA(30) at $0.01681. The MACD histogram has turned positive at 0.001091, with DIF above DEA, confirming a bullish crossover. Meanwhile, RSI at 48.48 remains neutral, leaving room for further movement.
In my view, $AKE is showing signs of a possible trend reversal after its prolonged consolidation. However, sustaining this rally will depend on continued buying pressure.
Support now sits around $0.01027, while resistance stands at $0.01681. A daily close above this level could strengthen the recovery. Traders should also watch volume to determine whether the current momentum is sustainable.
DISCLAIMER: This is my personal market analysis, not financial advice.
#Altcoin Season#
$AKE is currently trading at $0.01194, up 311% in 24 hours following a strong recovery from its $0.001963 support zone. The rally has pushed price above the 200-day moving average at $0.01027, signalling improving momentum.
Price is now above MA(7) at $0.00580 and MA(200), but remains below MA(30) at $0.01681. The MACD histogram has turned positive at 0.001091, with DIF above DEA, confirming a bullish crossover. Meanwhile, RSI at 48.48 remains neutral, leaving room for further movement.
In my view, $AKE is showing signs of a possible trend reversal after its prolonged consolidation. However, sustaining this rally will depend on continued buying pressure.
Support now sits around $0.01027, while resistance stands at $0.01681. A daily close above this level could strengthen the recovery. Traders should also watch volume to determine whether the current momentum is sustainable.
DISCLAIMER: This is my personal market analysis, not financial advice.
#Altcoin Season#
76
Xem bản dịch
COINMARKETCAP 20 INDEX DTF (CMC20) FALLS BELOW 200 DAY MOVING AVERAGE.
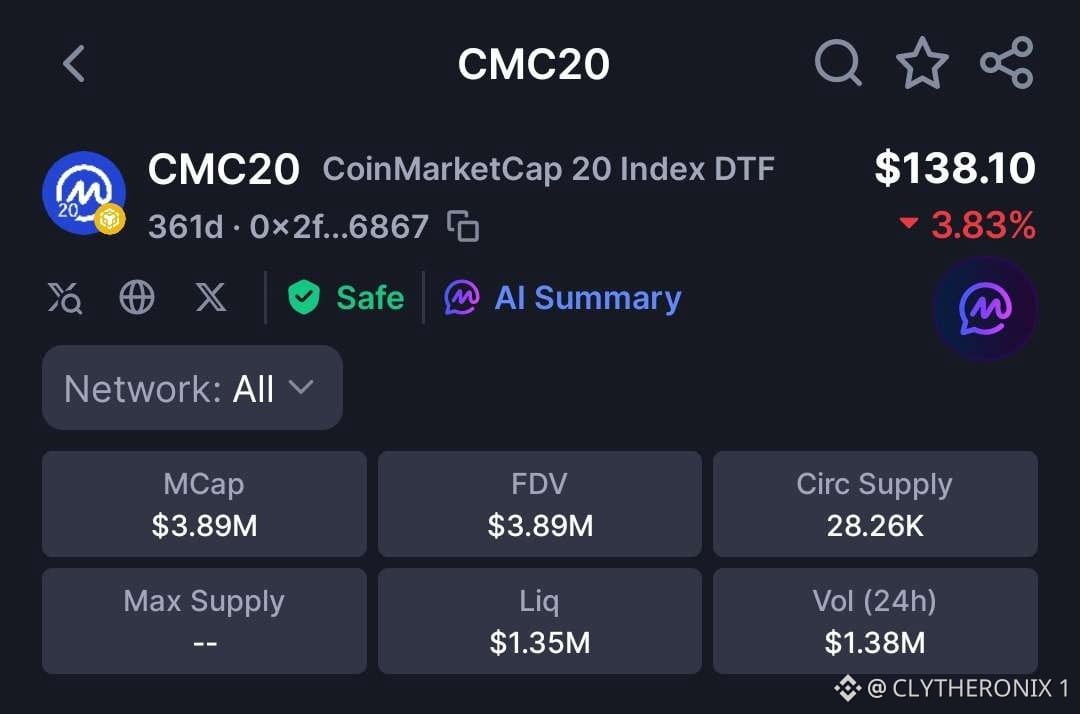
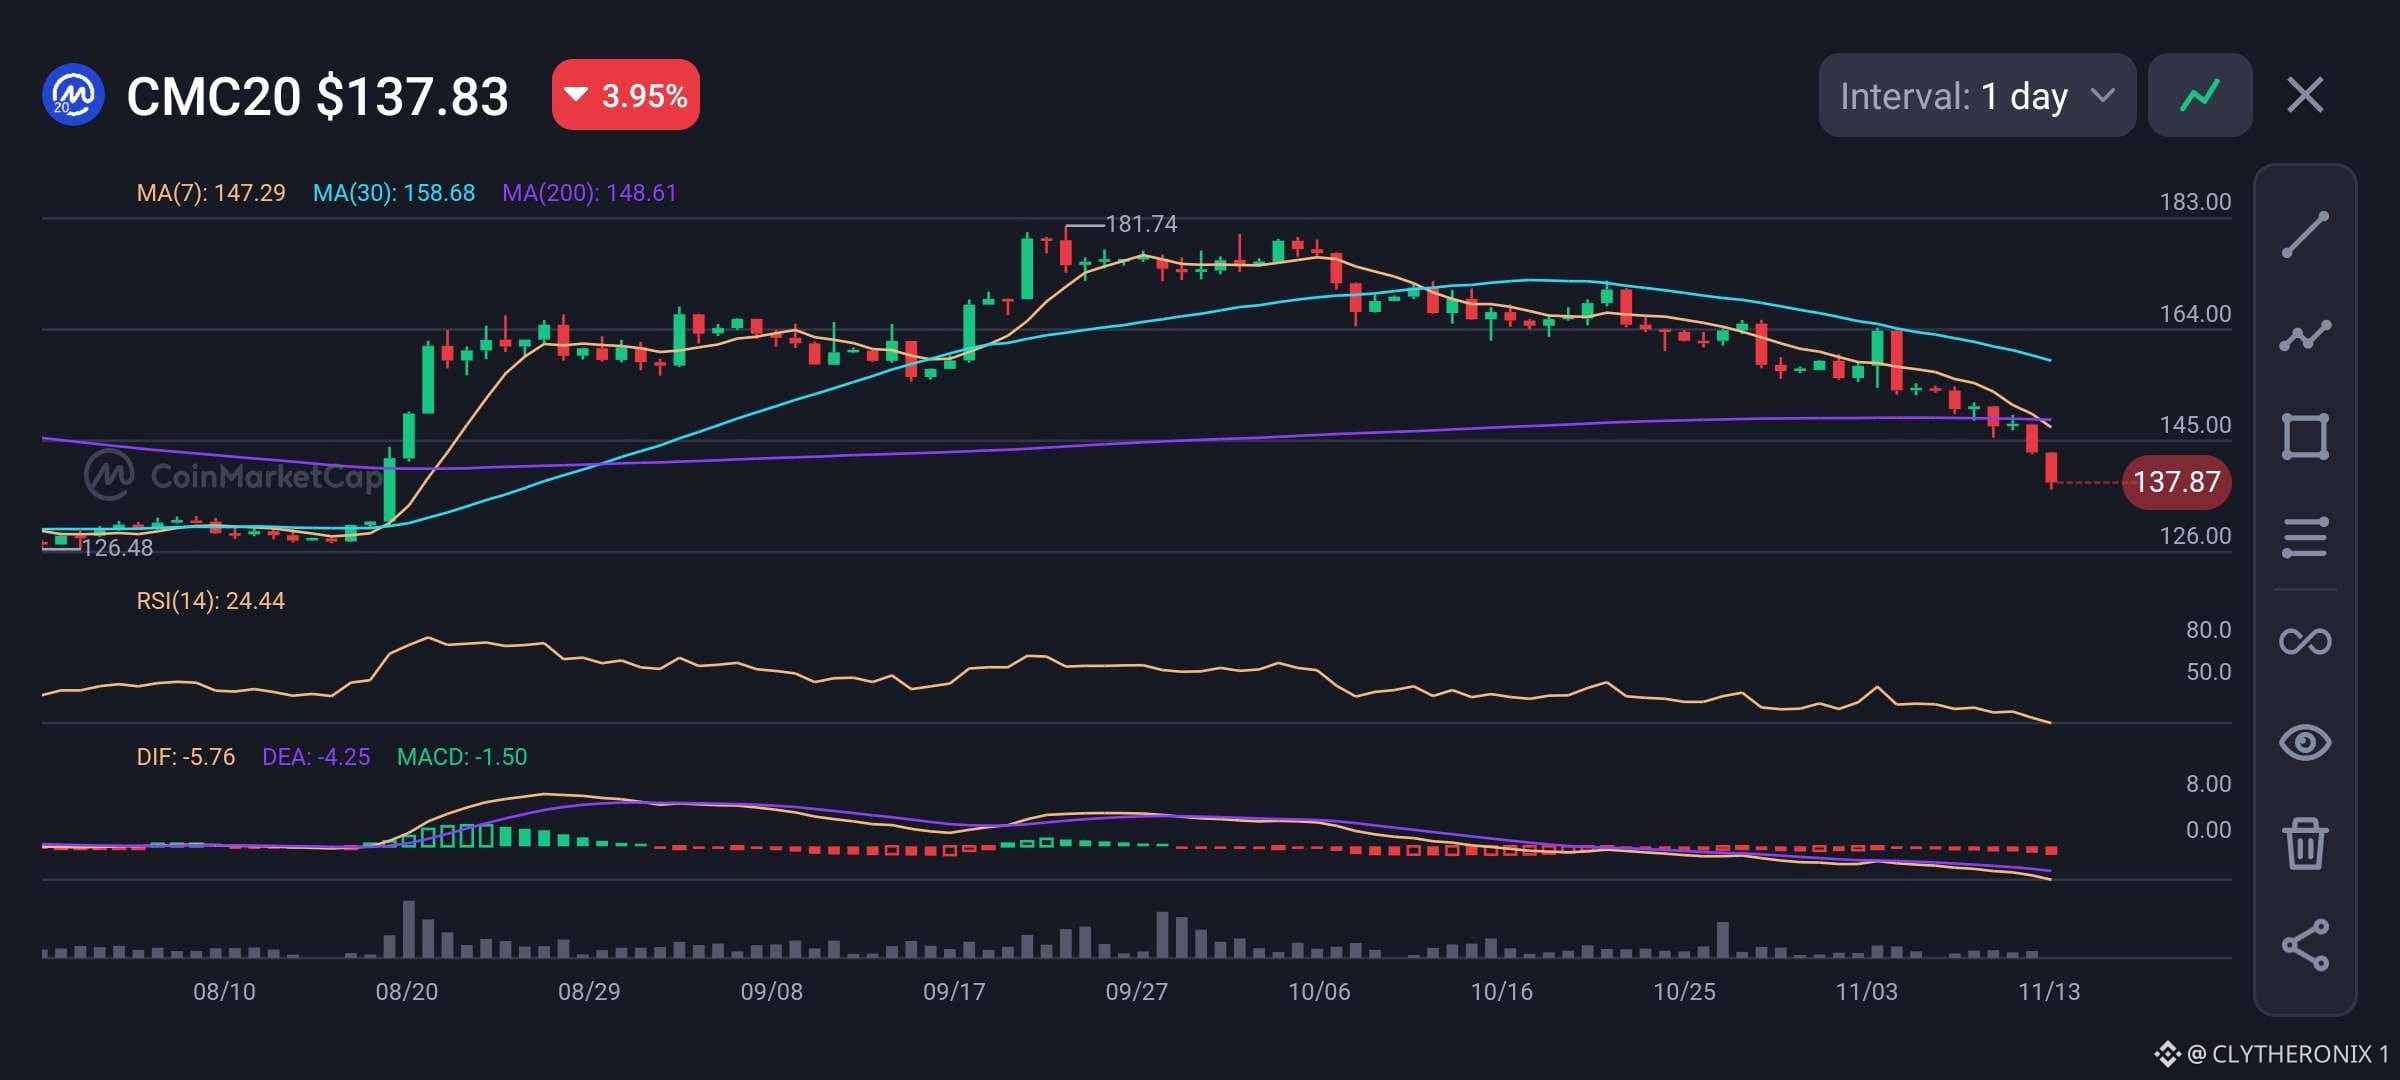
I observed $CMC20 trading at $137.83, down 3.83%, after breaking below its 200-day moving average.
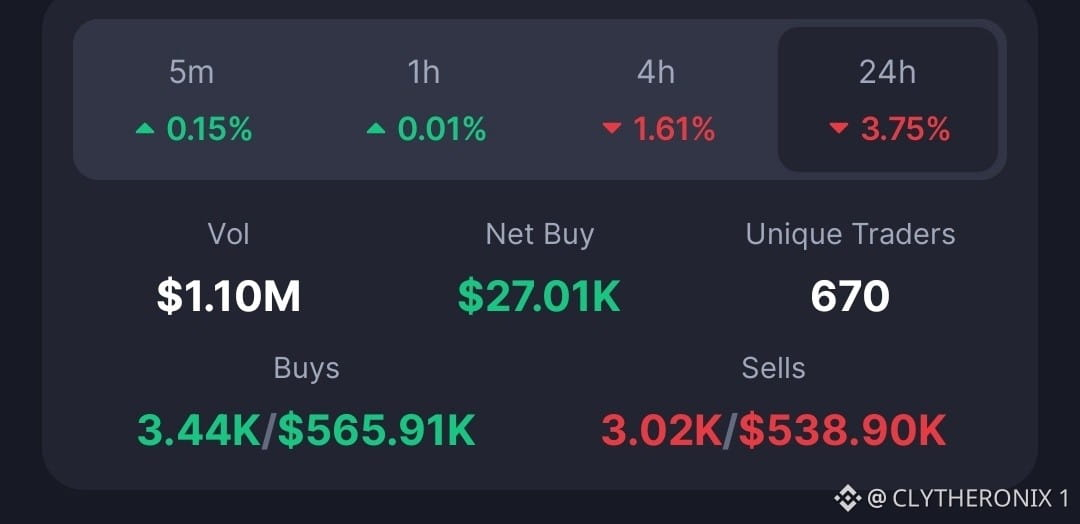
The index has a $3.89M market cap, with $1.10M to $1.38M in 24-hour volume.
Interestingly, buying volume of $565.91K slightly exceeds selling volume of $538.90K, producing a positive net buy of $27.01K.
Price of $CMC20 remains below MA(7) at $147.29, MA(30) at $158.68, and MA(200) at $148.61. RSI at 24.44 signals oversold conditions, while the MACD histogram at -1.50 confirms continued bearish momentum.
In my view, losing the 200-day average reflects growing weakness across the top 20 crypto basket.
However, the positive buying pressure could support a short-term recovery if it continues. The key support remains $126.48, while resistance sits between $147.29 and $148.61. A break towards $145 could offer relief, but further selling may expose the August low.
DISCLAIMER: This is my personal market analysis, not financial advice.
#Macro Insights#
COINMARKETCAP 20 INDEX DTF (CMC20) FALLS BELOW 200 DAY MOVING AVERAGE.
I observed $CMC20 trading at $137.83, down 3.83%, after breaking below its 200-day moving average.
The index has a $3.89M market cap, with $1.10M to $1.38M in 24-hour volume.
Interestingly, buying volume of $565.91K slightly exceeds selling volume of $538.90K, producing a positive net buy of $27.01K.
Price of $CMC20 remains below MA(7) at $147.29, MA(30) at $158.68, and MA(200) at $148.61. RSI at 24.44 signals oversold conditions, while the MACD histogram at -1.50 confirms continued bearish momentum.
In my view, losing the 200-day average reflects growing weakness across the top 20 crypto basket.
However, the positive buying pressure could support a short-term recovery if it continues. The key support remains $126.48, while resistance sits between $147.29 and $148.61. A break towards $145 could offer relief, but further selling may expose the August low.
DISCLAIMER: This is my personal market analysis, not financial advice.
#Macro Insights#
I observed $CMC20 trading at $137.83, down 3.83%, after breaking below its 200-day moving average.
The index has a $3.89M market cap, with $1.10M to $1.38M in 24-hour volume.
Interestingly, buying volume of $565.91K slightly exceeds selling volume of $538.90K, producing a positive net buy of $27.01K.
Price of $CMC20 remains below MA(7) at $147.29, MA(30) at $158.68, and MA(200) at $148.61. RSI at 24.44 signals oversold conditions, while the MACD histogram at -1.50 confirms continued bearish momentum.
In my view, losing the 200-day average reflects growing weakness across the top 20 crypto basket.
However, the positive buying pressure could support a short-term recovery if it continues. The key support remains $126.48, while resistance sits between $147.29 and $148.61. A break towards $145 could offer relief, but further selling may expose the August low.
DISCLAIMER: This is my personal market analysis, not financial advice.
#Macro Insights#
78
Xem bản dịch
CMC20 TESTS 200-DAY MOVING AVERAGE AS SELLING PRESSURE GROWS.
$CMC20 APPROACHES OVERSOLD TERRITORY AS BEARS MAINTAIN CONTROL
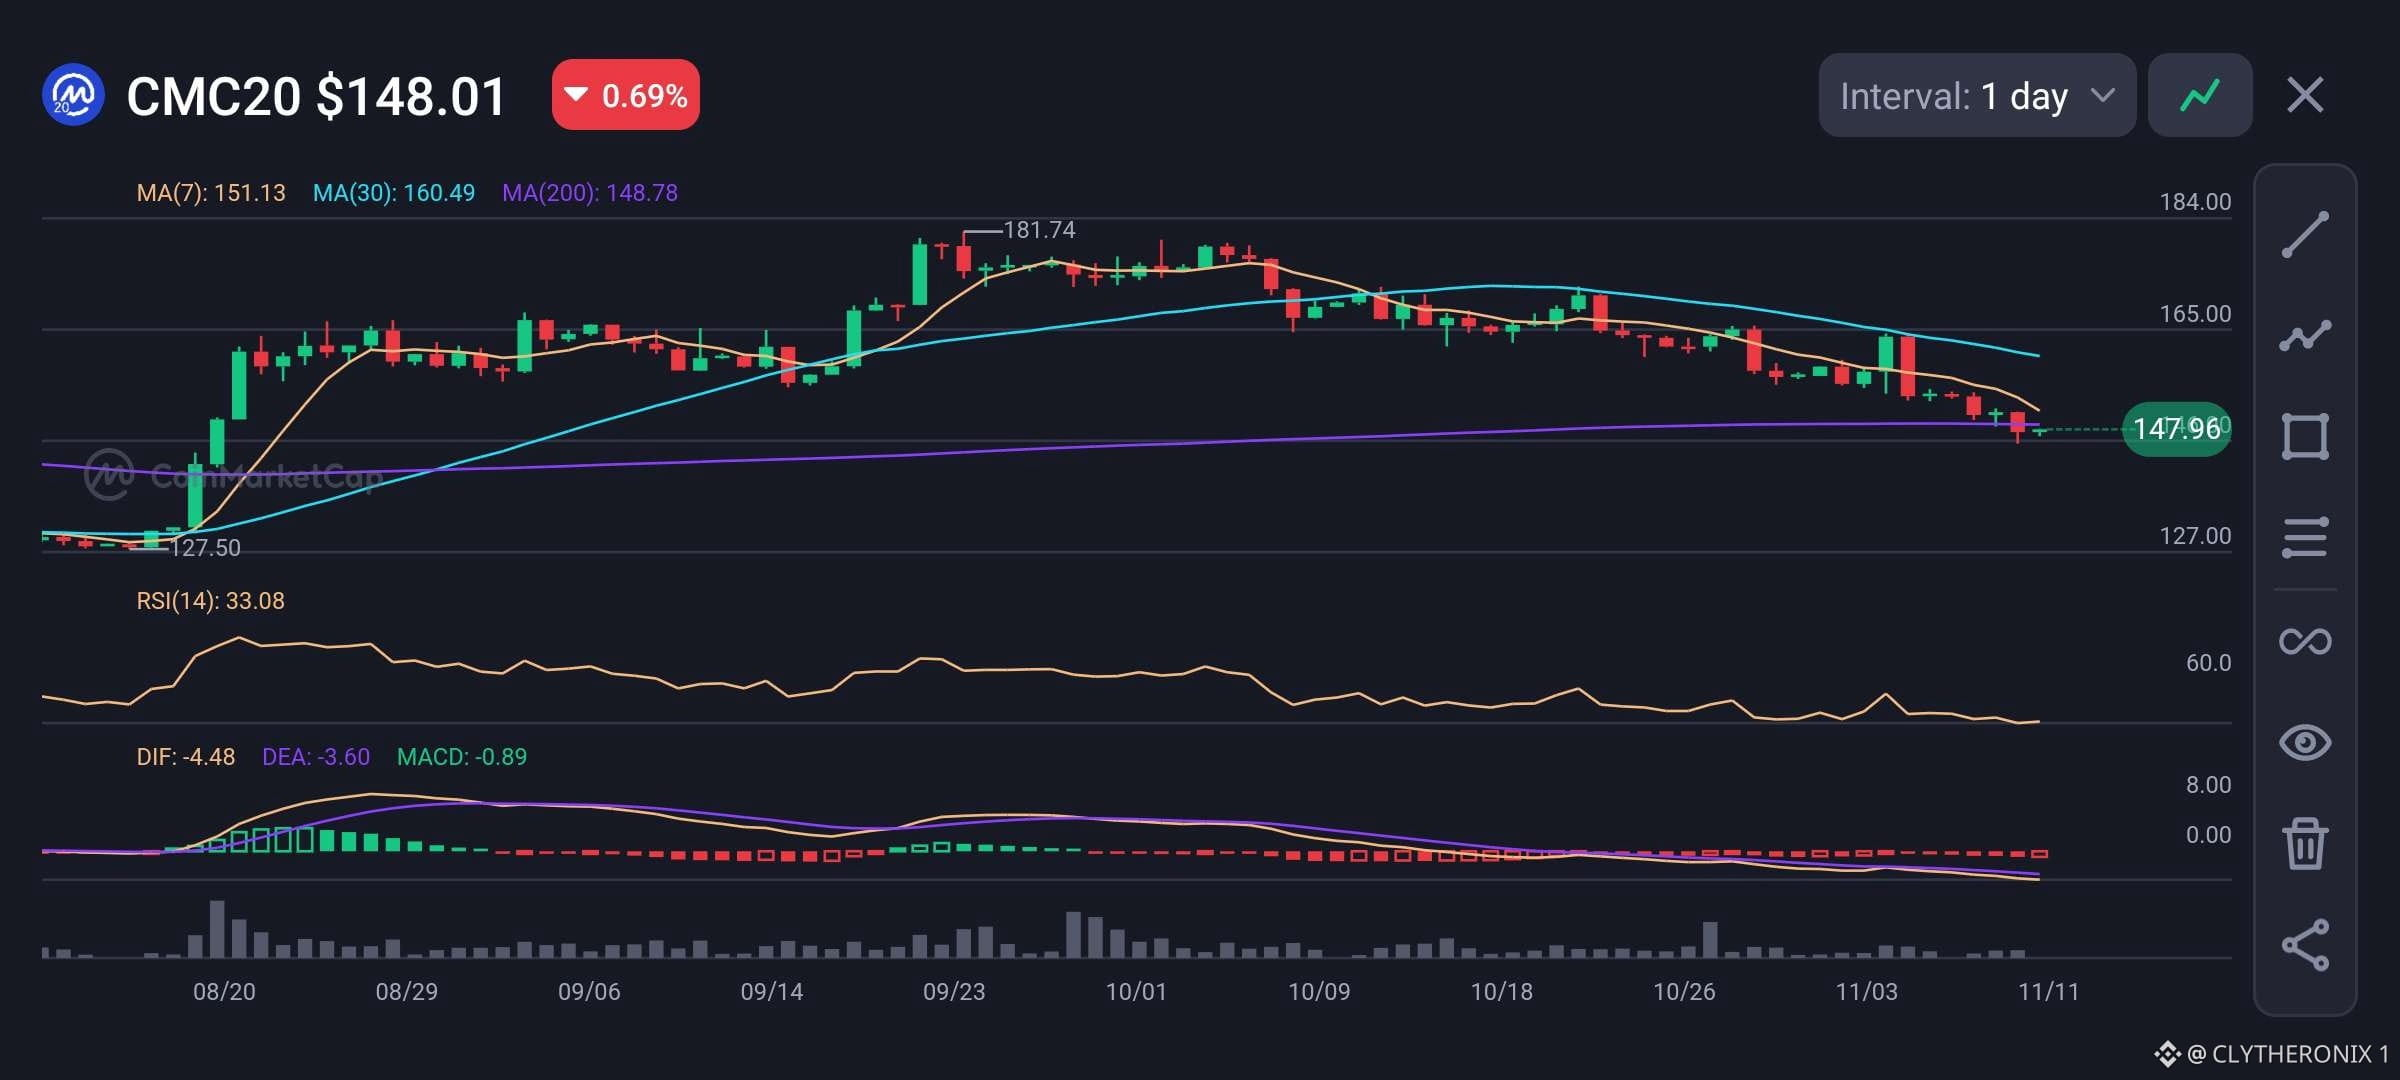
I observe the CoinMarketCap 20 Index ( $CMC20) trading at $148.01, down 0.69%, as selling pressure continues across the broader crypto market. After falling from its September peak near $181.74, the index is now testing a key long-term support level.
MARKET INDICATORS
• Price: $148.01
• 24h Change: -0.69%
• MA(7): $151.13
• MA(30): $160.49
• MA(200): $148.78
• RSI(14): 33.08
• MACD Histogram: -0.89
In my view, the market structure remains weak, with price trading below the 7-day and 30-day moving averages. The 200-day moving average at $148.78 is now a critical support level.
The RSI at 33.08 shows that the index is approaching oversold territory, which could allow a short-term bounce. However, the negative MACD suggests selling momentum remains strong.
I am watching $148 as immediate support. A breakdown could expose the index to $127.50, while a recovery above $151.13 could signal improving momentum.
Disclaimer: This is my personal market analysis, not financial advice.
#Macro Insights#
CMC20 TESTS 200-DAY MOVING AVERAGE AS SELLING PRESSURE GROWS.
$CMC20 APPROACHES OVERSOLD TERRITORY AS BEARS MAINTAIN CONTROL
I observe the CoinMarketCap 20 Index ( $CMC20) trading at $148.01, down 0.69%, as selling pressure continues across the broader crypto market. After falling from its September peak near $181.74, the index is now testing a key long-term support level.
MARKET INDICATORS
• Price: $148.01
• 24h Change: -0.69%
• MA(7): $151.13
• MA(30): $160.49
• MA(200): $148.78
• RSI(14): 33.08
• MACD Histogram: -0.89
In my view, the market structure remains weak, with price trading below the 7-day and 30-day moving averages. The 200-day moving average at $148.78 is now a critical support level.
The RSI at 33.08 shows that the index is approaching oversold territory, which could allow a short-term bounce. However, the negative MACD suggests selling momentum remains strong.
I am watching $148 as immediate support. A breakdown could expose the index to $127.50, while a recovery above $151.13 could signal improving momentum.
Disclaimer: This is my personal market analysis, not financial advice.
#Macro Insights#
$CMC20 APPROACHES OVERSOLD TERRITORY AS BEARS MAINTAIN CONTROL
I observe the CoinMarketCap 20 Index ( $CMC20) trading at $148.01, down 0.69%, as selling pressure continues across the broader crypto market. After falling from its September peak near $181.74, the index is now testing a key long-term support level.
MARKET INDICATORS
• Price: $148.01
• 24h Change: -0.69%
• MA(7): $151.13
• MA(30): $160.49
• MA(200): $148.78
• RSI(14): 33.08
• MACD Histogram: -0.89
In my view, the market structure remains weak, with price trading below the 7-day and 30-day moving averages. The 200-day moving average at $148.78 is now a critical support level.
The RSI at 33.08 shows that the index is approaching oversold territory, which could allow a short-term bounce. However, the negative MACD suggests selling momentum remains strong.
I am watching $148 as immediate support. A breakdown could expose the index to $127.50, while a recovery above $151.13 could signal improving momentum.
Disclaimer: This is my personal market analysis, not financial advice.
#Macro Insights#
61
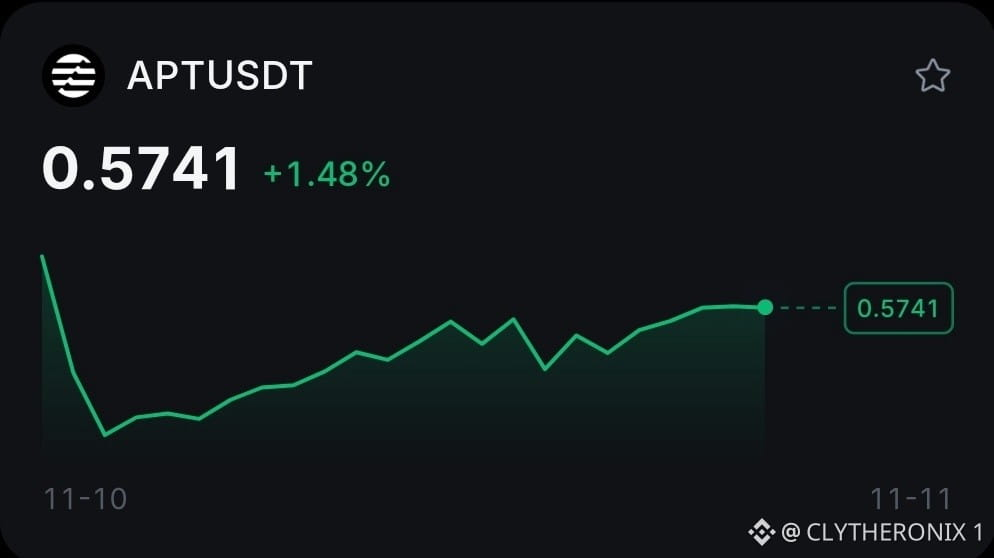
BitGo nắm giữ vị thế chiến lược trong Aptos khi tâm lý thị trường tăng lên mức lạc quan 78%.
Tôi nhận thấy Aptos ($APT) tăng +1.46% lên $0.574 sau tin tức về đợt mở rộng lớn của các tổ chức.
BitGo đã nắm giữ vị thế chiến lược trong APT, cho phép các khách hàng tổ chức đủ điều kiện lưu ký và staking tài sản một cách liền mạch, đồng thời tích hợp ví của mình với sàn DEX Decibel trên nền tảng Aptos.
• Giá: $0.574
• Thay đổi trong 24 giờ: +1.46%
• Tâm lý thị trường: Lạc quan 78%
Theo quan điểm của tôi, việc mở rộng dịch vụ lưu ký cho tổ chức và khả năng kết nối với ví tự lưu ký giúp tăng đáng kể khả năng tiếp cận tiện ích của $APT.
Dù quy mô chính xác của vị thế chưa được công bố, việc tích hợp này tạo nền tảng vững chắc cho sự phát triển của mạng lưới.
Các chỉ số quan trọng cần theo dõi bao gồm liệu khả năng tiếp cận được mở rộng này có chuyển thành hoạt động trên chuỗi bền vững hay không.
Tuyên bố miễn trừ trách nhiệm: Phân tích này phản ánh nghiên cứu cá nhân của tôi và không phải là lời khuyên tài chính.
#Nhận định vĩ mô#
BitGo nắm giữ vị thế chiến lược trong Aptos khi tâm lý thị trường tăng lên mức lạc quan 78%.
Tôi nhận thấy Aptos ($APT) tăng +1.46% lên $0.574 sau tin tức về đợt mở rộng lớn của các tổ chức.
BitGo đã nắm giữ vị thế chiến lược trong APT, cho phép các khách hàng tổ chức đủ điều kiện lưu ký và staking tài sản một cách liền mạch, đồng thời tích hợp ví của mình với sàn DEX Decibel trên nền tảng Aptos.
• Giá: $0.574
• Thay đổi trong 24 giờ: +1.46%
• Tâm lý thị trường: Lạc quan 78%
Theo quan điểm của tôi, việc mở rộng dịch vụ lưu ký cho tổ chức và khả năng kết nối với ví tự lưu ký giúp tăng đáng kể khả năng tiếp cận tiện ích của $APT.
Dù quy mô chính xác của vị thế chưa được công bố, việc tích hợp này tạo nền tảng vững chắc cho sự phát triển của mạng lưới.
Các chỉ số quan trọng cần theo dõi bao gồm liệu khả năng tiếp cận được mở rộng này có chuyển thành hoạt động trên chuỗi bền vững hay không.
Tuyên bố miễn trừ trách nhiệm: Phân tích này phản ánh nghiên cứu cá nhân của tôi và không phải là lời khuyên tài chính.
#Nhận định vĩ mô#
Tôi nhận thấy Aptos ($APT) tăng +1.46% lên $0.574 sau tin tức về đợt mở rộng lớn của các tổ chức.
BitGo đã nắm giữ vị thế chiến lược trong APT, cho phép các khách hàng tổ chức đủ điều kiện lưu ký và staking tài sản một cách liền mạch, đồng thời tích hợp ví của mình với sàn DEX Decibel trên nền tảng Aptos.
• Giá: $0.574
• Thay đổi trong 24 giờ: +1.46%
• Tâm lý thị trường: Lạc quan 78%
Theo quan điểm của tôi, việc mở rộng dịch vụ lưu ký cho tổ chức và khả năng kết nối với ví tự lưu ký giúp tăng đáng kể khả năng tiếp cận tiện ích của $APT.
Dù quy mô chính xác của vị thế chưa được công bố, việc tích hợp này tạo nền tảng vững chắc cho sự phát triển của mạng lưới.
Các chỉ số quan trọng cần theo dõi bao gồm liệu khả năng tiếp cận được mở rộng này có chuyển thành hoạt động trên chuỗi bền vững hay không.
Tuyên bố miễn trừ trách nhiệm: Phân tích này phản ánh nghiên cứu cá nhân của tôi và không phải là lời khuyên tài chính.
#Nhận định vĩ mô#
67
MCD CHO THẤY SỨC MẠNH TĂNG TRƯỞNG LŨY KẾ TRONG 20 NĂM, TÀI SẢN TOKEN HÓA GIỮ MỨC GẦN 276 USD
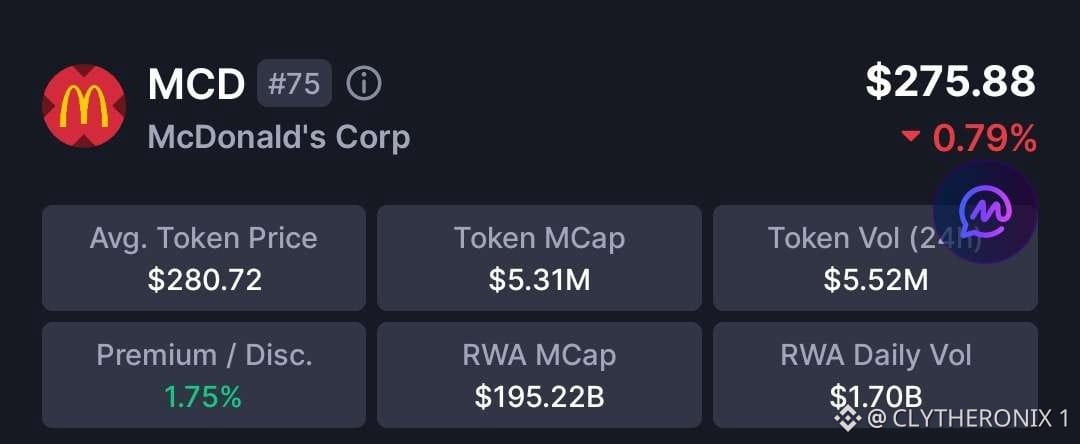
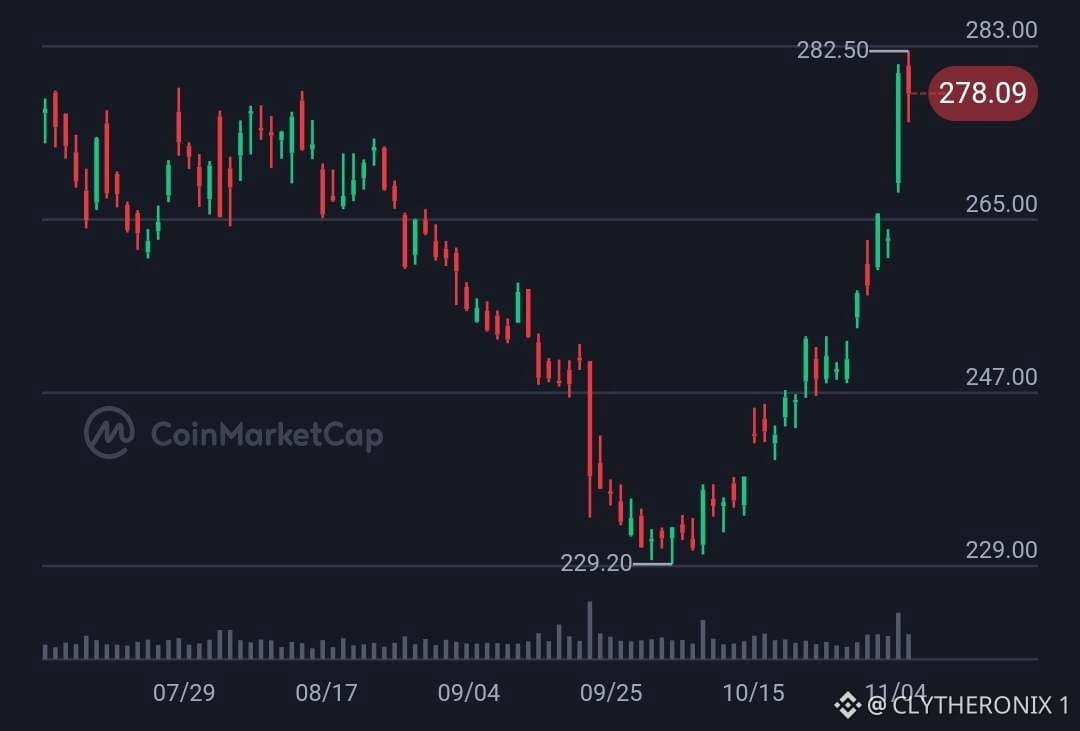
McDonald's ( $MCD) đang giao dịch quanh mức 275,88–276,78 USD, giảm khoảng 0,79%–0,94% trong 24 giờ, sau đợt phục hồi mạnh từ mức đáy tháng 9 là 229,20 USD.
Dữ liệu lịch sử cho thấy McDonald's đạt lợi nhuận trung bình hằng năm 10,01% trong 20 năm, vượt thị trường chung 1,36 điểm phần trăm mỗi năm. Khoản đầu tư giả định 1.000 USD sẽ tăng lên khoảng 6.698,15 USD trong giai đoạn đó.
Trong khi đó, $MCD được token hóa có vốn hóa thị trường 5,31 triệu USD và khối lượng giao dịch 24 giờ là 5,52 triệu USD. Thị trường RWA nói chung được định giá ở mức 195,22 tỷ USD.
CÁC CHỈ SỐ THỊ TRƯỜNG CHÍNH
- Giá tham chiếu: 275,88–276,78 USD
- Biến động 24 giờ: -0,79% đến -0,94%
- Lợi nhuận hằng năm trong 20 năm: 10,01%
- Giá trị khoản đầu tư 1.000 USD theo dữ liệu lịch sử: 6.698,15 USD
- Giá token trung bình: 280,72 USD
- Vốn hóa thị trường của token: 5,31 triệu USD
- Khối lượng giao dịch token trong 24 giờ: 5,52 triệu USD
TRIỂN VỌNG KỸ THUẬT
Sau khi phục hồi từ mức 229,20 USD, MCD đã kiểm tra ngưỡng kháng cự gần 282,50 USD trước khi điều chỉnh và đi vào giai đoạn tích lũy.
Các mức quan trọng cần theo dõi:
- Hỗ trợ: 265 USD
- Kháng cự: 282,50 USD
Việc giữ trên 265 USD có thể duy trì cấu trúc phục hồi, trong khi vượt qua 282,50 USD có thể củng cố đà tăng.
QUAN ĐIỂM CỦA TÔI
Theo tôi, kết quả hoạt động trong quá khứ của McDonald's cho thấy sức hấp dẫn dài hạn từ tăng trưởng lũy kế, nhưng lợi nhuận trước đây không đảm bảo mức tăng trong tương lai.
Tôi sẽ theo dõi kết quả kinh doanh, diễn biến giá cổ phiếu và thanh khoản của token. Cũng cần nhớ rằng MCD được token hóa có thể không mang lại quyền sở hữu hoặc mức độ tiếp xúc tương tự như việc nắm giữ cổ phiếu cơ sở.
Tuyên bố miễn trừ trách nhiệm: Phân tích này phản ánh nghiên cứu cá nhân của tôi và không phải là lời khuyên tài chính. Hãy luôn tự nghiên cứu.
#RWAfi
MCD CHO THẤY SỨC MẠNH TĂNG TRƯỞNG LŨY KẾ TRONG 20 NĂM, TÀI SẢN TOKEN HÓA GIỮ MỨC GẦN 276 USD
McDonald's ( $MCD) đang giao dịch quanh mức 275,88–276,78 USD, giảm khoảng 0,79%–0,94% trong 24 giờ, sau đợt phục hồi mạnh từ mức đáy tháng 9 là 229,20 USD.
Dữ liệu lịch sử cho thấy McDonald's đạt lợi nhuận trung bình hằng năm 10,01% trong 20 năm, vượt thị trường chung 1,36 điểm phần trăm mỗi năm. Khoản đầu tư giả định 1.000 USD sẽ tăng lên khoảng 6.698,15 USD trong giai đoạn đó.
Trong khi đó, $MCD được token hóa có vốn hóa thị trường 5,31 triệu USD và khối lượng giao dịch 24 giờ là 5,52 triệu USD. Thị trường RWA nói chung được định giá ở mức 195,22 tỷ USD.
CÁC CHỈ SỐ THỊ TRƯỜNG CHÍNH
- Giá tham chiếu: 275,88–276,78 USD
- Biến động 24 giờ: -0,79% đến -0,94%
- Lợi nhuận hằng năm trong 20 năm: 10,01%
- Giá trị khoản đầu tư 1.000 USD theo dữ liệu lịch sử: 6.698,15 USD
- Giá token trung bình: 280,72 USD
- Vốn hóa thị trường của token: 5,31 triệu USD
- Khối lượng giao dịch token trong 24 giờ: 5,52 triệu USD
TRIỂN VỌNG KỸ THUẬT
Sau khi phục hồi từ mức 229,20 USD, MCD đã kiểm tra ngưỡng kháng cự gần 282,50 USD trước khi điều chỉnh và đi vào giai đoạn tích lũy.
Các mức quan trọng cần theo dõi:
- Hỗ trợ: 265 USD
- Kháng cự: 282,50 USD
Việc giữ trên 265 USD có thể duy trì cấu trúc phục hồi, trong khi vượt qua 282,50 USD có thể củng cố đà tăng.
QUAN ĐIỂM CỦA TÔI
Theo tôi, kết quả hoạt động trong quá khứ của McDonald's cho thấy sức hấp dẫn dài hạn từ tăng trưởng lũy kế, nhưng lợi nhuận trước đây không đảm bảo mức tăng trong tương lai.
Tôi sẽ theo dõi kết quả kinh doanh, diễn biến giá cổ phiếu và thanh khoản của token. Cũng cần nhớ rằng MCD được token hóa có thể không mang lại quyền sở hữu hoặc mức độ tiếp xúc tương tự như việc nắm giữ cổ phiếu cơ sở.
Tuyên bố miễn trừ trách nhiệm: Phân tích này phản ánh nghiên cứu cá nhân của tôi và không phải là lời khuyên tài chính. Hãy luôn tự nghiên cứu.
#RWAfi
McDonald's ( $MCD) đang giao dịch quanh mức 275,88–276,78 USD, giảm khoảng 0,79%–0,94% trong 24 giờ, sau đợt phục hồi mạnh từ mức đáy tháng 9 là 229,20 USD.
Dữ liệu lịch sử cho thấy McDonald's đạt lợi nhuận trung bình hằng năm 10,01% trong 20 năm, vượt thị trường chung 1,36 điểm phần trăm mỗi năm. Khoản đầu tư giả định 1.000 USD sẽ tăng lên khoảng 6.698,15 USD trong giai đoạn đó.
Trong khi đó, $MCD được token hóa có vốn hóa thị trường 5,31 triệu USD và khối lượng giao dịch 24 giờ là 5,52 triệu USD. Thị trường RWA nói chung được định giá ở mức 195,22 tỷ USD.
CÁC CHỈ SỐ THỊ TRƯỜNG CHÍNH
- Giá tham chiếu: 275,88–276,78 USD
- Biến động 24 giờ: -0,79% đến -0,94%
- Lợi nhuận hằng năm trong 20 năm: 10,01%
- Giá trị khoản đầu tư 1.000 USD theo dữ liệu lịch sử: 6.698,15 USD
- Giá token trung bình: 280,72 USD
- Vốn hóa thị trường của token: 5,31 triệu USD
- Khối lượng giao dịch token trong 24 giờ: 5,52 triệu USD
TRIỂN VỌNG KỸ THUẬT
Sau khi phục hồi từ mức 229,20 USD, MCD đã kiểm tra ngưỡng kháng cự gần 282,50 USD trước khi điều chỉnh và đi vào giai đoạn tích lũy.
Các mức quan trọng cần theo dõi:
- Hỗ trợ: 265 USD
- Kháng cự: 282,50 USD
Việc giữ trên 265 USD có thể duy trì cấu trúc phục hồi, trong khi vượt qua 282,50 USD có thể củng cố đà tăng.
QUAN ĐIỂM CỦA TÔI
Theo tôi, kết quả hoạt động trong quá khứ của McDonald's cho thấy sức hấp dẫn dài hạn từ tăng trưởng lũy kế, nhưng lợi nhuận trước đây không đảm bảo mức tăng trong tương lai.
Tôi sẽ theo dõi kết quả kinh doanh, diễn biến giá cổ phiếu và thanh khoản của token. Cũng cần nhớ rằng MCD được token hóa có thể không mang lại quyền sở hữu hoặc mức độ tiếp xúc tương tự như việc nắm giữ cổ phiếu cơ sở.
Tuyên bố miễn trừ trách nhiệm: Phân tích này phản ánh nghiên cứu cá nhân của tôi và không phải là lời khuyên tài chính. Hãy luôn tự nghiên cứu.
#RWAfi
105
PHÍ MORPHO TĂNG VỌT 31,8% LÊN 25,82 TRIỆU USD.
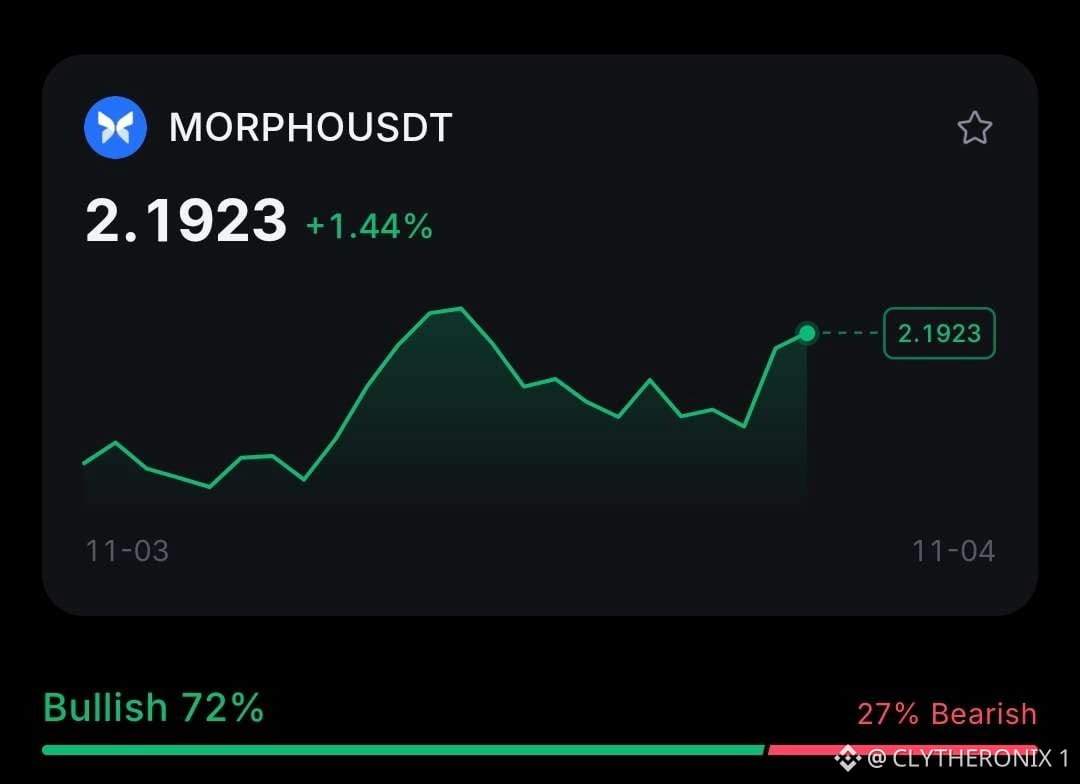
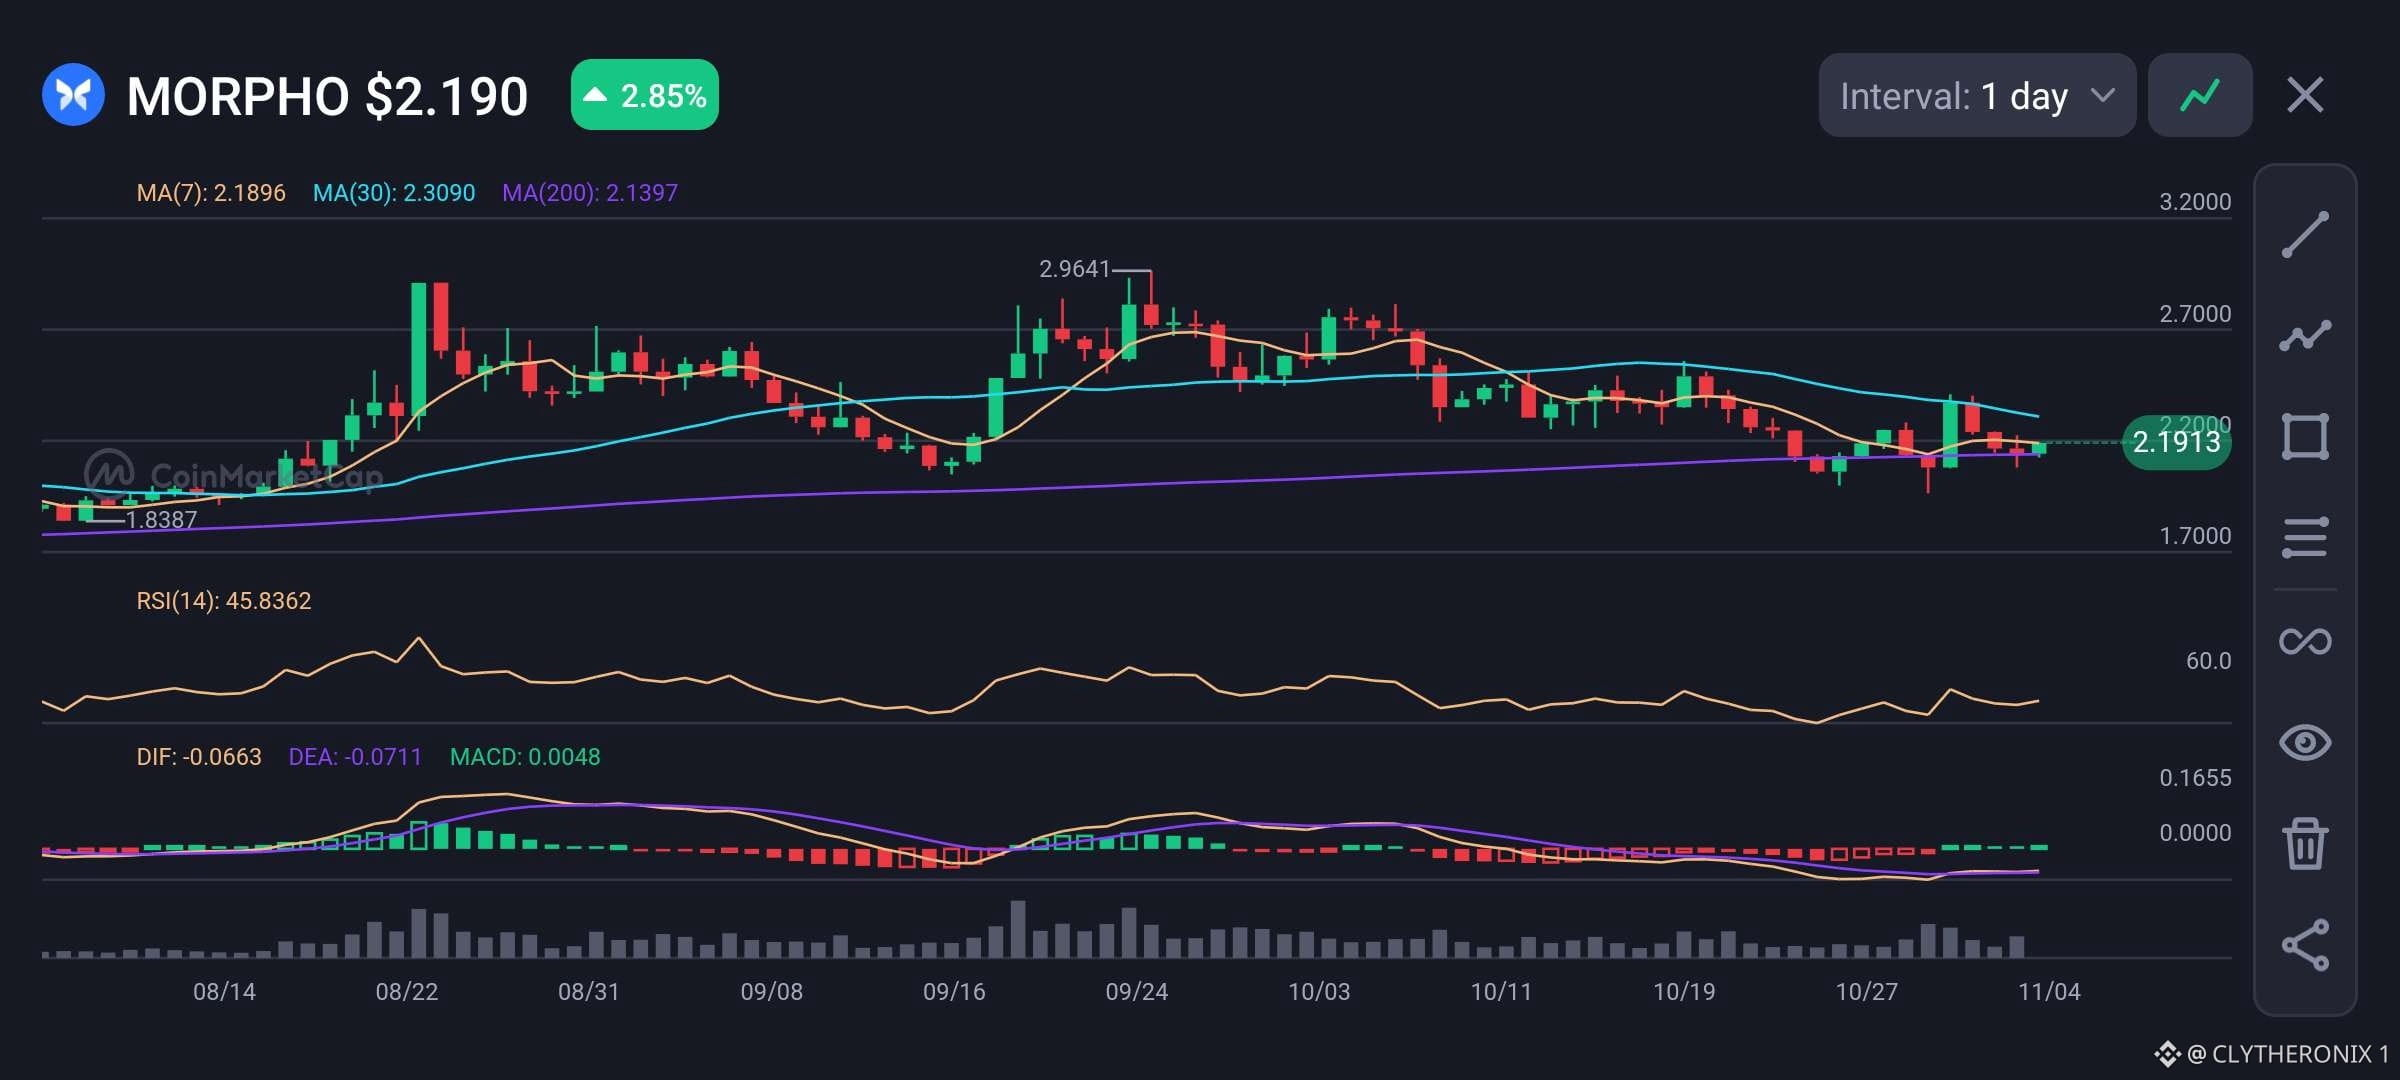
Morpho ( $MORPHO) đang giao dịch quanh mức $2.1913–$2.1923, ghi nhận mức tăng nhẹ trong ngày khi doanh thu giao thức cải thiện, thu hút sự chú ý đến hệ sinh thái cho vay của dự án.
Theo dữ liệu on-chain, phí của Morpho trong tháng 10 tăng 31,8%, từ 19,59 triệu USD lên 25,82 triệu USD, thu hẹp khoảng cách với $AAVE.
Trong khi đó, tổng giá trị khóa (TVL) vẫn tương đối ổn định, ở mức khoảng 11,05 tỷ USD.
DOANH THU TĂNG TRƯỞNG DÙ TVL ĐI NGANG
Theo tôi, phí tăng trong khi TVL tương đối ổn định cho thấy khả năng khai thác vốn hiệu quả hơn. Điều này có thể phản ánh hoạt động cho vay mạnh hơn, mức độ sử dụng vốn cao hơn hoặc những thay đổi về nhu cầu vay và cơ cấu tài sản.
Tuy nhiên, cần phân biệt rõ: phí giao thức tăng không đồng nghĩa với việc giá trị sẽ tự động được chuyển trực tiếp đến những người nắm giữ token MORPHO. Nhà đầu tư nên theo dõi xem giao thức có triển khai hoặc mở rộng các cơ chế liên kết tăng trưởng doanh thu với giá trị token hay không.
PHÂN TÍCH KỸ THUẬT:
Về mặt kỹ thuật, $MORPHO đang giao dịch gần đường trung bình động 7 ngày ở mức $2.1896 và vẫn nằm trên đường trung bình động 200 ngày ở mức $2.1397. Đây là mức hỗ trợ dài hạn quan trọng cần theo dõi.
Biểu đồ histogram MACD vừa chuyển sang dương nhẹ ở mức 0.0048, cho thấy đà giảm có thể đang suy yếu. Trong khi đó, RSI ở mức 45.84 vẫn trung tính, tạo dư địa cho đà phục hồi mạnh hơn nếu áp lực mua cải thiện.
Các mức quan trọng:
- Hỗ trợ: $2.1397 (MA200)
- Mốc tham chiếu giảm giá quan trọng: $1.8387
- Kháng cự gần nhất: $2.3090 (MA30)
- Kháng cự cao hơn: $2.9641 (đỉnh tháng 9)
Tôi lạc quan một cách thận trọng về các yếu tố cơ bản đang cải thiện của Morpho. Phí tăng 31,8% trong khi TVL nhìn chung ổn định là tín hiệu đáng khích lệ về hoạt động của giao thức. Tuy nhiên, token vẫn cần vượt qua vùng kháng cự $2.31 trước khi có thể xác nhận một sự đảo chiều tăng giá mạnh hơn.
Tuyên bố miễn trừ trách nhiệm: Phân tích này phản ánh nghiên cứu cá nhân của tôi và không phải là lời khuyên tài chính.
#Nhận định vĩ mô#
PHÍ MORPHO TĂNG VỌT 31,8% LÊN 25,82 TRIỆU USD.
Morpho ( $MORPHO) đang giao dịch quanh mức $2.1913–$2.1923, ghi nhận mức tăng nhẹ trong ngày khi doanh thu giao thức cải thiện, thu hút sự chú ý đến hệ sinh thái cho vay của dự án.
Theo dữ liệu on-chain, phí của Morpho trong tháng 10 tăng 31,8%, từ 19,59 triệu USD lên 25,82 triệu USD, thu hẹp khoảng cách với $AAVE.
Trong khi đó, tổng giá trị khóa (TVL) vẫn tương đối ổn định, ở mức khoảng 11,05 tỷ USD.
DOANH THU TĂNG TRƯỞNG DÙ TVL ĐI NGANG
Theo tôi, phí tăng trong khi TVL tương đối ổn định cho thấy khả năng khai thác vốn hiệu quả hơn. Điều này có thể phản ánh hoạt động cho vay mạnh hơn, mức độ sử dụng vốn cao hơn hoặc những thay đổi về nhu cầu vay và cơ cấu tài sản.
Tuy nhiên, cần phân biệt rõ: phí giao thức tăng không đồng nghĩa với việc giá trị sẽ tự động được chuyển trực tiếp đến những người nắm giữ token MORPHO. Nhà đầu tư nên theo dõi xem giao thức có triển khai hoặc mở rộng các cơ chế liên kết tăng trưởng doanh thu với giá trị token hay không.
PHÂN TÍCH KỸ THUẬT:
Về mặt kỹ thuật, $MORPHO đang giao dịch gần đường trung bình động 7 ngày ở mức $2.1896 và vẫn nằm trên đường trung bình động 200 ngày ở mức $2.1397. Đây là mức hỗ trợ dài hạn quan trọng cần theo dõi.
Biểu đồ histogram MACD vừa chuyển sang dương nhẹ ở mức 0.0048, cho thấy đà giảm có thể đang suy yếu. Trong khi đó, RSI ở mức 45.84 vẫn trung tính, tạo dư địa cho đà phục hồi mạnh hơn nếu áp lực mua cải thiện.
Các mức quan trọng:
- Hỗ trợ: $2.1397 (MA200)
- Mốc tham chiếu giảm giá quan trọng: $1.8387
- Kháng cự gần nhất: $2.3090 (MA30)
- Kháng cự cao hơn: $2.9641 (đỉnh tháng 9)
Tôi lạc quan một cách thận trọng về các yếu tố cơ bản đang cải thiện của Morpho. Phí tăng 31,8% trong khi TVL nhìn chung ổn định là tín hiệu đáng khích lệ về hoạt động của giao thức. Tuy nhiên, token vẫn cần vượt qua vùng kháng cự $2.31 trước khi có thể xác nhận một sự đảo chiều tăng giá mạnh hơn.
Tuyên bố miễn trừ trách nhiệm: Phân tích này phản ánh nghiên cứu cá nhân của tôi và không phải là lời khuyên tài chính.
#Nhận định vĩ mô#
Morpho ( $MORPHO) đang giao dịch quanh mức $2.1913–$2.1923, ghi nhận mức tăng nhẹ trong ngày khi doanh thu giao thức cải thiện, thu hút sự chú ý đến hệ sinh thái cho vay của dự án.
Theo dữ liệu on-chain, phí của Morpho trong tháng 10 tăng 31,8%, từ 19,59 triệu USD lên 25,82 triệu USD, thu hẹp khoảng cách với $AAVE.
Trong khi đó, tổng giá trị khóa (TVL) vẫn tương đối ổn định, ở mức khoảng 11,05 tỷ USD.
DOANH THU TĂNG TRƯỞNG DÙ TVL ĐI NGANG
Theo tôi, phí tăng trong khi TVL tương đối ổn định cho thấy khả năng khai thác vốn hiệu quả hơn. Điều này có thể phản ánh hoạt động cho vay mạnh hơn, mức độ sử dụng vốn cao hơn hoặc những thay đổi về nhu cầu vay và cơ cấu tài sản.
Tuy nhiên, cần phân biệt rõ: phí giao thức tăng không đồng nghĩa với việc giá trị sẽ tự động được chuyển trực tiếp đến những người nắm giữ token MORPHO. Nhà đầu tư nên theo dõi xem giao thức có triển khai hoặc mở rộng các cơ chế liên kết tăng trưởng doanh thu với giá trị token hay không.
PHÂN TÍCH KỸ THUẬT:
Về mặt kỹ thuật, $MORPHO đang giao dịch gần đường trung bình động 7 ngày ở mức $2.1896 và vẫn nằm trên đường trung bình động 200 ngày ở mức $2.1397. Đây là mức hỗ trợ dài hạn quan trọng cần theo dõi.
Biểu đồ histogram MACD vừa chuyển sang dương nhẹ ở mức 0.0048, cho thấy đà giảm có thể đang suy yếu. Trong khi đó, RSI ở mức 45.84 vẫn trung tính, tạo dư địa cho đà phục hồi mạnh hơn nếu áp lực mua cải thiện.
Các mức quan trọng:
- Hỗ trợ: $2.1397 (MA200)
- Mốc tham chiếu giảm giá quan trọng: $1.8387
- Kháng cự gần nhất: $2.3090 (MA30)
- Kháng cự cao hơn: $2.9641 (đỉnh tháng 9)
Tôi lạc quan một cách thận trọng về các yếu tố cơ bản đang cải thiện của Morpho. Phí tăng 31,8% trong khi TVL nhìn chung ổn định là tín hiệu đáng khích lệ về hoạt động của giao thức. Tuy nhiên, token vẫn cần vượt qua vùng kháng cự $2.31 trước khi có thể xác nhận một sự đảo chiều tăng giá mạnh hơn.
Tuyên bố miễn trừ trách nhiệm: Phân tích này phản ánh nghiên cứu cá nhân của tôi và không phải là lời khuyên tài chính.
#Nhận định vĩ mô#
56
Xem bản dịch
$SPX6900 HOLDERS EMBRACE EXTREME BUY-AND-HOLD STRATEGY AS SENTIMENT TURNS 62% BULLISH
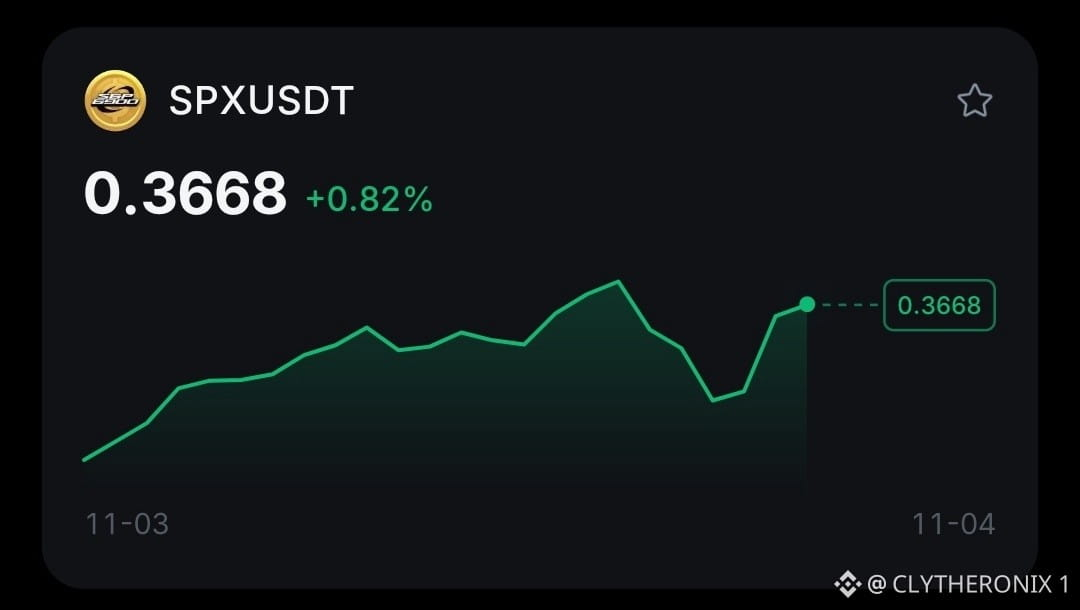
SPX6900 ( $SPX) is trading around $0.3668, up 0.82% over the past 24 hours, as strong community conviction continues to shape its market narrative.
An increasing number of holders appear to be embracing an “extreme buy-and-hold” approach, drawing comparisons with Bitcoin’s early adoption phase. The idea is to maintain long-term positions and reduce potential sell pressure, with current market sentiment reportedly standing at 62% bullish against 38% bearish.
Key Market Metrics
- Price: $0.3668
- 24H Change: +0.82%
- Market Sentiment: 62% Bullish / 38% Bearish
- MACD: Neutral
- MA(7), MA(30), MA(200): N/A
- RSI(14): N/A
KEY LEVELS TO WATCH
From the short-term chart structure, $SPX has established a temporary trough before recovering toward the $0.367 region.
The $0.340 area remains an important support zone. On the upside, immediate resistance sits around $0.380–$0.400. A sustained move above this resistance range could strengthen the bullish outlook, while losing support may expose the token to renewed downside pressure.
MY TAKE
In my view, the growing buy-and-hold narrative reflects strong community conviction, but sentiment alone is not enough to establish a sustainable bullish trend.
A tighter circulating float can amplify upward price movements when fresh demand enters the market. However, it also creates risks: concentrated holder positions and thinner liquidity can increase volatility and deepen drawdowns if selling pressure suddenly emerges.
I’ll be watching holder concentration, daily trading volume, and organic buying activity to determine whether fresh demand is keeping pace with the reduced available supply. For now, the bullish narrative is notable, but it still needs stronger evidence from actual market participation.
Disclaimer: This analysis reflects my personal research and is not financial advice. Always do your own research.
#Meme Alpha#
$SPX6900 HOLDERS EMBRACE EXTREME BUY-AND-HOLD STRATEGY AS SENTIMENT TURNS 62% BULLISH
SPX6900 ( $SPX) is trading around $0.3668, up 0.82% over the past 24 hours, as strong community conviction continues to shape its market narrative.
An increasing number of holders appear to be embracing an “extreme buy-and-hold” approach, drawing comparisons with Bitcoin’s early adoption phase. The idea is to maintain long-term positions and reduce potential sell pressure, with current market sentiment reportedly standing at 62% bullish against 38% bearish.
Key Market Metrics
- Price: $0.3668
- 24H Change: +0.82%
- Market Sentiment: 62% Bullish / 38% Bearish
- MACD: Neutral
- MA(7), MA(30), MA(200): N/A
- RSI(14): N/A
KEY LEVELS TO WATCH
From the short-term chart structure, $SPX has established a temporary trough before recovering toward the $0.367 region.
The $0.340 area remains an important support zone. On the upside, immediate resistance sits around $0.380–$0.400. A sustained move above this resistance range could strengthen the bullish outlook, while losing support may expose the token to renewed downside pressure.
MY TAKE
In my view, the growing buy-and-hold narrative reflects strong community conviction, but sentiment alone is not enough to establish a sustainable bullish trend.
A tighter circulating float can amplify upward price movements when fresh demand enters the market. However, it also creates risks: concentrated holder positions and thinner liquidity can increase volatility and deepen drawdowns if selling pressure suddenly emerges.
I’ll be watching holder concentration, daily trading volume, and organic buying activity to determine whether fresh demand is keeping pace with the reduced available supply. For now, the bullish narrative is notable, but it still needs stronger evidence from actual market participation.
Disclaimer: This analysis reflects my personal research and is not financial advice. Always do your own research.
#Meme Alpha#
SPX6900 ( $SPX) is trading around $0.3668, up 0.82% over the past 24 hours, as strong community conviction continues to shape its market narrative.
An increasing number of holders appear to be embracing an “extreme buy-and-hold” approach, drawing comparisons with Bitcoin’s early adoption phase. The idea is to maintain long-term positions and reduce potential sell pressure, with current market sentiment reportedly standing at 62% bullish against 38% bearish.
Key Market Metrics
- Price: $0.3668
- 24H Change: +0.82%
- Market Sentiment: 62% Bullish / 38% Bearish
- MACD: Neutral
- MA(7), MA(30), MA(200): N/A
- RSI(14): N/A
KEY LEVELS TO WATCH
From the short-term chart structure, $SPX has established a temporary trough before recovering toward the $0.367 region.
The $0.340 area remains an important support zone. On the upside, immediate resistance sits around $0.380–$0.400. A sustained move above this resistance range could strengthen the bullish outlook, while losing support may expose the token to renewed downside pressure.
MY TAKE
In my view, the growing buy-and-hold narrative reflects strong community conviction, but sentiment alone is not enough to establish a sustainable bullish trend.
A tighter circulating float can amplify upward price movements when fresh demand enters the market. However, it also creates risks: concentrated holder positions and thinner liquidity can increase volatility and deepen drawdowns if selling pressure suddenly emerges.
I’ll be watching holder concentration, daily trading volume, and organic buying activity to determine whether fresh demand is keeping pace with the reduced available supply. For now, the bullish narrative is notable, but it still needs stronger evidence from actual market participation.
Disclaimer: This analysis reflects my personal research and is not financial advice. Always do your own research.
#Meme Alpha#
58
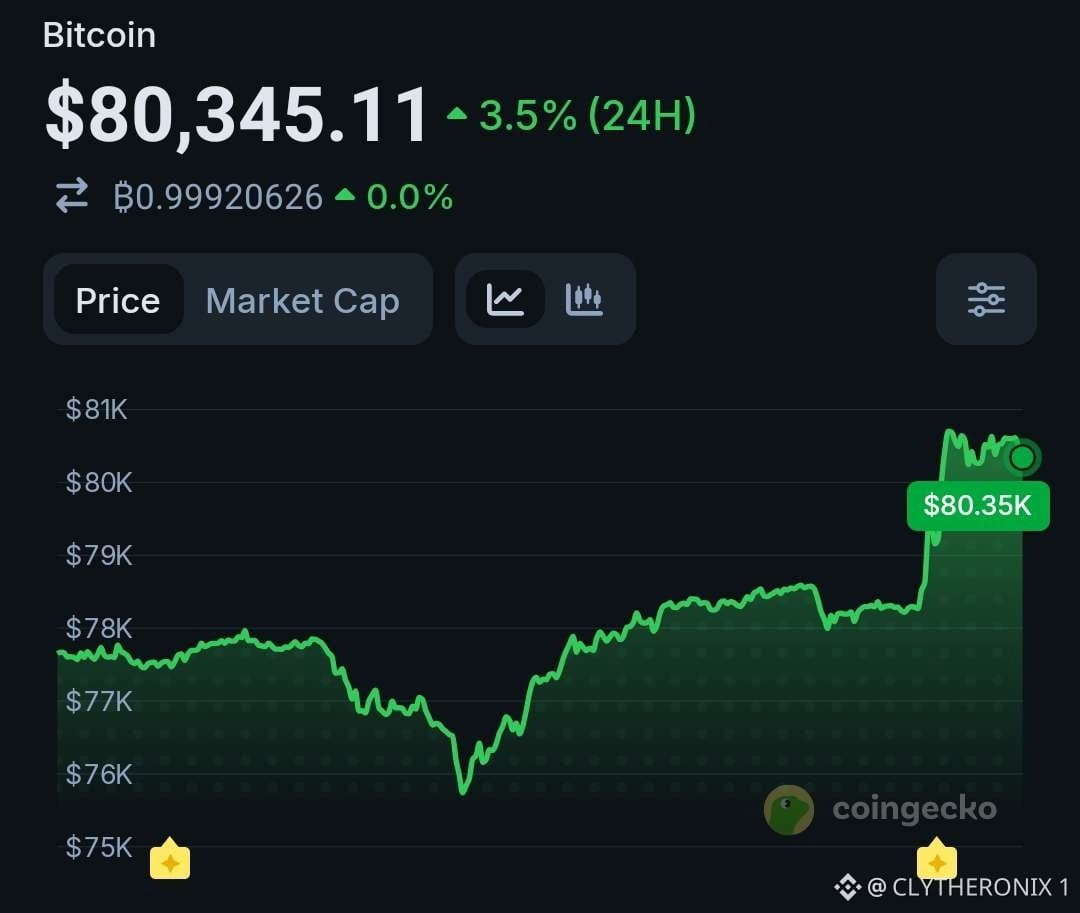
Đà phục hồi nhanh chóng của Bitcoin cho thấy thị trường đang phản ứng mạnh mẽ trước những thay đổi trong kỳ vọng chính trị, nhưng tôi sẽ không mặc định xem việc Quốc hội do Đảng Dân chủ kiểm soát là tín hiệu tích cực hay tiêu cực đối với tiền mã hóa.
Quyền kiểm soát chính trị có thể ảnh hưởng đến định hướng lập pháp, các ưu tiên về quy định và tốc độ đưa ra quyết định chính sách liên quan đến tiền mã hóa. Tuy nhiên, tác động thực tế sẽ phụ thuộc vào các chính sách được đề xuất, sự ủng hộ của lưỡng đảng và cách các nhà lập pháp tiếp cận ngành tài sản kỹ thuật số.
Điểm mấu chốt là các tin tức chính trị có thể gây biến động trong ngắn hạn, nhưng để duy trì đà tăng, thị trường sẽ cần sự tham gia mạnh mẽ hơn và nhu cầu tiếp tục tăng.
Tôi sẽ theo dõi xem $BTC có thể giữ trên mức 80K và xây dựng vùng hỗ trợ quanh mức đó hay không. Đà tăng bền vững có thể củng cố niềm tin lạc quan, trong khi một đợt bị từ chối có thể khiến vùng 76K trở lại tâm điểm.
Cuối cùng, thị trường sẽ cần phân biệt giữa một đợt tăng nhẹ nhờ sự nhẹ nhõm sau bầu cử và một xu hướng tăng bền vững hơn.
#Phân tích giá BTC#
Đà phục hồi nhanh chóng của Bitcoin cho thấy thị trường đang phản ứng mạnh mẽ trước những thay đổi trong kỳ vọng chính trị, nhưng tôi sẽ không mặc định xem việc Quốc hội do Đảng Dân chủ kiểm soát là tín hiệu tích cực hay tiêu cực đối với tiền mã hóa.
Quyền kiểm soát chính trị có thể ảnh hưởng đến định hướng lập pháp, các ưu tiên về quy định và tốc độ đưa ra quyết định chính sách liên quan đến tiền mã hóa. Tuy nhiên, tác động thực tế sẽ phụ thuộc vào các chính sách được đề xuất, sự ủng hộ của lưỡng đảng và cách các nhà lập pháp tiếp cận ngành tài sản kỹ thuật số.
Điểm mấu chốt là các tin tức chính trị có thể gây biến động trong ngắn hạn, nhưng để duy trì đà tăng, thị trường sẽ cần sự tham gia mạnh mẽ hơn và nhu cầu tiếp tục tăng.
Tôi sẽ theo dõi xem $BTC có thể giữ trên mức 80K và xây dựng vùng hỗ trợ quanh mức đó hay không. Đà tăng bền vững có thể củng cố niềm tin lạc quan, trong khi một đợt bị từ chối có thể khiến vùng 76K trở lại tâm điểm.
Cuối cùng, thị trường sẽ cần phân biệt giữa một đợt tăng nhẹ nhờ sự nhẹ nhõm sau bầu cử và một xu hướng tăng bền vững hơn.
#Phân tích giá BTC#
Quyền kiểm soát chính trị có thể ảnh hưởng đến định hướng lập pháp, các ưu tiên về quy định và tốc độ đưa ra quyết định chính sách liên quan đến tiền mã hóa. Tuy nhiên, tác động thực tế sẽ phụ thuộc vào các chính sách được đề xuất, sự ủng hộ của lưỡng đảng và cách các nhà lập pháp tiếp cận ngành tài sản kỹ thuật số.
Điểm mấu chốt là các tin tức chính trị có thể gây biến động trong ngắn hạn, nhưng để duy trì đà tăng, thị trường sẽ cần sự tham gia mạnh mẽ hơn và nhu cầu tiếp tục tăng.
Tôi sẽ theo dõi xem $BTC có thể giữ trên mức 80K và xây dựng vùng hỗ trợ quanh mức đó hay không. Đà tăng bền vững có thể củng cố niềm tin lạc quan, trong khi một đợt bị từ chối có thể khiến vùng 76K trở lại tâm điểm.
Cuối cùng, thị trường sẽ cần phân biệt giữa một đợt tăng nhẹ nhờ sự nhẹ nhõm sau bầu cử và một xu hướng tăng bền vững hơn.
#Phân tích giá BTC#
68
Xem bản dịch
ZIG FINANCE APPROACHES OVERSOLD TERRITORY AS SELLING PRESSURE TESTS KEY SUPPORT.
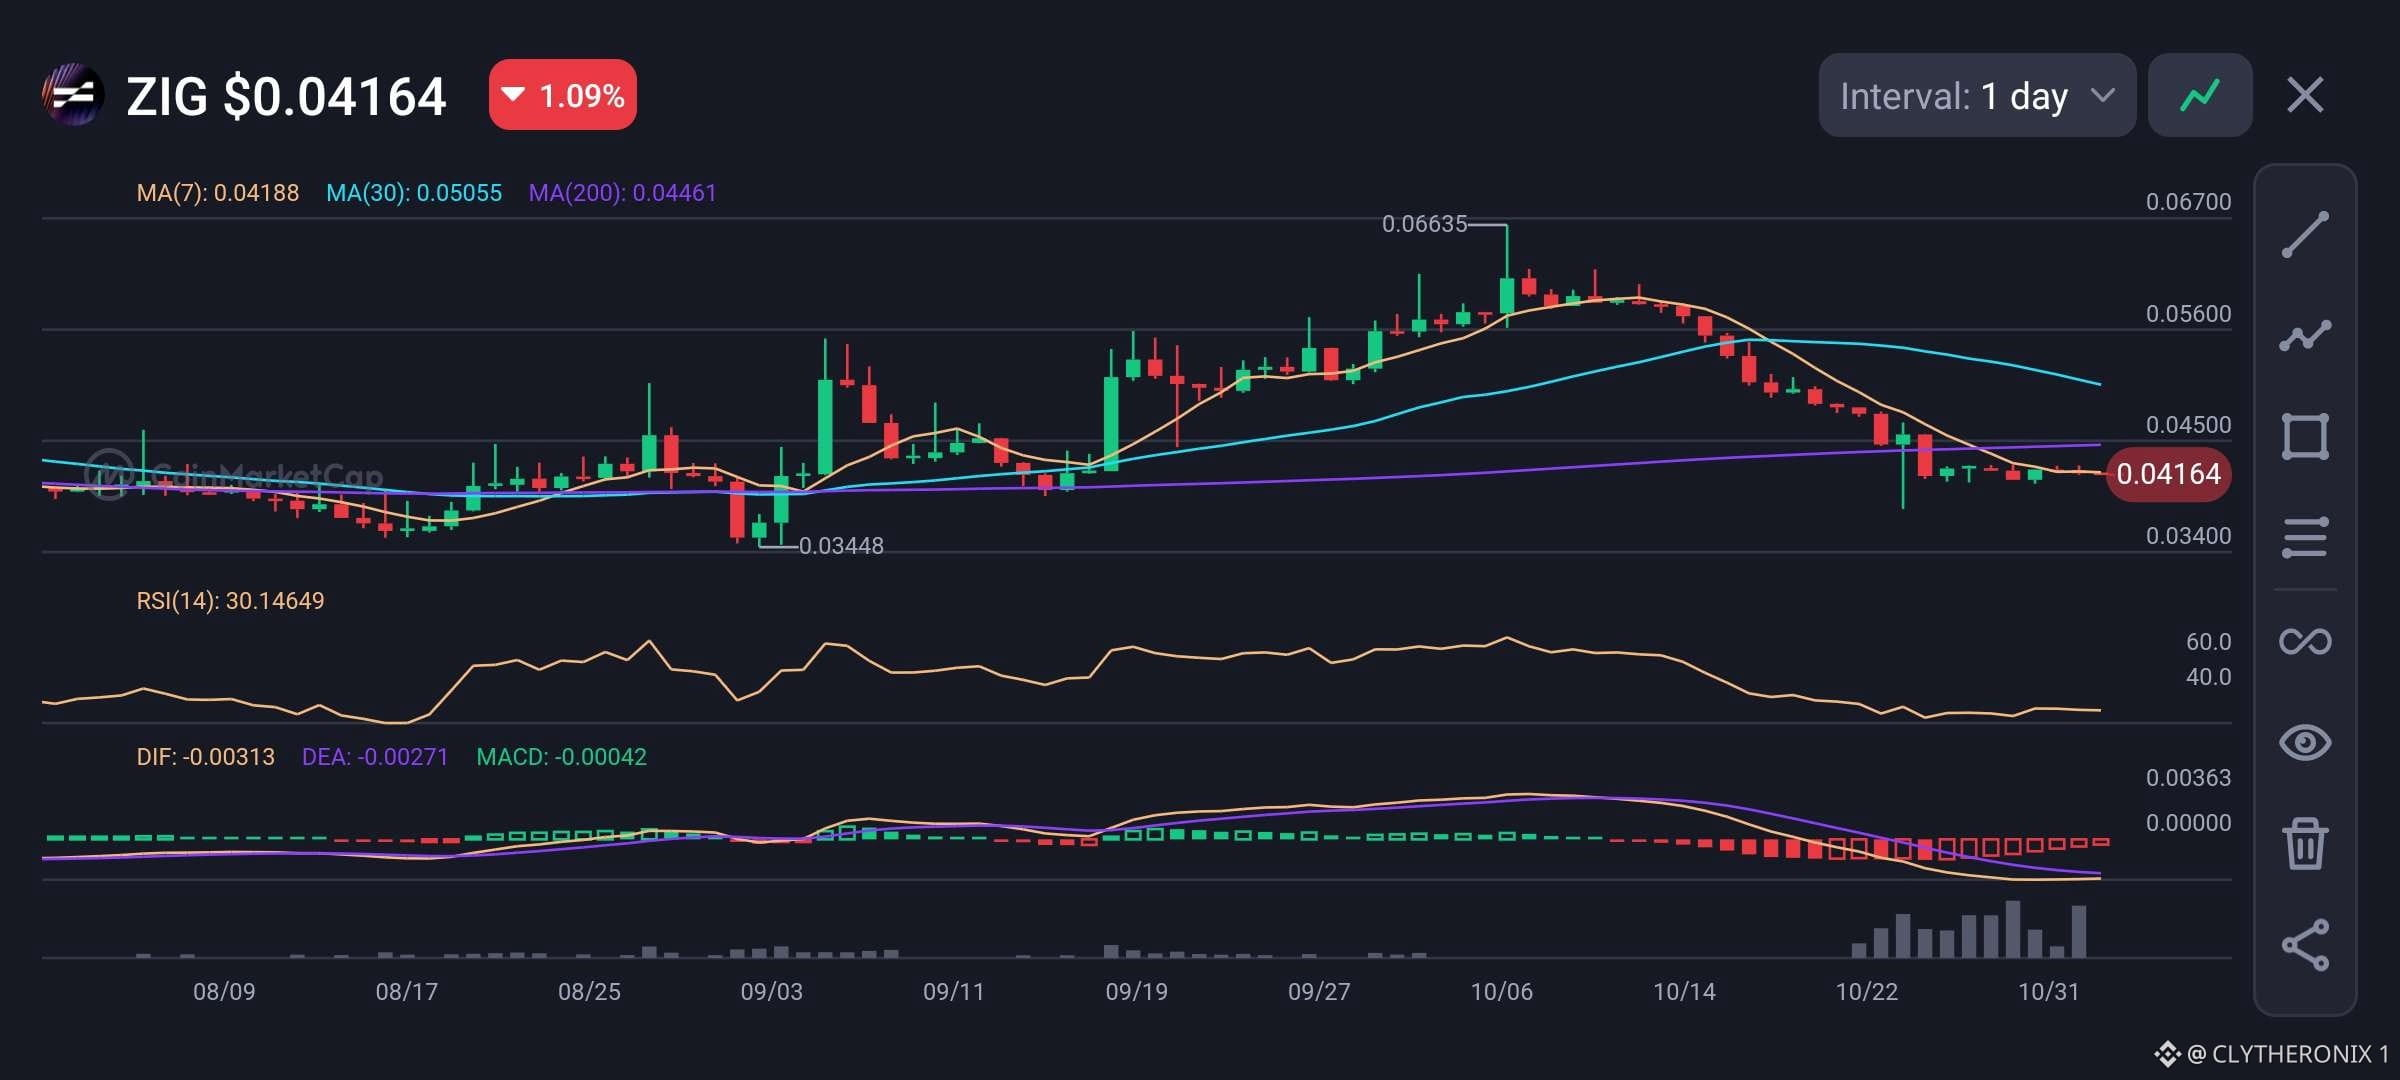
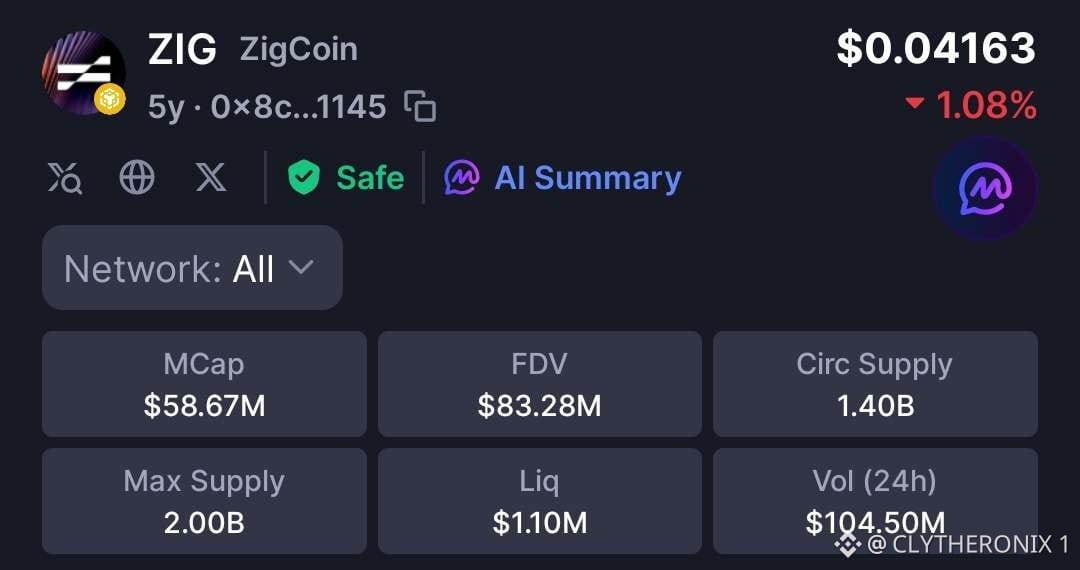
ZIG is showing signs of sustained weakness after retreating from its recent high of approximately $0.06635. Currently trading around $0.04163, the token is down roughly 1.08% on the day, while its broader chart reflects a clear corrective trend.
The technical structure remains under pressure. Price is trading below the 30-day moving average ($0.05055) and the 200-day moving average ($0.04461), indicating that bearish momentum continues to dominate the medium-term trend. It is also hovering just below the 7-day moving average at $0.04188.
One notable development is the RSI, currently around 30.15. This places ZIG close to oversold territory. However, an oversold RSI does not automatically signal a reversal.
The MACD remains negative, with the DIF below the signal line and a negative histogram, confirming that bearish momentum is still present.
MARKET METRICS
- Price: $0.04163
- 24H Change: -1.08%
- Market Cap: $58.67M
- FDV: $83.28M
- 24H Volume: $104.50M
- Liquidity: $1.10M
- Circulating Supply: 1.40B ZIG
- Maximum Supply: 2.00B ZIG
LEVELS TO WATCH
The $0.040–$0.041 region is an important near-term support area. If buyers defend this zone, $ZIG could attempt a recovery toward the $0.04460–$0.045 region, where the 200-day moving average may act as resistance.
A stronger recovery above $0.05055 would be a more convincing signal that bullish momentum is returning. On the downside, losing the current support could expose the previous swing-low region around $0.03448.
MY TRADING VIEW.
In my view, $ZIG is approaching a potentially important decision zone. The RSI suggests that a relief bounce is possible, but the declining price structure and negative MACD mean confirmation is still needed.
I’ll be watching how price reacts around $0.040 and whether buying pressure strengthens enough to reclaim the 200-day moving average. Until then, I remain cautious about calling a bottom.
ZIG FINANCE APPROACHES OVERSOLD TERRITORY AS SELLING PRESSURE TESTS KEY SUPPORT.
ZIG is showing signs of sustained weakness after retreating from its recent high of approximately $0.06635. Currently trading around $0.04163, the token is down roughly 1.08% on the day, while its broader chart reflects a clear corrective trend.
The technical structure remains under pressure. Price is trading below the 30-day moving average ($0.05055) and the 200-day moving average ($0.04461), indicating that bearish momentum continues to dominate the medium-term trend. It is also hovering just below the 7-day moving average at $0.04188.
One notable development is the RSI, currently around 30.15. This places ZIG close to oversold territory. However, an oversold RSI does not automatically signal a reversal.
The MACD remains negative, with the DIF below the signal line and a negative histogram, confirming that bearish momentum is still present.
MARKET METRICS
- Price: $0.04163
- 24H Change: -1.08%
- Market Cap: $58.67M
- FDV: $83.28M
- 24H Volume: $104.50M
- Liquidity: $1.10M
- Circulating Supply: 1.40B ZIG
- Maximum Supply: 2.00B ZIG
LEVELS TO WATCH
The $0.040–$0.041 region is an important near-term support area. If buyers defend this zone, $ZIG could attempt a recovery toward the $0.04460–$0.045 region, where the 200-day moving average may act as resistance.
A stronger recovery above $0.05055 would be a more convincing signal that bullish momentum is returning. On the downside, losing the current support could expose the previous swing-low region around $0.03448.
MY TRADING VIEW.
In my view, $ZIG is approaching a potentially important decision zone. The RSI suggests that a relief bounce is possible, but the declining price structure and negative MACD mean confirmation is still needed.
I’ll be watching how price reacts around $0.040 and whether buying pressure strengthens enough to reclaim the 200-day moving average. Until then, I remain cautious about calling a bottom.
ZIG is showing signs of sustained weakness after retreating from its recent high of approximately $0.06635. Currently trading around $0.04163, the token is down roughly 1.08% on the day, while its broader chart reflects a clear corrective trend.
The technical structure remains under pressure. Price is trading below the 30-day moving average ($0.05055) and the 200-day moving average ($0.04461), indicating that bearish momentum continues to dominate the medium-term trend. It is also hovering just below the 7-day moving average at $0.04188.
One notable development is the RSI, currently around 30.15. This places ZIG close to oversold territory. However, an oversold RSI does not automatically signal a reversal.
The MACD remains negative, with the DIF below the signal line and a negative histogram, confirming that bearish momentum is still present.
MARKET METRICS
- Price: $0.04163
- 24H Change: -1.08%
- Market Cap: $58.67M
- FDV: $83.28M
- 24H Volume: $104.50M
- Liquidity: $1.10M
- Circulating Supply: 1.40B ZIG
- Maximum Supply: 2.00B ZIG
LEVELS TO WATCH
The $0.040–$0.041 region is an important near-term support area. If buyers defend this zone, $ZIG could attempt a recovery toward the $0.04460–$0.045 region, where the 200-day moving average may act as resistance.
A stronger recovery above $0.05055 would be a more convincing signal that bullish momentum is returning. On the downside, losing the current support could expose the previous swing-low region around $0.03448.
MY TRADING VIEW.
In my view, $ZIG is approaching a potentially important decision zone. The RSI suggests that a relief bounce is possible, but the declining price structure and negative MACD mean confirmation is still needed.
I’ll be watching how price reacts around $0.040 and whether buying pressure strengthens enough to reclaim the 200-day moving average. Until then, I remain cautious about calling a bottom.
62
TARTSWAP TĂNG 39,47% KHI GIÁ LẤY LẠI MỨC HỖ TRỢ CỦA ĐƯỜNG TRUNG BÌNH ĐỘNG.
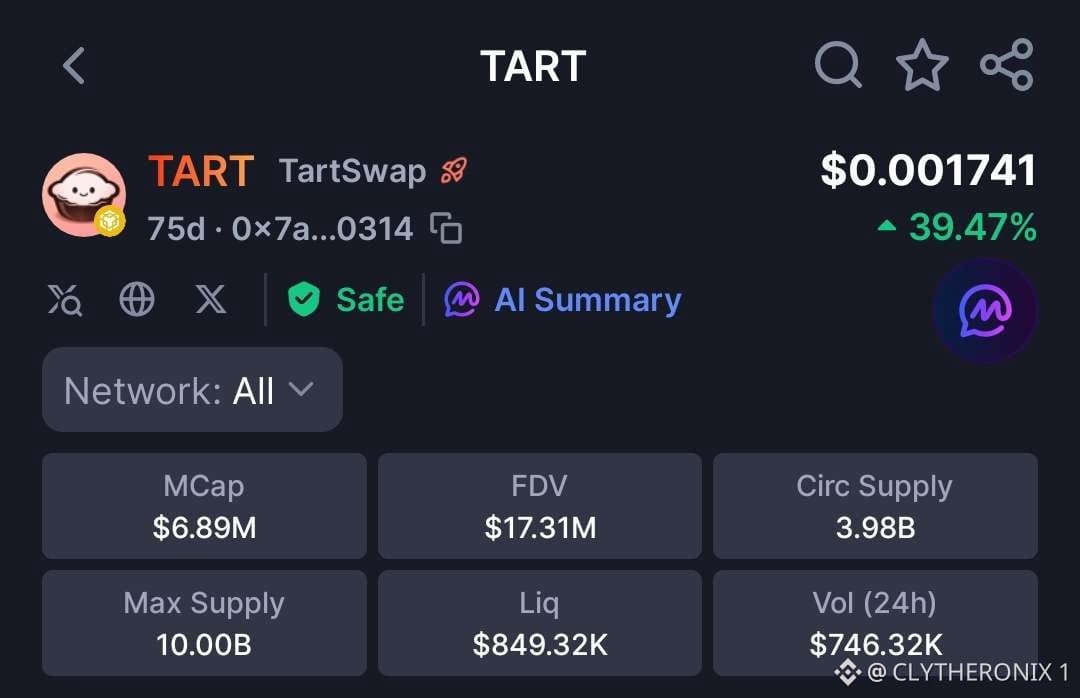
TartSwap ( $TART) đang tăng +39.47% lên mức $0.001741 sau khi bật tăng mạnh trong ngày từ vùng hỗ trợ quan trọng của đường trung bình động.
Các số liệu on-chain cho thấy thanh khoản và mức độ giao dịch lành mạnh, với khối lượng giao dịch 24 giờ đạt $745.92K (tăng +59.91%), vốn hóa thị trường là $6.89M, tổng thanh khoản của pool là $849.32K và định giá pha loãng hoàn toàn (FDV) là $1731M, với nguồn cung lưu hành 3.98B token trên tổng nguồn cung tối đa 10.00B.
• Giá: $0.001741
• Thay đổi trong 24 giờ: +39.47%
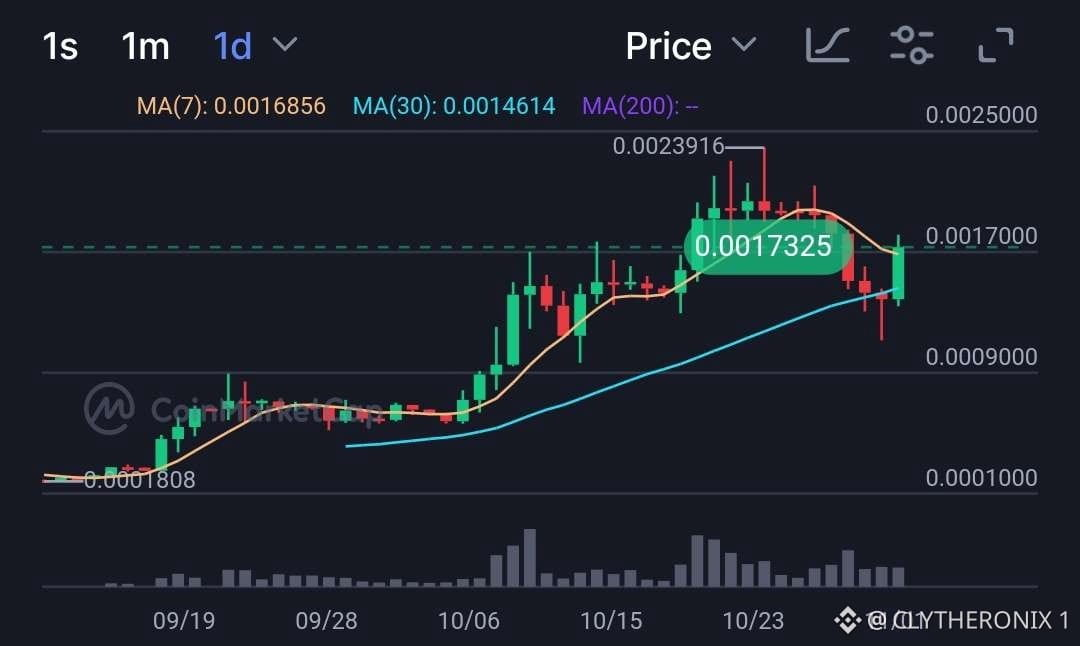
• MA(7): $0.0016856
• MA(30): $0.0014614
• MA(200): N/A
• RSI(14): N/A
• MACD: Trung lập
Theo quan điểm của tôi, $TART đang cho thấy sức mạnh cấu trúc được khôi phục sau khi bảo vệ thành công đường hỗ trợ động MA(30) quanh mức $0.0014614.
Nến ngày hiện tại đã đóng cửa dứt khoát trở lại trên MA(7) ngắn hạn ở mức $0.0016856, cho thấy lực mua đang quay lại thị trường sau đợt điều chỉnh mạnh từ mức đỉnh cục bộ $0.0023916.
Giao cắt tăng giá giữa MA(7) ngắn hạn và MA(30) trung hạn vẫn được duy trì, hỗ trợ cấu trúc xu hướng tổng thể thuận lợi.
Các vùng hỗ trợ quan trọng hiện nằm tại mức MA(7) ($0.0016856) và vùng hỗ trợ thứ cấp MA(30) ($0.0014614).
Vùng kháng cự gần nhất phía trên là mốc tâm lý $0.00200, tiếp theo là mục tiêu ở đỉnh râu nến gần $0.0023916.
Những người tham gia thị trường nên theo dõi xem khối lượng giao dịch hằng ngày có tiếp tục xu hướng tăng hay không để duy trì đà tăng hướng tới việc kiểm tra lại các đỉnh trước đó.
Tuyên bố miễn trừ trách nhiệm: Phân tích này phản ánh nghiên cứu cá nhân của tôi và không phải là lời khuyên tài chính.
#Mùa Altcoin# #Góc nhìn vĩ mô#
TARTSWAP TĂNG 39,47% KHI GIÁ LẤY LẠI MỨC HỖ TRỢ CỦA ĐƯỜNG TRUNG BÌNH ĐỘNG.
TartSwap ( $TART) đang tăng +39.47% lên mức $0.001741 sau khi bật tăng mạnh trong ngày từ vùng hỗ trợ quan trọng của đường trung bình động.
Các số liệu on-chain cho thấy thanh khoản và mức độ giao dịch lành mạnh, với khối lượng giao dịch 24 giờ đạt $745.92K (tăng +59.91%), vốn hóa thị trường là $6.89M, tổng thanh khoản của pool là $849.32K và định giá pha loãng hoàn toàn (FDV) là $1731M, với nguồn cung lưu hành 3.98B token trên tổng nguồn cung tối đa 10.00B.
• Giá: $0.001741
• Thay đổi trong 24 giờ: +39.47%
• MA(7): $0.0016856
• MA(30): $0.0014614
• MA(200): N/A
• RSI(14): N/A
• MACD: Trung lập
Theo quan điểm của tôi, $TART đang cho thấy sức mạnh cấu trúc được khôi phục sau khi bảo vệ thành công đường hỗ trợ động MA(30) quanh mức $0.0014614.
Nến ngày hiện tại đã đóng cửa dứt khoát trở lại trên MA(7) ngắn hạn ở mức $0.0016856, cho thấy lực mua đang quay lại thị trường sau đợt điều chỉnh mạnh từ mức đỉnh cục bộ $0.0023916.
Giao cắt tăng giá giữa MA(7) ngắn hạn và MA(30) trung hạn vẫn được duy trì, hỗ trợ cấu trúc xu hướng tổng thể thuận lợi.
Các vùng hỗ trợ quan trọng hiện nằm tại mức MA(7) ($0.0016856) và vùng hỗ trợ thứ cấp MA(30) ($0.0014614).
Vùng kháng cự gần nhất phía trên là mốc tâm lý $0.00200, tiếp theo là mục tiêu ở đỉnh râu nến gần $0.0023916.
Những người tham gia thị trường nên theo dõi xem khối lượng giao dịch hằng ngày có tiếp tục xu hướng tăng hay không để duy trì đà tăng hướng tới việc kiểm tra lại các đỉnh trước đó.
Tuyên bố miễn trừ trách nhiệm: Phân tích này phản ánh nghiên cứu cá nhân của tôi và không phải là lời khuyên tài chính.
#Mùa Altcoin# #Góc nhìn vĩ mô#
TartSwap ( $TART) đang tăng +39.47% lên mức $0.001741 sau khi bật tăng mạnh trong ngày từ vùng hỗ trợ quan trọng của đường trung bình động.
Các số liệu on-chain cho thấy thanh khoản và mức độ giao dịch lành mạnh, với khối lượng giao dịch 24 giờ đạt $745.92K (tăng +59.91%), vốn hóa thị trường là $6.89M, tổng thanh khoản của pool là $849.32K và định giá pha loãng hoàn toàn (FDV) là $1731M, với nguồn cung lưu hành 3.98B token trên tổng nguồn cung tối đa 10.00B.
• Giá: $0.001741
• Thay đổi trong 24 giờ: +39.47%
• MA(7): $0.0016856
• MA(30): $0.0014614
• MA(200): N/A
• RSI(14): N/A
• MACD: Trung lập
Theo quan điểm của tôi, $TART đang cho thấy sức mạnh cấu trúc được khôi phục sau khi bảo vệ thành công đường hỗ trợ động MA(30) quanh mức $0.0014614.
Nến ngày hiện tại đã đóng cửa dứt khoát trở lại trên MA(7) ngắn hạn ở mức $0.0016856, cho thấy lực mua đang quay lại thị trường sau đợt điều chỉnh mạnh từ mức đỉnh cục bộ $0.0023916.
Giao cắt tăng giá giữa MA(7) ngắn hạn và MA(30) trung hạn vẫn được duy trì, hỗ trợ cấu trúc xu hướng tổng thể thuận lợi.
Các vùng hỗ trợ quan trọng hiện nằm tại mức MA(7) ($0.0016856) và vùng hỗ trợ thứ cấp MA(30) ($0.0014614).
Vùng kháng cự gần nhất phía trên là mốc tâm lý $0.00200, tiếp theo là mục tiêu ở đỉnh râu nến gần $0.0023916.
Những người tham gia thị trường nên theo dõi xem khối lượng giao dịch hằng ngày có tiếp tục xu hướng tăng hay không để duy trì đà tăng hướng tới việc kiểm tra lại các đỉnh trước đó.
Tuyên bố miễn trừ trách nhiệm: Phân tích này phản ánh nghiên cứu cá nhân của tôi và không phải là lời khuyên tài chính.
#Mùa Altcoin# #Góc nhìn vĩ mô#
72
Xem bản dịch
AKE DROPS OVER 40%, WILL KEY SUPPORT HOLD?
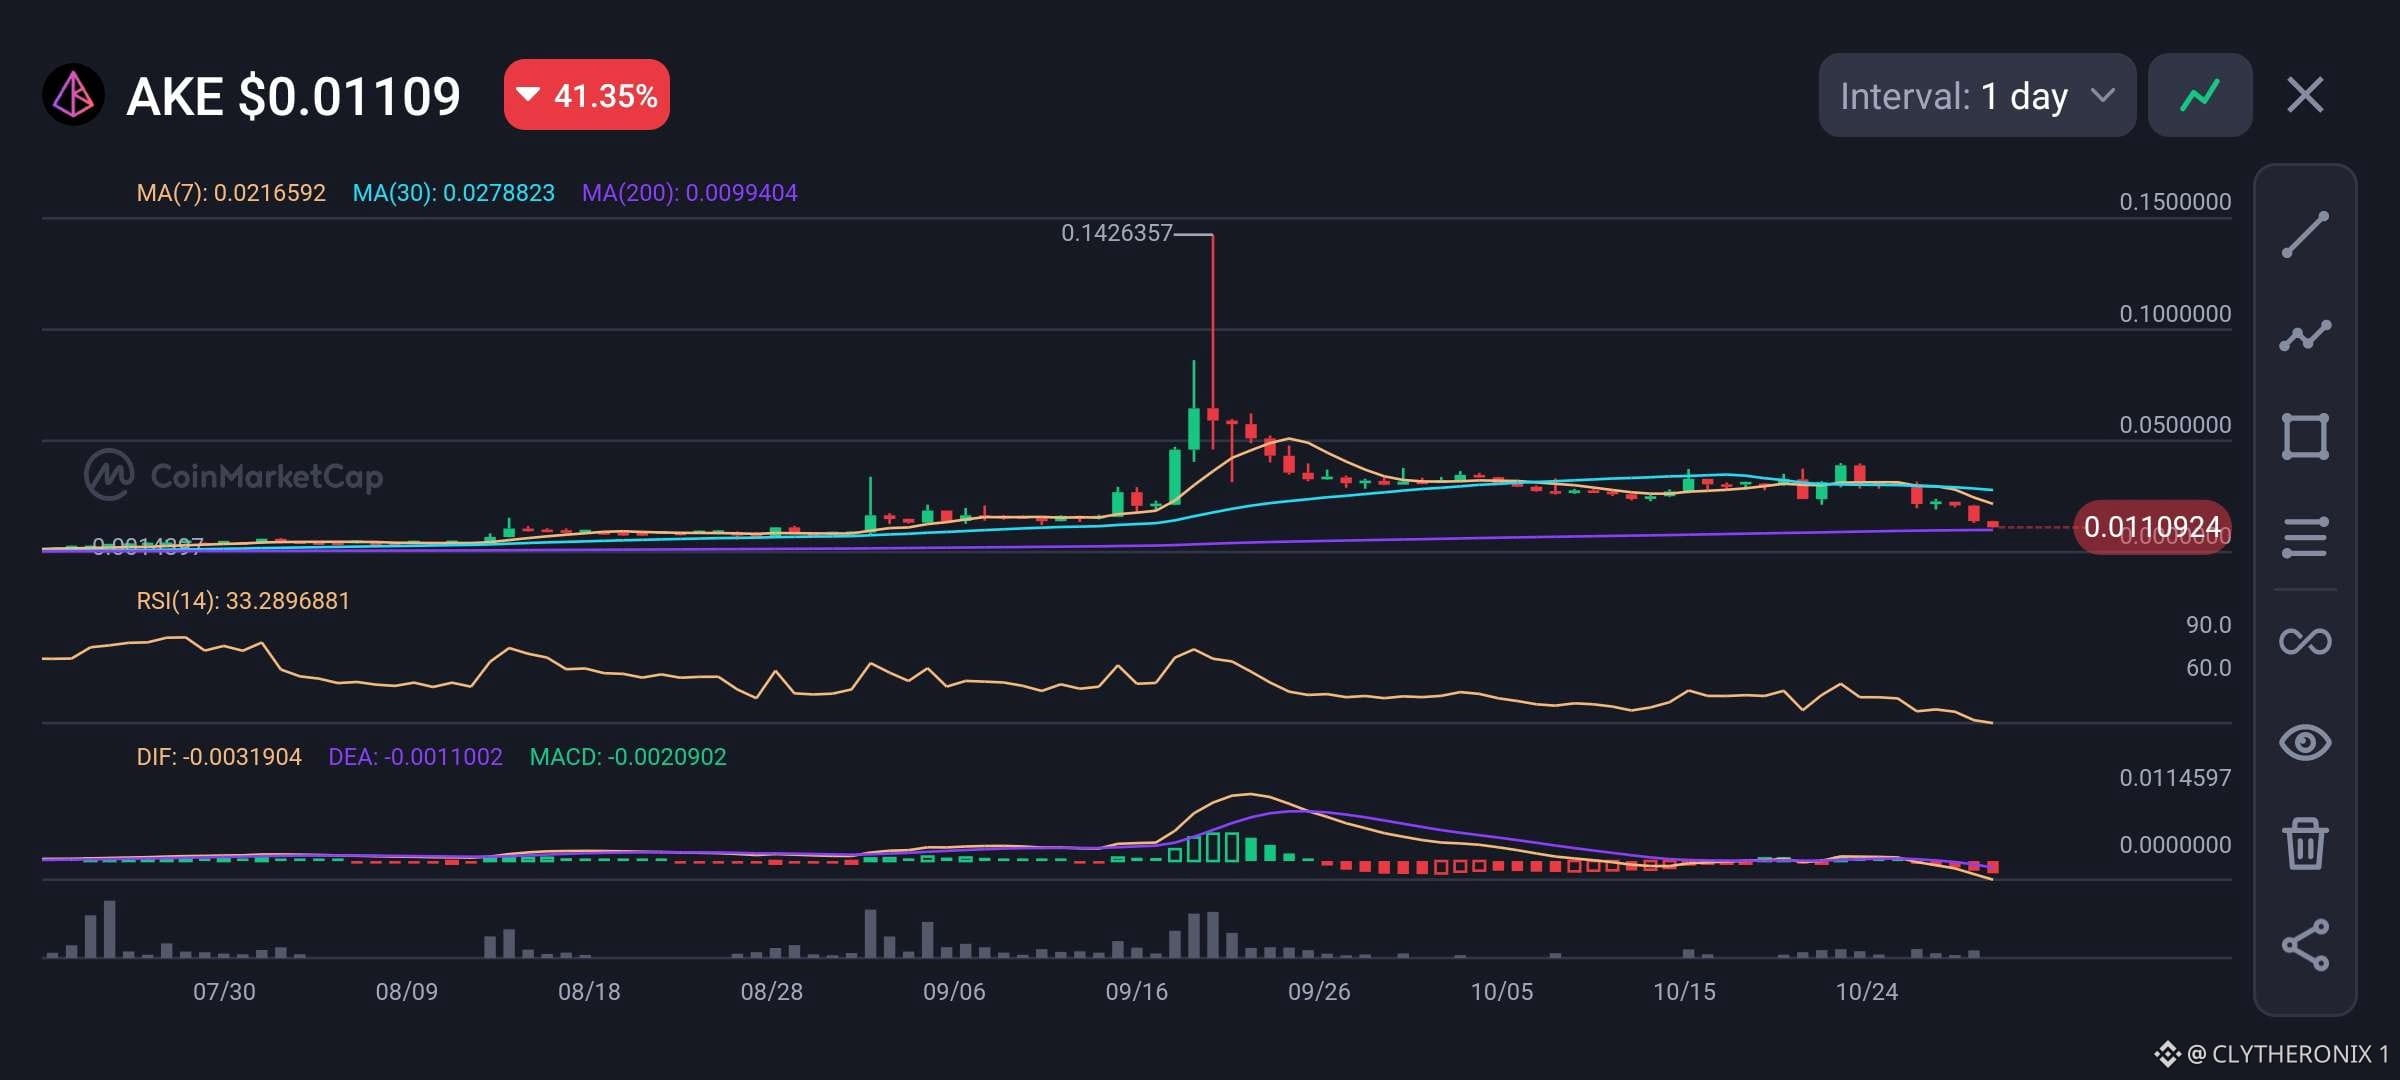
AKE is facing significant selling pressure, down approximately 41% over the past 24 hours and trading around $0.01109.
After its earlier explosive rally to a high near $0.1426, the token has experienced a sharp correction, giving back a substantial portion of its gains.
The technical picture remains bearish. Price is trading below both the 7-day moving average ($0.02166) and the 30-day moving average ($0.02788), indicating weakening short and medium-term momentum.
However, it remains slightly above the 200-day moving average near $0.00994, which is an important level to watch.
The RSI is around 33.29, approaching oversold territory. Meanwhile, the MACD remains negative, with the DIF below the signal line, suggesting that bearish momentum is still present.
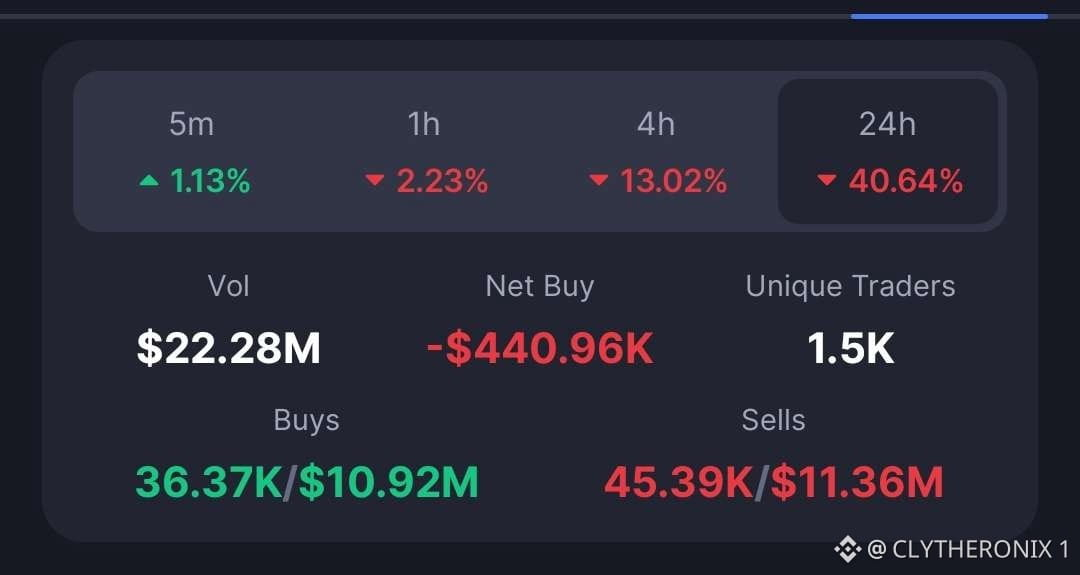
Trading activity also points to continued distribution. Despite $22.28M in 24-hour volume, sell activity exceeded buying, with approximately $11.36M in sells against $10.92M in buys. Net buying stands at -$440.96K, reinforcing the current selling pressure.
KEY $AKE MARKET METRICS
- Price: $0.01109
- 24H Change: -40.64%
- 24H Volume: $22.28M
- Net Buy: -$440.96K
- Unique Traders: 1.5K
- RSI (14): 33.29
KEY LEVELS TO WATCH
The $0.00994–$0.01000 region is a critical support area aligning with the 200-day moving average. A breakdown below this zone could expose $AKE to further downside.
On the upside, I’ll be watching for a recovery above $0.02166, followed by the $0.02788 region. Reclaiming these moving averages would provide an early indication that buyers are regaining control.
I’ll be watching whether the $0.010 area holds and whether net buying turns positive. Until then, protecting capital and waiting for confirmation may be the more prudent approach.
Disclaimer: This is my market research, not financial advice.
#Altcoin Season#
AKE DROPS OVER 40%, WILL KEY SUPPORT HOLD?
AKE is facing significant selling pressure, down approximately 41% over the past 24 hours and trading around $0.01109.
After its earlier explosive rally to a high near $0.1426, the token has experienced a sharp correction, giving back a substantial portion of its gains.
The technical picture remains bearish. Price is trading below both the 7-day moving average ($0.02166) and the 30-day moving average ($0.02788), indicating weakening short and medium-term momentum.
However, it remains slightly above the 200-day moving average near $0.00994, which is an important level to watch.
The RSI is around 33.29, approaching oversold territory. Meanwhile, the MACD remains negative, with the DIF below the signal line, suggesting that bearish momentum is still present.
Trading activity also points to continued distribution. Despite $22.28M in 24-hour volume, sell activity exceeded buying, with approximately $11.36M in sells against $10.92M in buys. Net buying stands at -$440.96K, reinforcing the current selling pressure.
KEY $AKE MARKET METRICS
- Price: $0.01109
- 24H Change: -40.64%
- 24H Volume: $22.28M
- Net Buy: -$440.96K
- Unique Traders: 1.5K
- RSI (14): 33.29
KEY LEVELS TO WATCH
The $0.00994–$0.01000 region is a critical support area aligning with the 200-day moving average. A breakdown below this zone could expose $AKE to further downside.
On the upside, I’ll be watching for a recovery above $0.02166, followed by the $0.02788 region. Reclaiming these moving averages would provide an early indication that buyers are regaining control.
I’ll be watching whether the $0.010 area holds and whether net buying turns positive. Until then, protecting capital and waiting for confirmation may be the more prudent approach.
Disclaimer: This is my market research, not financial advice.
#Altcoin Season#
AKE is facing significant selling pressure, down approximately 41% over the past 24 hours and trading around $0.01109.
After its earlier explosive rally to a high near $0.1426, the token has experienced a sharp correction, giving back a substantial portion of its gains.
The technical picture remains bearish. Price is trading below both the 7-day moving average ($0.02166) and the 30-day moving average ($0.02788), indicating weakening short and medium-term momentum.
However, it remains slightly above the 200-day moving average near $0.00994, which is an important level to watch.
The RSI is around 33.29, approaching oversold territory. Meanwhile, the MACD remains negative, with the DIF below the signal line, suggesting that bearish momentum is still present.
Trading activity also points to continued distribution. Despite $22.28M in 24-hour volume, sell activity exceeded buying, with approximately $11.36M in sells against $10.92M in buys. Net buying stands at -$440.96K, reinforcing the current selling pressure.
KEY $AKE MARKET METRICS
- Price: $0.01109
- 24H Change: -40.64%
- 24H Volume: $22.28M
- Net Buy: -$440.96K
- Unique Traders: 1.5K
- RSI (14): 33.29
KEY LEVELS TO WATCH
The $0.00994–$0.01000 region is a critical support area aligning with the 200-day moving average. A breakdown below this zone could expose $AKE to further downside.
On the upside, I’ll be watching for a recovery above $0.02166, followed by the $0.02788 region. Reclaiming these moving averages would provide an early indication that buyers are regaining control.
I’ll be watching whether the $0.010 area holds and whether net buying turns positive. Until then, protecting capital and waiting for confirmation may be the more prudent approach.
Disclaimer: This is my market research, not financial advice.
#Altcoin Season#
74
BEAM TĂNG VỌT HƠN 35% KHI CÚ BỨT PHÁ MẠNH PHÁT TÍN HIỆU ĐỘNG LỰC TĂNG GIÁ
Tôi nhận thấy Beam ($BEAM) đang giao dịch tăng mạnh ở mức $0.004632, tăng 36.05% trên biểu đồ ngày, sau cú bứt phá mạnh khỏi vùng tích lũy kéo dài nhiều tháng.
Hoạt động giao dịch cũng tăng tốc, với khối lượng 24 giờ đạt $117.79 triệu, so với vốn hóa thị trường $233.10 triệu và định giá pha loãng hoàn toàn $270.88 triệu.
Các chỉ số thị trường chính
- Giá: $0.004632
- Biến động 24 giờ: +36.05%
- MA(7): $0.003464
- MA(30): $0.002917
- MA(200): $0.001836
- RSI(14): 78.76 (Quá mua)
- MACD: Giao cắt tăng giá, histogram ở mức 0.000074
Theo quan điểm của tôi, $BEAM đang cho thấy một cú bứt phá tăng giá mạnh, với giá giao dịch cao hơn đáng kể so với các đường trung bình động ngắn, trung và dài hạn. Sự đồng thuận này củng cố xu hướng chung tích cực, trong khi cấu hình MACD tăng giá tiếp thêm sức mạnh cho áp lực mua hiện tại.
Tuy nhiên, RSI ở mức 78.76 cho thấy tình trạng quá mua, làm tăng khả năng chốt lời ngắn hạn hoặc tích lũy sau đợt tăng mạnh. Đà tăng gần đây hướng tới $0.005238 cũng cho thấy người mua có thể gặp kháng cự khi những người tham gia sớm cân nhắc chốt lời.
Xét về mặt kỹ thuật, $0.00350 là vùng hỗ trợ quan trọng, gần với đường trung bình động 7 ngày, trong khi $0.005238 là mức kháng cự trước mắt tại đỉnh gần đây. Việc giữ vững trên $0.00400 và hình thành đáy cao hơn có thể củng cố thiết lập tăng giá, còn nếu duy trì được đà bứt phá vượt $0.005238, giá có thể tiếp tục tăng cao hơn.
Tôi sẽ theo dõi xem khối lượng giao dịch có duy trì ở mức cao hay không, cũng như liệu người mua có thể bảo vệ các mức bứt phá gần đây mà không dẫn đến một đợt điều chỉnh sâu hơn hay không.
Tuyên bố miễn trừ trách nhiệm: Phân tích này phản ánh nghiên cứu cá nhân của tôi và chỉ nhằm mục đích cung cấp thông tin. Đây không phải là lời khuyên tài chính. Hãy luôn tự nghiên cứu trước khi đưa ra quyết định đầu tư.
BEAM TĂNG VỌT HƠN 35% KHI CÚ BỨT PHÁ MẠNH PHÁT TÍN HIỆU ĐỘNG LỰC TĂNG GIÁ
Tôi nhận thấy Beam ($BEAM) đang giao dịch tăng mạnh ở mức $0.004632, tăng 36.05% trên biểu đồ ngày, sau cú bứt phá mạnh khỏi vùng tích lũy kéo dài nhiều tháng.
Hoạt động giao dịch cũng tăng tốc, với khối lượng 24 giờ đạt $117.79 triệu, so với vốn hóa thị trường $233.10 triệu và định giá pha loãng hoàn toàn $270.88 triệu.
Các chỉ số thị trường chính
- Giá: $0.004632
- Biến động 24 giờ: +36.05%
- MA(7): $0.003464
- MA(30): $0.002917
- MA(200): $0.001836
- RSI(14): 78.76 (Quá mua)
- MACD: Giao cắt tăng giá, histogram ở mức 0.000074
Theo quan điểm của tôi, $BEAM đang cho thấy một cú bứt phá tăng giá mạnh, với giá giao dịch cao hơn đáng kể so với các đường trung bình động ngắn, trung và dài hạn. Sự đồng thuận này củng cố xu hướng chung tích cực, trong khi cấu hình MACD tăng giá tiếp thêm sức mạnh cho áp lực mua hiện tại.
Tuy nhiên, RSI ở mức 78.76 cho thấy tình trạng quá mua, làm tăng khả năng chốt lời ngắn hạn hoặc tích lũy sau đợt tăng mạnh. Đà tăng gần đây hướng tới $0.005238 cũng cho thấy người mua có thể gặp kháng cự khi những người tham gia sớm cân nhắc chốt lời.
Xét về mặt kỹ thuật, $0.00350 là vùng hỗ trợ quan trọng, gần với đường trung bình động 7 ngày, trong khi $0.005238 là mức kháng cự trước mắt tại đỉnh gần đây. Việc giữ vững trên $0.00400 và hình thành đáy cao hơn có thể củng cố thiết lập tăng giá, còn nếu duy trì được đà bứt phá vượt $0.005238, giá có thể tiếp tục tăng cao hơn.
Tôi sẽ theo dõi xem khối lượng giao dịch có duy trì ở mức cao hay không, cũng như liệu người mua có thể bảo vệ các mức bứt phá gần đây mà không dẫn đến một đợt điều chỉnh sâu hơn hay không.
Tuyên bố miễn trừ trách nhiệm: Phân tích này phản ánh nghiên cứu cá nhân của tôi và chỉ nhằm mục đích cung cấp thông tin. Đây không phải là lời khuyên tài chính. Hãy luôn tự nghiên cứu trước khi đưa ra quyết định đầu tư.
Tôi nhận thấy Beam ($BEAM) đang giao dịch tăng mạnh ở mức $0.004632, tăng 36.05% trên biểu đồ ngày, sau cú bứt phá mạnh khỏi vùng tích lũy kéo dài nhiều tháng.
Hoạt động giao dịch cũng tăng tốc, với khối lượng 24 giờ đạt $117.79 triệu, so với vốn hóa thị trường $233.10 triệu và định giá pha loãng hoàn toàn $270.88 triệu.
Các chỉ số thị trường chính
- Giá: $0.004632
- Biến động 24 giờ: +36.05%
- MA(7): $0.003464
- MA(30): $0.002917
- MA(200): $0.001836
- RSI(14): 78.76 (Quá mua)
- MACD: Giao cắt tăng giá, histogram ở mức 0.000074
Theo quan điểm của tôi, $BEAM đang cho thấy một cú bứt phá tăng giá mạnh, với giá giao dịch cao hơn đáng kể so với các đường trung bình động ngắn, trung và dài hạn. Sự đồng thuận này củng cố xu hướng chung tích cực, trong khi cấu hình MACD tăng giá tiếp thêm sức mạnh cho áp lực mua hiện tại.
Tuy nhiên, RSI ở mức 78.76 cho thấy tình trạng quá mua, làm tăng khả năng chốt lời ngắn hạn hoặc tích lũy sau đợt tăng mạnh. Đà tăng gần đây hướng tới $0.005238 cũng cho thấy người mua có thể gặp kháng cự khi những người tham gia sớm cân nhắc chốt lời.
Xét về mặt kỹ thuật, $0.00350 là vùng hỗ trợ quan trọng, gần với đường trung bình động 7 ngày, trong khi $0.005238 là mức kháng cự trước mắt tại đỉnh gần đây. Việc giữ vững trên $0.00400 và hình thành đáy cao hơn có thể củng cố thiết lập tăng giá, còn nếu duy trì được đà bứt phá vượt $0.005238, giá có thể tiếp tục tăng cao hơn.
Tôi sẽ theo dõi xem khối lượng giao dịch có duy trì ở mức cao hay không, cũng như liệu người mua có thể bảo vệ các mức bứt phá gần đây mà không dẫn đến một đợt điều chỉnh sâu hơn hay không.
Tuyên bố miễn trừ trách nhiệm: Phân tích này phản ánh nghiên cứu cá nhân của tôi và chỉ nhằm mục đích cung cấp thông tin. Đây không phải là lời khuyên tài chính. Hãy luôn tự nghiên cứu trước khi đưa ra quyết định đầu tư.
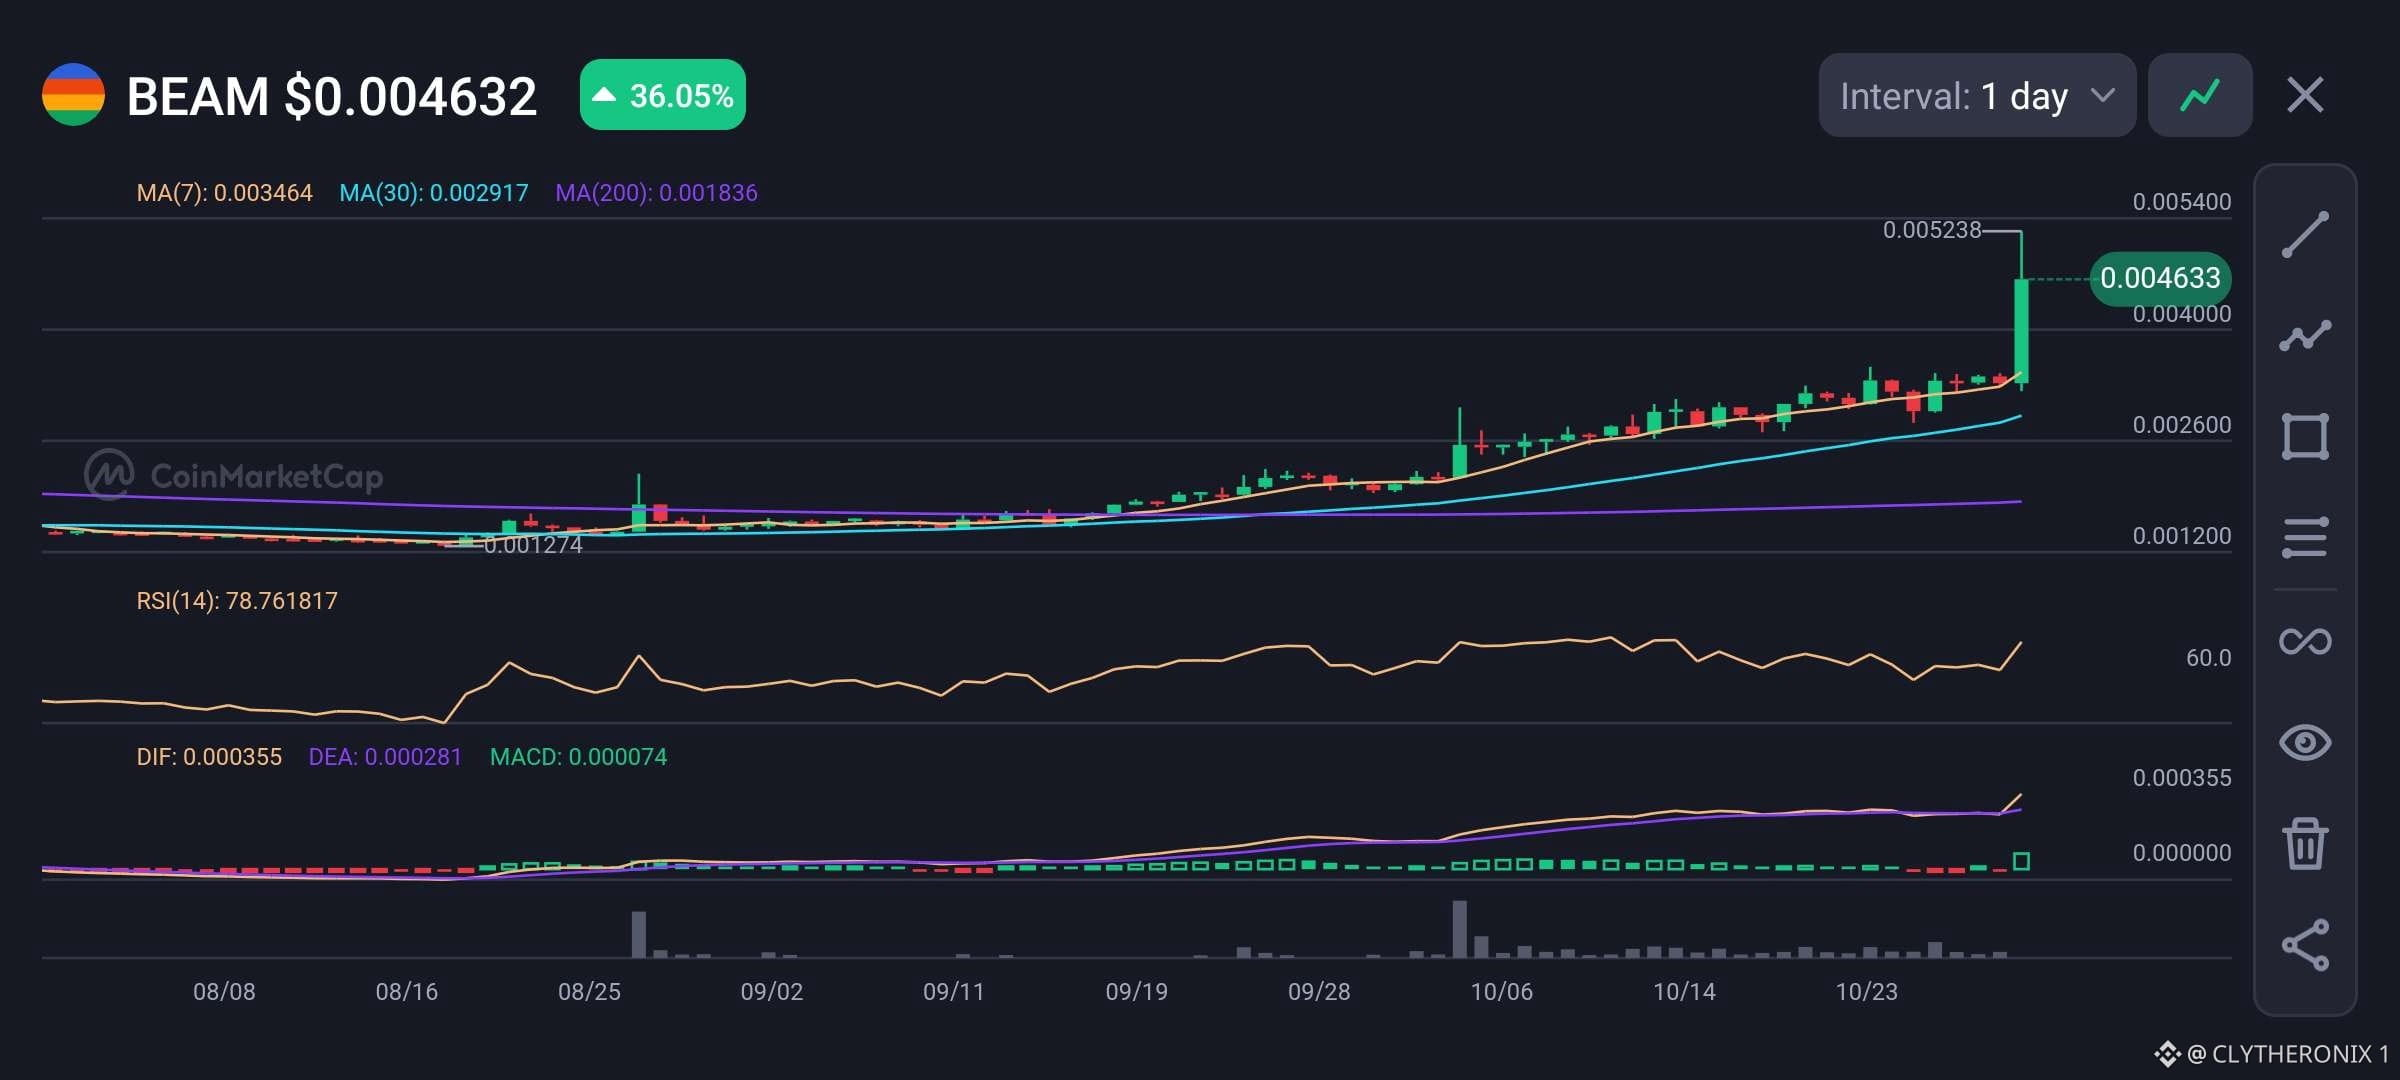
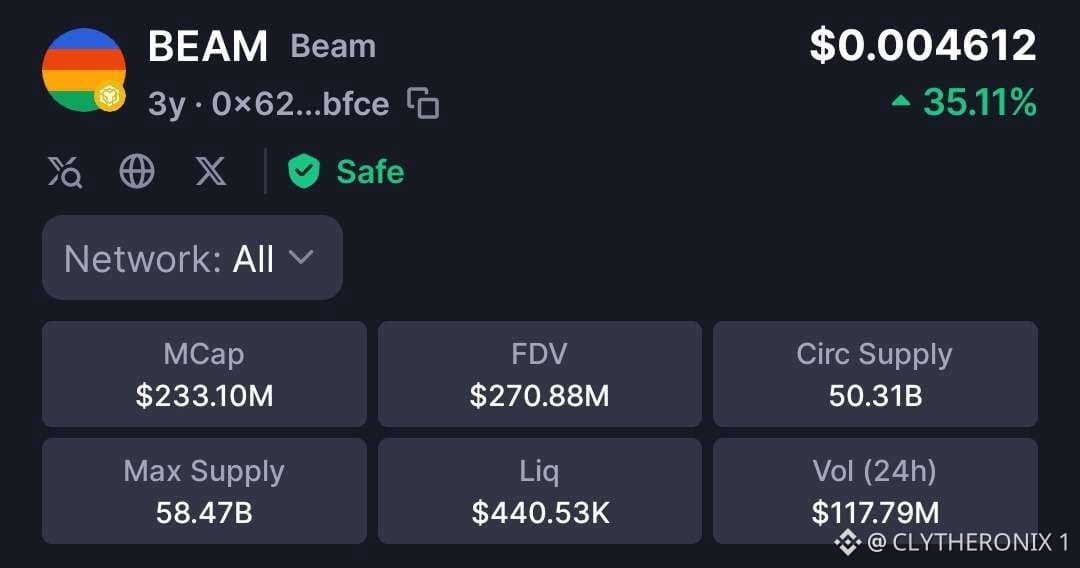
46
Tuyên bố của Binance mang lại sự yên tâm, nhưng người dùng vẫn nên thận trọng cho đến khi cuộc điều tra toàn diện hoàn tất.
Nếu những khoản thiệt hại được báo cáo được xác nhận, đây sẽ là một sự cố bảo mật nghiêm trọng, ngay cả khi tiền của khách hàng được bồi hoàn đầy đủ.
Điều quan trọng lúc này là sự minh bạch, nhanh chóng thu hồi số tiền bị đánh cắp và tăng cường các biện pháp bảo mật để ngăn sự việc tái diễn.
Người dùng nên tránh hoảng loạn, nhưng cũng không nên phớt lờ các rủi ro. Tin tức này đã ảnh hưởng đến thị trường. Hãy xem $BTC, $ETH, $BNB, v.v.
Luôn theo dõi các cập nhật chính thức từ Binance và đừng bao giờ tin vào những đường dẫn hoặc tin nhắn không rõ nguồn gốc tuyên bố có thể giúp thu hồi tiền.
An toàn và niềm tin phải luôn được đặt lên hàng đầu trong lĩnh vực tiền mã hóa. Tạm biệt.
Tuyên bố của Binance mang lại sự yên tâm, nhưng người dùng vẫn nên thận trọng cho đến khi cuộc điều tra toàn diện hoàn tất.
Nếu những khoản thiệt hại được báo cáo được xác nhận, đây sẽ là một sự cố bảo mật nghiêm trọng, ngay cả khi tiền của khách hàng được bồi hoàn đầy đủ.
Điều quan trọng lúc này là sự minh bạch, nhanh chóng thu hồi số tiền bị đánh cắp và tăng cường các biện pháp bảo mật để ngăn sự việc tái diễn.
Người dùng nên tránh hoảng loạn, nhưng cũng không nên phớt lờ các rủi ro. Tin tức này đã ảnh hưởng đến thị trường. Hãy xem $BTC, $ETH, $BNB, v.v.
Luôn theo dõi các cập nhật chính thức từ Binance và đừng bao giờ tin vào những đường dẫn hoặc tin nhắn không rõ nguồn gốc tuyên bố có thể giúp thu hồi tiền.
An toàn và niềm tin phải luôn được đặt lên hàng đầu trong lĩnh vực tiền mã hóa. Tạm biệt.
Nếu những khoản thiệt hại được báo cáo được xác nhận, đây sẽ là một sự cố bảo mật nghiêm trọng, ngay cả khi tiền của khách hàng được bồi hoàn đầy đủ.
Điều quan trọng lúc này là sự minh bạch, nhanh chóng thu hồi số tiền bị đánh cắp và tăng cường các biện pháp bảo mật để ngăn sự việc tái diễn.
Người dùng nên tránh hoảng loạn, nhưng cũng không nên phớt lờ các rủi ro. Tin tức này đã ảnh hưởng đến thị trường. Hãy xem $BTC, $ETH, $BNB, v.v.
Luôn theo dõi các cập nhật chính thức từ Binance và đừng bao giờ tin vào những đường dẫn hoặc tin nhắn không rõ nguồn gốc tuyên bố có thể giúp thu hồi tiền.
An toàn và niềm tin phải luôn được đặt lên hàng đầu trong lĩnh vực tiền mã hóa. Tạm biệt.

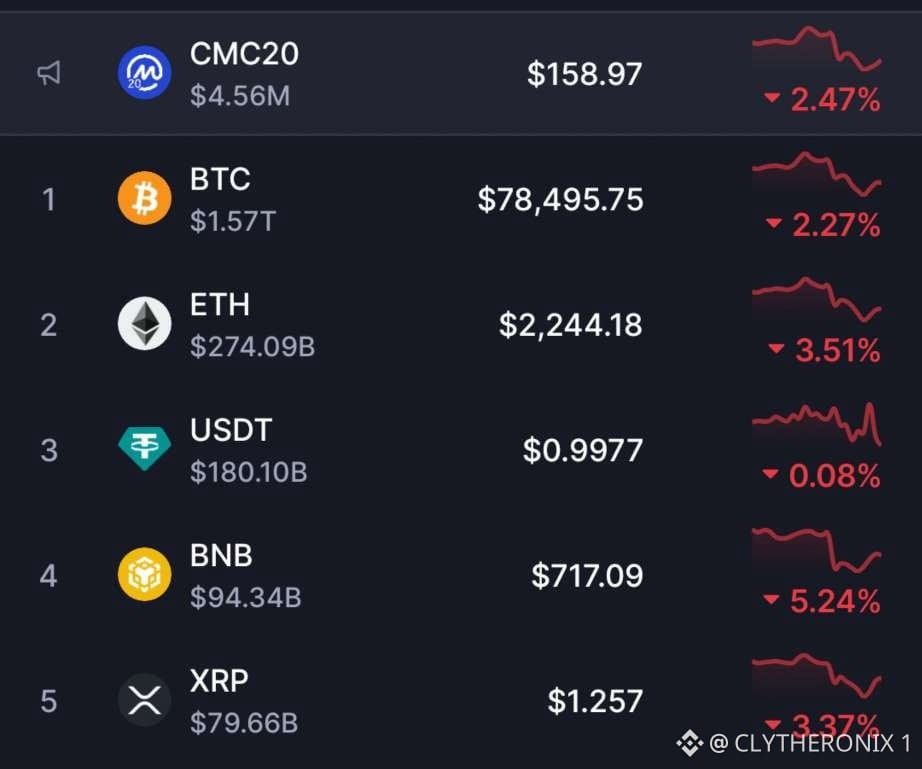
51
Đăng nhập để khám phá thêm nội dung
Tham gia cùng người dùng tiền mã hóa toàn cầu trên Binance Square
⚡️ Nhận thông tin mới nhất và hữu ích về tiền mã hóa.
💬 Được tin cậy bởi sàn giao dịch tiền mã hóa lớn nhất thế giới.
👍 Khám phá những thông tin chuyên sâu thực tế từ những nhà sáng tạo đã xác minh.
Email / Số điện thoại
Chủ đề thịnh hành
TheoDõiFOMC
359,067 lượt xem
1,534 đang thảo luận
ĐỢT TĂNG LÃI SUẤT THÁNG 12 CỦA FED ĐÃ ĐƯỢC TÍNH VÀO GIÁ, VÌ VẬY BIÊN BẢN CUỘC HỌP HÔM THỨ TƯ QUAN TRỌNG VÌ MỘT LÝ DO KHÁC
Ngày 28 tháng 10, Fed giữ lãi suất ở mức 3,75% đến 4%, một tháng sau đợt tăng 0,25 điểm phần trăm vào tháng 9
Kết quả bỏ phiếu là 10-2, và cả hai người bất đồng, Lisa Cook và Beth Hammack, đều muốn tăng lãi suất thêm ngay lập tức
📅 Biên bản cuộc họp đó dự kiến được công bố vào thứ Tư, ngày 18 tháng 11, lúc 2:00 PM ET, tức 02:00 thứ Năm tại Việt Nam
🔍 Các dự báo dựa trên hợp đồng tương lai đã xem việc tăng lãi suất vào tháng 12 là kịch bản cơ bản, vì vậy xác nhận điều đó cũng không bổ sung nhiều thông tin
Tín hiệu thực sự là có bao nhiêu quan chức khác nghiêng về phía tăng lãi suất, và liệu họ có đề cập đến nhiều hơn một lần tăng nữa hay không
Một danh sách dài những người tham gia ủng hộ việc thắt chặt hơn nữa sẽ đẩy lộ trình lãi suất lên cao hơn, chứ không chỉ riêng tháng 12
⚠️ Với các nhà giao dịch tiền mã hóa, thời điểm công bố mới là rủi ro
Thông tin được công bố vào khung giờ đêm khuya ít giao dịch ở châu Á, khi các vị thế sử dụng đòn bẩy có thể nhanh chóng bị thanh lý
Thay vào đó, nếu biên bản cho thấy nhiều người không muốn tiếp tục tăng lãi suất, áp lực có thể dịu bớt $ $BTC
#TheoDõiFOMC #TinFed
5phútcryto
·0 lượt thích
·315 lượt xem
TinFed
422,594 lượt xem
1,291 đang thảo luận
NvidiaBeatsEstimatesWith$130BQ4Outlook
0 lượt xem
1 đang thảo luận