BEAM SURGES OVER 35% AS STRONG BREAKOUT SIGNALS BULLISH MOMENTUM
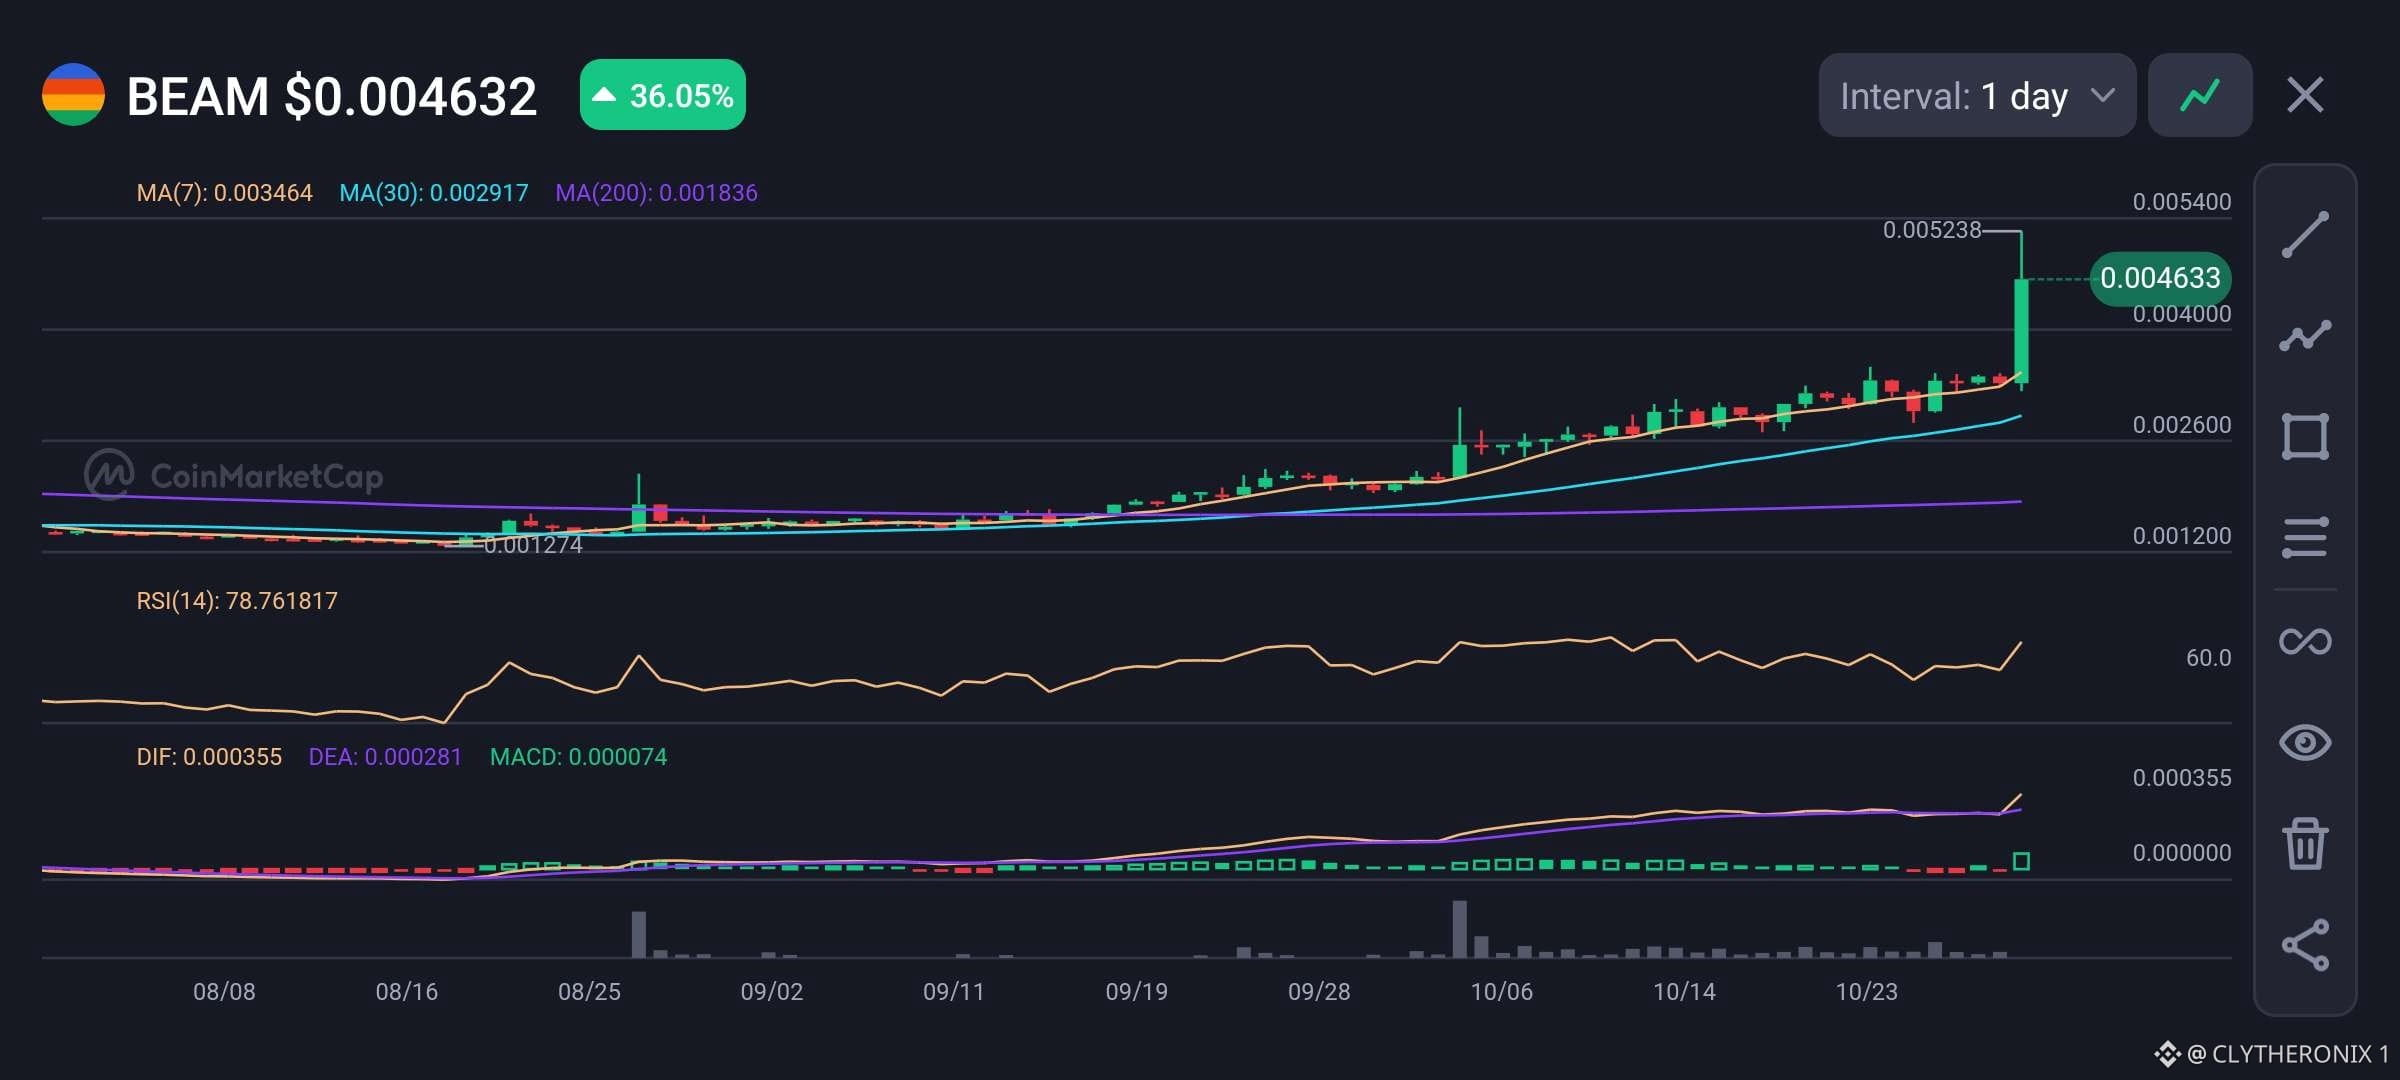
I’m observing Beam ( $BEAM) trading sharply higher at $0.004632, up 36.05% on the daily chart, following an aggressive breakout from its multi-month consolidation range.
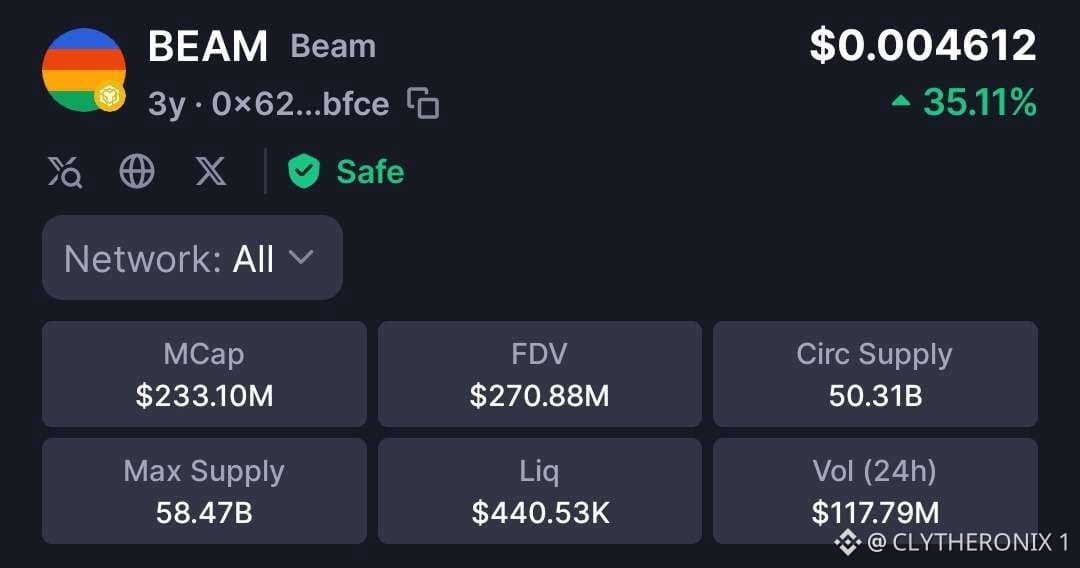
Trading activity has also accelerated, with 24-hour volume reaching $117.79 million against a market capitalization of $233.10 million and a fully diluted valuation of $270.88 million.
Key Market Metrics
- Price: $0.004632
- 24-hour change: +36.05%
- MA(7): $0.003464
- MA(30): $0.002917
- MA(200): $0.001836
- RSI(14): 78.76 (Overbought)
- MACD: Bullish crossover, histogram at 0.000074
In my view, $BEAM is showing a strong bullish breakout, with price trading comfortably above its short, medium, and long-term moving averages. This alignment supports a positive broader trend, while the bullish MACD configuration reinforces the current buying pressure.
However, the RSI at 78.76 indicates overbought conditions, increasing the possibility of short-term profit-taking or consolidation after the sharp rally. The recent move toward $0.005238 also suggests that buyers may face resistance as early participants consider securing gains.
From a technical perspective, $0.00350 is the key support zone, aligning closely with the 7-day moving average, while $0.005238 represents immediate resistance at the recent high. Holding above $0.00400 and establishing a higher low could strengthen the bullish setup, while a sustained break above $0.005238 may open the way for further upside.
I’ll be watching whether trading volume remains elevated and whether buyers can defend the recent breakout levels without triggering a deeper correction.
Disclaimer: This analysis reflects my personal research and is for informational purposes only. It is not financial advice. Always conduct your own research before making investment decisions.