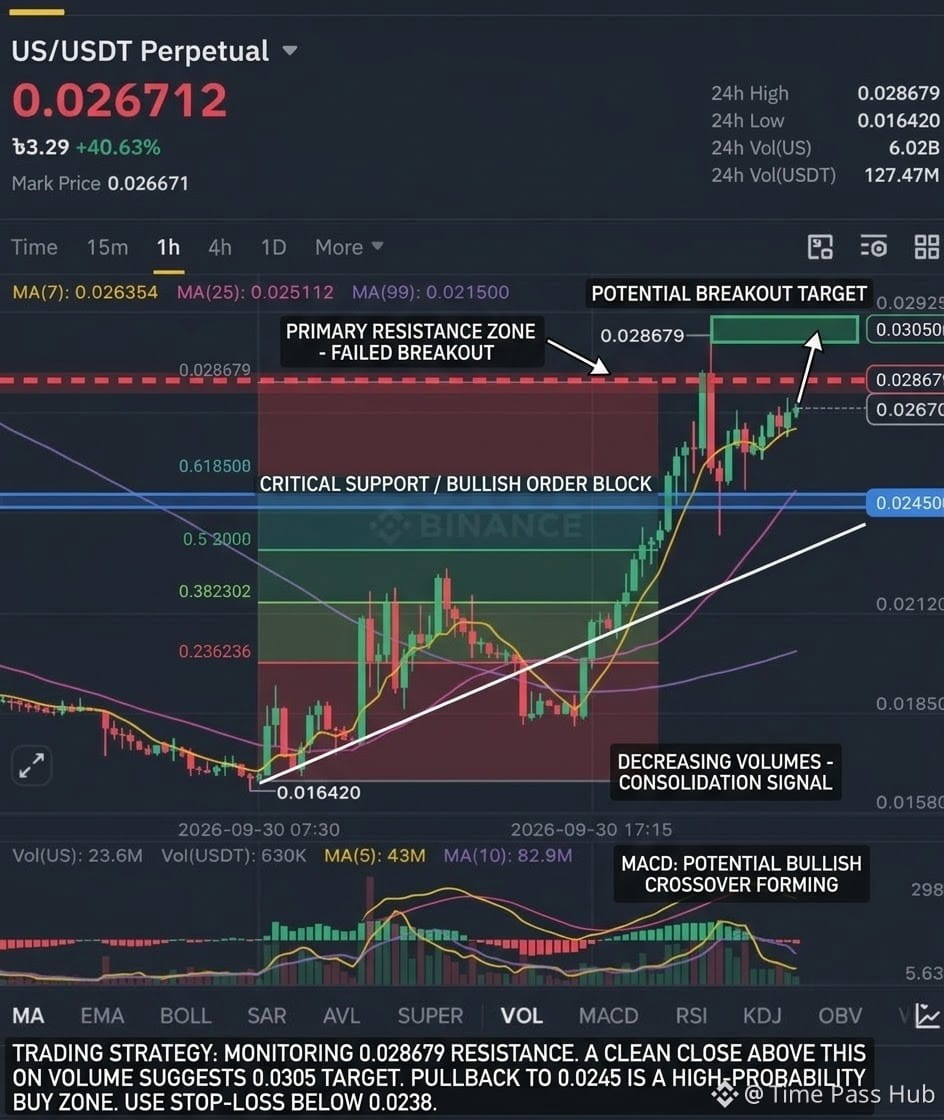
Based on the provided 15-minute Binance futures chart for $US (or US/USDT), the price is in a strong short-term bullish continuation phase following a major breakout, but it is currently consolidating near local highs.
Key Technical Observations
* Trend & Price Action:
* Current Price: 0.026712 USDT (+40.63% overall gains).
* The chart shows a strong impulse rally that peaked at 0.028679 USDT.
* Following that local peak, price pulled back, established a higher low, and is now grinding back up toward the resistance zone.
* Moving Averages (MA):
* MA(7) (Yellow - 0.026178): Price is holding above the short-term 7-period moving average, signaling active buyer control on the lower timeframes.
* MA(25) (Purple - 0.024497) & MA(99) (Purple - 0.020184): These lines are sloped sharply upward and arranged in a healthy bullish alignment (MA7 > MA25 > MA99).
* Volume (VOL):
* High volume spiked during the primary move up to $0.028679, indicating strong institutional or breakout buying.
* The current consolidation phase shows lower volume, which is typical before the next potential directional move.
Key Trading Levels & Outlook
* Immediate Resistance: 0.028679 USDT (24h High). A clean 15m candle close above this level could push price toward psychological targets like 0.0300 USDT.
* Immediate Support: 0.02617 - 0.02580 USDT (Aligned with the MA(7) and dynamic support).
* Major Support / Defense Line: 0.02450 USDT (MA(25) zone). Losing this level invalidates short-term bullish momentum.
Trade Scenarios
* Bullish (Long): Look for confirmation of a breakout above 0.02868 with expanding volume, targeting higher expansion. Alternatively, look for pullbacks near 0.02610 - 0.02580 with tight stop losses.
* Bearish (Short): A breakdown below 0.02580 could trigger a deeper correction back toward 0.02450 or 0.02200 to reset indicators.
#Binance #TradingSignals #MarketAnalysis #Write2Earn #analysis $US
$MOVR
Key Technical Observations
* Trend & Price Action:
* Current Price: 0.026712 USDT (+40.63% overall gains).
* The chart shows a strong impulse rally that peaked at 0.028679 USDT.
* Following that local peak, price pulled back, established a higher low, and is now grinding back up toward the resistance zone.
* Moving Averages (MA):
* MA(7) (Yellow - 0.026178): Price is holding above the short-term 7-period moving average, signaling active buyer control on the lower timeframes.
* MA(25) (Purple - 0.024497) & MA(99) (Purple - 0.020184): These lines are sloped sharply upward and arranged in a healthy bullish alignment (MA7 > MA25 > MA99).
* Volume (VOL):
* High volume spiked during the primary move up to $0.028679, indicating strong institutional or breakout buying.
* The current consolidation phase shows lower volume, which is typical before the next potential directional move.
Key Trading Levels & Outlook
* Immediate Resistance: 0.028679 USDT (24h High). A clean 15m candle close above this level could push price toward psychological targets like 0.0300 USDT.
* Immediate Support: 0.02617 - 0.02580 USDT (Aligned with the MA(7) and dynamic support).
* Major Support / Defense Line: 0.02450 USDT (MA(25) zone). Losing this level invalidates short-term bullish momentum.
Trade Scenarios
* Bullish (Long): Look for confirmation of a breakout above 0.02868 with expanding volume, targeting higher expansion. Alternatively, look for pullbacks near 0.02610 - 0.02580 with tight stop losses.
* Bearish (Short): A breakdown below 0.02580 could trigger a deeper correction back toward 0.02450 or 0.02200 to reset indicators.
#Binance #TradingSignals #MarketAnalysis #Write2Earn #analysis $US
$MOVR