

#osmo
osmo
329,373 lượt xem
2,780 đang thảo luận
Phổ biến
Mới nhất

$OSMO tăng 17,1% trong khi thị trường gần như đi ngang — nhưng thanh khoản vẫn là dấu hỏi.
Binance Spot | 26/10/2026, 18:16 GMT+7
OSMO: 0,0527 | 24h +17,11% | đỉnh 0,0560
BTC: 80.260 | 24h -0,13%
Điều dữ liệu cho thấy:
• OSMO đang nằm trong nhóm coin được cộng đồng Binance chú ý nhất.
• Khối lượng OSMO/USDT trên Binance Spot mới khoảng 2,15M USDT/24h — khá mỏng so với mức tăng giá.
• Binance không có hợp đồng USDⓈ-M OSMO, nên không thể dùng OI, funding hay thanh lý để xác nhận dòng tiền đòn bẩy.
• Đề xuất chấm dứt phát hành OSMO lạm phát được đăng trên diễn đàn Osmosis ngày 14/10 là một narrative hỗ trợ, nhưng chưa đủ để khẳng định đó là nguyên nhân trực tiếp của cú tăng hôm nay.
Mốc theo dõi:
• Đóng 1h trên 0,0542 rồi vượt 0,0560: động lượng tăng được xác nhận lại.
• Mất 0,0520: đà tăng ngắn hạn suy yếu.
• Đóng 1h dưới 0,0494: cú breakout có nguy cơ thất bại.
Theo dõi M8 Crypto Radar nếu bạn muốn nhận cảnh báo khi giá và dữ liệu thực sự xác nhận lẫn nhau.
Nguồn: Binance Spot ticker, nến 1h, Binance Hot Coins; Osmosis Community Hall, đề xuất ngày 14/10/2026. AI-assisted research. Educational only. #OSMO #BTC #RiskManagement
72


·
--
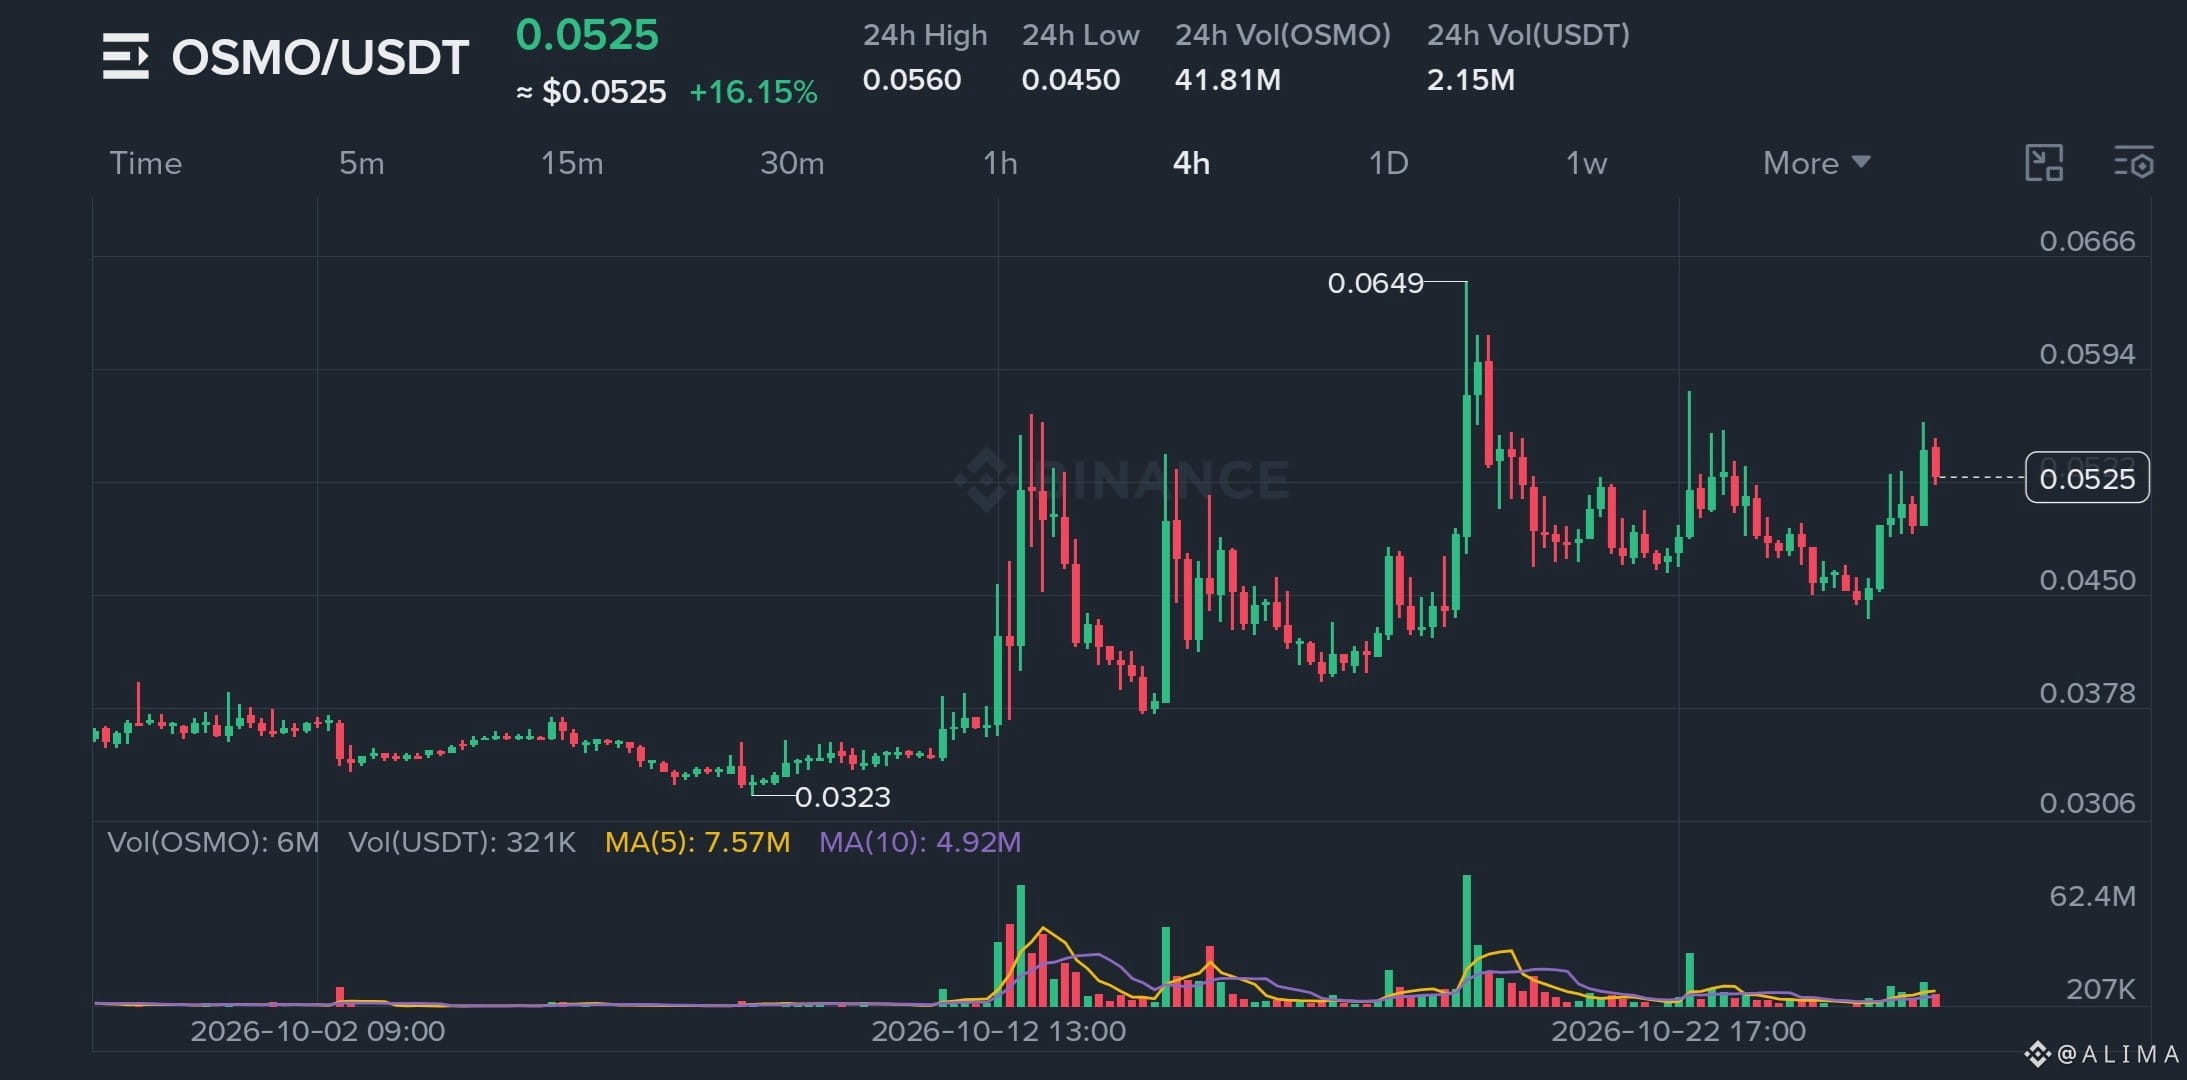
$OSMO đang tiến gần vùng kháng cự quan trọng sau một đợt tăng mạnh.
Vùng vào lệnh (Long): $0.0480 – $0.0500
Cắt lỗ (SL): $0.0440
Các mục tiêu:
TP1: $0.0560
TP2: $0.0595
TP3: $0.0645
Vùng kháng cự: $0.0560 – $0.0600
OSMO đang giao dịch quanh mức $0.0525, vì vậy hãy tránh mua đuổi sau đợt tăng nóng ở mức giá hiện tại. Một nhịp điều chỉnh về vùng vào lệnh có thể mang đến cơ hội tốt hơn, trong khi việc bị từ chối gần vùng kháng cự có thể kích hoạt hoạt động chốt lời.
Hãy chờ xác nhận trước khi vào lệnh và quản lý rủi ro cẩn thận.
#Write2Earn #osmo
Andrew Smithh:
Eyes on key resistance
16
28
2.1k

·
--
Tăng giá
Đã xác minh
Xem bản dịch
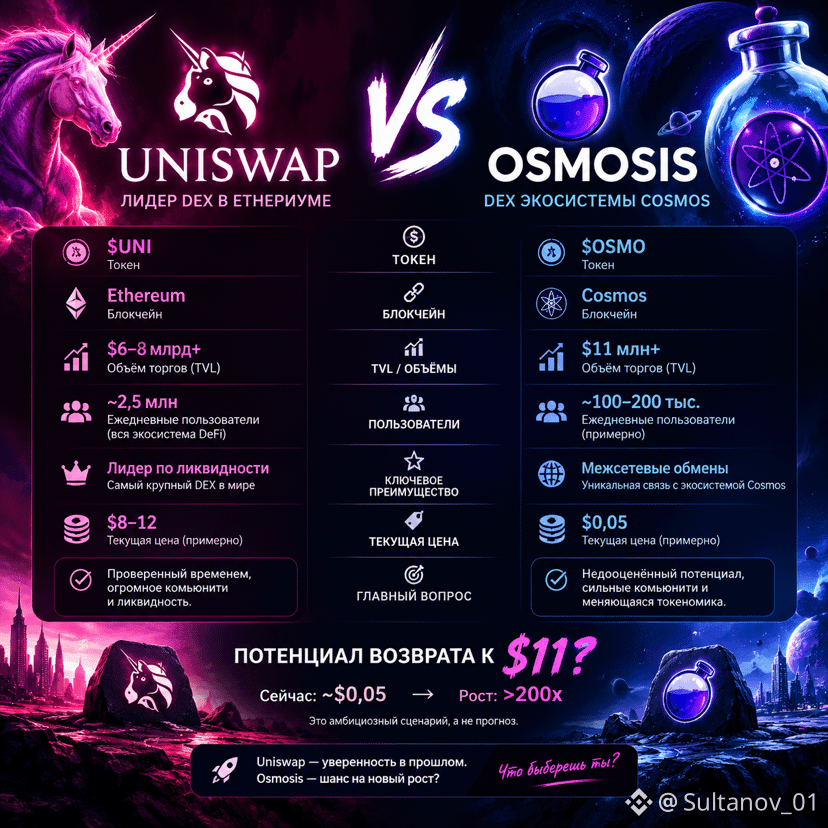
🔥 OSMO: МОЖЕТ ЛИ ПОВТОРИТЬСЯ ИСТОРИЯ $11?
Osmosis — DEX экосистемы Cosmos, который может получить второй шанс!
📊 Цена OSMO — около $0,05.
📈 За последние 24 часа рынок показал рост и увеличение торговой активности.
⚡ Предложение №1053 об остановке инфляционной эмиссии получило поддержку сообщества — потенциально важный шаг для токеномики.
🔵 Сравнение с Uniswap: обе платформы работают в секторе децентрализованных бирж, но Uniswap значительно крупнее. Если Cosmos вернёт популярность, у Osmosis может появиться шанс на серьёзное восстановление.
💎 Раньше OSMO стоил около $11. Возврат к этой цене означал бы рост более чем в 200 раз от $0,05. Возможно ли это? Теоретически — да, но это крайне амбициозный сценарий, а не прогноз на ближайшее время.
❓ OSMO — забытый DeFi-проект или потенциальный сюрприз следующего бычьего рынка?
#osmo #OSMOSIS #Cosmos #Crypto
#UNI
$UNI $OSMO
{spot}(OSMOUSDT)
{spot}(UNIUSDT)
🔥 OSMO: МОЖЕТ ЛИ ПОВТОРИТЬСЯ ИСТОРИЯ $11?
Osmosis — DEX экосистемы Cosmos, который может получить второй шанс!
📊 Цена OSMO — около $0,05.
📈 За последние 24 часа рынок показал рост и увеличение торговой активности.
⚡ Предложение №1053 об остановке инфляционной эмиссии получило поддержку сообщества — потенциально важный шаг для токеномики.
🔵 Сравнение с Uniswap: обе платформы работают в секторе децентрализованных бирж, но Uniswap значительно крупнее. Если Cosmos вернёт популярность, у Osmosis может появиться шанс на серьёзное восстановление.
💎 Раньше OSMO стоил около $11. Возврат к этой цене означал бы рост более чем в 200 раз от $0,05. Возможно ли это? Теоретически — да, но это крайне амбициозный сценарий, а не прогноз на ближайшее время.
❓ OSMO — забытый DeFi-проект или потенциальный сюрприз следующего бычьего рынка?
#osmo #OSMOSIS #Cosmos #Crypto
#UNI
$UNI $OSMO
612

·
--
Xem bản dịch
评论区瞬间变成分析师大会,只有我还在查这个名字是什么意思。
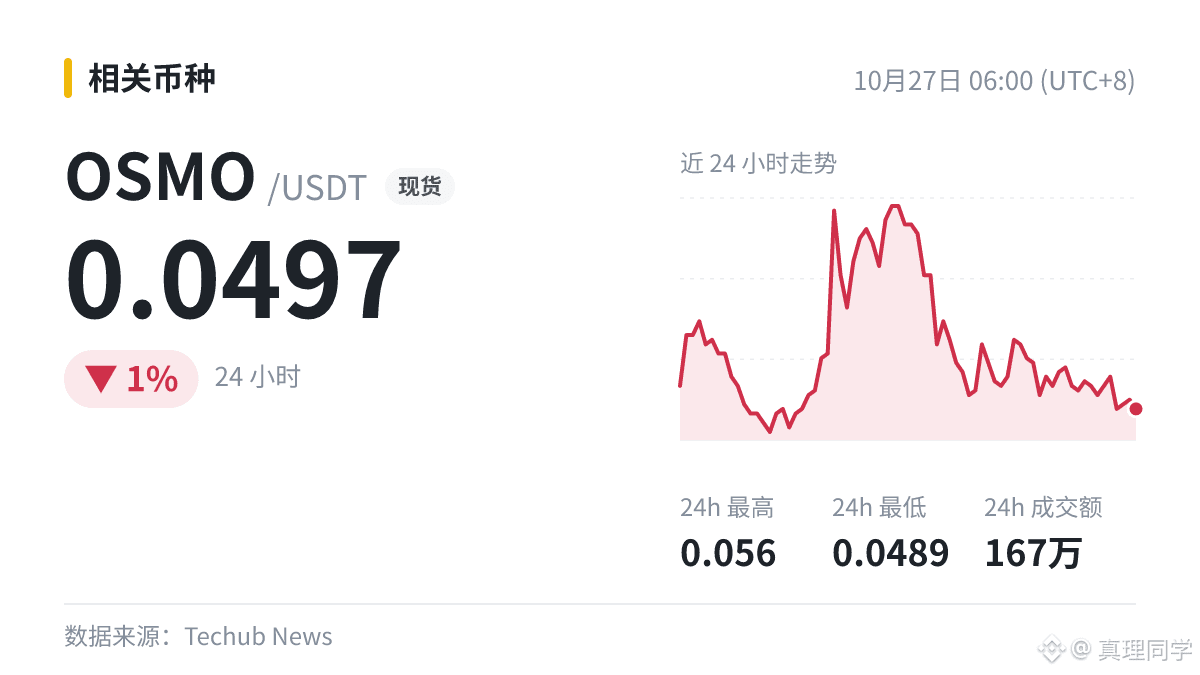
事情是这样的:Osmosis 终止 OSMO 通胀,质押奖励将转向协议收入。
$OSMO ,留意这条会不会被更多媒体跟进,转载越多影响越重。
#OSMO
评论区瞬间变成分析师大会,只有我还在查这个名字是什么意思。
事情是这样的:Osmosis 终止 OSMO 通胀,质押奖励将转向协议收入。
$OSMO ,留意这条会不会被更多媒体跟进,转载越多影响越重。
#OSMO
事情是这样的:Osmosis 终止 OSMO 通胀,质押奖励将转向协议收入。
$OSMO ,留意这条会不会被更多媒体跟进,转载越多影响越重。
#OSMO
20

·
--
Xem bản dịch
🚀 $OSMO EYES $0.0650 BREAKOUT – BULLISH RALLY CONTINUES! 📈
Entry: $0.0615–$0.0630 ⚡
Target: $0.0640 🚀
Target: $0.0660 🚀
Target: $0.0680 🚀
Stop Loss: $0.0595 ⚠️
📊 The 15‑minute breakout has torn through the demand zone, exposing a fresh liquidity pool at $0.0640. A clean punch above this barrier aligns with the institutional order block that has held three prior rallies. 🌊 Volume is swelling, confirming smart‑money accumulation as the market hunts the next supply pocket.
⚡ With the price perched near the $0.0630‑$0.0640 corridor, a swift swing to $0.0660–$0.0680 offers a compelling risk‑reward profile, while a pullback to $0.0610 could test the next entry window. 💬 How are you positioning for the next liquidity sweep? 👇
⚠️ Not financial advice. Always manage your risk. 🛡️
🏷️ #OSMO #LongSetup #Breakout #Crypto
🔥 💎

Xem bản dịch
The $OSMO
{spot}(OSMOUSDT)
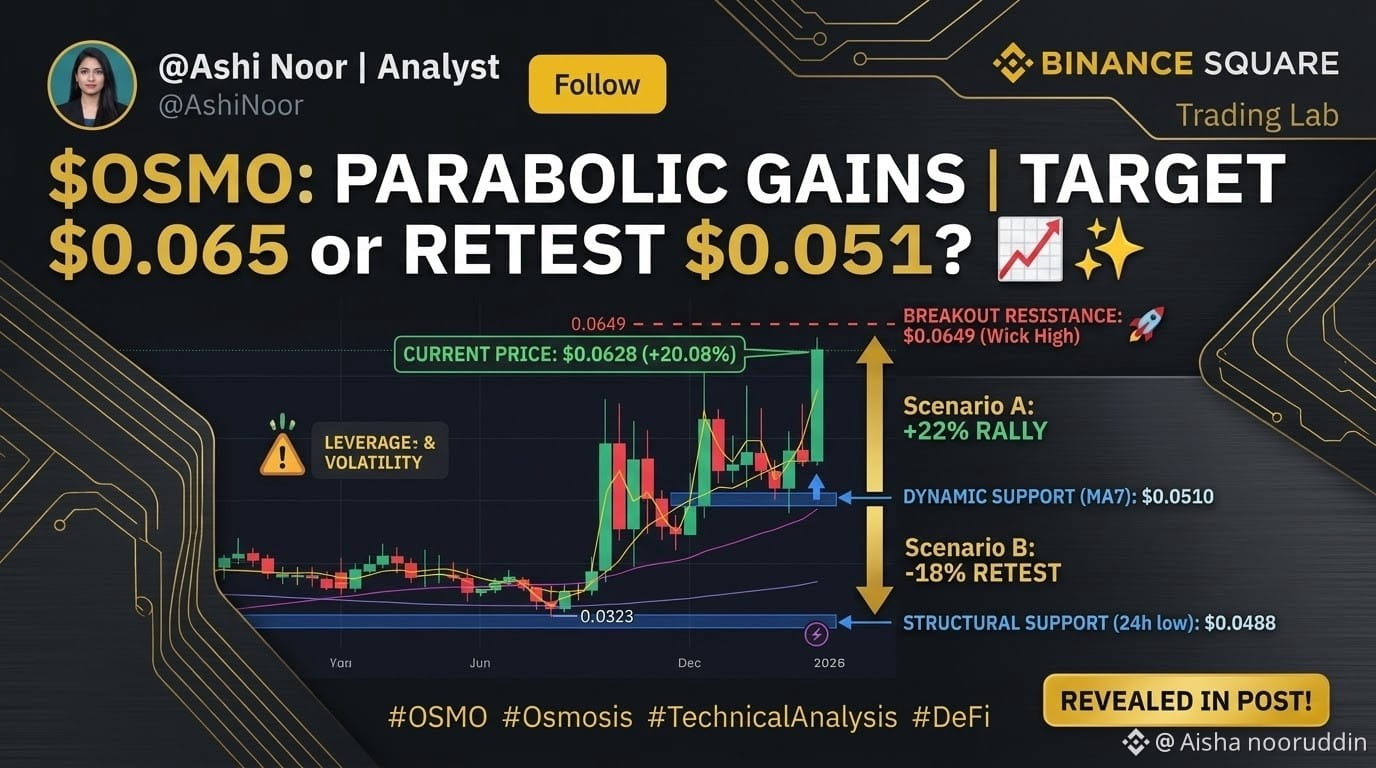
/USDT is executing a textbook parabolic breakout, leading the DeFi gainers with explosive vertical momentum. Trading at $0.0628, Osmosis ($OSMO) has surged +20.08% in the last 24 hours, completely clearing the dynamic compression range on extreme relative volume.
📊 Technical Analysis & Core Indicators:
* Vertical Price Action: Following a multi-month accumulation phase, $OSMO has printed consecutive vertical green daily candles, entering into "price discovery" territory. The 24-hour high is $0.0640.
* Extreme Moving Average Divergence:
* MA(7): Has finished its bullish crossover above MA(25). It has now curved vertically to $0.0510. The current price is vastly overextended above this immediate dynamic floor, acting as the first key support.
* MA(99): Trending far below at $0.0357, marking the ultimate long-term structural baseline support.
* Parabolic Volume Spike: The vertical rally is supported by massive institutional-grade volume, with 2.48M USDT traded in 24 hours. (This volume spike is clearly highlighted on your chart).
💡 Trade Setup & Key Scenarios:
* Bullish Scenario (Breakout Extension):
Bulls are targeting a clean breakout above the previous local supply zone near $0.0649. A confirmed daily close above $0.0650 invalidates the overbought thesis and opens technical room toward previous macro highs.
* Pullback Scenario (Technical Re-Entry):
Given the extreme angle of attack, a healthy technical retest is a high-probability event. The primary entry target for dip buyers lies at the dynamic support of the MA(7) at $0.0510. Structural support at $0.0488 (the 24h low) must hold to preserve the parabolic structure.
👇 Community Discussion:
Are you placing buy orders for $OSMO at current price, or waiting for a pullback to retest the MA(7) near $0.05? Share your trade setups below! 👇
#BinanceSquare #Write2Earn #OSMO #Osmosis #TechnicalAnalysis #DeFiGainer #$[OSMO]
The $OSMO
/USDT is executing a textbook parabolic breakout, leading the DeFi gainers with explosive vertical momentum. Trading at $0.0628, Osmosis ($OSMO ) has surged +20.08% in the last 24 hours, completely clearing the dynamic compression range on extreme relative volume.
📊 Technical Analysis & Core Indicators:
* Vertical Price Action: Following a multi-month accumulation phase, $OSMO has printed consecutive vertical green daily candles, entering into "price discovery" territory. The 24-hour high is $0.0640.
* Extreme Moving Average Divergence:
* MA(7): Has finished its bullish crossover above MA(25). It has now curved vertically to $0.0510. The current price is vastly overextended above this immediate dynamic floor, acting as the first key support.
* MA(99): Trending far below at $0.0357, marking the ultimate long-term structural baseline support.
* Parabolic Volume Spike: The vertical rally is supported by massive institutional-grade volume, with 2.48M USDT traded in 24 hours. (This volume spike is clearly highlighted on your chart).
💡 Trade Setup & Key Scenarios:
* Bullish Scenario (Breakout Extension):
Bulls are targeting a clean breakout above the previous local supply zone near $0.0649. A confirmed daily close above $0.0650 invalidates the overbought thesis and opens technical room toward previous macro highs.
* Pullback Scenario (Technical Re-Entry):
Given the extreme angle of attack, a healthy technical retest is a high-probability event. The primary entry target for dip buyers lies at the dynamic support of the MA(7) at $0.0510. Structural support at $0.0488 (the 24h low) must hold to preserve the parabolic structure.
👇 Community Discussion:
Are you placing buy orders for $OSMO at current price, or waiting for a pullback to retest the MA(7) near $0.05? Share your trade setups below! 👇
#BinanceSquare #Write2Earn #OSMO #Osmosis #TechnicalAnalysis #DeFiGainer #$[OSMO]
3

·
--
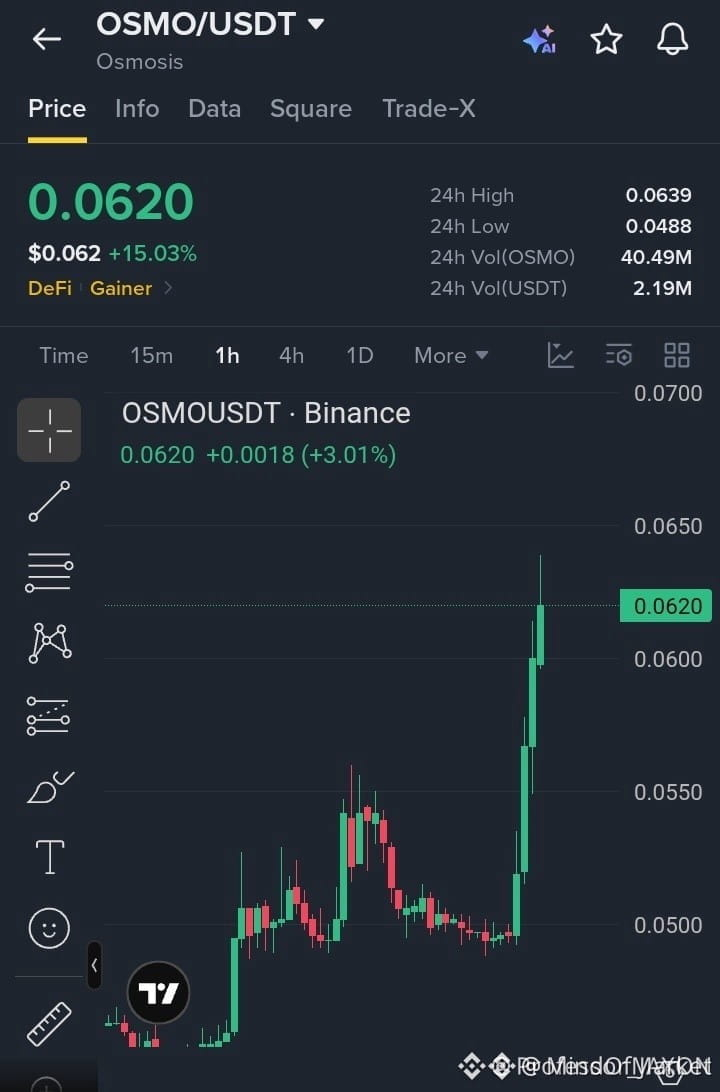
🚀 $OSMO PHÁ VỠ KHÁNG CỰ, ĐÀ TĂNG MẠNH MẼ! 📈
Điểm vào lệnh: 0.06000‑0.06200 ⚡
Mục tiêu: 0.06400 🚀
Cắt lỗ: 0.05800 ⚠️
📊 Ngưỡng kháng cự 0.05500 đã bị phá vỡ dưới áp lực mua mạnh, xác nhận cú quét thanh khoản tiếp sức cho vùng khối lệnh tại 0.06000. 📌 Việc giá giữ trên vùng này hiện phù hợp với hoạt động tích lũy của dòng tiền thông minh, đồng thời khối lượng trên khung 4H đang tăng, báo hiệu một cú bứt phá ở khung thời gian lớn hơn. 🌊 Nếu vượt qua 0.06200, giá nhiều khả năng sẽ mở ra làn sóng tiếp theo hướng tới vùng mục tiêu chốt lời; ngược lại, nếu giảm xuống dưới mức này, rủi ro điều chỉnh gần đây sẽ lại hiện hữu.
💬 Bạn có thấy cú quét thanh khoản tiếp theo sẽ diễn ra trên 0.06200 không? 👇
⚠️ Đây không phải lời khuyên tài chính. Hãy luôn quản lý rủi ro. 🛡️
🏷️ #OSMO #LongSetup #BullishMomentum #Crypto
🚀 ⚡
5

·
--
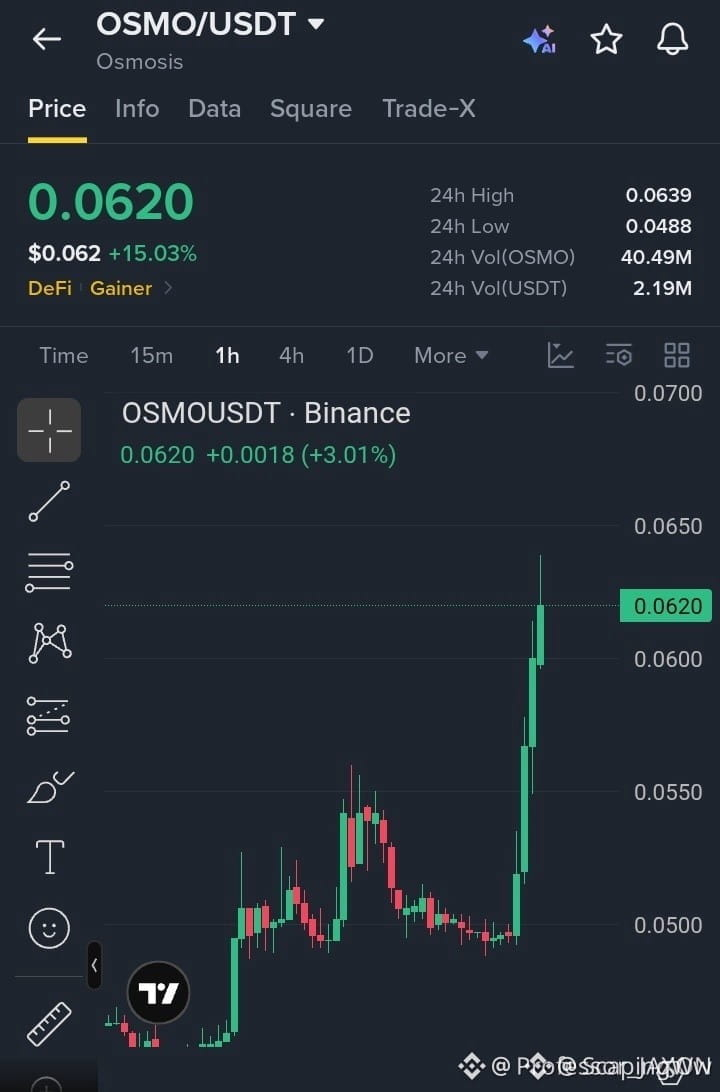
🚀 $OSMO BỨT PHÁ KHỎI KHÁNG CỰ, ĐÀ TĂNG BÙNG NỔ! 📈
Điểm vào lệnh: 0.06000-0.06200 ⚡
Mục tiêu: 0.06400 🚀
Cắt lỗ: 0.05800 ⚠️
🦈 Dòng tiền thông minh đang quét thanh khoản phía trên ngưỡng 0.05500, và đội quân nến đang tiến lên cao hơn. 📊 Giữ vững vùng 0.06000‑0.06200 giúp đà tăng tiếp tục mạnh mẽ, trong khi nếu giá trượt xuống sẽ kích hoạt một nhịp điều chỉnh nhanh. 💡 Khối lượng tăng vọt xác nhận dòng lệnh hiện hoàn toàn nằm trong tay phe mua, mở đường cho một đợt tăng hướng tới nhiều mục tiêu.
💬 Bạn đang chuẩn bị vị thế thế nào cho nhịp tăng tiếp theo của OSMO? 👇
⚠️ Đây không phải lời khuyên tài chính. Hãy luôn quản lý rủi ro. 🛡️
🏷️ #OSMO #LongSetup #Breakout #Crypto
🚀 🔥
3

·
--
Xem bản dịch
$OSMO +18.94% | $VANRY -37.13% | $BTC -0.51%
#OSMO is holding at $0.0628, up +18.94% with $2.4 M of volume. The Osmosis DEX continues to pull liquidity as the go‑to cross‑chain hub in Cosmos, which may help sustain its rally.
#VANRY sits at $0.00074000, down ‑37.13% on $2.3 M traded. The steep drop suggests the recent sell‑off has largely burned through its short‑term support.
#BTC trades around $79,744.10, slipping ‑0.51% while moving $1.21 B in volume. Bitcoin’s modest dip contrasts with the sharper moves elsewhere in the market.
👀 Watch whether OSMO’s upward bias can outpace Bitcoin’s flatness, hinting at a possible shift of capital toward Cosmos‑based DeFi.
#Write2Earn #Binance

·
--
Xem bản dịch
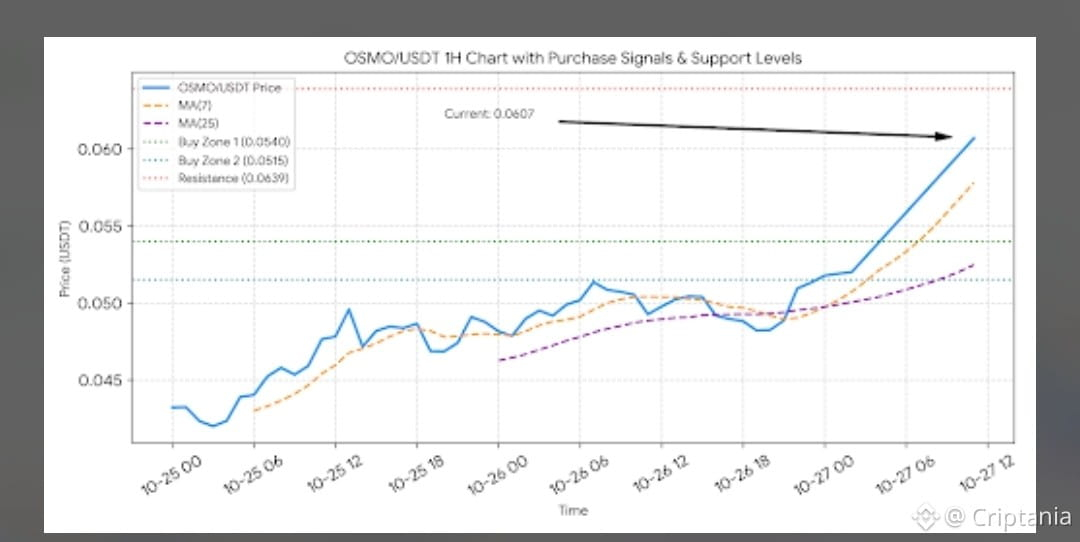
$OSMO OSMO/USDT Technical Analysis (1-Hour Chart)
Current Price: 0.0607 USDT (Rs16.81, up +13.88% on the day)
24h Range: 0.0488 – 0.0639 USDT
Moving Averages: MA(7) is at 0.0540, MA(25) at 0.0520, and MA(99) at 0.0493. The short-term moving averages have crossed bullishly above the long-term averages, confirming a strong near-term uptrend.
Volume: Significant volume spike accompanying the breakout toward the 0.0639 peak, indicating strong buying momentum.
#osmo
❤️ If you find this analysis helpful,
please Follow 🔔 and Like for support
{spot}(OSMOUSDT)
$OSMO OSMO/USDT Technical Analysis (1-Hour Chart)
Current Price: 0.0607 USDT (Rs16.81, up +13.88% on the day)
24h Range: 0.0488 – 0.0639 USDT
Moving Averages: MA(7) is at 0.0540, MA(25) at 0.0520, and MA(99) at 0.0493. The short-term moving averages have crossed bullishly above the long-term averages, confirming a strong near-term uptrend.
Volume: Significant volume spike accompanying the breakout toward the 0.0639 peak, indicating strong buying momentum.
#osmo
❤️ If you find this analysis helpful,
please Follow 🔔 and Like for support
43

Xem bản dịch
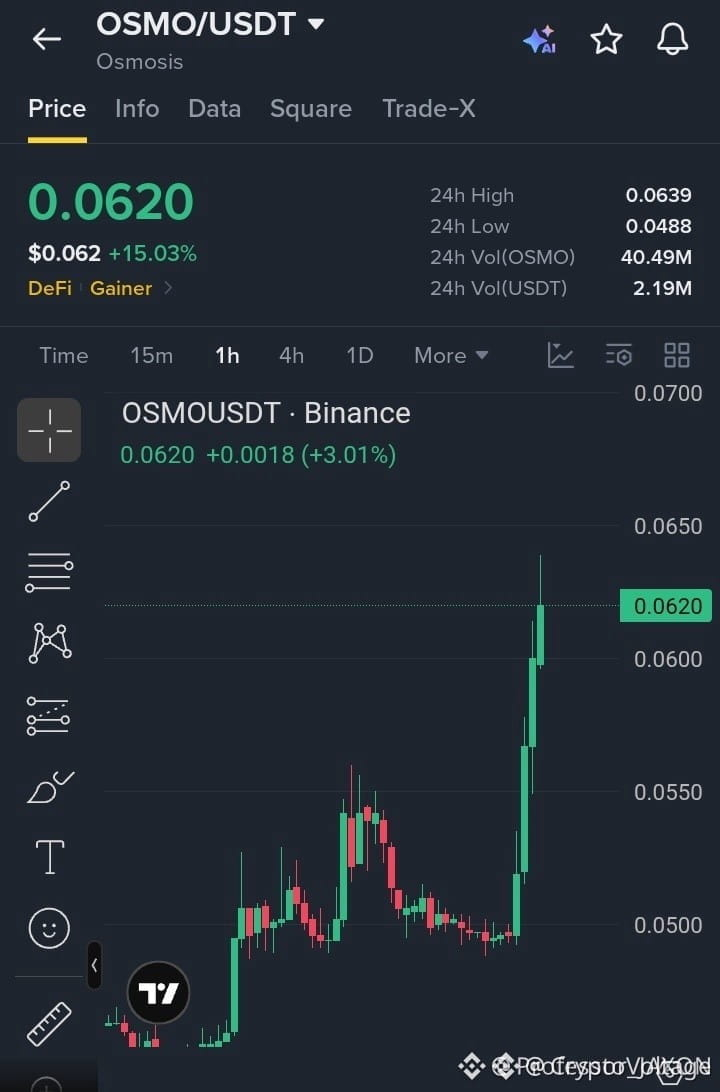
🔥 $OSMO Jumps 18.21%! Are Bulls Targeting Higher Levels?
$OSMO is gaining serious attention after breaking above the 0.05500 resistance. Strong bullish candles have pushed the price toward 0.06230, putting traders on alert for a possible continuation.
📈 Potential LONG Setup
{spot}(OSMOUSDT)
$BTC
{spot}(BTCUSDT)
- Entry Zone: 0.06000–0.06200
- 🎯 TP1: 0.06400
- 🎯 TP2: 0.06600
- 🎯 TP3: 0.06900
- 🛑 Stop Loss: 0.05800
Key level to watch: Holding above 0.06000 could support another move higher. Losing this zone may lead to a pullback.
After an 18%+ move, chasing the price can be risky. Wait for a suitable entry and confirmation.
👀 Can OSMO reach 0.06900 next?
#osmo #crypto #Altcoins #TradingSignals s #BinanceSquare
🔥 $OSMO Jumps 18.21%! Are Bulls Targeting Higher Levels?
$OSMO is gaining serious attention after breaking above the 0.05500 resistance. Strong bullish candles have pushed the price toward 0.06230, putting traders on alert for a possible continuation.
📈 Potential LONG Setup
$BTC
- Entry Zone: 0.06000–0.06200
- 🎯 TP1: 0.06400
- 🎯 TP2: 0.06600
- 🎯 TP3: 0.06900
- 🛑 Stop Loss: 0.05800
Key level to watch: Holding above 0.06000 could support another move higher. Losing this zone may lead to a pullback.
After an 18%+ move, chasing the price can be risky. Wait for a suitable entry and confirmation.
👀 Can OSMO reach 0.06900 next?
#osmo #crypto #Altcoins #TradingSignals s #BinanceSquare
88
·
--
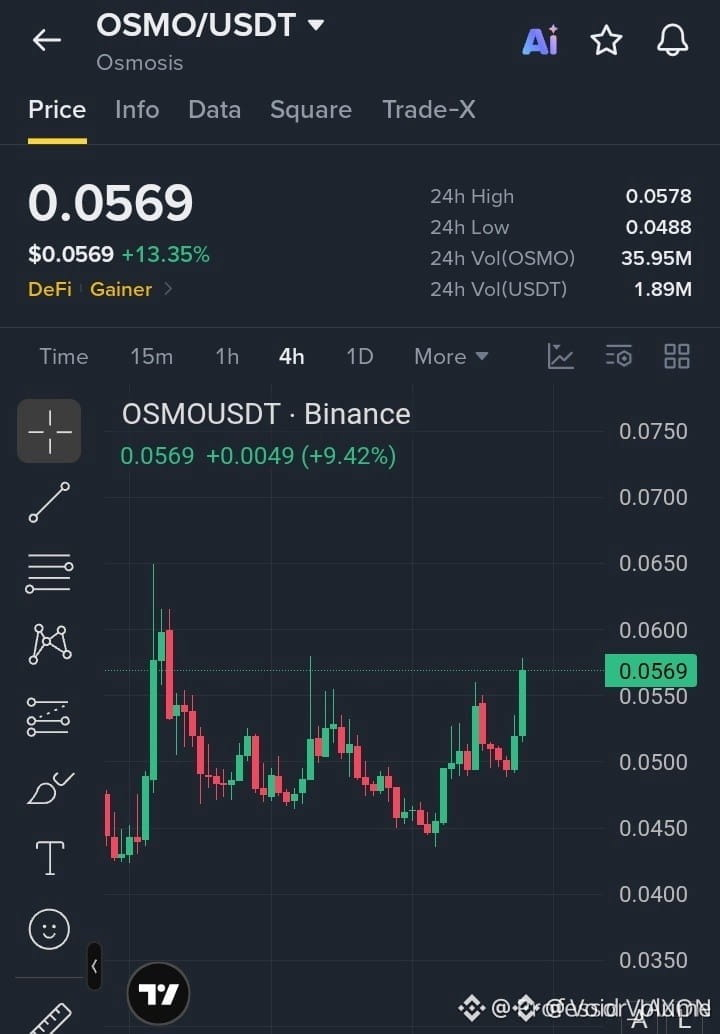
🚀 $OSMO PHÁ VỠ VÙNG QUAN TRỌNG – ĐÀ TĂNG ĐANG HÌNH THÀNH! 🟢
Điểm vào lệnh: 0.05550–0.05700 ⚡
Mục tiêu: 0.05900 🚀
Mục tiêu: 0.06150 🚀
Mục tiêu: 0.06400 🚀
Cắt lỗ: 0.05350 ⚠️
📊 Vùng hỗ trợ 0.04500 đóng vai trò như một bể thanh khoản sâu mà dòng tiền thông minh đã khai thác cạn. Hiện tại, vùng khối lệnh giữa 0.05550‑0.05700 đang hấp thụ áp lực bán. Nếu nến 4H đóng cửa dứt khoát trên 0.05750, giá có thể quét thanh khoản hướng tới cụm kháng cự tiếp theo; ngược lại, nếu bị từ chối, giá có thể điều chỉnh ngắn hạn về vùng cầu trước đó. ⚡ Khối lượng đang tăng, và RSI đang dần thoát khỏi vùng quá bán, xác nhận lực tăng giá.
💬 Bạn xem đây là một nhịp giao dịch theo xu hướng với nhiều mục tiêu hay chỉ là cơ hội lướt sóng nhanh? 👇
⚠️ Đây không phải lời khuyên tài chính. Hãy luôn quản lý rủi ro. 🛡️
🏷️ #OSMO #LongSetup #Liquidity #Crypto
🔥 🚀

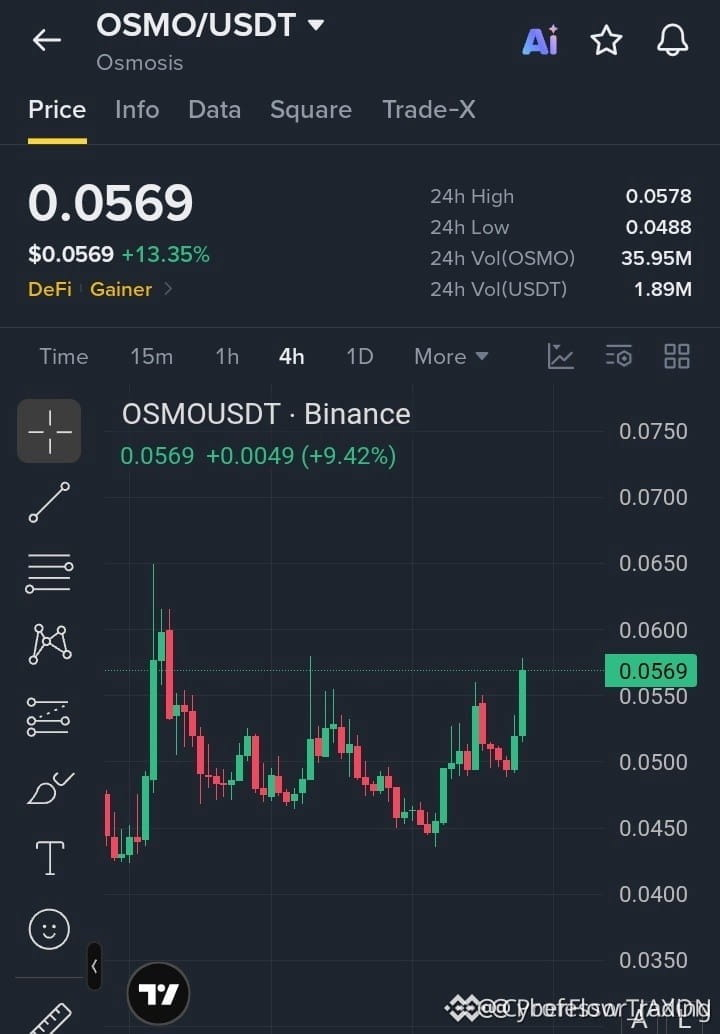
🚀 $OSMO TIẾN SÁT VÙNG KHÁNG CỰ QUAN TRỌNG, PHE BÒ ĐANG KIỂM SOÁT! 🟢
Điểm vào lệnh: 0.05550-0.05700 ⚡
Mục tiêu: 0.05900 🚀
Mục tiêu: 0.06150 🚀
Mục tiêu: 0.06400 🚀
Cắt lỗ: 0.05350 ⚠️
📊 Sau cú bật lên rõ ràng từ vùng hỗ trợ 0.04500, áp lực mua tăng tốc, tạo nên một vùng giá hẹp đang thúc đẩy dòng lệnh. ⚡ Khối lượng giao dịch tăng đột biến trên biểu đồ 4H cho thấy dòng tiền thông minh đang tích lũy, và giá đang sẵn sàng phá vỡ ngưỡng kháng cự 0.05750.
🌊 Một phiên đóng cửa dứt khoát trên 0.05750 sẽ giải phóng làn sóng thanh khoản tiếp theo, đưa cặp giao dịch hướng tới các mục tiêu đã nêu. Một nhịp từ chối ngắn hạn có thể kéo giá lùi về vùng vào lệnh, nhưng xác suất nghiêng về khả năng đà tăng tiếp diễn. 💬 Bạn đang vào lệnh mua trong vùng này hay chờ lần kiểm tra thanh khoản tiếp theo? 👇
⚠️ Đây không phải lời khuyên tài chính. Luôn quản lý rủi ro của bạn. 🛡️
🏷️ #OSMO #LongSetup #Bullish #Breakout #Crypto
🔥 🦈
3
·
--
Xem bản dịch
$OSMO +12.47% | $CHIP +11.69% | $INIT +9.36%
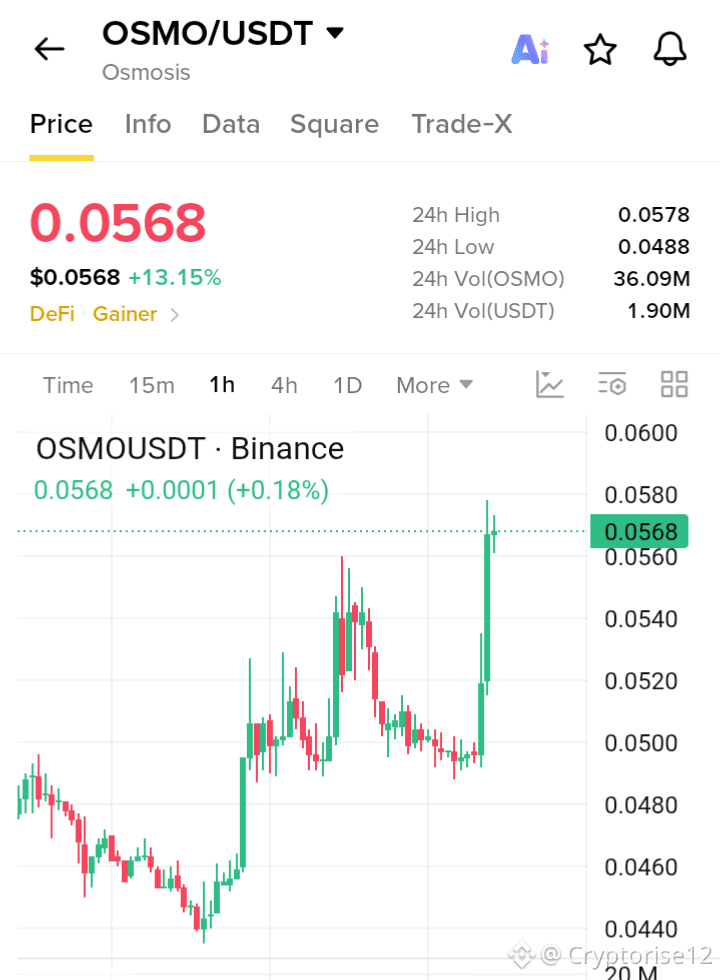
#OSMO nudged up to $0.0568, gaining +12.47% on $1.9 M of volume. The rise feels supported by a modest flow that could sustain the move if buying interest holds.
#CHIP jumped to $0.0516, up +11.69% with a hefty $13.8 M of volume. Such strong turnover hints at broader market participation behind the rally.
#INIT climbed to $0.1535, adding +9.36% on $2.1 M of volume. The price lift is modest compared with its peers, so its momentum may be more fragile.
👀 Watch whether the volume edge of CHIP translates into a longer‑term breakout for the trio.
#Write2Earn #Binance
6

·
--
Tăng giá
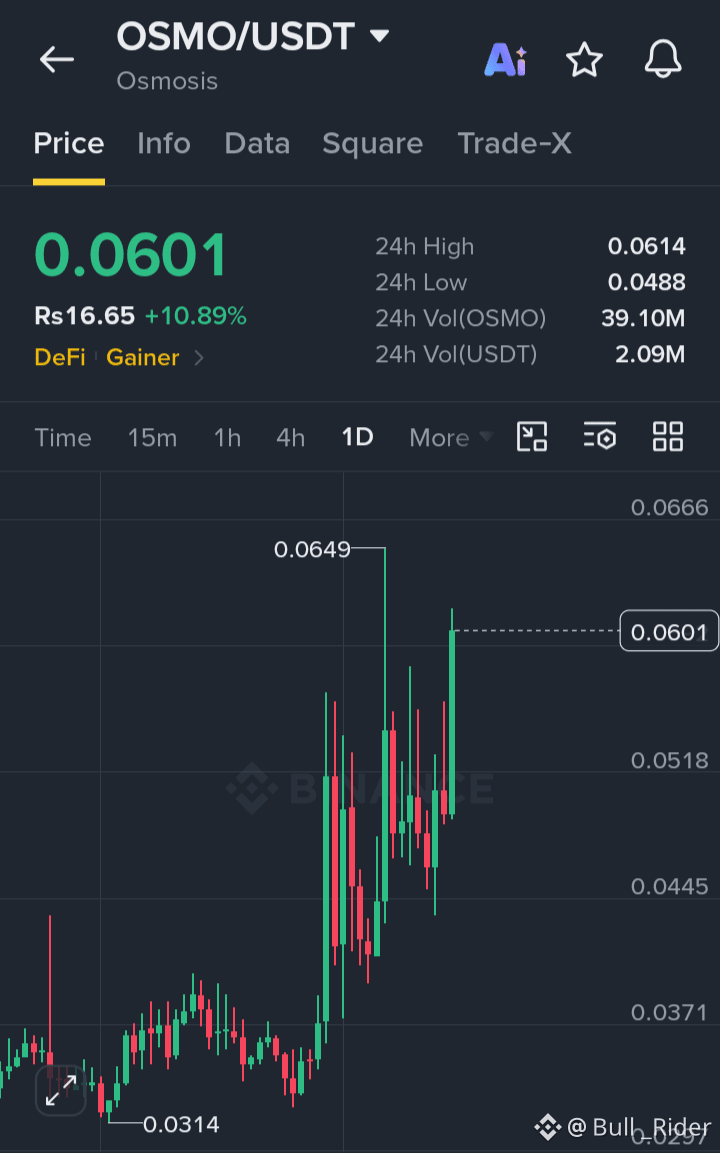
$OSMO đang cho thấy đà tăng mạnh sau khi tăng 10.89%, với lực mua đẩy giá hướng tới vùng kháng cự $0.0614. Nếu áp lực mua tiếp tục duy trì, $OSMO có thể vượt qua ngưỡng kháng cự và tiến tới các mục tiêu cao hơn. Hãy chờ một cú bứt phá mạnh hoặc nhịp kiểm tra lại thành công trước khi vào lệnh.
Điểm vào lệnh: 0.0601
TP1: 0.0614
TP2: 0.0649
TP3: 0.0666
SL: 0.0568
Mua và giao dịch $OSMO
#OSMO #Osmosis
{spot}(OSMOUSDT)
$OSMO đang cho thấy đà tăng mạnh sau khi tăng 10.89%, với lực mua đẩy giá hướng tới vùng kháng cự $0.0614. Nếu áp lực mua tiếp tục duy trì, $OSMO có thể vượt qua ngưỡng kháng cự và tiến tới các mục tiêu cao hơn. Hãy chờ một cú bứt phá mạnh hoặc nhịp kiểm tra lại thành công trước khi vào lệnh.
Điểm vào lệnh: 0.0601
TP1: 0.0614
TP2: 0.0649
TP3: 0.0666
SL: 0.0568
Mua và giao dịch $OSMO
#OSMO #Osmosis
Điểm vào lệnh: 0.0601
TP1: 0.0614
TP2: 0.0649
TP3: 0.0666
SL: 0.0568
Mua và giao dịch $OSMO
#OSMO #Osmosis
1
13

·
--
Xem bản dịch
Big Momentum Shift On $OSMO Right Here Guys…!!
#OSMO is displaying a solid bullish structure following a powerful breakout with strong buying pressure pushing the price higher while the minor pullback appears to be a healthy correction where the next targets could be 0.0578 and 0.0600 while 0.0520 remains the key support zone$SYN
{future}(SYNUSDT)
$PARTI
{future}(PARTIUSDT)
{spot}(OSMOUSDT)
Big Momentum Shift On $OSMO Right Here Guys…!!
#OSMO is displaying a solid bullish structure following a powerful breakout with strong buying pressure pushing the price higher while the minor pullback appears to be a healthy correction where the next targets could be 0.0578 and 0.0600 while 0.0520 remains the key support zone$SYN
$PARTI
#OSMO is displaying a solid bullish structure following a powerful breakout with strong buying pressure pushing the price higher while the minor pullback appears to be a healthy correction where the next targets could be 0.0578 and 0.0600 while 0.0520 remains the key support zone$SYN
$PARTI
1
40

·
--
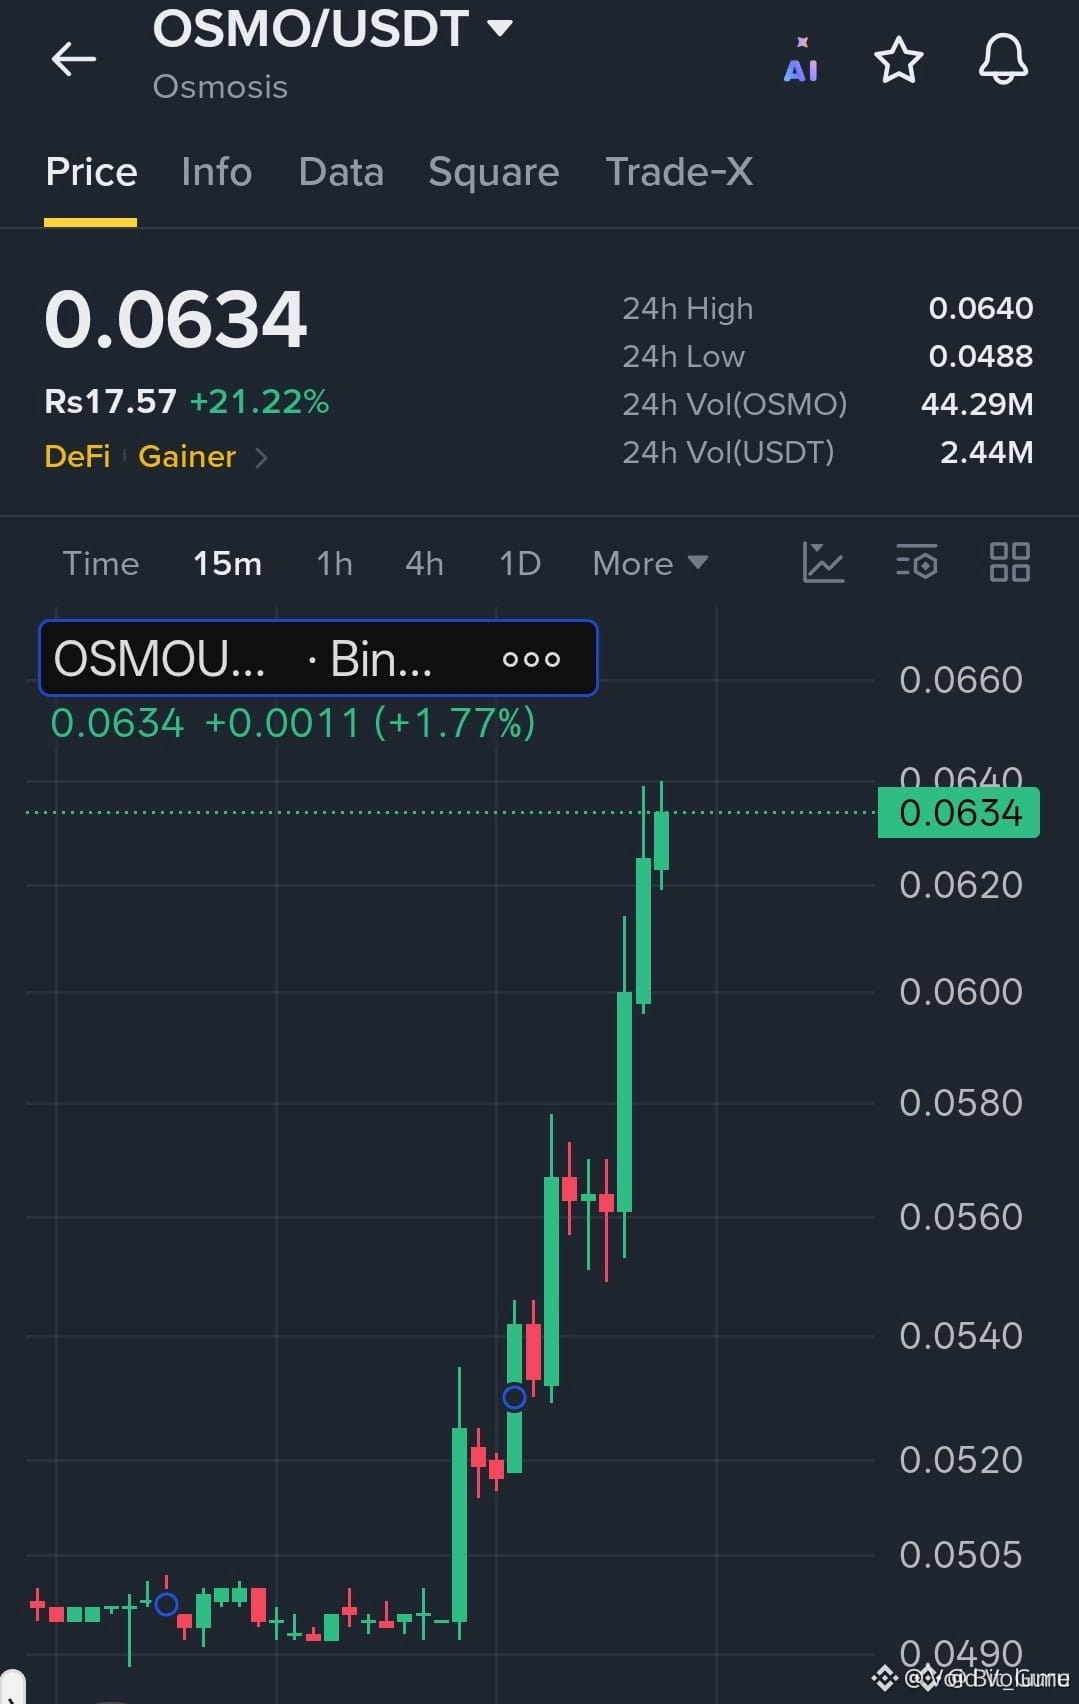
🚀 $OSMO CẢNH BÁO: Osmosis có thể vượt mốc $0.0650 tiếp theo?
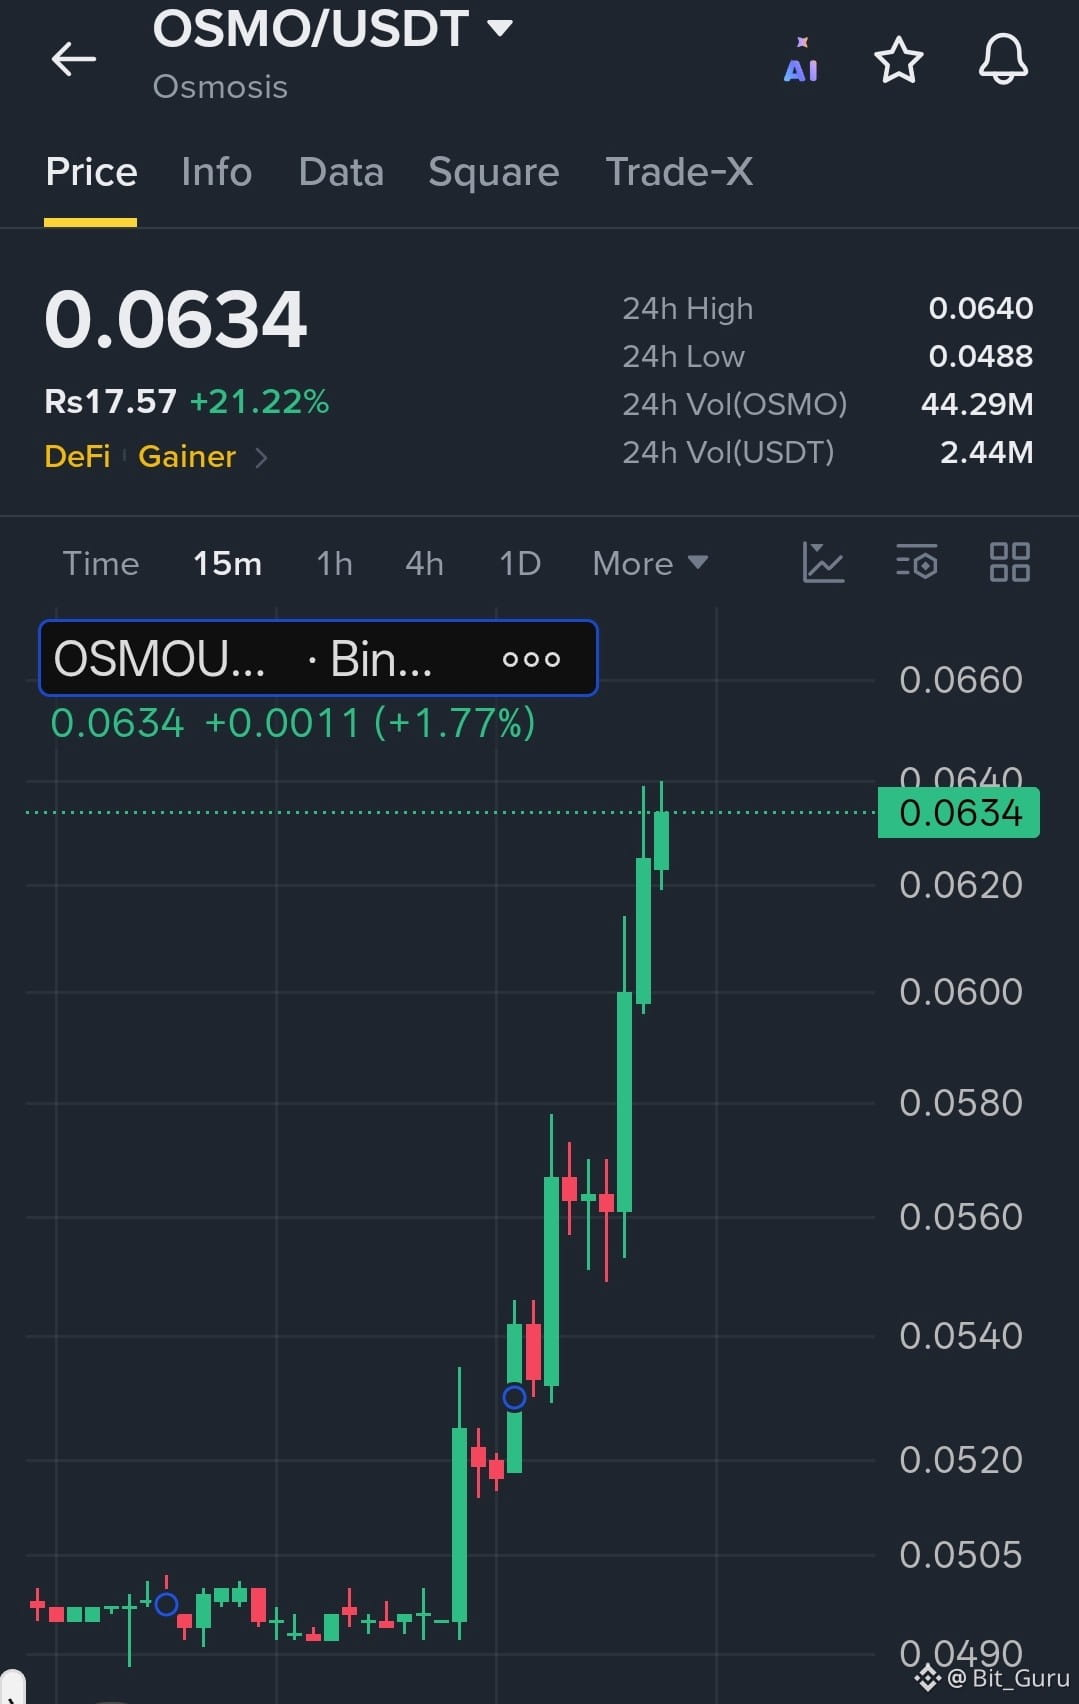
OSMO/USDT đang cho thấy đà tăng mạnh, giao dịch ở mức $0.0634 sau khi tăng vọt hơn 21% trong 24 giờ. Biểu đồ 15 phút cho thấy một cú phá vỡ mạnh, với $0.0640 là ngưỡng kháng cự gần nhất. Nếu giá vượt dứt khoát mức này, giá có thể hướng tới $0.0660–$0.0680, trong khi hoạt động chốt lời có thể khiến giá điều chỉnh về $0.0610.
Thiết lập giao dịch (Long)
Điểm vào lệnh Long: $0.0615–$0.0630 SL: $0.0595 TP1: $0.0640 TP2: $0.0660 TP3: $0.0680
#OSMO
{spot}(OSMOUSDT)
🚀 $OSMO CẢNH BÁO: Osmosis có thể vượt mốc $0.0650 tiếp theo?
OSMO/USDT đang cho thấy đà tăng mạnh, giao dịch ở mức $0.0634 sau khi tăng vọt hơn 21% trong 24 giờ. Biểu đồ 15 phút cho thấy một cú phá vỡ mạnh, với $0.0640 là ngưỡng kháng cự gần nhất. Nếu giá vượt dứt khoát mức này, giá có thể hướng tới $0.0660–$0.0680, trong khi hoạt động chốt lời có thể khiến giá điều chỉnh về $0.0610.
Thiết lập giao dịch (Long)
Điểm vào lệnh Long: $0.0615–$0.0630 SL: $0.0595 TP1: $0.0640 TP2: $0.0660 TP3: $0.0680
#OSMO
1
98

·
--
Xem bản dịch
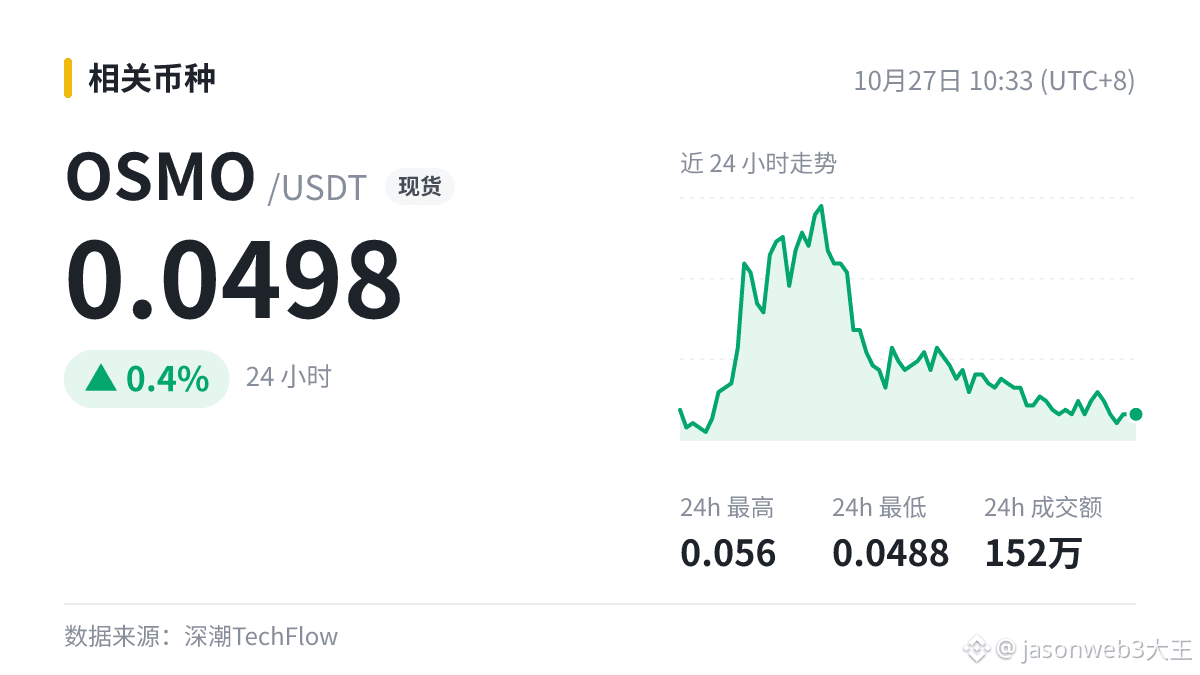
消息面更新:作者:深潮 TechFlow 深潮导读:作为 Cosmos 生态的核心流动性中枢,Osmosis 刚刚完成了一场极具里程碑意义的代币经济学革命。
消息面偏正面,$OSMO 现报 0.0498。
消息落地之后的走势,比消息本身得多留意。后续影响可以留意下。
#OSMO
不是投资建议,别跟着做。
消息面更新:作者:深潮 TechFlow 深潮导读:作为 Cosmos 生态的核心流动性中枢,Osmosis 刚刚完成了一场极具里程碑意义的代币经济学革命。
消息面偏正面,$OSMO 现报 0.0498。
消息落地之后的走势,比消息本身得多留意。后续影响可以留意下。
#OSMO
不是投资建议,别跟着做。
消息面偏正面,$OSMO 现报 0.0498。
消息落地之后的走势,比消息本身得多留意。后续影响可以留意下。
#OSMO
不是投资建议,别跟着做。
2


·
--
Xem bản dịch
$OSMO 基本面更新:Osmosis 社区投票通过「终止 OSMO 代币通胀性发行」提案
技术面上先看 24h 高点 0.056 能不能突破、低点 0.0488 守不守得住。消息影响方向,结构决定赔率。
#OSMO
$OSMO 基本面更新:Osmosis 社区投票通过「终止 OSMO 代币通胀性发行」提案
技术面上先看 24h 高点 0.056 能不能突破、低点 0.0488 守不守得住。消息影响方向,结构决定赔率。
#OSMO
技术面上先看 24h 高点 0.056 能不能突破、低点 0.0488 守不守得住。消息影响方向,结构决定赔率。
#OSMO
26
Đăng nhập để khám phá thêm nội dung
Tham gia cùng người dùng tiền mã hóa toàn cầu trên Binance Square
⚡️ Nhận thông tin mới nhất và hữu ích về tiền mã hóa.
💬 Được tin cậy bởi sàn giao dịch tiền mã hóa lớn nhất thế giới.
👍 Khám phá những thông tin chuyên sâu thực tế từ những nhà sáng tạo đã xác minh.
Email / Số điện thoại
Chủ đề thịnh hành
1
#BinancePick
3.4M lượt xem
164,640 đang thảo luận
2
#EarningsSeason
5.5M lượt xem
26,886 đang thảo luận
3
#TheoDõiFOMC
294,277 lượt xem
1,238 đang thảo luận
4
#TinFed
351,659 lượt xem
955 đang thảo luận
5
#StrategySkipsBitcoinPurchasesSpends$205MOnSTRCBuybacks
823 lượt xem
25 đang thảo luận
6
#BitmineAdds10452ETH
9,612 lượt xem
222 đang thảo luận
7
#SouthKoreaConsidersEducationTaxOnCryptoExchanges
7,788 lượt xem
205 đang thảo luận
8
#OCCUrgesCommunityBanksToEnterStablecoinPayments
7,513 lượt xem
129 đang thảo luận
9
#RippleWinsFullApprovalAsNationalTrustBank
6,864 lượt xem
133 đang thảo luận
10
#AkashSelectsSolanaAsMigrationTarget
4,252 lượt xem
61 đang thảo luận