

#altcoinwatch
altcoinwatch
6.3M lượt xem
16,415 đang thảo luận
Phổ biến
Mới nhất

Xem bản dịch
EVAA Jumps Nearly 20% as Buyers Defend the Higher Low
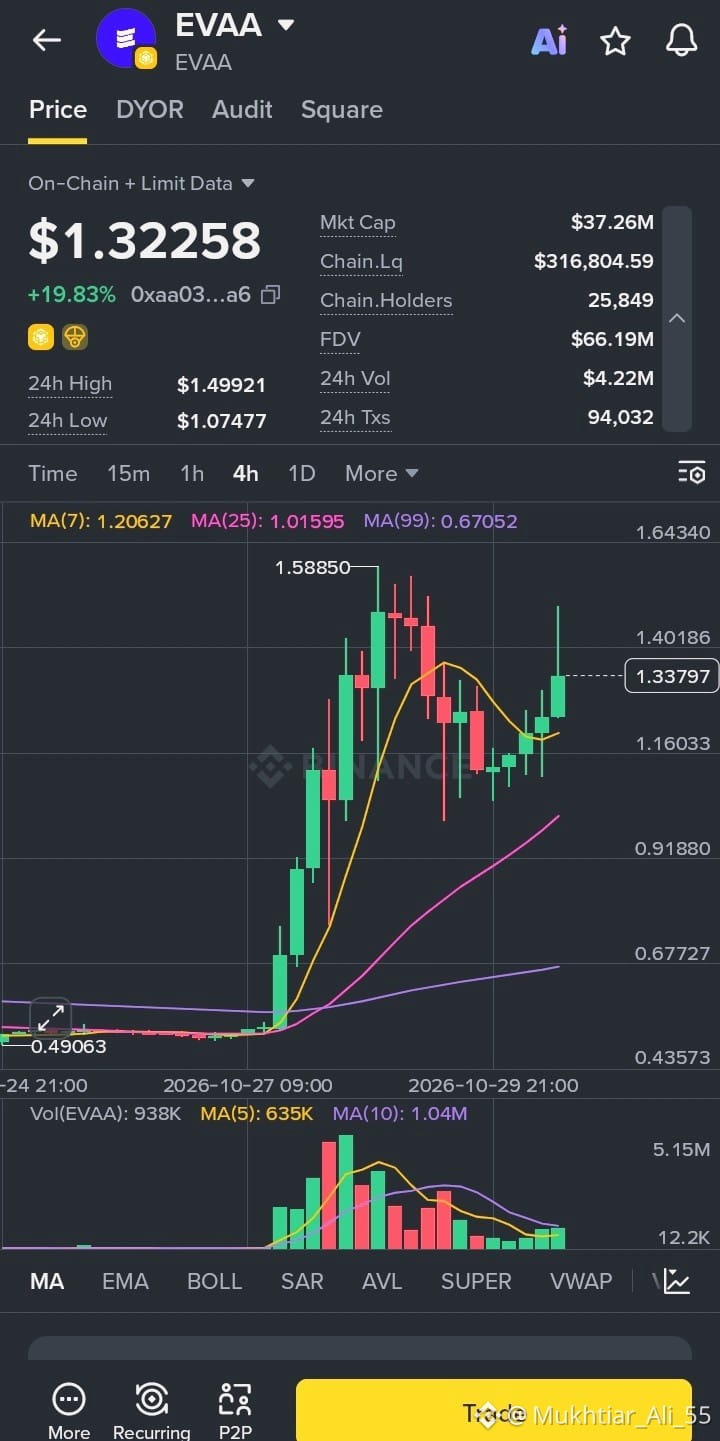
EVAA is posting a strong rebound today, trading at 1.32258 (+19.83%) after bouncing from a 24h low of 1.07477 and reaching a high of 1.49921.
Here’s a quick look at the numbers:
📊 Market Cap: 37.26M
💧 24h Volume: 4.22M
👥 Holders: 25,849 on-chain
🔥 24h Transactions: 94,032
🏷️ FDV: 66.19M
On the 4H chart, price is trading well above the MA(7) at 1.20627, MA(25) at 1.01595 and MA(99) at 0.67052, which keeps the broader structure bullish. After the run toward the 1.5885 peak, EVAA corrected, formed a higher low near 1.07, and has now pushed back up with a series of green candles. The long upper wick on the latest candle shows some selling pressure near 1.45, so that area is worth watching.
The key resistance zone sits between 1.49 and 1.59, where the 24h high and the previous peak are located. A clean break above it could set up another leg higher. If the move fades, the MA(7) near 1.21 is the first support, followed by the recent low around 1.07.
Volume has cooled significantly since the initial surge, so a pickup in buying activity would help confirm the continuation. Liquidity is also quite thin at around 317K, so price can swing sharply in either direction.
For now, I’m watching whether EVAA can hold above 1.20 and challenge the 1.49 resistance.
#EVAA #EvaaProtocol #CryptoTrading #BinanceAlpha #AltcoinWatch
$EVAA
{future}(EVAAUSDT)
EVAA Jumps Nearly 20% as Buyers Defend the Higher Low
EVAA is posting a strong rebound today, trading at 1.32258 (+19.83%) after bouncing from a 24h low of 1.07477 and reaching a high of 1.49921.
Here’s a quick look at the numbers:
📊 Market Cap: 37.26M
💧 24h Volume: 4.22M
👥 Holders: 25,849 on-chain
🔥 24h Transactions: 94,032
🏷️ FDV: 66.19M
On the 4H chart, price is trading well above the MA(7) at 1.20627, MA(25) at 1.01595 and MA(99) at 0.67052, which keeps the broader structure bullish. After the run toward the 1.5885 peak, EVAA corrected, formed a higher low near 1.07, and has now pushed back up with a series of green candles. The long upper wick on the latest candle shows some selling pressure near 1.45, so that area is worth watching.
The key resistance zone sits between 1.49 and 1.59, where the 24h high and the previous peak are located. A clean break above it could set up another leg higher. If the move fades, the MA(7) near 1.21 is the first support, followed by the recent low around 1.07.
Volume has cooled significantly since the initial surge, so a pickup in buying activity would help confirm the continuation. Liquidity is also quite thin at around 317K, so price can swing sharply in either direction.
For now, I’m watching whether EVAA can hold above 1.20 and challenge the 1.49 resistance.
#EVAA #EvaaProtocol #CryptoTrading #BinanceAlpha #AltcoinWatch
$EVAA
6

Xem bản dịch
DeFi infrastructure and decentralized exchanges remain active areas to follow.
$SAFE — Safe provides smart-account infrastructure for managing digital assets.
$CVC — Civic focuses on identity verification and digital identity solutions.
$DODO — DODO is a decentralized exchange protocol designed to support on-chain liquidity.
#SAFE #CVC #DODO #DeFi #AltcoinWatch
$SAFE — Safe provides smart-account infrastructure for managing digital assets.
$CVC — Civic focuses on identity verification and digital identity solutions.
$DODO — DODO is a decentralized exchange protocol designed to support on-chain liquidity.
#SAFE #CVC #DODO #DeFi #AltcoinWatch
2
Xem bản dịch
PHAROS Slides 6% as Sellers Push Price Below All Key Moving Averages
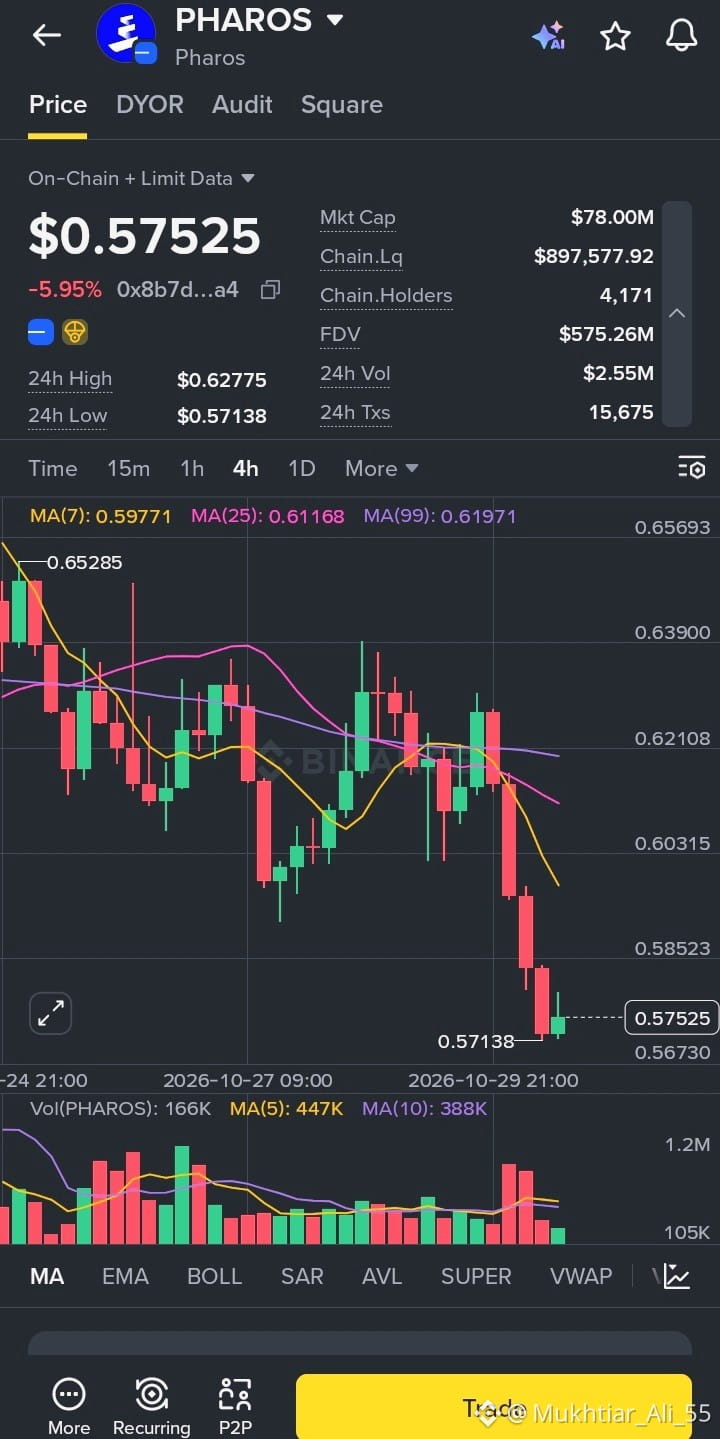
PHAROS is under pressure today, trading at 0.57525 (-5.95%) after reaching a 24h high of 0.62775 and sliding to a low of 0.57138.
Here’s a quick look at the numbers:
📊 Market Cap: 78.00M
💧 24h Volume: 2.55M
👥 Holders: 4,171 on-chain
🔥 24h Transactions: 15,675
🏷️ FDV: 575.26M
On the 4H chart, price has dropped below the MA(7) at 0.59771, the MA(25) at 0.61168 and the MA(99) at 0.61971, all of which now sit overhead as resistance. The sharp series of red candles after the rejection near 0.62 shows strong selling pressure, and the bearish structure remains intact for now. The latest small green candle near 0.5714 is the first hint of a bounce, but it’s too early to call it a reversal.
The first level to watch is the 0.5977 zone around the MA(7), followed by the 0.61 to 0.62 area where the MA(25) and MA(99) are clustered. On the downside, 0.5714 is the immediate support, and a break below it could open the door to further downside.
Volume picked up during the drop and has since started to fade, so a rise in buying volume would be needed to confirm any recovery. Liquidity is also thin at around 897K relative to the 78M market cap, so price can swing sharply in either direction.
For now, I’m watching whether PHAROS can hold above 0.5714 and reclaim 0.5977 before drawing any bigger conclusions.
#PHAROS #PharosNetwork #CryptoTrading #BinanceAlpha #AltcoinWatch
$PHAROS
{future}(PHAROSUSDT)
PHAROS Slides 6% as Sellers Push Price Below All Key Moving Averages
PHAROS is under pressure today, trading at 0.57525 (-5.95%) after reaching a 24h high of 0.62775 and sliding to a low of 0.57138.
Here’s a quick look at the numbers:
📊 Market Cap: 78.00M
💧 24h Volume: 2.55M
👥 Holders: 4,171 on-chain
🔥 24h Transactions: 15,675
🏷️ FDV: 575.26M
On the 4H chart, price has dropped below the MA(7) at 0.59771, the MA(25) at 0.61168 and the MA(99) at 0.61971, all of which now sit overhead as resistance. The sharp series of red candles after the rejection near 0.62 shows strong selling pressure, and the bearish structure remains intact for now. The latest small green candle near 0.5714 is the first hint of a bounce, but it’s too early to call it a reversal.
The first level to watch is the 0.5977 zone around the MA(7), followed by the 0.61 to 0.62 area where the MA(25) and MA(99) are clustered. On the downside, 0.5714 is the immediate support, and a break below it could open the door to further downside.
Volume picked up during the drop and has since started to fade, so a rise in buying volume would be needed to confirm any recovery. Liquidity is also thin at around 897K relative to the 78M market cap, so price can swing sharply in either direction.
For now, I’m watching whether PHAROS can hold above 0.5714 and reclaim 0.5977 before drawing any bigger conclusions.
#PHAROS #PharosNetwork #CryptoTrading #BinanceAlpha #AltcoinWatch
$PHAROS
3
Xem bản dịch
BTW (Bitway) Drops 14% as Price Slips Below Key Moving Averages
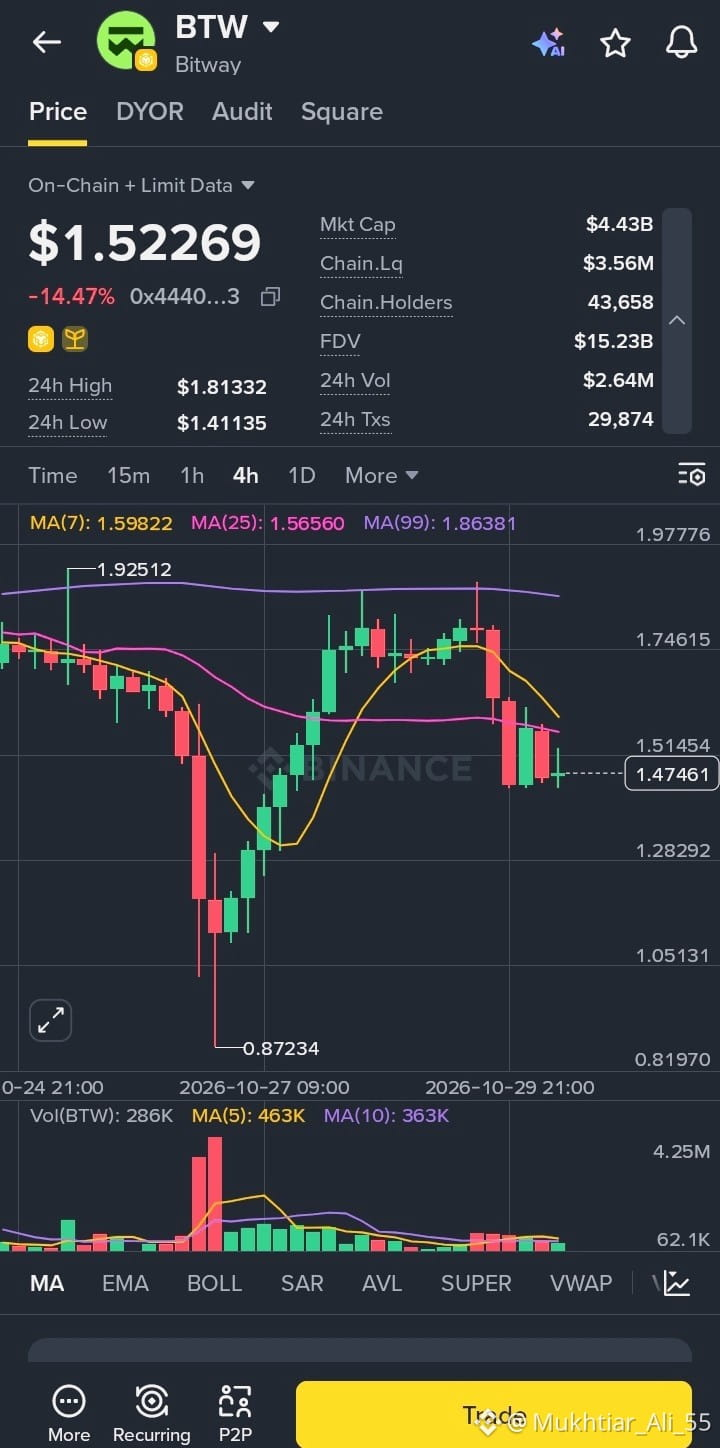
BTW is under pressure today, trading at 1.52269 (-14.47%) after touching a 24h high of 1.81332 and dipping to a low of 1.41135.
Here’s a quick look at the numbers:
📊 Market Cap: 4.43B
💧 24h Volume: 2.64M
👥 Holders: 43,658 on-chain
🔥 24h Transactions: 29,874
🏷️ FDV: 15.23B
On the 4H chart, price has fallen below both the MA(7) at 1.59822 and the MA(25) at 1.56560, which are now sitting overhead as short-term resistance. The MA(99) at 1.86381 is well above current levels, and the recent rejection near the 1.80 area shows sellers defending that zone. After the sharp recovery from the 0.87234 low, the move has stalled and started to roll over.
The first level to watch is the 1.56 to 1.60 zone, where the two moving averages overlap. A reclaim of that area would be an early sign that buyers are returning. On the downside, 1.41 is the immediate support, and a break below it could open the door to a deeper retest of the lower range.
Volume has been fading compared to the earlier spike, which suggests the bounce lacked strong follow-through. Liquidity is also thin at around 3.56M relative to the 4.43B market cap, so price can move sharply in either direction.
For now, I’m watching whether BTW can hold above 1.41 and win back the 1.60 level before drawing any bigger conclusions.
#BTW #Bitway #CryptoTrading #BinanceAlpha #AltcoinWatch
$BTW
{future}(BTWUSDT)
BTW (Bitway) Drops 14% as Price Slips Below Key Moving Averages
BTW is under pressure today, trading at 1.52269 (-14.47%) after touching a 24h high of 1.81332 and dipping to a low of 1.41135.
Here’s a quick look at the numbers:
📊 Market Cap: 4.43B
💧 24h Volume: 2.64M
👥 Holders: 43,658 on-chain
🔥 24h Transactions: 29,874
🏷️ FDV: 15.23B
On the 4H chart, price has fallen below both the MA(7) at 1.59822 and the MA(25) at 1.56560, which are now sitting overhead as short-term resistance. The MA(99) at 1.86381 is well above current levels, and the recent rejection near the 1.80 area shows sellers defending that zone. After the sharp recovery from the 0.87234 low, the move has stalled and started to roll over.
The first level to watch is the 1.56 to 1.60 zone, where the two moving averages overlap. A reclaim of that area would be an early sign that buyers are returning. On the downside, 1.41 is the immediate support, and a break below it could open the door to a deeper retest of the lower range.
Volume has been fading compared to the earlier spike, which suggests the bounce lacked strong follow-through. Liquidity is also thin at around 3.56M relative to the 4.43B market cap, so price can move sharply in either direction.
For now, I’m watching whether BTW can hold above 1.41 and win back the 1.60 level before drawing any bigger conclusions.
#BTW #Bitway #CryptoTrading #BinanceAlpha #AltcoinWatch
$BTW
7
Xem bản dịch
CAP Climbs 10% as Price Reclaims Key Moving Averages
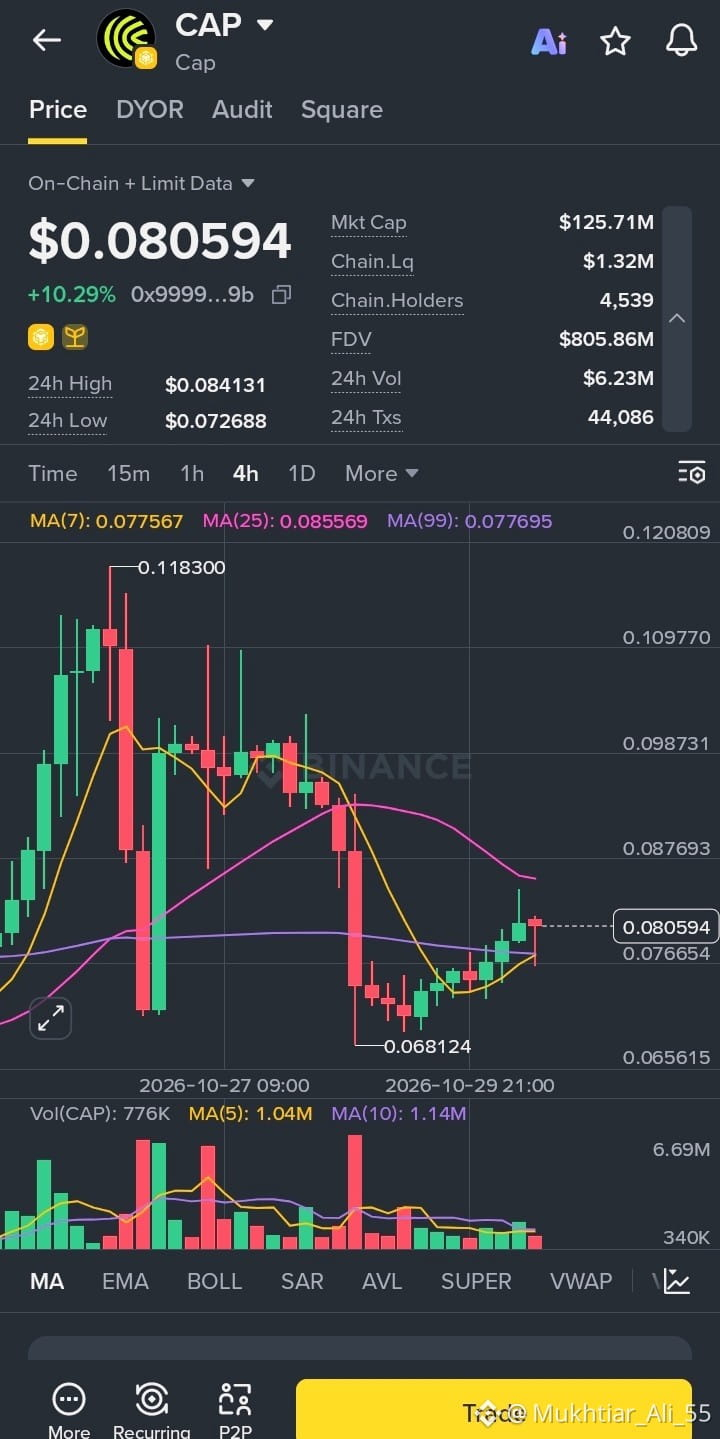
CAP is bouncing back today, trading at 0.080594 (+10.29%) after finding support at a 24h low of 0.072688 and reaching a high of 0.084131.
Here’s a quick look at the numbers:
📊 Market Cap: 125.71M
💧 24h Volume: 6.23M
👥 Holders: 4,539 on-chain
🔥 24h Transactions: 44,086
🏷️ FDV: 805.86M
On the 4H chart, price has pushed back above the MA(7) at 0.077567 and the MA(99) at 0.077695, which is an encouraging sign after the pullback from the 0.1183 peak and the dip to 0.068124. The higher lows forming on the recent candles suggest buyers are slowly regaining control.
The next hurdle is the MA(25) at 0.085569, which sits just above the 24h high of 0.084131. A clean break and hold above that area could open the door to a stronger recovery. If the bounce fades, the 0.0777 zone, where the MA(7) and MA(99) overlap, is the first support to watch, followed by the recent low near 0.0727.
Volume has been declining compared to the earlier spikes, so a pickup in buying activity would help confirm the move. Liquidity is also thin at around 1.32M, so price can swing sharply in either direction.
For now, I’m watching whether CAP can hold above 0.0777 and make a push toward 0.0855.
#CAP #CapToken #CryptoTrading #BinanceAlpha #AltcoinWatch
$CAP
{future}(CAPUSDT)
CAP Climbs 10% as Price Reclaims Key Moving Averages
CAP is bouncing back today, trading at 0.080594 (+10.29%) after finding support at a 24h low of 0.072688 and reaching a high of 0.084131.
Here’s a quick look at the numbers:
📊 Market Cap: 125.71M
💧 24h Volume: 6.23M
👥 Holders: 4,539 on-chain
🔥 24h Transactions: 44,086
🏷️ FDV: 805.86M
On the 4H chart, price has pushed back above the MA(7) at 0.077567 and the MA(99) at 0.077695, which is an encouraging sign after the pullback from the 0.1183 peak and the dip to 0.068124. The higher lows forming on the recent candles suggest buyers are slowly regaining control.
The next hurdle is the MA(25) at 0.085569, which sits just above the 24h high of 0.084131. A clean break and hold above that area could open the door to a stronger recovery. If the bounce fades, the 0.0777 zone, where the MA(7) and MA(99) overlap, is the first support to watch, followed by the recent low near 0.0727.
Volume has been declining compared to the earlier spikes, so a pickup in buying activity would help confirm the move. Liquidity is also thin at around 1.32M, so price can swing sharply in either direction.
For now, I’m watching whether CAP can hold above 0.0777 and make a push toward 0.0855.
#CAP #CapToken #CryptoTrading #BinanceAlpha #AltcoinWatch
$CAP
5
Xem bản dịch
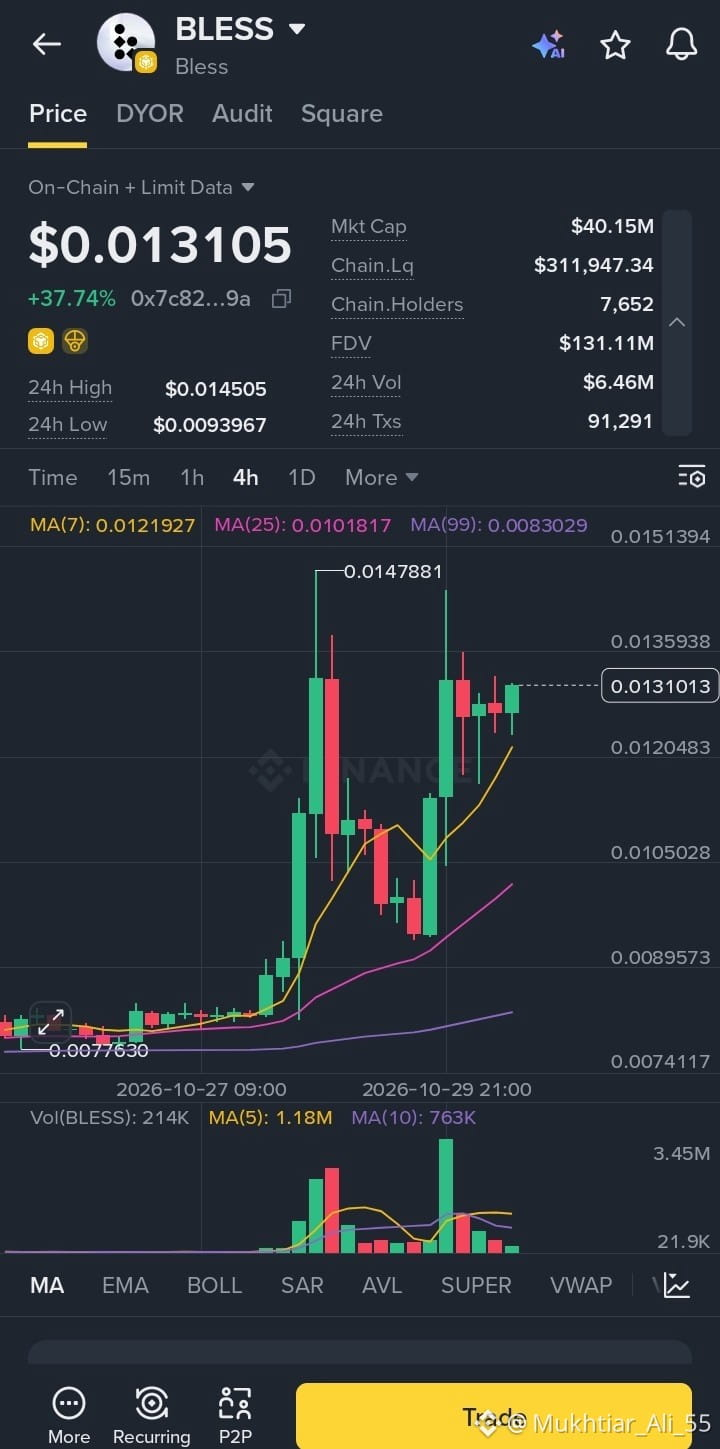
BLESS Rallies Over 37% as Buyers Hold the Higher Ground
BLESS is one of the stronger movers today, trading at 0.013105 (+37.74%) after bouncing from a 24h low of 0.0093967 and touching a high of 0.014505.
Here’s a quick look at the numbers:
📊 Market Cap: 40.15M
💧 24h Volume: 6.46M
👥 Holders: 7,652 on-chain
🔥 24h Transactions: 91,291
🏷️ FDV: 131.11M
On the 4H chart, price is trading comfortably above the MA(7) at 0.0121927, MA(25) at 0.0101817 and MA(99) at 0.0083029, which keeps the short-term structure bullish. After the first spike toward 0.0147881, BLESS pulled back, built a higher low, and pushed up again, which is a healthy pattern for a trend trying to continue.
The 0.0145 to 0.0148 zone is the key resistance to watch. A clean break above it could open the way for another leg higher. If price slips instead, the MA(7) near 0.0122 is the first support, followed by the MA(25) around 0.0102. Volume has cooled since the second spike, so fresh buying volume would help confirm the next move. Liquidity is also quite thin at around 312K, so price can swing sharply in both directions.
For now, I’m watching how BLESS handles the resistance zone before drawing any bigger conclusions.
#BLESS #BlessNetwork #CryptoTrading #BinanceAlpha #AltcoinWatch
$BLESS
{future}(BLESSUSDT)
BLESS Rallies Over 37% as Buyers Hold the Higher Ground
BLESS is one of the stronger movers today, trading at 0.013105 (+37.74%) after bouncing from a 24h low of 0.0093967 and touching a high of 0.014505.
Here’s a quick look at the numbers:
📊 Market Cap: 40.15M
💧 24h Volume: 6.46M
👥 Holders: 7,652 on-chain
🔥 24h Transactions: 91,291
🏷️ FDV: 131.11M
On the 4H chart, price is trading comfortably above the MA(7) at 0.0121927, MA(25) at 0.0101817 and MA(99) at 0.0083029, which keeps the short-term structure bullish. After the first spike toward 0.0147881, BLESS pulled back, built a higher low, and pushed up again, which is a healthy pattern for a trend trying to continue.
The 0.0145 to 0.0148 zone is the key resistance to watch. A clean break above it could open the way for another leg higher. If price slips instead, the MA(7) near 0.0122 is the first support, followed by the MA(25) around 0.0102. Volume has cooled since the second spike, so fresh buying volume would help confirm the next move. Liquidity is also quite thin at around 312K, so price can swing sharply in both directions.
For now, I’m watching how BLESS handles the resistance zone before drawing any bigger conclusions.
#BLESS #BlessNetwork #CryptoTrading #BinanceAlpha #AltcoinWatch
$BLESS
29
Xem bản dịch
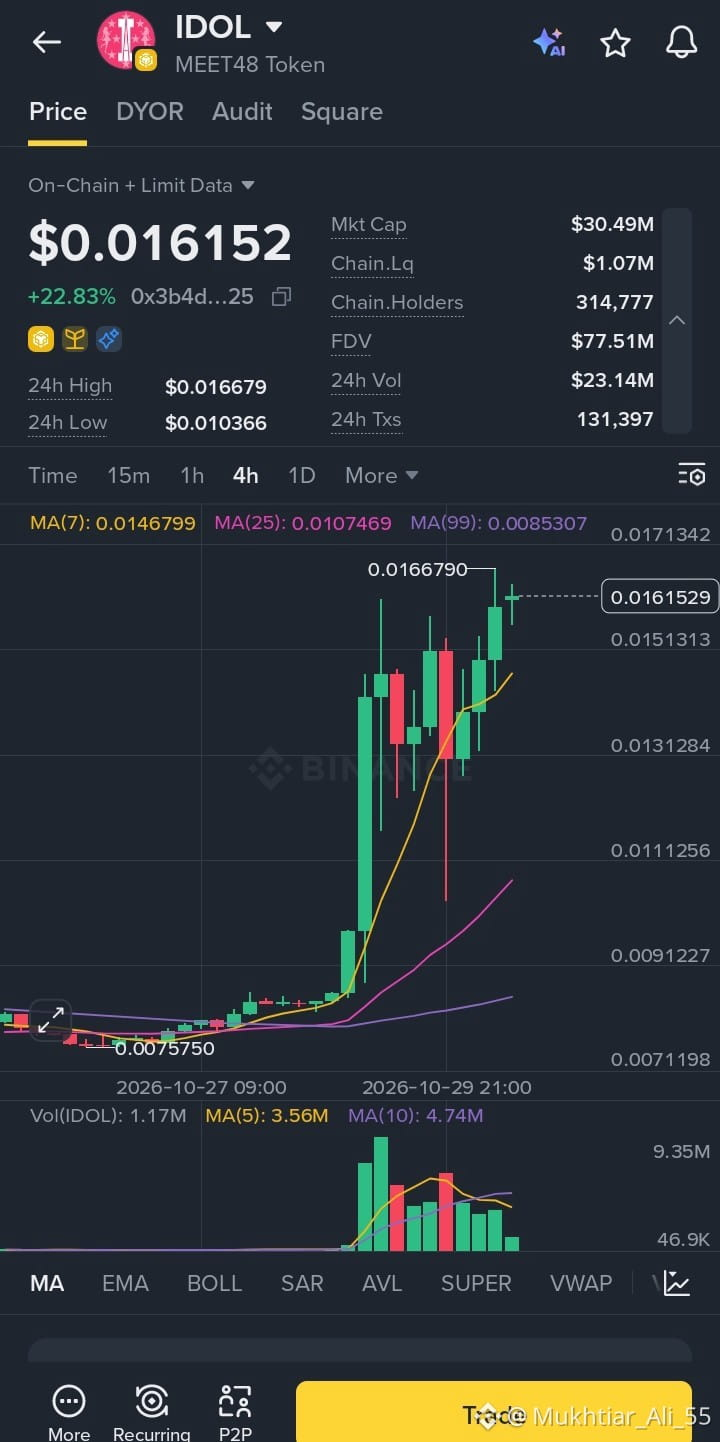
IDOL (MEET48 Token) Surges Over 22% as Momentum Builds
IDOL has put in a strong move over the last 24 hours, trading at 0.016152 (+22.83%) after bouncing from a 24h low of 0.010366 and reaching a high of 0.016679.
Here’s what stands out on the chart:
📊 Market Cap: 30.49M
💧 24h Volume: 23.14M, which is a lot of activity relative to the market cap
👥 Holders: 314,777 on-chain
🔥 24h Transactions: 131,397
On the 4H timeframe, price has climbed well above the MA(7), MA(25) and MA(99), a clear sign of bullish structure after a long stretch of sideways movement near 0.0075. The jump was backed by a spike in volume, which adds some weight to the breakout.
That said, a rally this sharp often invites a cooldown. The 0.0166 area is the level to watch, and a clean break above it could open the door to further upside. On the other hand, a drop back toward the MA(7) near 0.0147 would be a normal retest. Liquidity is also relatively thin at 1.07M, so volatility can swing both ways.
I’m keeping IDOL on my watchlist and waiting to see how it handles this resistance zone.
#IDOL #MEET48 #CryptoTrading #BinanceAlpha #AltcoinWatch
$IDOL
{future}(IDOLUSDT)
IDOL (MEET48 Token) Surges Over 22% as Momentum Builds
IDOL has put in a strong move over the last 24 hours, trading at 0.016152 (+22.83%) after bouncing from a 24h low of 0.010366 and reaching a high of 0.016679.
Here’s what stands out on the chart:
📊 Market Cap: 30.49M
💧 24h Volume: 23.14M, which is a lot of activity relative to the market cap
👥 Holders: 314,777 on-chain
🔥 24h Transactions: 131,397
On the 4H timeframe, price has climbed well above the MA(7), MA(25) and MA(99), a clear sign of bullish structure after a long stretch of sideways movement near 0.0075. The jump was backed by a spike in volume, which adds some weight to the breakout.
That said, a rally this sharp often invites a cooldown. The 0.0166 area is the level to watch, and a clean break above it could open the door to further upside. On the other hand, a drop back toward the MA(7) near 0.0147 would be a normal retest. Liquidity is also relatively thin at 1.07M, so volatility can swing both ways.
I’m keeping IDOL on my watchlist and waiting to see how it handles this resistance zone.
#IDOL #MEET48 #CryptoTrading #BinanceAlpha #AltcoinWatch
$IDOL
45
Xem bản dịch
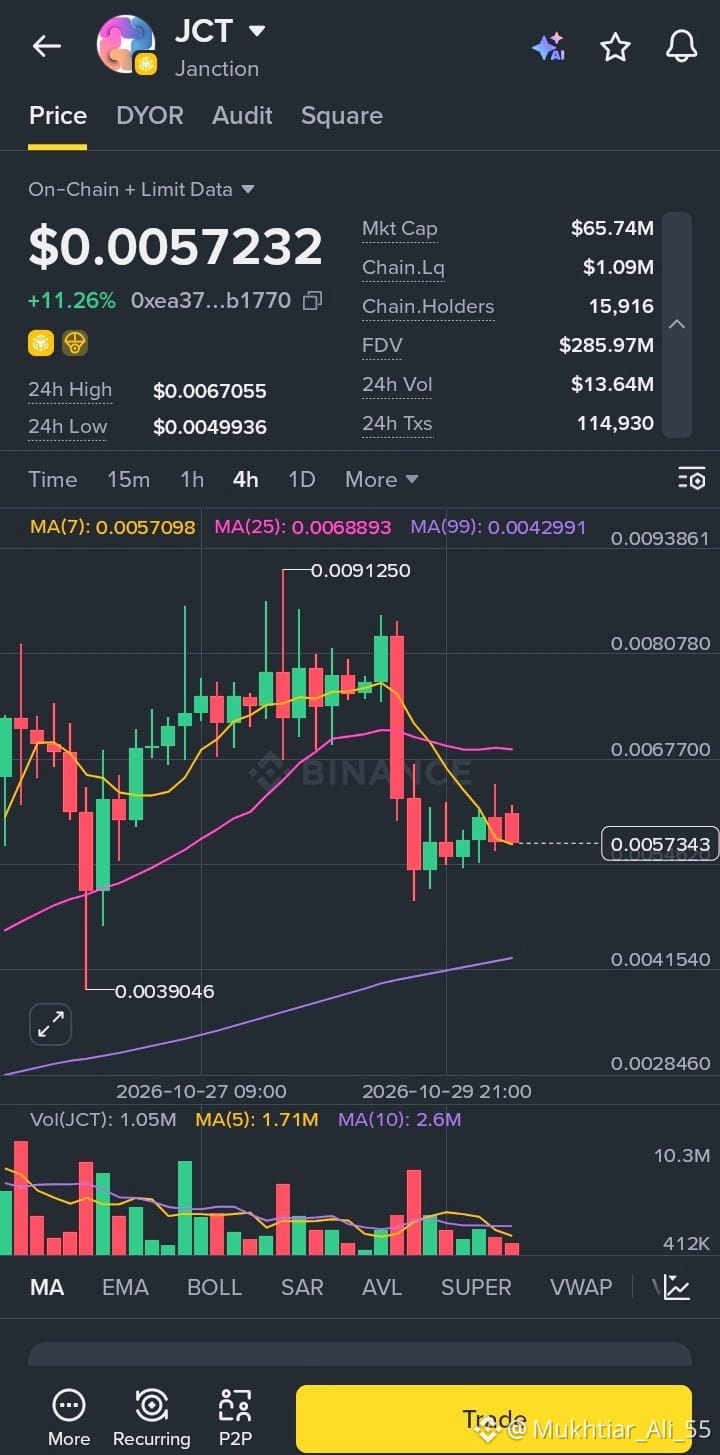
JCT (Janction) Bounces 11% as Price Tests Key Moving Average
JCT is showing a decent recovery over the last 24 hours, trading at 0.0057232 (+11.26%) after bouncing from a 24h low of 0.0049936 and reaching a high of 0.0067055.
Here’s a quick look at the numbers:
📊 Market Cap: 65.74M
💧 24h Volume: 13.64M
👥 Holders: 15,916 on-chain
🔥 24h Transactions: 114,930
🏷️ FDV: 285.97M
On the 4H chart, price is sitting right around the MA(7) at 0.0057098, which makes this a key level to watch. The MA(25) at 0.0068893 is overhead and acts as the next resistance, close to the 0.0067 zone where the recent 24h high was set. After the sharp drop from the 0.0091 peak, the small green candles suggest buyers are slowly stepping back in, but the trend hasn’t fully turned yet.
On the downside, the MA(99) near 0.0042991 is the major support to keep in mind if this bounce fades. Volume has also been cooling off compared to the earlier spike, so a pickup in buying volume would help confirm any move higher. Liquidity is thin at 1.09M, so price swings can be sharp in either direction.
For now, I’m watching whether JCT can hold above the MA(7) and push toward 0.0067. A clean break above that area would be the first sign of strength.
#JCT #Janction #CryptoTrading #BinanceAlpha #AltcoinWatch
$JCT
{future}(JCTUSDT)
JCT (Janction) Bounces 11% as Price Tests Key Moving Average
JCT is showing a decent recovery over the last 24 hours, trading at 0.0057232 (+11.26%) after bouncing from a 24h low of 0.0049936 and reaching a high of 0.0067055.
Here’s a quick look at the numbers:
📊 Market Cap: 65.74M
💧 24h Volume: 13.64M
👥 Holders: 15,916 on-chain
🔥 24h Transactions: 114,930
🏷️ FDV: 285.97M
On the 4H chart, price is sitting right around the MA(7) at 0.0057098, which makes this a key level to watch. The MA(25) at 0.0068893 is overhead and acts as the next resistance, close to the 0.0067 zone where the recent 24h high was set. After the sharp drop from the 0.0091 peak, the small green candles suggest buyers are slowly stepping back in, but the trend hasn’t fully turned yet.
On the downside, the MA(99) near 0.0042991 is the major support to keep in mind if this bounce fades. Volume has also been cooling off compared to the earlier spike, so a pickup in buying volume would help confirm any move higher. Liquidity is thin at 1.09M, so price swings can be sharp in either direction.
For now, I’m watching whether JCT can hold above the MA(7) and push toward 0.0067. A clean break above that area would be the first sign of strength.
#JCT #Janction #CryptoTrading #BinanceAlpha #AltcoinWatch
$JCT
38

·
--
🌅 CẬP NHẬT THỊ TRƯỜNG TIỀN MÃ HÓA: NỖI SỢ ĐANG GIA TĂNG, NHƯNG CÁC CƠ HỘI VẪN ĐƯỢC THEO DÕI!
Thị trường tiền mã hóa mở đầu ngày thứ Sáu trong áp lực đáng kể khi các nhà đầu tư phản ứng trước những lo ngại mới về an ninh và tình hình bất ổn chung của thị trường.
Bitcoin giảm xuống mức thấp nhất trong sáu tuần, gần 77.646 USD, trong khi Ethereum cũng chịu áp lực bán trở lại. Trong khi đó, các thông tin liên quan đến cuộc điều tra an ninh đang diễn ra của Binance đã khiến thị trường thêm phần bất ổn.
🔎 Danh sách altcoin cần theo dõi
🔹 $NEAR : Các token liên quan đến AI đang chịu áp lực bán, trong đó NEAR là một trong những đồng giảm đáng chú ý.
🔹 $RAY : Sự suy yếu liên quan đến DeFi ngày càng rõ nét khi các nhà giao dịch giảm mức độ rủi ro.
🔹 $TRX : Thể hiện sức chống chịu tương đối tốt so với một số altcoin lớn trong phiên thị trường trước đó.
📊 Hôm nay các nhà giao dịch nên theo dõi điều gì?
• Khả năng ổn định của Bitcoin sau đợt giảm gần đây. • Liệu altcoin có tiếp tục diễn biến kém hơn hay không. • Các cập nhật về an ninh sàn giao dịch và niềm tin thị trường. • Liệu người mua có quay trở lại với khối lượng giao dịch lớn hơn hay không.
💡 Nhận định thị trường của tôi: Đây là lúc tập trung vào cấu trúc thị trường, khối lượng giao dịch và quản lý rủi ro thay vì chạy theo những biến động giá đột ngột. Đà phục hồi cần được xác nhận, chứ không chỉ dựa vào sự lạc quan.
❓ **Bạn nghĩ sao? Đây chỉ là đợt điều chỉnh tạm thời của thị trường, hay giá có thể giảm sâu hơn trước khi phục hồi?
Hãy chia sẻ ý kiến bên dưới!**
#CryptoMarket #MarketAnalysis #AltcoinWatch #CryptoNews #BinanceSquare
{future}(NEARUSDT)
{future}(RAYSOLUSDT)
{future}(TRXUSDT)
🌅 CẬP NHẬT THỊ TRƯỜNG TIỀN MÃ HÓA: NỖI SỢ ĐANG GIA TĂNG, NHƯNG CÁC CƠ HỘI VẪN ĐƯỢC THEO DÕI!
Thị trường tiền mã hóa mở đầu ngày thứ Sáu trong áp lực đáng kể khi các nhà đầu tư phản ứng trước những lo ngại mới về an ninh và tình hình bất ổn chung của thị trường.
Bitcoin giảm xuống mức thấp nhất trong sáu tuần, gần 77.646 USD, trong khi Ethereum cũng chịu áp lực bán trở lại. Trong khi đó, các thông tin liên quan đến cuộc điều tra an ninh đang diễn ra của Binance đã khiến thị trường thêm phần bất ổn.
🔎 Danh sách altcoin cần theo dõi
🔹 $NEAR : Các token liên quan đến AI đang chịu áp lực bán, trong đó NEAR là một trong những đồng giảm đáng chú ý.
🔹 $RAY : Sự suy yếu liên quan đến DeFi ngày càng rõ nét khi các nhà giao dịch giảm mức độ rủi ro.
🔹 $TRX : Thể hiện sức chống chịu tương đối tốt so với một số altcoin lớn trong phiên thị trường trước đó.
📊 Hôm nay các nhà giao dịch nên theo dõi điều gì?
• Khả năng ổn định của Bitcoin sau đợt giảm gần đây. • Liệu altcoin có tiếp tục diễn biến kém hơn hay không. • Các cập nhật về an ninh sàn giao dịch và niềm tin thị trường. • Liệu người mua có quay trở lại với khối lượng giao dịch lớn hơn hay không.
💡 Nhận định thị trường của tôi: Đây là lúc tập trung vào cấu trúc thị trường, khối lượng giao dịch và quản lý rủi ro thay vì chạy theo những biến động giá đột ngột. Đà phục hồi cần được xác nhận, chứ không chỉ dựa vào sự lạc quan.
❓ **Bạn nghĩ sao? Đây chỉ là đợt điều chỉnh tạm thời của thị trường, hay giá có thể giảm sâu hơn trước khi phục hồi?
Hãy chia sẻ ý kiến bên dưới!**
#CryptoMarket #MarketAnalysis #AltcoinWatch #CryptoNews #BinanceSquare

1
1
229
Xem bản dịch
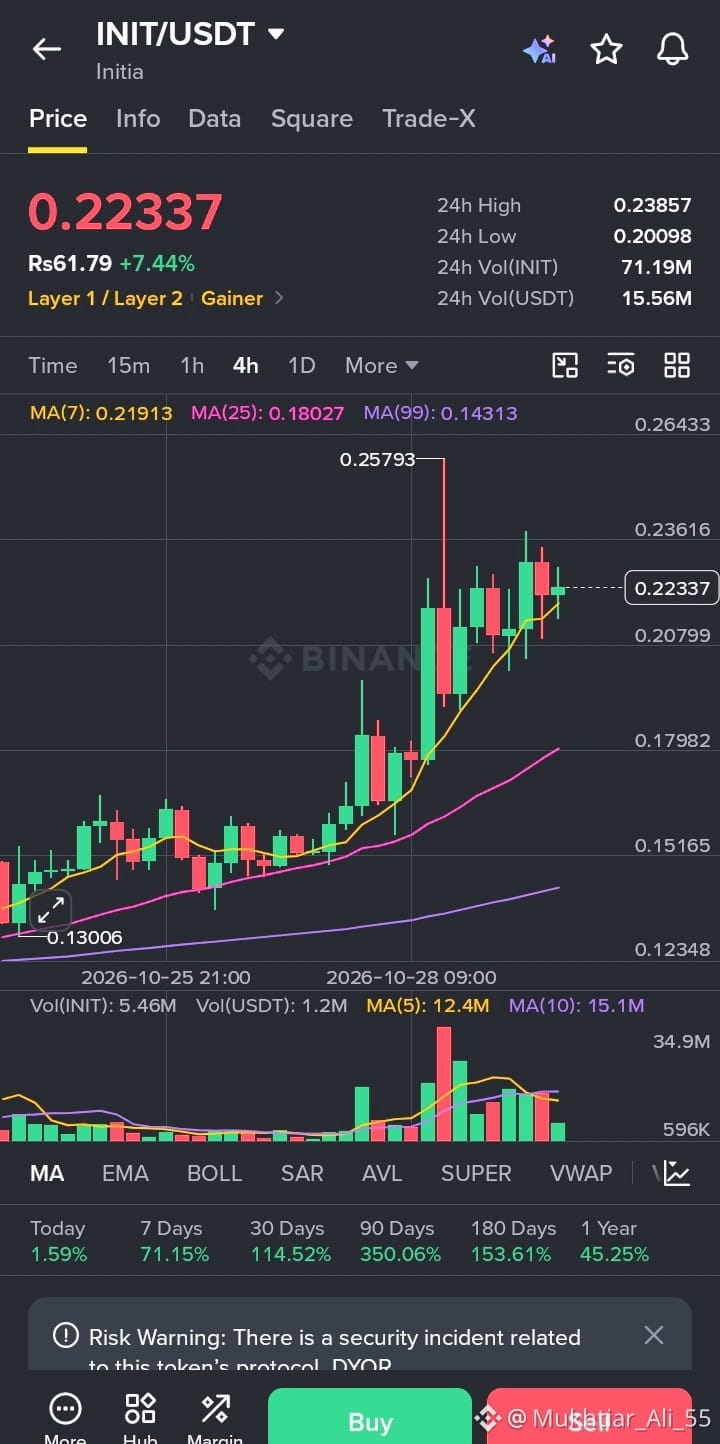
Initia (INIT) Rises 7% in 24 Hours: Here’s What the Chart Shows
INIT is showing up on the Binance gainers list today, and the chart is worth a closer look.
Current snapshot (INIT/USDT):
💰 Price: 0.22337 USDT
📈 24h change: +7.44%
🔺 24h high: 0.23857
🔻 24h low: 0.20098
📊 24h volume: 71.19M INIT (about 15.56M USDT)
What stands out on the 4H chart:
The price climbed steadily from around 0.130, then accelerated with a big green candle that spiked to 0.25793 before sellers pushed it back down. Since then it has been consolidating between roughly 0.208 and 0.236, and the latest candle is holding near 0.22337. Volume peaked at 34.9M on the breakout and has cooled off since, which is normal after a sharp move.
Price is now above the MA(7) at 0.21913, MA(25) at 0.18027 and MA(99) at 0.14313, with all three averages sloping upward. That points to a strong trend, but the long upper wick near 0.25793 shows heavy selling pressure at that level.
Important note:
Binance is displaying a risk warning on this token about a security incident related to its protocol. Check the latest official updates before making any decision.
My take:
Strong trends can continue, but price can also pull back after a fast run. Many traders wait for a retest of support, such as the MA(7) area, before making decisions, and use stop losses to manage risk.
#INIT #Initia #Binance #CryptoMarket #AltcoinWatch
$INIT
{spot}(INITUSDT)
Initia (INIT) Rises 7% in 24 Hours: Here’s What the Chart Shows
INIT is showing up on the Binance gainers list today, and the chart is worth a closer look.
Current snapshot (INIT/USDT):
💰 Price: 0.22337 USDT
📈 24h change: +7.44%
🔺 24h high: 0.23857
🔻 24h low: 0.20098
📊 24h volume: 71.19M INIT (about 15.56M USDT)
What stands out on the 4H chart:
The price climbed steadily from around 0.130, then accelerated with a big green candle that spiked to 0.25793 before sellers pushed it back down. Since then it has been consolidating between roughly 0.208 and 0.236, and the latest candle is holding near 0.22337. Volume peaked at 34.9M on the breakout and has cooled off since, which is normal after a sharp move.
Price is now above the MA(7) at 0.21913, MA(25) at 0.18027 and MA(99) at 0.14313, with all three averages sloping upward. That points to a strong trend, but the long upper wick near 0.25793 shows heavy selling pressure at that level.
Important note:
Binance is displaying a risk warning on this token about a security incident related to its protocol. Check the latest official updates before making any decision.
My take:
Strong trends can continue, but price can also pull back after a fast run. Many traders wait for a retest of support, such as the MA(7) area, before making decisions, and use stop losses to manage risk.
#INIT #Initia #Binance #CryptoMarket #AltcoinWatch
$INIT
5
Xem bản dịch
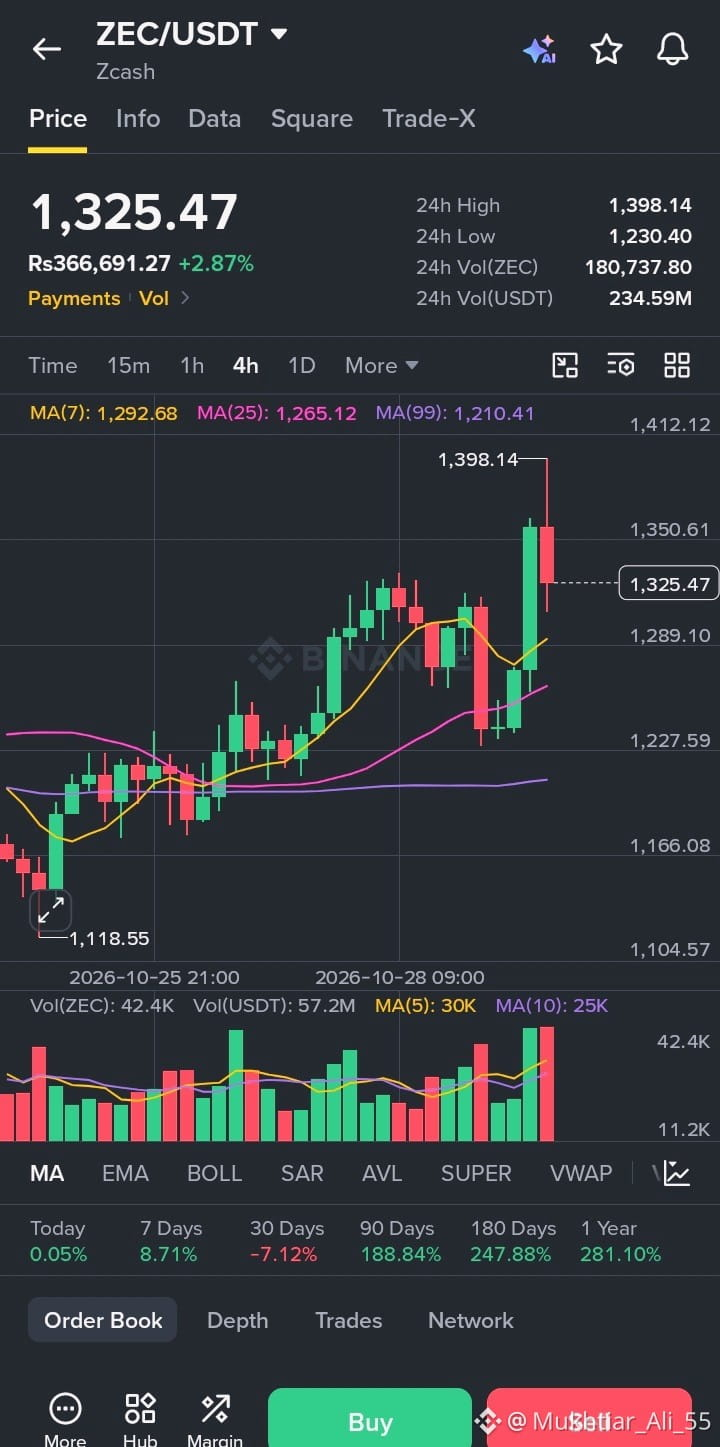
Zcash (ZEC) Holds Above 1,300 After a 2.87% Move: Here’s What the Chart Shows
ZEC is showing strong activity on Binance today, and the chart is worth a closer look.
Current snapshot (ZEC/USDT):
💰 Price: 1,325.47 USDT
📈 24h change: +2.87%
🔺 24h high: 1,398.14
🔻 24h low: 1,230.40
📊 24h volume: 180,737.80 ZEC (about 234.59M USDT)
What stands out on the 4H chart:
The price has been climbing in a steady staircase pattern from around 1,118, with higher lows forming along the way. After a pullback toward 1,230, buyers stepped back in and a strong green candle pushed it up to 1,398.14. Sellers appeared at the top, and the latest candle eased back to 1,325.47. Volume on the last two candles reached 42.4K, well above the recent average, so there is real activity behind this move.
Price is now above the MA(7) at 1,292.68, MA(25) at 1,265.12 and MA(99) at 1,210.41, with all three averages sloping upward. That points to a healthy trend, though the long upper wick near 1,398 shows selling pressure at that level.
My take:
Trends like this can continue, but price can also consolidate or pull back after a sharp push to a new high. Many traders wait for a retest of support, such as the MA(7) area, before making decisions, and use stop losses to manage risk.
#ZEC #Zcash #Binance #CryptoMarket #AltcoinWatch
$ZEC
{spot}(ZECUSDT)
Zcash (ZEC) Holds Above 1,300 After a 2.87% Move: Here’s What the Chart Shows
ZEC is showing strong activity on Binance today, and the chart is worth a closer look.
Current snapshot (ZEC/USDT):
💰 Price: 1,325.47 USDT
📈 24h change: +2.87%
🔺 24h high: 1,398.14
🔻 24h low: 1,230.40
📊 24h volume: 180,737.80 ZEC (about 234.59M USDT)
What stands out on the 4H chart:
The price has been climbing in a steady staircase pattern from around 1,118, with higher lows forming along the way. After a pullback toward 1,230, buyers stepped back in and a strong green candle pushed it up to 1,398.14. Sellers appeared at the top, and the latest candle eased back to 1,325.47. Volume on the last two candles reached 42.4K, well above the recent average, so there is real activity behind this move.
Price is now above the MA(7) at 1,292.68, MA(25) at 1,265.12 and MA(99) at 1,210.41, with all three averages sloping upward. That points to a healthy trend, though the long upper wick near 1,398 shows selling pressure at that level.
My take:
Trends like this can continue, but price can also consolidate or pull back after a sharp push to a new high. Many traders wait for a retest of support, such as the MA(7) area, before making decisions, and use stop losses to manage risk.
#ZEC #Zcash #Binance #CryptoMarket #AltcoinWatch
$ZEC
5
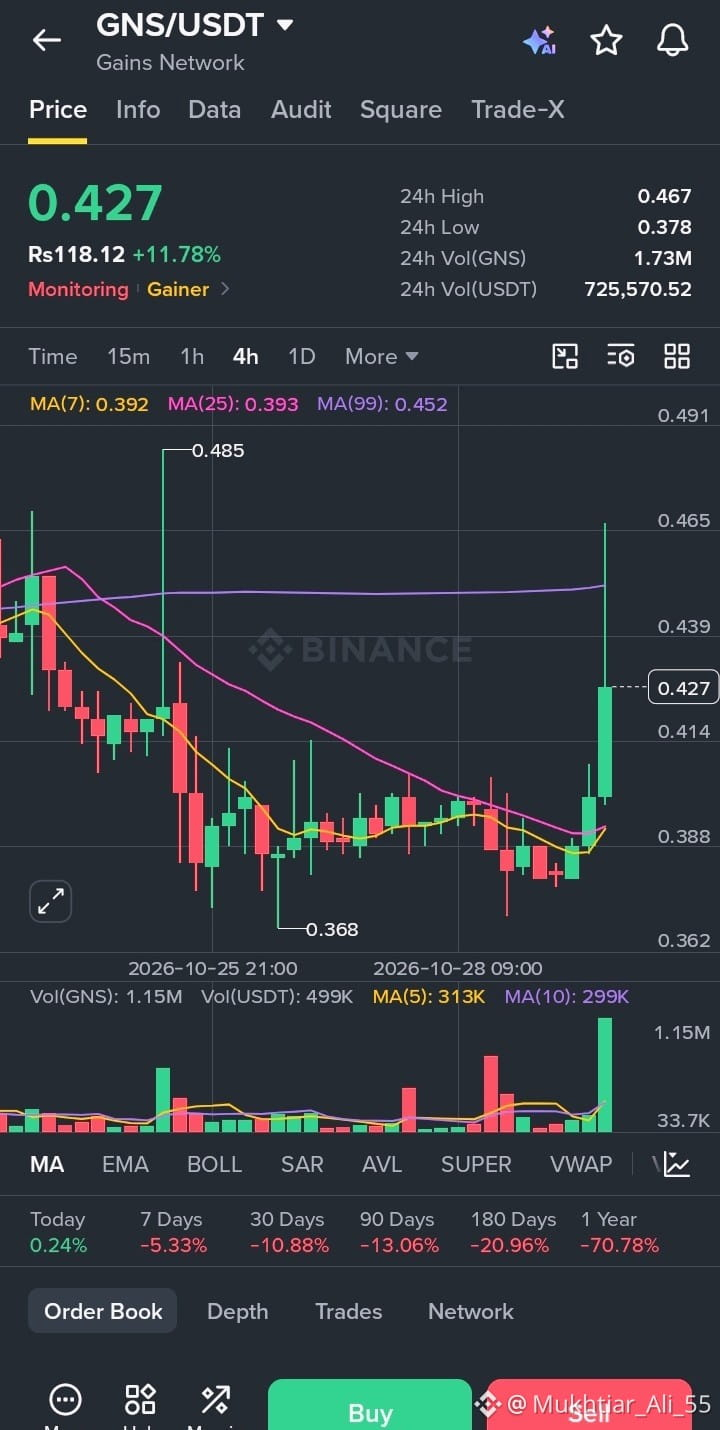
Gains Network (GNS) tăng 11% trong 24 giờ: Biểu đồ cho thấy điều gì
GNS đang xuất hiện trong danh sách tăng giá trên Binance hôm nay, và diễn biến này đáng để xem xét kỹ hơn.
Tổng quan hiện tại (GNS/USDT):
💰 Giá: 0.427 USDT
📈 Biến động 24 giờ: +11.78%
🔺 Cao nhất 24 giờ: 0.467
🔻 Thấp nhất 24 giờ: 0.378
📊 Khối lượng 24 giờ: 1.73M GNS (khoảng 725.57K USDT)
Điểm đáng chú ý trên biểu đồ 4H:
Giá đã giảm trong vài ngày, sau đó đi ngang trong khoảng 0.368–0.410, trước khi một cây nến xanh mạnh đẩy giá lên 0.465 và chốt quanh mức 0.427. Khối lượng giao dịch trên cây nến đó tăng lên 1.15M, cao hơn nhiều so với mức trung bình gần đây, cho thấy đợt tăng này có sự tham gia đáng kể.
Hiện giá đang cao hơn MA(7) ở mức 0.392 và MA(25) ở mức 0.393, nhưng vẫn thấp hơn MA(99) ở mức 0.452. Nhiều nhà giao dịch theo dõi sát việc giá lấy lại mốc này. Bóng nến trên dài gần mức 0.465 cũng cho thấy áp lực bán tại đó.
Nhận định của tôi:
Những nhịp bật tăng như thế này có thể tiếp diễn, nhưng cũng có thể suy yếu khi những người mua sớm chốt lời, nhất là khi xu hướng dài hạn vẫn đang giảm. Nhiều nhà giao dịch chờ giá tích lũy hoặc kiểm tra lại vùng hỗ trợ trước khi đưa ra quyết định, đồng thời sử dụng lệnh cắt lỗ để quản lý rủi ro.
#GNS #GainsNetwork #Binance #CryptoMarket #AltcoinWatch
$GNS
{spot}(GNSUSDT)
Gains Network (GNS) tăng 11% trong 24 giờ: Biểu đồ cho thấy điều gì
GNS đang xuất hiện trong danh sách tăng giá trên Binance hôm nay, và diễn biến này đáng để xem xét kỹ hơn.
Tổng quan hiện tại (GNS/USDT):
💰 Giá: 0.427 USDT
📈 Biến động 24 giờ: +11.78%
🔺 Cao nhất 24 giờ: 0.467
🔻 Thấp nhất 24 giờ: 0.378
📊 Khối lượng 24 giờ: 1.73M GNS (khoảng 725.57K USDT)
Điểm đáng chú ý trên biểu đồ 4H:
Giá đã giảm trong vài ngày, sau đó đi ngang trong khoảng 0.368–0.410, trước khi một cây nến xanh mạnh đẩy giá lên 0.465 và chốt quanh mức 0.427. Khối lượng giao dịch trên cây nến đó tăng lên 1.15M, cao hơn nhiều so với mức trung bình gần đây, cho thấy đợt tăng này có sự tham gia đáng kể.
Hiện giá đang cao hơn MA(7) ở mức 0.392 và MA(25) ở mức 0.393, nhưng vẫn thấp hơn MA(99) ở mức 0.452. Nhiều nhà giao dịch theo dõi sát việc giá lấy lại mốc này. Bóng nến trên dài gần mức 0.465 cũng cho thấy áp lực bán tại đó.
Nhận định của tôi:
Những nhịp bật tăng như thế này có thể tiếp diễn, nhưng cũng có thể suy yếu khi những người mua sớm chốt lời, nhất là khi xu hướng dài hạn vẫn đang giảm. Nhiều nhà giao dịch chờ giá tích lũy hoặc kiểm tra lại vùng hỗ trợ trước khi đưa ra quyết định, đồng thời sử dụng lệnh cắt lỗ để quản lý rủi ro.
#GNS #GainsNetwork #Binance #CryptoMarket #AltcoinWatch
$GNS
8
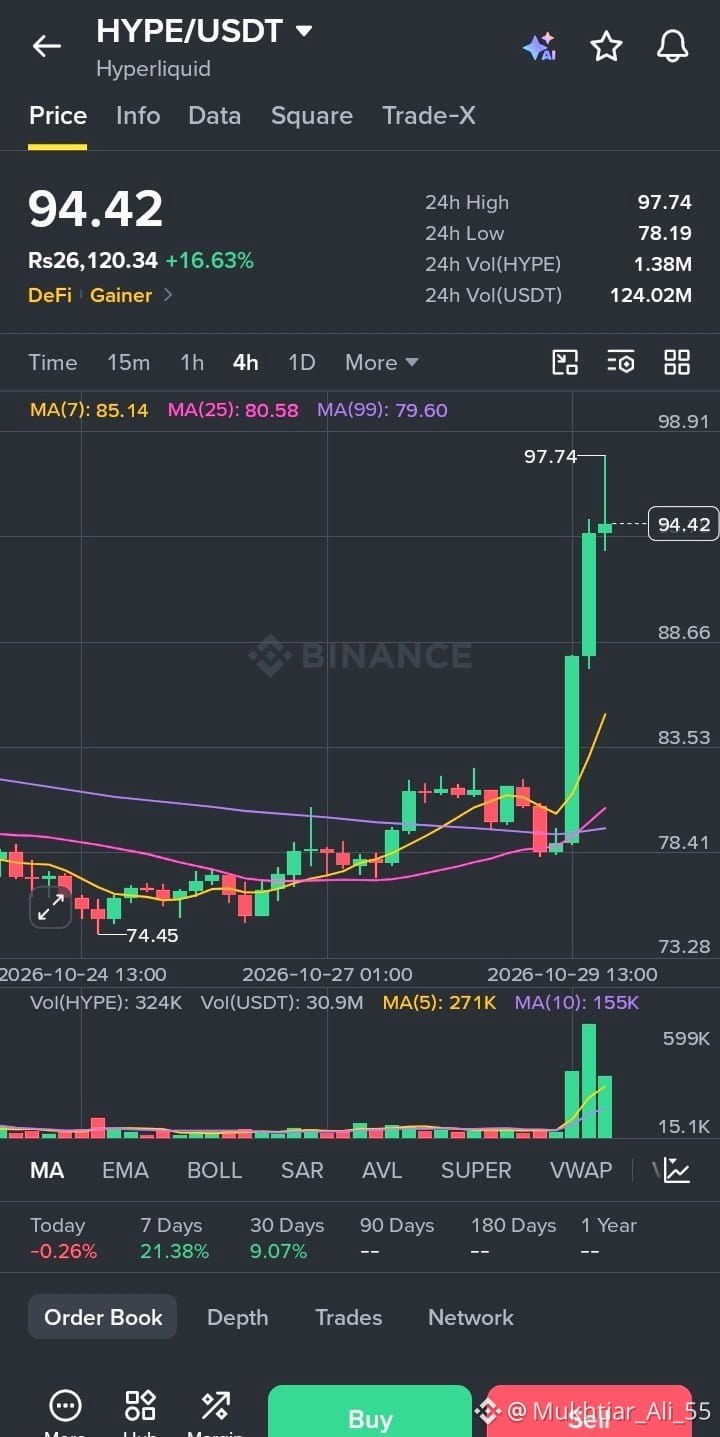
Hyperliquid (HYPE) tăng 16% trong 24 giờ: Biểu đồ cho thấy điều gì
Hôm nay, HYPE xuất hiện trong danh sách các đồng tăng giá trên Binance và đà tăng này đáng để xem xét kỹ hơn.
Tổng quan hiện tại (HYPE/USDT):
💰 Giá: 94.42 USDT
📈 Thay đổi trong 24 giờ: +16.63%
🔺 Mức cao nhất trong 24 giờ: 97.74
🔻 Mức thấp nhất trong 24 giờ: 78.19
📊 Khối lượng giao dịch trong 24 giờ: 1.38M HYPE (khoảng 124.02M USDT)
Điểm đáng chú ý trên biểu đồ 4H:
Giá đi ngang trong vài ngày, dao động quanh mức 74 đến 83, sau đó một loạt nến xanh mạnh đã đẩy giá lên 97.74 trước khi giảm nhẹ về 94.42. Khối lượng giao dịch tăng lên 599K ở cây nến lớn nhất, cao hơn nhiều so với mức trung bình gần đây, cho thấy đà tăng này có sự tham gia đáng kể.
Hiện giá đang cao hơn nhiều so với MA(7) ở mức 85.14, MA(25) ở mức 80.58 và MA(99) ở mức 79.60. Điều này cho thấy động lượng ngắn hạn mạnh, nhưng cũng có nghĩa là giá đã tăng cách khá xa các đường trung bình. Bóng nến trên ngắn gần mức 97.74 cho thấy áp lực bán ở ngưỡng này.
Nhận định của tôi:
Những xu hướng mạnh như thế này có thể tiếp diễn, nhưng giá cũng có thể điều chỉnh khi những người mua sớm chốt lời. Nhiều nhà giao dịch chờ giá tích lũy hoặc kiểm tra lại vùng hỗ trợ trước khi đưa ra quyết định, đồng thời sử dụng lệnh dừng lỗ để quản lý rủi ro.
#HYPE #Hyperliquid #Binance #CryptoMarket #AltcoinWatch
$HYPE
{spot}(HYPEUSDT)
Hyperliquid (HYPE) tăng 16% trong 24 giờ: Biểu đồ cho thấy điều gì
Hôm nay, HYPE xuất hiện trong danh sách các đồng tăng giá trên Binance và đà tăng này đáng để xem xét kỹ hơn.
Tổng quan hiện tại (HYPE/USDT):
💰 Giá: 94.42 USDT
📈 Thay đổi trong 24 giờ: +16.63%
🔺 Mức cao nhất trong 24 giờ: 97.74
🔻 Mức thấp nhất trong 24 giờ: 78.19
📊 Khối lượng giao dịch trong 24 giờ: 1.38M HYPE (khoảng 124.02M USDT)
Điểm đáng chú ý trên biểu đồ 4H:
Giá đi ngang trong vài ngày, dao động quanh mức 74 đến 83, sau đó một loạt nến xanh mạnh đã đẩy giá lên 97.74 trước khi giảm nhẹ về 94.42. Khối lượng giao dịch tăng lên 599K ở cây nến lớn nhất, cao hơn nhiều so với mức trung bình gần đây, cho thấy đà tăng này có sự tham gia đáng kể.
Hiện giá đang cao hơn nhiều so với MA(7) ở mức 85.14, MA(25) ở mức 80.58 và MA(99) ở mức 79.60. Điều này cho thấy động lượng ngắn hạn mạnh, nhưng cũng có nghĩa là giá đã tăng cách khá xa các đường trung bình. Bóng nến trên ngắn gần mức 97.74 cho thấy áp lực bán ở ngưỡng này.
Nhận định của tôi:
Những xu hướng mạnh như thế này có thể tiếp diễn, nhưng giá cũng có thể điều chỉnh khi những người mua sớm chốt lời. Nhiều nhà giao dịch chờ giá tích lũy hoặc kiểm tra lại vùng hỗ trợ trước khi đưa ra quyết định, đồng thời sử dụng lệnh dừng lỗ để quản lý rủi ro.
#HYPE #Hyperliquid #Binance #CryptoMarket #AltcoinWatch
$HYPE
6
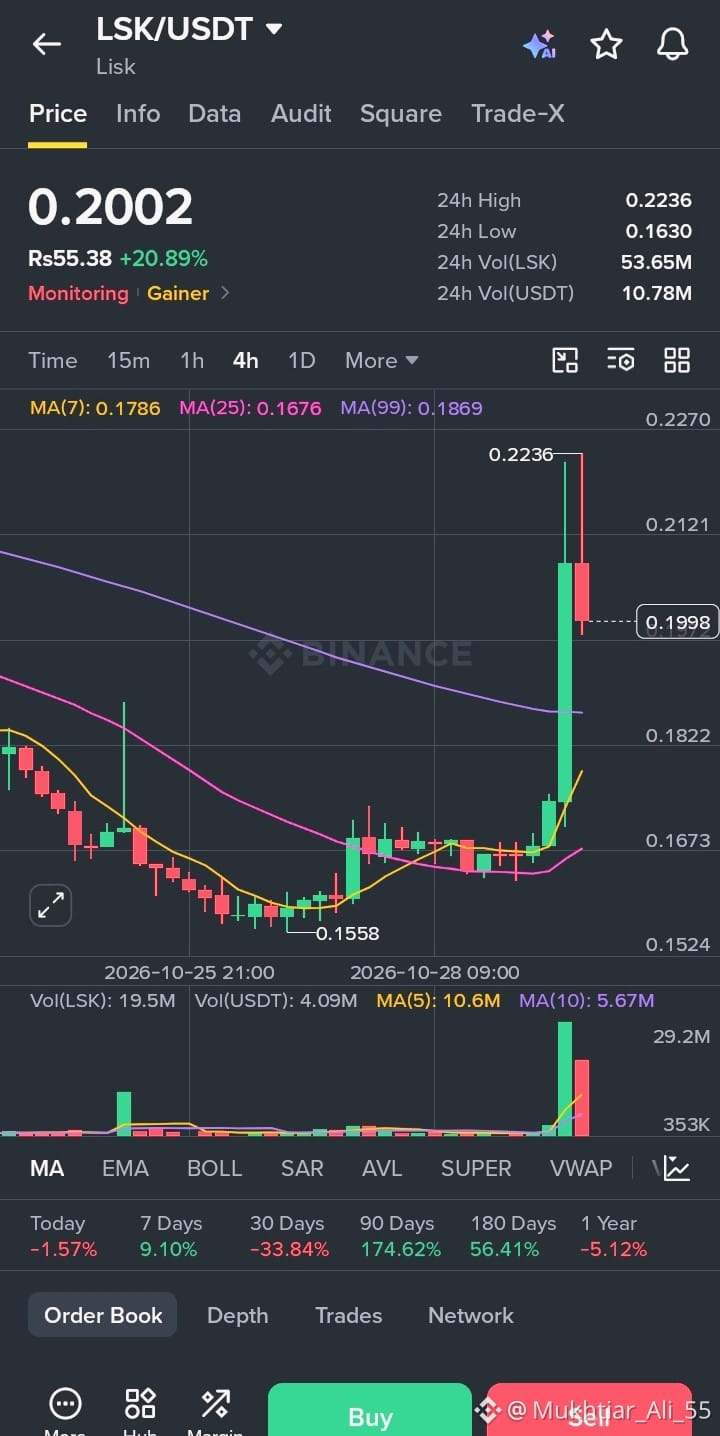
Lisk (LSK) Tăng vọt 20% trong 24 giờ: Đây là những gì biểu đồ cho thấy
LSK hôm nay đang xuất hiện trong danh sách mã tăng giá của Binance, và động thái này đáng để xem xét kỹ hơn.
Ảnh chụp hiện tại (LSK/USDT):
💰 Giá: 0.2002 USDT
📈 Biến động 24h: +20.89%
🔺 Đỉnh 24h: 0.2236
🔻 Đáy 24h: 0.1630
📊 Khối lượng 24h: 53.65M LSK (khoảng 10.78M USDT)
Điểm nổi bật trên biểu đồ 4H:
Giá đã giảm dần trong vài ngày rồi đi ngang quanh vùng 0.155 đến 0.170, trước khi một cây nến xanh mạnh đẩy nó lên 0.2236. Bên bán đã xuất hiện ở vùng đỉnh, và cây nến tiếp theo kéo giá lùi về gần 0.1998. Khối lượng tăng vọt lên 29.2M ở cây nến bứt phá, cao hơn nhiều so với mức trung bình gần đây, vì vậy đà tăng này thực sự có lực tham gia phía sau.
Giá hiện đang nằm trên MA(7) tại 0.1786, MA(25) tại 0.1676 và MA(99) tại 0.1869. Việc giành lại MA(99) là điều nhiều nhà giao dịch theo dõi sát sao, nhưng bóng nến trên dài gần 0.2236 cũng cho thấy đã có áp lực bán ở mức đó.
Quan điểm của tôi:
Những cú bứt phá như thế này có thể tiếp diễn, nhưng cũng có thể điều chỉnh khi những người mua sớm chốt lời. Nhiều nhà giao dịch chờ tích lũy hoặc retest vùng hỗ trợ trước khi ra quyết định, và dùng lệnh dừng lỗ để quản lý rủi ro.
#LSK #Lisk #Binance #CryptoMarket #AltcoinWatch
$LSK
{spot}(LSKUSDT)
Lisk (LSK) Tăng vọt 20% trong 24 giờ: Đây là những gì biểu đồ cho thấy
LSK hôm nay đang xuất hiện trong danh sách mã tăng giá của Binance, và động thái này đáng để xem xét kỹ hơn.
Ảnh chụp hiện tại (LSK/USDT):
💰 Giá: 0.2002 USDT
📈 Biến động 24h: +20.89%
🔺 Đỉnh 24h: 0.2236
🔻 Đáy 24h: 0.1630
📊 Khối lượng 24h: 53.65M LSK (khoảng 10.78M USDT)
Điểm nổi bật trên biểu đồ 4H:
Giá đã giảm dần trong vài ngày rồi đi ngang quanh vùng 0.155 đến 0.170, trước khi một cây nến xanh mạnh đẩy nó lên 0.2236. Bên bán đã xuất hiện ở vùng đỉnh, và cây nến tiếp theo kéo giá lùi về gần 0.1998. Khối lượng tăng vọt lên 29.2M ở cây nến bứt phá, cao hơn nhiều so với mức trung bình gần đây, vì vậy đà tăng này thực sự có lực tham gia phía sau.
Giá hiện đang nằm trên MA(7) tại 0.1786, MA(25) tại 0.1676 và MA(99) tại 0.1869. Việc giành lại MA(99) là điều nhiều nhà giao dịch theo dõi sát sao, nhưng bóng nến trên dài gần 0.2236 cũng cho thấy đã có áp lực bán ở mức đó.
Quan điểm của tôi:
Những cú bứt phá như thế này có thể tiếp diễn, nhưng cũng có thể điều chỉnh khi những người mua sớm chốt lời. Nhiều nhà giao dịch chờ tích lũy hoặc retest vùng hỗ trợ trước khi ra quyết định, và dùng lệnh dừng lỗ để quản lý rủi ro.
#LSK #Lisk #Binance #CryptoMarket #AltcoinWatch
$LSK
4
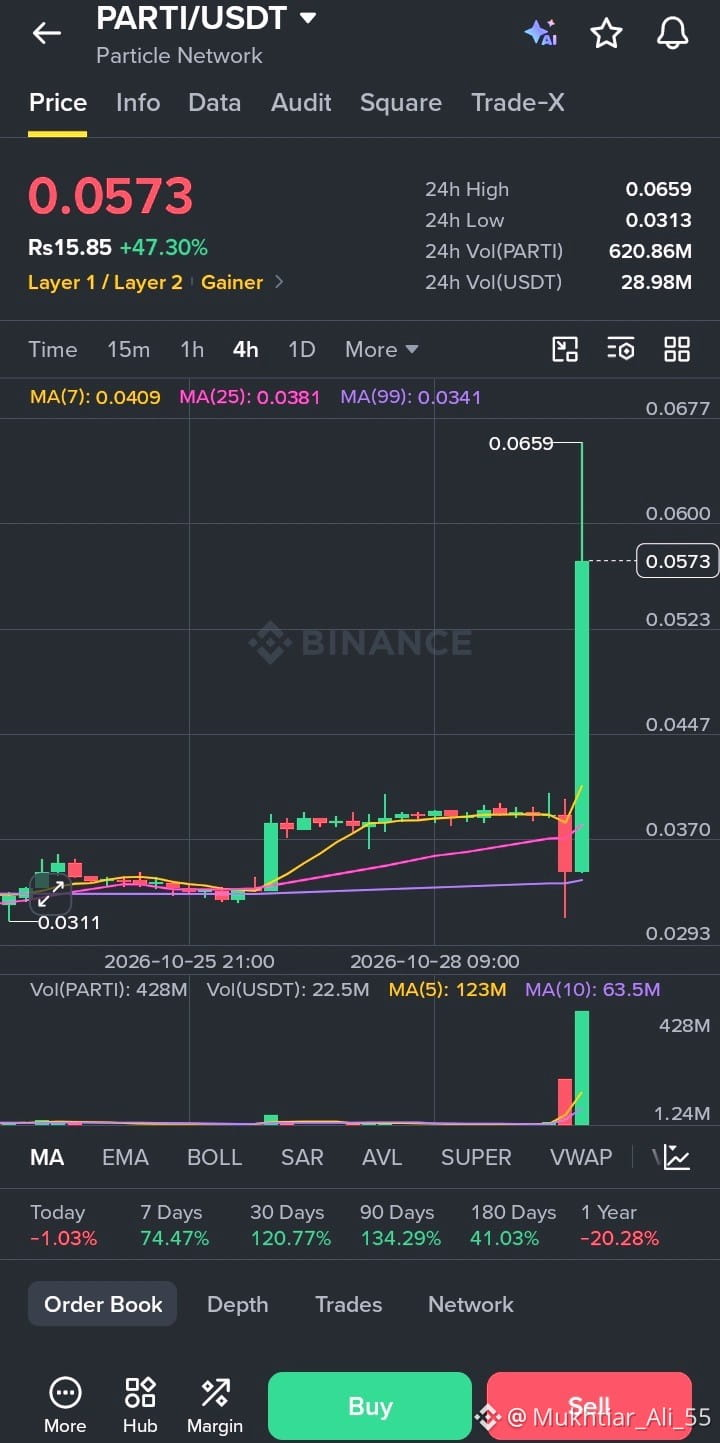
Particle Network (PARTI) tăng 47% trong 24 giờ: Biểu đồ cho thấy điều gì
PARTI là một trong những đồng tăng giá mạnh nhất trên Binance hôm nay, và các con số đáng để xem xét kỹ hơn.
Tổng quan hiện tại (PARTI/USDT):
💰 Giá: 0.0573 USDT
📈 Thay đổi trong 24 giờ: +47.30%
🔺 Đỉnh 24 giờ: 0.0659
🔻 Đáy 24 giờ: 0.0313
📊 Khối lượng giao dịch trong 24 giờ: 620.86M PARTI (khoảng 28.98M USDT)
Điểm đáng chú ý trên biểu đồ 4H:
Giá đi ngang trong nhiều ngày, dao động quanh mức 0.031 đến 0.039, sau đó một cây nến xanh khổng lồ đẩy giá lên 0.0659 trước khi điều chỉnh về 0.0573. Khối lượng giao dịch tăng vọt lên 428M trong cây nến đó, cao hơn nhiều so với mức trung bình gần đây, cho thấy đà tăng này có sự tham gia thực sự của thị trường.
Hiện giá đang cao hơn nhiều so với MA(7) ở mức 0.0409, MA(25) ở mức 0.0381 và MA(99) ở mức 0.0341. Điều đó cho thấy động lượng ngắn hạn mạnh, nhưng cũng có nghĩa là giá đã tăng cách xa các đường trung bình.
Nhận định của tôi:
Những đợt tăng dựng đứng như thế này có thể tiếp diễn, nhưng cũng có thể nhanh chóng điều chỉnh, đặc biệt sau khi xuất hiện bóng nến trên dài như ở mức 0.0659. Nhiều nhà giao dịch chờ giá tích lũy hoặc kiểm tra lại vùng hỗ trợ trước khi đưa ra quyết định, đồng thời sử dụng lệnh cắt lỗ để quản lý rủi ro.
#PARTI #ParticleNetwork #Binance #CryptoMarket #AltcoinWatch
$PARTI
{spot}(PARTIUSDT)
Particle Network (PARTI) tăng 47% trong 24 giờ: Biểu đồ cho thấy điều gì
PARTI là một trong những đồng tăng giá mạnh nhất trên Binance hôm nay, và các con số đáng để xem xét kỹ hơn.
Tổng quan hiện tại (PARTI/USDT):
💰 Giá: 0.0573 USDT
📈 Thay đổi trong 24 giờ: +47.30%
🔺 Đỉnh 24 giờ: 0.0659
🔻 Đáy 24 giờ: 0.0313
📊 Khối lượng giao dịch trong 24 giờ: 620.86M PARTI (khoảng 28.98M USDT)
Điểm đáng chú ý trên biểu đồ 4H:
Giá đi ngang trong nhiều ngày, dao động quanh mức 0.031 đến 0.039, sau đó một cây nến xanh khổng lồ đẩy giá lên 0.0659 trước khi điều chỉnh về 0.0573. Khối lượng giao dịch tăng vọt lên 428M trong cây nến đó, cao hơn nhiều so với mức trung bình gần đây, cho thấy đà tăng này có sự tham gia thực sự của thị trường.
Hiện giá đang cao hơn nhiều so với MA(7) ở mức 0.0409, MA(25) ở mức 0.0381 và MA(99) ở mức 0.0341. Điều đó cho thấy động lượng ngắn hạn mạnh, nhưng cũng có nghĩa là giá đã tăng cách xa các đường trung bình.
Nhận định của tôi:
Những đợt tăng dựng đứng như thế này có thể tiếp diễn, nhưng cũng có thể nhanh chóng điều chỉnh, đặc biệt sau khi xuất hiện bóng nến trên dài như ở mức 0.0659. Nhiều nhà giao dịch chờ giá tích lũy hoặc kiểm tra lại vùng hỗ trợ trước khi đưa ra quyết định, đồng thời sử dụng lệnh cắt lỗ để quản lý rủi ro.
#PARTI #ParticleNetwork #Binance #CryptoMarket #AltcoinWatch
$PARTI
10

·
--
Xem bản dịch
🚨🔥 $AIN /USDT — COULD A SHORT SQUEEZE BE NEXT?
$AIN traders, the market is getting interesting! 👀📊
Recent futures data shows:
💰 Price hovering around $0.143–$0.146
📉 Price down over the last 24 hours
⚡ Funding rate remains positive
📊 Open interest has declined
Here's the twist: short positions have also faced liquidations. That means a sudden move in either direction could catch overconfident traders off guard.
🟢 BULLISH WATCH
A confirmed breakout above $0.1547 could bring $0.1590 into focus.
🔴 BEARISH WATCH
A breakdown below $0.1419 could expose $0.1356.
🧠 THE STRATEGY:
Don't predict blindly. Watch price action, volume, and confirmation before making a decision.
💬 LET'S HEAR YOUR VIEW!
Can $AIN squeeze the shorts, or will sellers take control?
🟢 SHORT SQUEEZE
🔴 MORE DOWNSIDE
Comment below 👇
❤️ Like | 🔁 Share | ➕ Follow for more crypto market updates!
#AIN #AINUSDT #ShortSqueeze #CryptoTrading #AltcoinWatch #BinanceSquare #MarketSentiment #TradeSmart
80
·
--
Xem bản dịch
🚨 $AIN /USDT — THE NEXT BIG MOVE? 👀
$AIN is at a critical point! 📉🔥
After a massive rally, volatility is still high. Will buyers defend support, or will sellers push the price lower?
📊 KEY LEVELS TO WATCH
🟢 Bullish trigger: Break and hold above $0.1540
🎯 Watch: $0.1590 → $0.1630
🔴 Bearish trigger: Breakdown below $0.1410
🎯 Watch: $0.1350 → $0.1270
⚠️ Futures funding is elevated, which means leveraged trading can become expensive. Don't enter just because a candle looks exciting!
🧠 Patience beats FOMO. Wait for confirmation.
💬 ONE QUESTION FOR AIN TRADERS:
What matters more right now?
🟢 BREAKOUT CONFIRMATION
🔴 SUPPORT BREAKDOWN
Comment your view below! 👇
❤️ Like | 🔁 Share | ➕ Follow for more crypto market updates.
#AIN #AINUSDT #CryptoAnalysis #AltcoinWatch #BinanceSquare #PriceAction #CryptoTrading #RiskManagement
91
·
--
Xem bản dịch
🚨🔥 $AIN /USDT — MOMENTUM SHIFT ALERT!
⚡ Is $AIN preparing for another recovery, or is this just a temporary bounce?
📊 🟢 LONG SETUP
Entry trigger: Break and hold above $0.1540
🎯 TP1: $0.1590
🎯 TP2: $0.1627
🔴 BEARISH SETUP
Entry trigger: Break below $0.1410
🎯 TP1: $0.1362
🎯 TP2: $0.1270
🧠 WHAT MATTERS NOW
• Positive funding means longs are paying shorts.
• Open interest has recently declined.
• A breakout needs strong volume and a confirmed candle close.
⚠️ Don't enter between the trigger levels just because the price is moving. These are conditional scenarios, not guaranteed profits. Define your risk before trading.
💬 AIN COMMUNITY — WHAT'S YOUR NEXT MOVE?
🚀 RECOVERY or 📉 MORE DOWNSIDE?
#AIN #AINUSDT #CryptoMomentum #AltcoinWatch #MarketBreakout #FuturesInsights #PriceAction #TradeSmart
83

·
--
Xem bản dịch
📊 THREE NAMES FOR YOUR RESEARCH LIST!
Injective ($INJ ) focuses on financial applications, Sei ($SEI ) targets trading-oriented blockchain infrastructure, and Celestia ($TIA ) develops modular data availability technology. Strong narratives are interesting, but execution matters most.
#Injective #SEİ #Celestia #CryptoResearch #AltcoinWatch
1
25

·
--
💥 $KAT ĐANG TĂNG — ĐÀ TĂNG CÓ THỂ TIẾP TỤC?
Giá hiện tại: $0.00457
Biến động 24 giờ: +6.78%
Katana đang có diễn biến tích cực, với KAT tăng gần 7% trong dữ liệu thị trường mới nhất.
• Bên mua hiện đang đẩy giá lên.
• Hãy theo dõi xem khối lượng giao dịch có tăng mạnh hơn và lực mua có tiếp tục hay không.
• Nếu đà tăng suy yếu, giá có thể điều chỉnh.
Nhận định của tôi: $KAT đáng để chú ý, nhưng diễn biến tiếp theo quan trọng hơn tỷ lệ phần trăm trong ngày. Hãy chờ tín hiệu xác nhận thay vì vào lệnh vì quá hào hứng.
#KAT #Katana #CryptoUpdate #AltcoinWatch
1
421
Đăng nhập để khám phá thêm nội dung
Tham gia cùng người dùng tiền mã hóa toàn cầu trên Binance Square
⚡️ Nhận thông tin mới nhất và hữu ích về tiền mã hóa.
💬 Được tin cậy bởi sàn giao dịch tiền mã hóa lớn nhất thế giới.
👍 Khám phá những thông tin chuyên sâu thực tế từ những nhà sáng tạo đã xác minh.
Email / Số điện thoại
Chủ đề thịnh hành
1
#TheoDõiFOMC
308,784 lượt xem
1,310 đang thảo luận
2
#TinFed
374,365 lượt xem
1,035 đang thảo luận
3
#UniswapA16zSeekDeFiExemptionFromIllinoisCryptoTax
24,328 lượt xem
749 đang thảo luận
4
#HKDollarStablecoinHKDAPToLaunchOnSolana
18,721 lượt xem
471 đang thảo luận
5
#$1.5BInLeveragedCryptoBetsLiquidated
39,999 lượt xem
245 đang thảo luận
6
#TrezorSaysCryptoBilisSoldWalletMayContainMaliciousComponents
2,865 lượt xem
68 đang thảo luận
7
#KOSPIFalls3.53%BackBelow6000
62,307 lượt xem
1,089 đang thảo luận
8
#AmazonSharesFallAbout7%InPremarketTrading
28,129 lượt xem
582 đang thảo luận
9
#USMidtermElections
244,486 lượt xem
2,345 đang thảo luận
10
#StrategySTRCReaches$99.95ForFirstTimeIn165Days
25,730 lượt xem
94 đang thảo luận