

Chart-Sniper
624 Postlar

Chart-Sniper
Shikoyat qilish
Foydalanuvchini bloklash
🎯 ChartSniper is your go-to spot for spotting top crypto gainers and breakout setups in real time. I focus on clean chart analysis, key support and resistance.
Ochiq savdo
Vaqti-vaqti bilan savdo qiluvchi
5 oy
5 Kuzatilmoqda
50 Kuzatuvchilar
141 Yoqdi
Postlar
Portfel
·
--
O‘suvchi
Tarjimani ko‘rish
Title: $PROM Uptrend Continuation 🚀
$PROM USDT (Perp) – Bullish channel
Entry: 5.90–6.00 (retest)
TP: 6.25 / 6.70
SL: 5.50
Rising channel, HH/LL structure intact.
⚠️ Not financial advice. DYOR.
Notes on the levels (from your chart):
Price broke to a fresh high (HH) at 6.247 after bouncing off the channel's higher-low support near 5.50.
Entry: a pullback into the 5.90–6.00 zone (prior resistance turned support) offers a better risk/reward than chasing the current 6.04 price.
TP1 (6.25): recent high/resistance.
TP2 (6.70): upper channel line projection.
SL (5.50): below the last swing low (LL) and channel bottom — invalidates the uptrend structure if hit.
@Binance_Square_Official #QNTRises39% #EthereumBreaksAbove$2700 #BitgetBreachForgedRequestsNotStolenKeys #Binance #ChartSniper
{future}(PROMUSDT)
Title: $PROM Uptrend Continuation 🚀
$PROM USDT (Perp) – Bullish channel
Entry: 5.90–6.00 (retest)
TP: 6.25 / 6.70
SL: 5.50
Rising channel, HH/LL structure intact.
⚠️ Not financial advice. DYOR.
Notes on the levels (from your chart):
Price broke to a fresh high (HH) at 6.247 after bouncing off the channel's higher-low support near 5.50.
Entry: a pullback into the 5.90–6.00 zone (prior resistance turned support) offers a better risk/reward than chasing the current 6.04 price.
TP1 (6.25): recent high/resistance.
TP2 (6.70): upper channel line projection.
SL (5.50): below the last swing low (LL) and channel bottom — invalidates the uptrend structure if hit.
@Binance Square Official #QNTRises39% #EthereumBreaksAbove$2700 #BitgetBreachForgedRequestsNotStolenKeys #Binance #ChartSniper
$PROM USDT (Perp) – Bullish channel
Entry: 5.90–6.00 (retest)
TP: 6.25 / 6.70
SL: 5.50
Rising channel, HH/LL structure intact.
⚠️ Not financial advice. DYOR.
Notes on the levels (from your chart):
Price broke to a fresh high (HH) at 6.247 after bouncing off the channel's higher-low support near 5.50.
Entry: a pullback into the 5.90–6.00 zone (prior resistance turned support) offers a better risk/reward than chasing the current 6.04 price.
TP1 (6.25): recent high/resistance.
TP2 (6.70): upper channel line projection.
SL (5.50): below the last swing low (LL) and channel bottom — invalidates the uptrend structure if hit.
@Binance Square Official #QNTRises39% #EthereumBreaksAbove$2700 #BitgetBreachForgedRequestsNotStolenKeys #Binance #ChartSniper
224
·
--
Maqola
Tarjimani ko‘rish
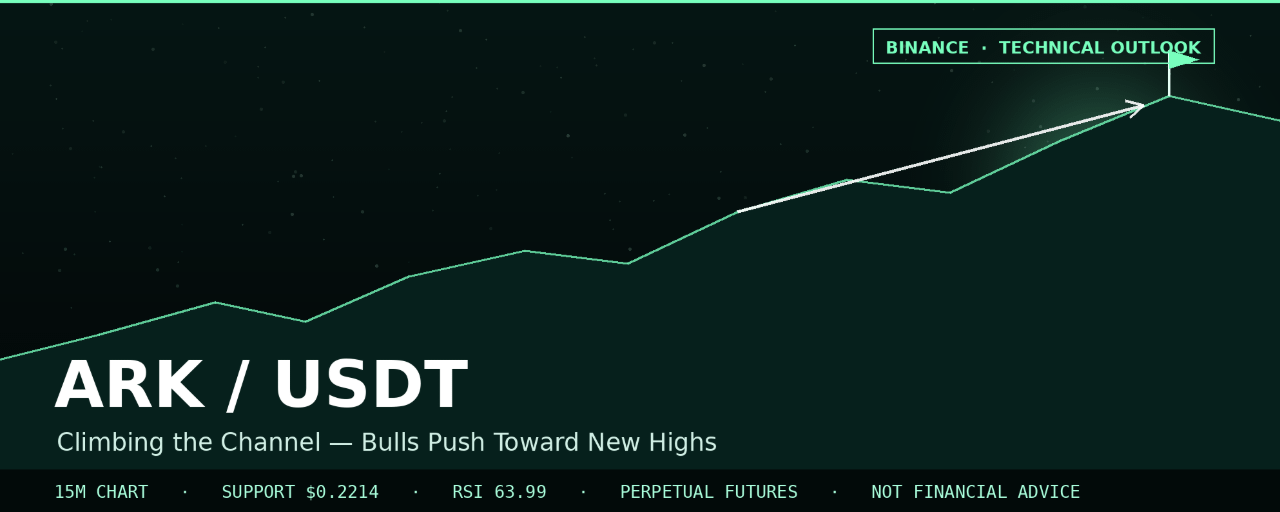
ARK/USDT Climbs the Channel: Bulls Push Toward New Highs$ARK
{future}(ARKUSDT)
ARK has been one of the strongest steady climbers on the board, grinding higher inside a clean ascending channel with a textbook Higher High / Higher Low structure. After a healthy pullback and bounce, price is once again pressing against its recent high — and the setup favors continuation as long as the channel holds.
Market Structure Overview
ARK/USDT (Perpetual Futures, Binance, 15M timeframe) has been in a persistent, well-organized uptrend:
Price has advanced steadily from roughly $0.155, forming a sequence of Lower Highs turned Higher Highs as the trend matured — an early LH near $0.165, followed by another LH around $0.195, before the structure flipped decisively bullish.A Higher Low (HL) formed near $0.175–$0.178, confirming buyers were stepping in earlier each time and building a rising floor.From that HL, price rallied hard into a Higher High (HH) at $0.2478, before pulling back to retest the $0.2214 level — a former consolidation zone that flipped from resistance into support.Since that retest, price has recovered strongly and is now trading at $0.2436, pressing back up toward the recent high.The entire advance is contained within a clean ascending channel, with both boundaries sloping upward and projecting toward $0.28+ over the coming sessions if the structure holds.
This HH/HL sequence combined with a clean channel is one of the more reliable trend-continuation patterns — each pullback so far has been bought before the prior high, not below it.
The Key Zone to Watch
Two levels stand out on this chart:
$0.2478 — the current swing high (HH) and the immediate resistance to clear for continuation.$0.2214 — the recently retested support zone, which held firm and triggered the current leg back toward the highs. This level, along with the rising channel's lower boundary, forms the key support to watch on any pullback.
A deeper support sits near $0.2050, which lines up with the base of the most recent consolidation range and marks a more conservative structural floor.
Momentum Check (RSI)
The RSI (14) is currently at 63.99, with its moving average at 62.96. This shows:
Momentum remains firmly bullish, comfortably above the 50 midline, without yet reaching overbought extremes (70+).RSI has stayed elevated through the recent pullback and bounce, reflecting sustained buying pressure rather than a weakening trend.There is still room for RSI to climb further before overbought conditions become a concern, supporting the case for continuation.
Trade Setup: Entry, Targets & Invalidation
Bias: Bullish continuation, favoring longs while price holds above the $0.2214–$0.2214 support shelf and the rising channel.
Entry Zone (preferred, retest-based):
$0.2200 – $0.2260, on a pullback into the support shelf and rising trendline confluence, ideally confirmed with a bullish rejection candle.
Alternative Entry (breakout-based, more aggressive):
A confirmed 15M/1H close above $0.2478 with rising volume, targeting a fresh leg higher inside the channel.
Stop-Loss / Invalidation:
Below $0.2050, beneath the deeper structural support and the base of the last consolidation range. A decisive close below this level would break the Higher-Low sequence and threaten the ascending channel.
Take-Profit Targets:
Target 1: $0.2478 — immediate resistance / current swing high.Target 2: $0.2700 — next logical extension inside the channel.Target 3 (extension): $0.2900 — aligns with the projected upper boundary of the ascending channel if momentum continues over the next 1–2 sessions.
Risk-to-Reward: Entering near $0.2230 with a stop at $0.2050 and a first target of $0.2478 offers roughly a 1:1.4 risk-to-reward to Target 1, improving to over 1:3.5 if price extends toward Target 3.
Key Levels Summary
Resistance: $0.2478 (HH) → $0.2700 → $0.2900 (channel extension)Support: $0.2214 (retested support / channel line) → $0.2050 (structural invalidation)Current Price: $0.2436
What Could Invalidate This Setup
A decisive close below $0.2050 would break the Higher-Low structure and the ascending channel, opening risk toward deeper support near $0.1900.Repeated rejection at $0.2478 paired with fading RSI momentum could signal the trend is losing steam rather than preparing for another leg up.
Final Thoughts
ARK/USDT continues to respect one of the cleanest ascending channels on the board, with a textbook HH/HL sequence supporting the bullish case. As long as the $0.2214–$0.2260 zone holds on any dip, the path of least resistance remains upward toward a retest — and potential break — of the $0.2478 high. A confirmed close back below $0.2050, however, would be the clearest signal that the trend needs reassessment.
Disclaimer: This article is for informational and educational purposes only and does not constitute financial advice. Cryptocurrency trading, especially with leverage/perpetual futures, carries significant risk of loss. Always conduct your own research (DYOR) and consult a licensed financial advisor before making any trading decisions. It is what it is.
@Binance_Square_Official #QNTRises39% #EthereumBreaksAbove$2700 #BitgetBreachForgedRequestsNotStolenKeys #Binance #ChartSniper
ARK/USDT Climbs the Channel: Bulls Push Toward New Highs
$ARK
ARK has been one of the strongest steady climbers on the board, grinding higher inside a clean ascending channel with a textbook Higher High / Higher Low structure. After a healthy pullback and bounce, price is once again pressing against its recent high — and the setup favors continuation as long as the channel holds.
Market Structure Overview
ARK/USDT (Perpetual Futures, Binance, 15M timeframe) has been in a persistent, well-organized uptrend:
Price has advanced steadily from roughly $0.155, forming a sequence of Lower Highs turned Higher Highs as the trend matured — an early LH near $0.165, followed by another LH around $0.195, before the structure flipped decisively bullish.A Higher Low (HL) formed near $0.175–$0.178, confirming buyers were stepping in earlier each time and building a rising floor.From that HL, price rallied hard into a Higher High (HH) at $0.2478, before pulling back to retest the $0.2214 level — a former consolidation zone that flipped from resistance into support.Since that retest, price has recovered strongly and is now trading at $0.2436, pressing back up toward the recent high.The entire advance is contained within a clean ascending channel, with both boundaries sloping upward and projecting toward $0.28+ over the coming sessions if the structure holds.
This HH/HL sequence combined with a clean channel is one of the more reliable trend-continuation patterns — each pullback so far has been bought before the prior high, not below it.
The Key Zone to Watch
Two levels stand out on this chart:
$0.2478 — the current swing high (HH) and the immediate resistance to clear for continuation.$0.2214 — the recently retested support zone, which held firm and triggered the current leg back toward the highs. This level, along with the rising channel's lower boundary, forms the key support to watch on any pullback.
A deeper support sits near $0.2050, which lines up with the base of the most recent consolidation range and marks a more conservative structural floor.
Momentum Check (RSI)
The RSI (14) is currently at 63.99, with its moving average at 62.96. This shows:
Momentum remains firmly bullish, comfortably above the 50 midline, without yet reaching overbought extremes (70+).RSI has stayed elevated through the recent pullback and bounce, reflecting sustained buying pressure rather than a weakening trend.There is still room for RSI to climb further before overbought conditions become a concern, supporting the case for continuation.
Trade Setup: Entry, Targets & Invalidation
Bias: Bullish continuation, favoring longs while price holds above the $0.2214–$0.2214 support shelf and the rising channel.
Entry Zone (preferred, retest-based):
$0.2200 – $0.2260, on a pullback into the support shelf and rising trendline confluence, ideally confirmed with a bullish rejection candle.
Alternative Entry (breakout-based, more aggressive):
A confirmed 15M/1H close above $0.2478 with rising volume, targeting a fresh leg higher inside the channel.
Stop-Loss / Invalidation:
Below $0.2050, beneath the deeper structural support and the base of the last consolidation range. A decisive close below this level would break the Higher-Low sequence and threaten the ascending channel.
Take-Profit Targets:
Target 1: $0.2478 — immediate resistance / current swing high.Target 2: $0.2700 — next logical extension inside the channel.Target 3 (extension): $0.2900 — aligns with the projected upper boundary of the ascending channel if momentum continues over the next 1–2 sessions.
Risk-to-Reward: Entering near $0.2230 with a stop at $0.2050 and a first target of $0.2478 offers roughly a 1:1.4 risk-to-reward to Target 1, improving to over 1:3.5 if price extends toward Target 3.
Key Levels Summary
Resistance: $0.2478 (HH) → $0.2700 → $0.2900 (channel extension)Support: $0.2214 (retested support / channel line) → $0.2050 (structural invalidation)Current Price: $0.2436
What Could Invalidate This Setup
A decisive close below $0.2050 would break the Higher-Low structure and the ascending channel, opening risk toward deeper support near $0.1900.Repeated rejection at $0.2478 paired with fading RSI momentum could signal the trend is losing steam rather than preparing for another leg up.
Final Thoughts
ARK/USDT continues to respect one of the cleanest ascending channels on the board, with a textbook HH/HL sequence supporting the bullish case. As long as the $0.2214–$0.2260 zone holds on any dip, the path of least resistance remains upward toward a retest — and potential break — of the $0.2478 high. A confirmed close back below $0.2050, however, would be the clearest signal that the trend needs reassessment.
Disclaimer: This article is for informational and educational purposes only and does not constitute financial advice. Cryptocurrency trading, especially with leverage/perpetual futures, carries significant risk of loss. Always conduct your own research (DYOR) and consult a licensed financial advisor before making any trading decisions. It is what it is.
@Binance Square Official #QNTRises39% #EthereumBreaksAbove$2700 #BitgetBreachForgedRequestsNotStolenKeys #Binance #ChartSniper
ARK has been one of the strongest steady climbers on the board, grinding higher inside a clean ascending channel with a textbook Higher High / Higher Low structure. After a healthy pullback and bounce, price is once again pressing against its recent high — and the setup favors continuation as long as the channel holds.
Market Structure Overview
ARK/USDT (Perpetual Futures, Binance, 15M timeframe) has been in a persistent, well-organized uptrend:
Price has advanced steadily from roughly $0.155, forming a sequence of Lower Highs turned Higher Highs as the trend matured — an early LH near $0.165, followed by another LH around $0.195, before the structure flipped decisively bullish.A Higher Low (HL) formed near $0.175–$0.178, confirming buyers were stepping in earlier each time and building a rising floor.From that HL, price rallied hard into a Higher High (HH) at $0.2478, before pulling back to retest the $0.2214 level — a former consolidation zone that flipped from resistance into support.Since that retest, price has recovered strongly and is now trading at $0.2436, pressing back up toward the recent high.The entire advance is contained within a clean ascending channel, with both boundaries sloping upward and projecting toward $0.28+ over the coming sessions if the structure holds.
This HH/HL sequence combined with a clean channel is one of the more reliable trend-continuation patterns — each pullback so far has been bought before the prior high, not below it.
The Key Zone to Watch
Two levels stand out on this chart:
$0.2478 — the current swing high (HH) and the immediate resistance to clear for continuation.$0.2214 — the recently retested support zone, which held firm and triggered the current leg back toward the highs. This level, along with the rising channel's lower boundary, forms the key support to watch on any pullback.
A deeper support sits near $0.2050, which lines up with the base of the most recent consolidation range and marks a more conservative structural floor.
Momentum Check (RSI)
The RSI (14) is currently at 63.99, with its moving average at 62.96. This shows:
Momentum remains firmly bullish, comfortably above the 50 midline, without yet reaching overbought extremes (70+).RSI has stayed elevated through the recent pullback and bounce, reflecting sustained buying pressure rather than a weakening trend.There is still room for RSI to climb further before overbought conditions become a concern, supporting the case for continuation.
Trade Setup: Entry, Targets & Invalidation
Bias: Bullish continuation, favoring longs while price holds above the $0.2214–$0.2214 support shelf and the rising channel.
Entry Zone (preferred, retest-based):
$0.2200 – $0.2260, on a pullback into the support shelf and rising trendline confluence, ideally confirmed with a bullish rejection candle.
Alternative Entry (breakout-based, more aggressive):
A confirmed 15M/1H close above $0.2478 with rising volume, targeting a fresh leg higher inside the channel.
Stop-Loss / Invalidation:
Below $0.2050, beneath the deeper structural support and the base of the last consolidation range. A decisive close below this level would break the Higher-Low sequence and threaten the ascending channel.
Take-Profit Targets:
Target 1: $0.2478 — immediate resistance / current swing high.Target 2: $0.2700 — next logical extension inside the channel.Target 3 (extension): $0.2900 — aligns with the projected upper boundary of the ascending channel if momentum continues over the next 1–2 sessions.
Risk-to-Reward: Entering near $0.2230 with a stop at $0.2050 and a first target of $0.2478 offers roughly a 1:1.4 risk-to-reward to Target 1, improving to over 1:3.5 if price extends toward Target 3.
Key Levels Summary
Resistance: $0.2478 (HH) → $0.2700 → $0.2900 (channel extension)Support: $0.2214 (retested support / channel line) → $0.2050 (structural invalidation)Current Price: $0.2436
What Could Invalidate This Setup
A decisive close below $0.2050 would break the Higher-Low structure and the ascending channel, opening risk toward deeper support near $0.1900.Repeated rejection at $0.2478 paired with fading RSI momentum could signal the trend is losing steam rather than preparing for another leg up.
Final Thoughts
ARK/USDT continues to respect one of the cleanest ascending channels on the board, with a textbook HH/HL sequence supporting the bullish case. As long as the $0.2214–$0.2260 zone holds on any dip, the path of least resistance remains upward toward a retest — and potential break — of the $0.2478 high. A confirmed close back below $0.2050, however, would be the clearest signal that the trend needs reassessment.
Disclaimer: This article is for informational and educational purposes only and does not constitute financial advice. Cryptocurrency trading, especially with leverage/perpetual futures, carries significant risk of loss. Always conduct your own research (DYOR) and consult a licensed financial advisor before making any trading decisions. It is what it is.
@Binance Square Official #QNTRises39% #EthereumBreaksAbove$2700 #BitgetBreachForgedRequestsNotStolenKeys #Binance #ChartSniper
116
·
--
Tarjimani ko‘rish
Title: RARE Breakout Watch ⚡
$RARE USDT (Perp) – Symmetrical triangle
Entry: Break above 0.0171
TP: 0.0180 / 0.0185
SL: 0.0160
Breakdown: Entry below 0.0162, TP 0.0155
⚠️ Not financial advice. DYOR.
Notes on the levels (from your chart):
Price is coiling into the apex of a symmetrical triangle around 0.01633, with the 61.8%/50% Fib levels acting as support (0.0162–0.0163) and the triangle top/28.2% Fib as resistance (0.0171).
Bullish entry: wait for a confirmed close above 0.0171 (triangle breakout), targeting 0.0180 then 0.0185.
Bearish entry: if price breaks below the 0.0162 apex support instead, targeting 0.0155.
@Binance_Square_Official #QNTRises39% #EthereumBreaksAbove$2700 #BitgetBreachForgedRequestsNotStolenKeys #Binance #ChartSniper
{future}(RAREUSDT)
Title: RARE Breakout Watch ⚡
$RARE USDT (Perp) – Symmetrical triangle
Entry: Break above 0.0171
TP: 0.0180 / 0.0185
SL: 0.0160
Breakdown: Entry below 0.0162, TP 0.0155
⚠️ Not financial advice. DYOR.
Notes on the levels (from your chart):
Price is coiling into the apex of a symmetrical triangle around 0.01633, with the 61.8%/50% Fib levels acting as support (0.0162–0.0163) and the triangle top/28.2% Fib as resistance (0.0171).
Bullish entry: wait for a confirmed close above 0.0171 (triangle breakout), targeting 0.0180 then 0.0185.
Bearish entry: if price breaks below the 0.0162 apex support instead, targeting 0.0155.
@Binance Square Official #QNTRises39% #EthereumBreaksAbove$2700 #BitgetBreachForgedRequestsNotStolenKeys #Binance #ChartSniper
$RARE USDT (Perp) – Symmetrical triangle
Entry: Break above 0.0171
TP: 0.0180 / 0.0185
SL: 0.0160
Breakdown: Entry below 0.0162, TP 0.0155
⚠️ Not financial advice. DYOR.
Notes on the levels (from your chart):
Price is coiling into the apex of a symmetrical triangle around 0.01633, with the 61.8%/50% Fib levels acting as support (0.0162–0.0163) and the triangle top/28.2% Fib as resistance (0.0171).
Bullish entry: wait for a confirmed close above 0.0171 (triangle breakout), targeting 0.0180 then 0.0185.
Bearish entry: if price breaks below the 0.0162 apex support instead, targeting 0.0155.
@Binance Square Official #QNTRises39% #EthereumBreaksAbove$2700 #BitgetBreachForgedRequestsNotStolenKeys #Binance #ChartSniper
273
·
--
Maqola
Tarjimani ko‘rish
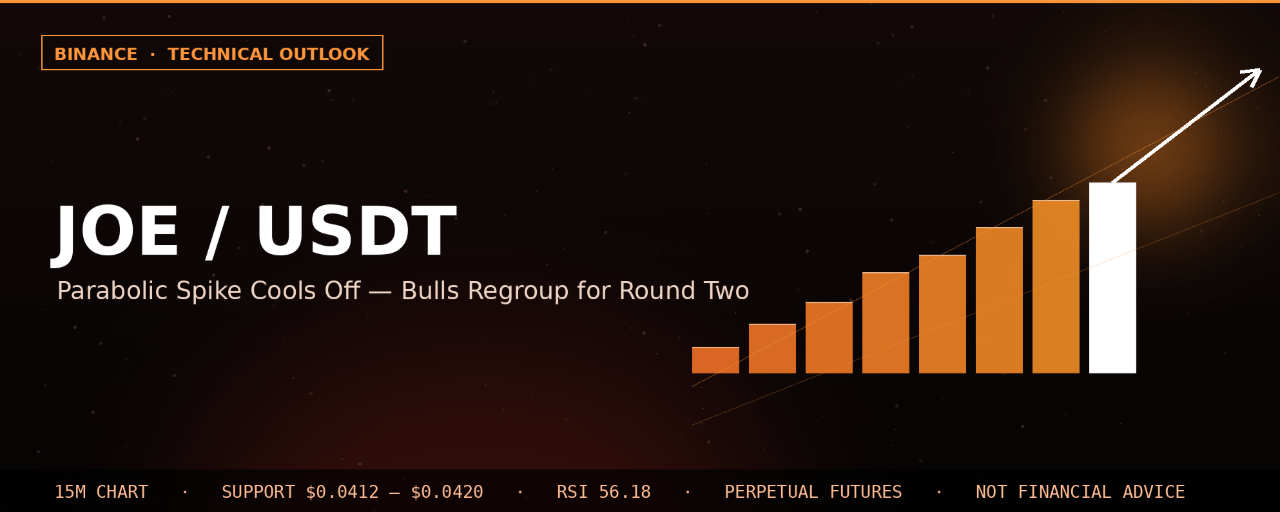
JOE/USDT Parabolic Spike Cools Off: Bulls Regroup for Round Two$JOE
{future}(JOEUSDT)
JOE has delivered one of the sharpest moves on the board — a fast, near-vertical breakout from a rising channel that tagged a Higher High before pulling back into a tight consolidation. With momentum still constructive and price holding above key support, the setup looks primed for a potential continuation leg.
Market Structure Overview
JOE/USDT (Perpetual Futures, Binance, 15M timeframe) has been building a bullish structure over the past several sessions:
Price based out near $0.0330–$0.0345, forming an early Lower High (LH) around $0.0355 before grinding sideways in a tight accumulation range.A Lower Low (LL) formed near $0.0365, right before buyers took control and launched an aggressive rally.That rally accelerated into a near-vertical impulse, tagging a Higher High (HH) at $0.04571 — a massive expansion move that dwarfed the prior ranges.Since the HH, price has pulled back and is now consolidating tightly between roughly $0.0412 and $0.0420, currently trading at $0.04145.The entire move — from the LL through the HH — sits inside a well-defined ascending channel, with both the lower and upper boundaries sloping upward and projecting further gains if respected.
This is the hallmark of a strong impulsive move followed by healthy consolidation: rather than dumping back to the origin of the rally, price is basing well above the breakout zone, which is typically constructive for trend continuation.
The Key Zone to Watch
The current consolidation range between $0.0412 and $0.0420 is the level to watch closely:
This zone sits just below the launch point of the parabolic move, meaning it has effectively become a "fair value" area where the market is digesting its gains.It also lines up with the rising lower boundary of the ascending channel, adding structural confluence to the support.As long as price holds above this shelf, the broader structure favors another attempt at the $0.04571 high and beyond.
A clean break and hold below $0.0400 would undermine this thesis and suggest a deeper retracement is underway.
Momentum Check (RSI)
The RSI (14) currently reads 56.18, with its moving average at 52.72. A few observations:
RSI spiked well above 70 during the parabolic move and has since cooled back toward the mid-50s — a healthy reset rather than a bearish divergence.Holding above the 50 level throughout the pullback is a good sign that buyers remain in control of momentum.A renewed push above 60–65 on the RSI alongside a price breakout would strengthen the case for continuation toward new highs.
Trade Setup: Entry, Targets & Invalidation
Bias: Bullish continuation, contingent on the $0.0412–$0.0420 shelf and the ascending channel support holding.
Entry Zone (preferred, retest-based):
$0.0412 – $0.0420, on a retest of the current consolidation shelf with a bullish confirmation candle (rejection wick or bullish engulfing).
Alternative Entry (breakout-based, more aggressive):
A confirmed 15M/1H close above $0.0420 with rising volume, adding on a retest of the prior HH at $0.04571 as it flips into support.
Stop-Loss / Invalidation:
Below $0.0400, which sits beneath both the consolidation shelf and the rising channel's lower boundary. A decisive close below this level would break the bullish structure.
Take-Profit Targets:
Target 1: $0.04571 — retest of the prior Higher High.Target 2: $0.0500 — psychological round number and a natural extension inside the ascending channel.Target 3 (extension): $0.0540 — aligns with the projected upper boundary of the ascending channel over the next 1–2 days if momentum continues.
Risk-to-Reward: Entering near $0.0415 with a stop at $0.0400 and a first target of $0.04571 offers roughly a 1:2.8 risk-to-reward ratio, improving further if price extends toward $0.0500–$0.0540.
Key Levels Summary
Resistance: $0.04571 (HH) → $0.0500 → $0.0540 (channel extension)Support: $0.0412–$0.0420 (consolidation shelf) → $0.0400 (channel support, invalidation)Current Price: $0.04145
What Could Invalidate This Setup
A sharp close below $0.0400 would break both the consolidation shelf and the ascending channel, opening the door to a deeper retracement toward $0.0365–$0.0375.Repeated failures to reclaim $0.0420 combined with fading RSI momentum could signal the pullback is turning into distribution rather than a healthy pause.
Final Thoughts
JOE/USDT has shown some of the strongest relative momentum on the board, and the current tight consolidation above former resistance is a constructive sign rather than a warning. As long as the $0.0412–$0.0420 shelf and the ascending channel support hold, the path of least resistance remains toward a retest — and potential break — of the $0.04571 high. A confirmed breakdown below $0.0400, however, would flip the near-term bias and call for caution.
Disclaimer: This article is for informational and educational purposes only and does not constitute financial advice. Cryptocurrency trading, especially with leverage/perpetual futures, carries significant risk of loss. Always conduct your own research (DYOR) and consult a licensed financial advisor before making any trading decisions. It is what it is.
@Binance_Square_Official #QNTRises39% #EthereumBreaksAbove$2700 #BitgetBreachForgedRequestsNotStolenKeys #Binance #ChartSniper
JOE/USDT Parabolic Spike Cools Off: Bulls Regroup for Round Two
$JOE
JOE has delivered one of the sharpest moves on the board — a fast, near-vertical breakout from a rising channel that tagged a Higher High before pulling back into a tight consolidation. With momentum still constructive and price holding above key support, the setup looks primed for a potential continuation leg.
Market Structure Overview
JOE/USDT (Perpetual Futures, Binance, 15M timeframe) has been building a bullish structure over the past several sessions:
Price based out near $0.0330–$0.0345, forming an early Lower High (LH) around $0.0355 before grinding sideways in a tight accumulation range.A Lower Low (LL) formed near $0.0365, right before buyers took control and launched an aggressive rally.That rally accelerated into a near-vertical impulse, tagging a Higher High (HH) at $0.04571 — a massive expansion move that dwarfed the prior ranges.Since the HH, price has pulled back and is now consolidating tightly between roughly $0.0412 and $0.0420, currently trading at $0.04145.The entire move — from the LL through the HH — sits inside a well-defined ascending channel, with both the lower and upper boundaries sloping upward and projecting further gains if respected.
This is the hallmark of a strong impulsive move followed by healthy consolidation: rather than dumping back to the origin of the rally, price is basing well above the breakout zone, which is typically constructive for trend continuation.
The Key Zone to Watch
The current consolidation range between $0.0412 and $0.0420 is the level to watch closely:
This zone sits just below the launch point of the parabolic move, meaning it has effectively become a "fair value" area where the market is digesting its gains.It also lines up with the rising lower boundary of the ascending channel, adding structural confluence to the support.As long as price holds above this shelf, the broader structure favors another attempt at the $0.04571 high and beyond.
A clean break and hold below $0.0400 would undermine this thesis and suggest a deeper retracement is underway.
Momentum Check (RSI)
The RSI (14) currently reads 56.18, with its moving average at 52.72. A few observations:
RSI spiked well above 70 during the parabolic move and has since cooled back toward the mid-50s — a healthy reset rather than a bearish divergence.Holding above the 50 level throughout the pullback is a good sign that buyers remain in control of momentum.A renewed push above 60–65 on the RSI alongside a price breakout would strengthen the case for continuation toward new highs.
Trade Setup: Entry, Targets & Invalidation
Bias: Bullish continuation, contingent on the $0.0412–$0.0420 shelf and the ascending channel support holding.
Entry Zone (preferred, retest-based):
$0.0412 – $0.0420, on a retest of the current consolidation shelf with a bullish confirmation candle (rejection wick or bullish engulfing).
Alternative Entry (breakout-based, more aggressive):
A confirmed 15M/1H close above $0.0420 with rising volume, adding on a retest of the prior HH at $0.04571 as it flips into support.
Stop-Loss / Invalidation:
Below $0.0400, which sits beneath both the consolidation shelf and the rising channel's lower boundary. A decisive close below this level would break the bullish structure.
Take-Profit Targets:
Target 1: $0.04571 — retest of the prior Higher High.Target 2: $0.0500 — psychological round number and a natural extension inside the ascending channel.Target 3 (extension): $0.0540 — aligns with the projected upper boundary of the ascending channel over the next 1–2 days if momentum continues.
Risk-to-Reward: Entering near $0.0415 with a stop at $0.0400 and a first target of $0.04571 offers roughly a 1:2.8 risk-to-reward ratio, improving further if price extends toward $0.0500–$0.0540.
Key Levels Summary
Resistance: $0.04571 (HH) → $0.0500 → $0.0540 (channel extension)Support: $0.0412–$0.0420 (consolidation shelf) → $0.0400 (channel support, invalidation)Current Price: $0.04145
What Could Invalidate This Setup
A sharp close below $0.0400 would break both the consolidation shelf and the ascending channel, opening the door to a deeper retracement toward $0.0365–$0.0375.Repeated failures to reclaim $0.0420 combined with fading RSI momentum could signal the pullback is turning into distribution rather than a healthy pause.
Final Thoughts
JOE/USDT has shown some of the strongest relative momentum on the board, and the current tight consolidation above former resistance is a constructive sign rather than a warning. As long as the $0.0412–$0.0420 shelf and the ascending channel support hold, the path of least resistance remains toward a retest — and potential break — of the $0.04571 high. A confirmed breakdown below $0.0400, however, would flip the near-term bias and call for caution.
Disclaimer: This article is for informational and educational purposes only and does not constitute financial advice. Cryptocurrency trading, especially with leverage/perpetual futures, carries significant risk of loss. Always conduct your own research (DYOR) and consult a licensed financial advisor before making any trading decisions. It is what it is.
@Binance Square Official #QNTRises39% #EthereumBreaksAbove$2700 #BitgetBreachForgedRequestsNotStolenKeys #Binance #ChartSniper
JOE has delivered one of the sharpest moves on the board — a fast, near-vertical breakout from a rising channel that tagged a Higher High before pulling back into a tight consolidation. With momentum still constructive and price holding above key support, the setup looks primed for a potential continuation leg.
Market Structure Overview
JOE/USDT (Perpetual Futures, Binance, 15M timeframe) has been building a bullish structure over the past several sessions:
Price based out near $0.0330–$0.0345, forming an early Lower High (LH) around $0.0355 before grinding sideways in a tight accumulation range.A Lower Low (LL) formed near $0.0365, right before buyers took control and launched an aggressive rally.That rally accelerated into a near-vertical impulse, tagging a Higher High (HH) at $0.04571 — a massive expansion move that dwarfed the prior ranges.Since the HH, price has pulled back and is now consolidating tightly between roughly $0.0412 and $0.0420, currently trading at $0.04145.The entire move — from the LL through the HH — sits inside a well-defined ascending channel, with both the lower and upper boundaries sloping upward and projecting further gains if respected.
This is the hallmark of a strong impulsive move followed by healthy consolidation: rather than dumping back to the origin of the rally, price is basing well above the breakout zone, which is typically constructive for trend continuation.
The Key Zone to Watch
The current consolidation range between $0.0412 and $0.0420 is the level to watch closely:
This zone sits just below the launch point of the parabolic move, meaning it has effectively become a "fair value" area where the market is digesting its gains.It also lines up with the rising lower boundary of the ascending channel, adding structural confluence to the support.As long as price holds above this shelf, the broader structure favors another attempt at the $0.04571 high and beyond.
A clean break and hold below $0.0400 would undermine this thesis and suggest a deeper retracement is underway.
Momentum Check (RSI)
The RSI (14) currently reads 56.18, with its moving average at 52.72. A few observations:
RSI spiked well above 70 during the parabolic move and has since cooled back toward the mid-50s — a healthy reset rather than a bearish divergence.Holding above the 50 level throughout the pullback is a good sign that buyers remain in control of momentum.A renewed push above 60–65 on the RSI alongside a price breakout would strengthen the case for continuation toward new highs.
Trade Setup: Entry, Targets & Invalidation
Bias: Bullish continuation, contingent on the $0.0412–$0.0420 shelf and the ascending channel support holding.
Entry Zone (preferred, retest-based):
$0.0412 – $0.0420, on a retest of the current consolidation shelf with a bullish confirmation candle (rejection wick or bullish engulfing).
Alternative Entry (breakout-based, more aggressive):
A confirmed 15M/1H close above $0.0420 with rising volume, adding on a retest of the prior HH at $0.04571 as it flips into support.
Stop-Loss / Invalidation:
Below $0.0400, which sits beneath both the consolidation shelf and the rising channel's lower boundary. A decisive close below this level would break the bullish structure.
Take-Profit Targets:
Target 1: $0.04571 — retest of the prior Higher High.Target 2: $0.0500 — psychological round number and a natural extension inside the ascending channel.Target 3 (extension): $0.0540 — aligns with the projected upper boundary of the ascending channel over the next 1–2 days if momentum continues.
Risk-to-Reward: Entering near $0.0415 with a stop at $0.0400 and a first target of $0.04571 offers roughly a 1:2.8 risk-to-reward ratio, improving further if price extends toward $0.0500–$0.0540.
Key Levels Summary
Resistance: $0.04571 (HH) → $0.0500 → $0.0540 (channel extension)Support: $0.0412–$0.0420 (consolidation shelf) → $0.0400 (channel support, invalidation)Current Price: $0.04145
What Could Invalidate This Setup
A sharp close below $0.0400 would break both the consolidation shelf and the ascending channel, opening the door to a deeper retracement toward $0.0365–$0.0375.Repeated failures to reclaim $0.0420 combined with fading RSI momentum could signal the pullback is turning into distribution rather than a healthy pause.
Final Thoughts
JOE/USDT has shown some of the strongest relative momentum on the board, and the current tight consolidation above former resistance is a constructive sign rather than a warning. As long as the $0.0412–$0.0420 shelf and the ascending channel support hold, the path of least resistance remains toward a retest — and potential break — of the $0.04571 high. A confirmed breakdown below $0.0400, however, would flip the near-term bias and call for caution.
Disclaimer: This article is for informational and educational purposes only and does not constitute financial advice. Cryptocurrency trading, especially with leverage/perpetual futures, carries significant risk of loss. Always conduct your own research (DYOR) and consult a licensed financial advisor before making any trading decisions. It is what it is.
@Binance Square Official #QNTRises39% #EthereumBreaksAbove$2700 #BitgetBreachForgedRequestsNotStolenKeys #Binance #ChartSniper
340
·
--
Maqola
Tarjimani ko‘rish
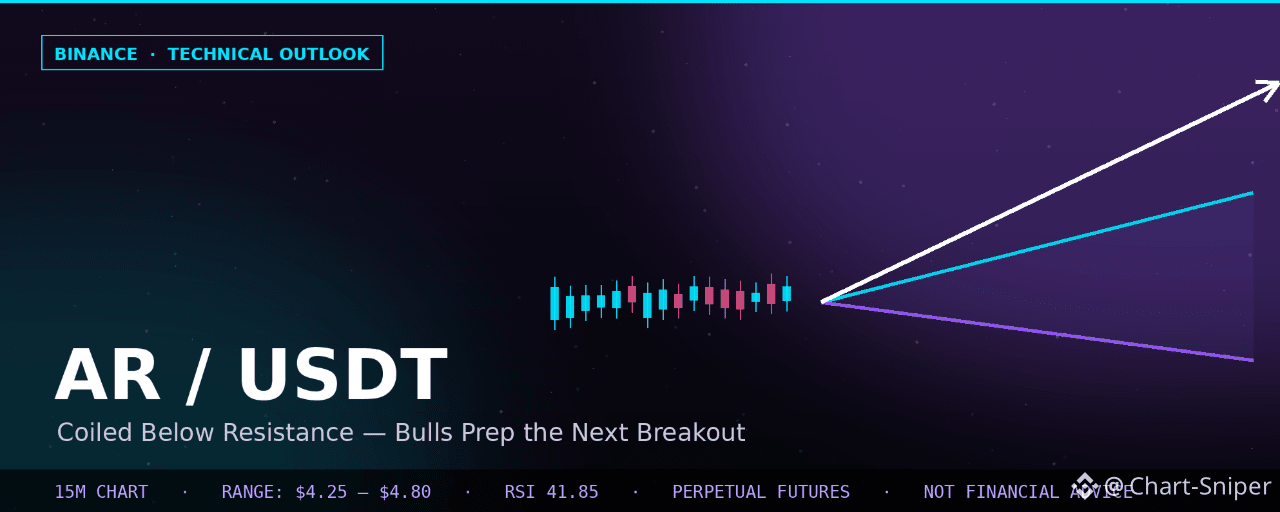
AR/USDT Coils Below Resistance: Setting Up for the Next Big Move$AR
{future}(ARUSDT)
Arweave (AR) has cooled off dramatically after its explosive run to the $5.20+ region, and price is now compressing inside a tightening range just under key resistance. The structure on the 15M chart suggests the market is building energy for its next directional decision.
Market Structure Overview
AR/USDT (Perpetual Futures, Binance, 15M timeframe) has gone through a violent expansion-and-cooldown cycle:
Price exploded from roughly $2.70 to a Higher High (HH) near $5.20–$5.30 in a near-vertical move, marking the most aggressive leg of the recent trend.After tapping the HH, the market rejected sharply, printing a Lower Low (LL) around $3.90–$4.00 as early buyers took profit and momentum cooled off.Since that LL, price has carved out a rising trendline of higher lows, while repeatedly stalling against a horizontal ceiling — forming a classic ascending, tightening range (a coiling structure) roughly between $4.25 and $4.80.Current price sits at $4.576, near the upper-middle of this range, consolidating just beneath resistance.
This kind of tightening range after a sharp expansion often precedes another volatility expansion — the key question is which direction it resolves in.
Key Levels: Fibonacci & Structure
The chart's Fibonacci retracement (drawn from the recent HH down to the swing low) frames the important zones:
0% (HH): ~$5.20 — the prior swing high and the ultimate resistance target if bulls regain control.38.2% retracement: $4.252 — this level lines up closely with the bottom of the current consolidation range, making it a strong confluence support.50% retracement: ~$4.00 — a deeper support zone and roughly where the LL was formed.61.8% retracement: ~$3.70 — the "last line of defense" for the broader bullish structure; a break below this level would suggest trend failure.
The rising trendline connecting the LL to subsequent higher lows adds further support just below current price, reinforcing the $4.25–$4.35 area as the zone bulls are likely to defend.
Momentum Check (RSI)
RSI (14) currently reads 41.85, with its moving average at 41.10 — sitting below the neutral 50 line. This tells us:
Momentum has cooled significantly since the initial breakout and is currently indecisive rather than strongly bullish or bearish.A move back above RSI 50 would be an early signal that buyers are regaining control and that the range may resolve upward.Continued RSI weakness while price holds the range could instead foreshadow a breakdown toward the 50% or 61.8% fib levels.
Given this, waiting for confirmation before entering is the more disciplined approach here rather than anticipating the breakout direction blindly.
Trade Setup: Entry, Targets & Invalidation
Bias: Neutral-to-bullish inside the range; turns decisively bullish only on confirmation above resistance, or attractive for dip-buyers on a clean retest of trendline support.
Entry Zone 1 (support retest / dip-buy):
$4.25 – $4.35, where the rising trendline, the 38.2% fib ($4.252), and the base of the consolidation range all converge. Look for a bullish rejection wick or bullish engulfing candle for confirmation.
Entry Zone 2 (breakout confirmation):
A confirmed 15M/1H close above $4.80 (top of the range) with expanding volume, targeting a retest of the prior HH near $5.20.
Stop-Loss / Invalidation:
Below $4.00 (the 50% retracement level). A decisive close under this level breaks the higher-low sequence and signals the range has failed to the downside, opening risk toward the $3.70 (61.8%) support.
Take-Profit Targets:
Target 1: $4.80 — immediate range resistance.Target 2: $5.20 — retest of the prior Higher High.Target 3 (extension): $5.60+ if the HH is reclaimed with strong volume and momentum follow-through.
Risk-to-Reward: Entering near $4.30 with a stop at $4.00 and a first target of $4.80 offers roughly a 1:1.7 risk-to-reward to Target 1, improving significantly to over 1:3 if price extends to Target 2 near $5.20.
Key Levels Summary
Resistance: $4.80 (range top) → $5.20 (HH) → $5.60 (extension)Support: $4.25–$4.35 (trendline + 38.2% fib) → $4.00 (50% fib, invalidation) → $3.70 (61.8% fib)Current Price: $4.576
What Could Invalidate This Setup
A decisive 15M/1H close below $4.00 would break the higher-low structure and shift bias toward further downside toward the $3.70 zone.Repeated rejections at $4.80 combined with RSI failing to reclaim 50 would suggest the range is more likely to break down than up.
Final Thoughts
AR/USDT is in a textbook compression phase after a sharp expansion move — tightening between a rising trendline and horizontal resistance while momentum resets. Rather than chasing price in the middle of the range, the higher-probability approach is to wait for either a clean retest of the $4.25–$4.35 support zone or a confirmed breakout above $4.80 before committing capital. Patience through this consolidation phase should reward disciplined traders once the range resolves.
Disclaimer: This article is for informational and educational purposes only and does not constitute financial advice. Cryptocurrency trading, especially with leverage/perpetual futures, carries significant risk of loss. Always conduct your own research (DYOR) and consult a licensed financial advisor before making any trading decisions. It is what it is.
@Binance_Square_Official #QNTRises39% #EthereumBreaksAbove$2700 #BitgetBreachForgedRequestsNotStolenKeys #Binance #ChartSniper
AR/USDT Coils Below Resistance: Setting Up for the Next Big Move
$AR
Arweave (AR) has cooled off dramatically after its explosive run to the $5.20+ region, and price is now compressing inside a tightening range just under key resistance. The structure on the 15M chart suggests the market is building energy for its next directional decision.
Market Structure Overview
AR/USDT (Perpetual Futures, Binance, 15M timeframe) has gone through a violent expansion-and-cooldown cycle:
Price exploded from roughly $2.70 to a Higher High (HH) near $5.20–$5.30 in a near-vertical move, marking the most aggressive leg of the recent trend.After tapping the HH, the market rejected sharply, printing a Lower Low (LL) around $3.90–$4.00 as early buyers took profit and momentum cooled off.Since that LL, price has carved out a rising trendline of higher lows, while repeatedly stalling against a horizontal ceiling — forming a classic ascending, tightening range (a coiling structure) roughly between $4.25 and $4.80.Current price sits at $4.576, near the upper-middle of this range, consolidating just beneath resistance.
This kind of tightening range after a sharp expansion often precedes another volatility expansion — the key question is which direction it resolves in.
Key Levels: Fibonacci & Structure
The chart's Fibonacci retracement (drawn from the recent HH down to the swing low) frames the important zones:
0% (HH): ~$5.20 — the prior swing high and the ultimate resistance target if bulls regain control.38.2% retracement: $4.252 — this level lines up closely with the bottom of the current consolidation range, making it a strong confluence support.50% retracement: ~$4.00 — a deeper support zone and roughly where the LL was formed.61.8% retracement: ~$3.70 — the "last line of defense" for the broader bullish structure; a break below this level would suggest trend failure.
The rising trendline connecting the LL to subsequent higher lows adds further support just below current price, reinforcing the $4.25–$4.35 area as the zone bulls are likely to defend.
Momentum Check (RSI)
RSI (14) currently reads 41.85, with its moving average at 41.10 — sitting below the neutral 50 line. This tells us:
Momentum has cooled significantly since the initial breakout and is currently indecisive rather than strongly bullish or bearish.A move back above RSI 50 would be an early signal that buyers are regaining control and that the range may resolve upward.Continued RSI weakness while price holds the range could instead foreshadow a breakdown toward the 50% or 61.8% fib levels.
Given this, waiting for confirmation before entering is the more disciplined approach here rather than anticipating the breakout direction blindly.
Trade Setup: Entry, Targets & Invalidation
Bias: Neutral-to-bullish inside the range; turns decisively bullish only on confirmation above resistance, or attractive for dip-buyers on a clean retest of trendline support.
Entry Zone 1 (support retest / dip-buy):
$4.25 – $4.35, where the rising trendline, the 38.2% fib ($4.252), and the base of the consolidation range all converge. Look for a bullish rejection wick or bullish engulfing candle for confirmation.
Entry Zone 2 (breakout confirmation):
A confirmed 15M/1H close above $4.80 (top of the range) with expanding volume, targeting a retest of the prior HH near $5.20.
Stop-Loss / Invalidation:
Below $4.00 (the 50% retracement level). A decisive close under this level breaks the higher-low sequence and signals the range has failed to the downside, opening risk toward the $3.70 (61.8%) support.
Take-Profit Targets:
Target 1: $4.80 — immediate range resistance.Target 2: $5.20 — retest of the prior Higher High.Target 3 (extension): $5.60+ if the HH is reclaimed with strong volume and momentum follow-through.
Risk-to-Reward: Entering near $4.30 with a stop at $4.00 and a first target of $4.80 offers roughly a 1:1.7 risk-to-reward to Target 1, improving significantly to over 1:3 if price extends to Target 2 near $5.20.
Key Levels Summary
Resistance: $4.80 (range top) → $5.20 (HH) → $5.60 (extension)Support: $4.25–$4.35 (trendline + 38.2% fib) → $4.00 (50% fib, invalidation) → $3.70 (61.8% fib)Current Price: $4.576
What Could Invalidate This Setup
A decisive 15M/1H close below $4.00 would break the higher-low structure and shift bias toward further downside toward the $3.70 zone.Repeated rejections at $4.80 combined with RSI failing to reclaim 50 would suggest the range is more likely to break down than up.
Final Thoughts
AR/USDT is in a textbook compression phase after a sharp expansion move — tightening between a rising trendline and horizontal resistance while momentum resets. Rather than chasing price in the middle of the range, the higher-probability approach is to wait for either a clean retest of the $4.25–$4.35 support zone or a confirmed breakout above $4.80 before committing capital. Patience through this consolidation phase should reward disciplined traders once the range resolves.
Disclaimer: This article is for informational and educational purposes only and does not constitute financial advice. Cryptocurrency trading, especially with leverage/perpetual futures, carries significant risk of loss. Always conduct your own research (DYOR) and consult a licensed financial advisor before making any trading decisions. It is what it is.
@Binance Square Official #QNTRises39% #EthereumBreaksAbove$2700 #BitgetBreachForgedRequestsNotStolenKeys #Binance #ChartSniper
Arweave (AR) has cooled off dramatically after its explosive run to the $5.20+ region, and price is now compressing inside a tightening range just under key resistance. The structure on the 15M chart suggests the market is building energy for its next directional decision.
Market Structure Overview
AR/USDT (Perpetual Futures, Binance, 15M timeframe) has gone through a violent expansion-and-cooldown cycle:
Price exploded from roughly $2.70 to a Higher High (HH) near $5.20–$5.30 in a near-vertical move, marking the most aggressive leg of the recent trend.After tapping the HH, the market rejected sharply, printing a Lower Low (LL) around $3.90–$4.00 as early buyers took profit and momentum cooled off.Since that LL, price has carved out a rising trendline of higher lows, while repeatedly stalling against a horizontal ceiling — forming a classic ascending, tightening range (a coiling structure) roughly between $4.25 and $4.80.Current price sits at $4.576, near the upper-middle of this range, consolidating just beneath resistance.
This kind of tightening range after a sharp expansion often precedes another volatility expansion — the key question is which direction it resolves in.
Key Levels: Fibonacci & Structure
The chart's Fibonacci retracement (drawn from the recent HH down to the swing low) frames the important zones:
0% (HH): ~$5.20 — the prior swing high and the ultimate resistance target if bulls regain control.38.2% retracement: $4.252 — this level lines up closely with the bottom of the current consolidation range, making it a strong confluence support.50% retracement: ~$4.00 — a deeper support zone and roughly where the LL was formed.61.8% retracement: ~$3.70 — the "last line of defense" for the broader bullish structure; a break below this level would suggest trend failure.
The rising trendline connecting the LL to subsequent higher lows adds further support just below current price, reinforcing the $4.25–$4.35 area as the zone bulls are likely to defend.
Momentum Check (RSI)
RSI (14) currently reads 41.85, with its moving average at 41.10 — sitting below the neutral 50 line. This tells us:
Momentum has cooled significantly since the initial breakout and is currently indecisive rather than strongly bullish or bearish.A move back above RSI 50 would be an early signal that buyers are regaining control and that the range may resolve upward.Continued RSI weakness while price holds the range could instead foreshadow a breakdown toward the 50% or 61.8% fib levels.
Given this, waiting for confirmation before entering is the more disciplined approach here rather than anticipating the breakout direction blindly.
Trade Setup: Entry, Targets & Invalidation
Bias: Neutral-to-bullish inside the range; turns decisively bullish only on confirmation above resistance, or attractive for dip-buyers on a clean retest of trendline support.
Entry Zone 1 (support retest / dip-buy):
$4.25 – $4.35, where the rising trendline, the 38.2% fib ($4.252), and the base of the consolidation range all converge. Look for a bullish rejection wick or bullish engulfing candle for confirmation.
Entry Zone 2 (breakout confirmation):
A confirmed 15M/1H close above $4.80 (top of the range) with expanding volume, targeting a retest of the prior HH near $5.20.
Stop-Loss / Invalidation:
Below $4.00 (the 50% retracement level). A decisive close under this level breaks the higher-low sequence and signals the range has failed to the downside, opening risk toward the $3.70 (61.8%) support.
Take-Profit Targets:
Target 1: $4.80 — immediate range resistance.Target 2: $5.20 — retest of the prior Higher High.Target 3 (extension): $5.60+ if the HH is reclaimed with strong volume and momentum follow-through.
Risk-to-Reward: Entering near $4.30 with a stop at $4.00 and a first target of $4.80 offers roughly a 1:1.7 risk-to-reward to Target 1, improving significantly to over 1:3 if price extends to Target 2 near $5.20.
Key Levels Summary
Resistance: $4.80 (range top) → $5.20 (HH) → $5.60 (extension)Support: $4.25–$4.35 (trendline + 38.2% fib) → $4.00 (50% fib, invalidation) → $3.70 (61.8% fib)Current Price: $4.576
What Could Invalidate This Setup
A decisive 15M/1H close below $4.00 would break the higher-low structure and shift bias toward further downside toward the $3.70 zone.Repeated rejections at $4.80 combined with RSI failing to reclaim 50 would suggest the range is more likely to break down than up.
Final Thoughts
AR/USDT is in a textbook compression phase after a sharp expansion move — tightening between a rising trendline and horizontal resistance while momentum resets. Rather than chasing price in the middle of the range, the higher-probability approach is to wait for either a clean retest of the $4.25–$4.35 support zone or a confirmed breakout above $4.80 before committing capital. Patience through this consolidation phase should reward disciplined traders once the range resolves.
Disclaimer: This article is for informational and educational purposes only and does not constitute financial advice. Cryptocurrency trading, especially with leverage/perpetual futures, carries significant risk of loss. Always conduct your own research (DYOR) and consult a licensed financial advisor before making any trading decisions. It is what it is.
@Binance Square Official #QNTRises39% #EthereumBreaksAbove$2700 #BitgetBreachForgedRequestsNotStolenKeys #Binance #ChartSniper
1
614
·
--
Maqola
Tarjimani ko‘rish
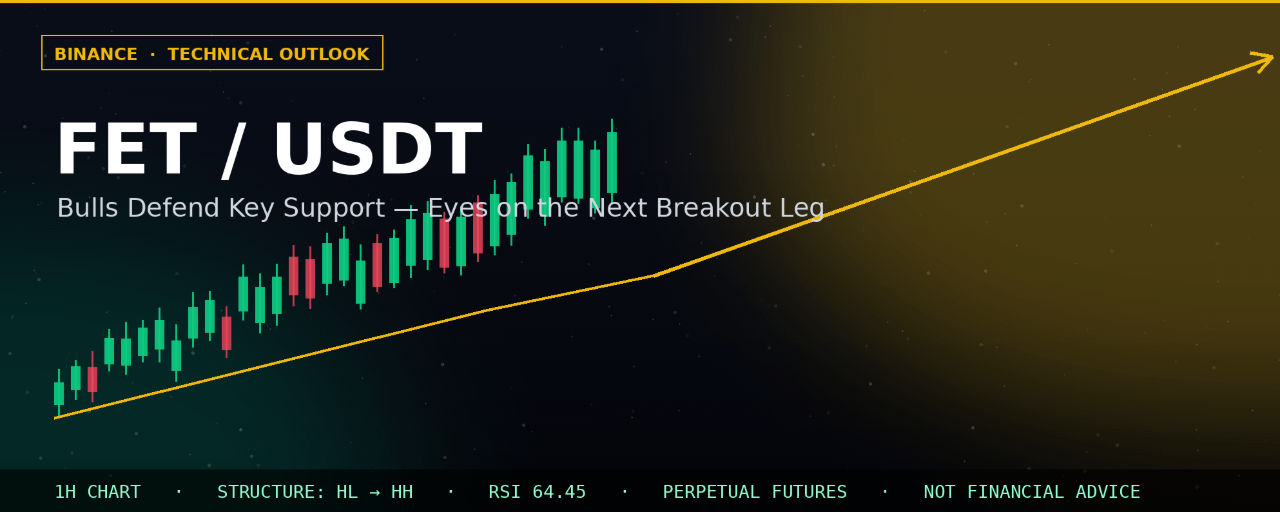
FET/USDT Eyes a Breakout: Bulls Defend Key Support Above $0.22$FET
{future}(FETUSDT)
Fetch.ai (FET) is holding the higher-timeframe trend structure intact after tagging a fresh Higher High near $0.2405. Price is now cooling off into a well-defined support shelf, and the setup on the 1H chart is shaping into a classic pullback-before-continuation pattern.
Market Structure Overview
FET/USDT (Perpetual Futures, Binance, 1H timeframe) has completed a clean shift in trend structure:
Earlier price action printed a sequence of Lower Lows (LL) and Lower Highs (LH), confirming the prior downtrend from the $0.30 region down toward the $0.145 base.Around the $0.145–$0.155 zone, buyers stepped in decisively, breaking the downtrend structure and initiating a new ascending channel.The rally accelerated sharply after reclaiming the $0.20 handle, culminating in a Higher High (HH) near $0.2405 — the strongest signal yet that momentum has flipped in favor of the bulls.Price is currently trading at $0.2383, consolidating just beneath that HH after a mild -0.33% pullback.
This is textbook trend-reversal behavior: LL → LH → LL → LH → HH. As long as price respects the rising trendline and the support shelf below, the structure favors continuation to the upside.
The Key Zone to Watch
The chart highlights a critical support/demand shelf between $0.2200 and $0.2271. This zone matters for two reasons:
It was the prior resistance area before the breakout to the HH, meaning it should now act as support (a classic "resistance-turned-support" flip).It sits directly on top of the rising trendline that has guided this entire move since the $0.145 low, giving the zone extra confluence.
Below that, a secondary support line near $0.2170 marks the point where the broader bullish structure would be invalidated if lost with strength.
Momentum Check (RSI)
The RSI (14) is currently reading 64.45, with its moving average at 70.79. Momentum is bullish but not yet in extreme overbought territory, which leaves room for either:
A shallow retracement into the support shelf to "reset" momentum before the next leg, orA direct continuation if buyers refuse to let price drop back into the shelf at all.
Either scenario keeps the broader bullish bias intact unless support fails.
Trade Setup: Entry, Targets & Invalidation
Bias: Bullish continuation, contingent on the $0.2200–$0.2271 shelf holding.
Entry Zone (preferred, retest-based):
$0.2200 – $0.2271 on a pullback into the support shelf, ideally with a bullish rejection candle (long lower wick / bullish engulfing) confirming buyers are defending the level.
Alternative Entry (breakout-based, more aggressive):
A confirmed 1H close above $0.2405 (the current HH) with rising volume, adding exposure on a retest of that level as new support.
Stop-Loss / Invalidation:
Below $0.2170, under the secondary support line. A decisive close below this level would break the ascending structure and invalidate the bullish thesis.
Take-Profit Targets:
Target 1: $0.2600 — first measured resistance extension.Target 2: $0.2800 — aligns with the projected continuation move shown by the chart's trend extension, and a natural round-number liquidity zone.
Risk-to-Reward: Using the $0.2271 entry with a $0.2170 stop and a $0.2800 target, the setup offers roughly a 1:5 risk-to-reward ratio — favorable enough to justify a modest position size even with a tight stop.
Key Levels Summary
Resistance: $0.2405 (HH) → $0.2600 → $0.2800Support: $0.2271 → $0.2200 → $0.2170 (invalidation)Current Price: $0.2383
What Could Invalidate This Setup
A sharp 1H close below $0.2170 would break the ascending trendline and shift structure back toward neutral/bearish, favoring a deeper retracement toward $0.20 or lower.A failure to reclaim $0.2405 after multiple attempts, combined with fading RSI, could signal exhaustion rather than continuation.
Final Thoughts
FET/USDT is showing one of the cleaner trend-reversal structures on the board right now — a full transition from lower lows to higher highs, backed by a defended support shelf and momentum that still has room to run before overbought conditions kick in. Patient traders may prefer to wait for a retest of the $0.22 zone before entering, while momentum traders can track a breakout-and-retest of $0.2405 instead.
Disclaimer: This article is for informational and educational purposes only and does not constitute financial advice. Cryptocurrency trading, especially with leverage/perpetual futures, carries significant risk of loss. Always conduct your own research (DYOR) and consult a licensed financial advisor before making any trading decisions. It is what it is.
FET/USDT Eyes a Breakout: Bulls Defend Key Support Above $0.22
$FET
Fetch.ai (FET) is holding the higher-timeframe trend structure intact after tagging a fresh Higher High near $0.2405. Price is now cooling off into a well-defined support shelf, and the setup on the 1H chart is shaping into a classic pullback-before-continuation pattern.
Market Structure Overview
FET/USDT (Perpetual Futures, Binance, 1H timeframe) has completed a clean shift in trend structure:
Earlier price action printed a sequence of Lower Lows (LL) and Lower Highs (LH), confirming the prior downtrend from the $0.30 region down toward the $0.145 base.Around the $0.145–$0.155 zone, buyers stepped in decisively, breaking the downtrend structure and initiating a new ascending channel.The rally accelerated sharply after reclaiming the $0.20 handle, culminating in a Higher High (HH) near $0.2405 — the strongest signal yet that momentum has flipped in favor of the bulls.Price is currently trading at $0.2383, consolidating just beneath that HH after a mild -0.33% pullback.
This is textbook trend-reversal behavior: LL → LH → LL → LH → HH. As long as price respects the rising trendline and the support shelf below, the structure favors continuation to the upside.
The Key Zone to Watch
The chart highlights a critical support/demand shelf between $0.2200 and $0.2271. This zone matters for two reasons:
It was the prior resistance area before the breakout to the HH, meaning it should now act as support (a classic "resistance-turned-support" flip).It sits directly on top of the rising trendline that has guided this entire move since the $0.145 low, giving the zone extra confluence.
Below that, a secondary support line near $0.2170 marks the point where the broader bullish structure would be invalidated if lost with strength.
Momentum Check (RSI)
The RSI (14) is currently reading 64.45, with its moving average at 70.79. Momentum is bullish but not yet in extreme overbought territory, which leaves room for either:
A shallow retracement into the support shelf to "reset" momentum before the next leg, orA direct continuation if buyers refuse to let price drop back into the shelf at all.
Either scenario keeps the broader bullish bias intact unless support fails.
Trade Setup: Entry, Targets & Invalidation
Bias: Bullish continuation, contingent on the $0.2200–$0.2271 shelf holding.
Entry Zone (preferred, retest-based):
$0.2200 – $0.2271 on a pullback into the support shelf, ideally with a bullish rejection candle (long lower wick / bullish engulfing) confirming buyers are defending the level.
Alternative Entry (breakout-based, more aggressive):
A confirmed 1H close above $0.2405 (the current HH) with rising volume, adding exposure on a retest of that level as new support.
Stop-Loss / Invalidation:
Below $0.2170, under the secondary support line. A decisive close below this level would break the ascending structure and invalidate the bullish thesis.
Take-Profit Targets:
Target 1: $0.2600 — first measured resistance extension.Target 2: $0.2800 — aligns with the projected continuation move shown by the chart's trend extension, and a natural round-number liquidity zone.
Risk-to-Reward: Using the $0.2271 entry with a $0.2170 stop and a $0.2800 target, the setup offers roughly a 1:5 risk-to-reward ratio — favorable enough to justify a modest position size even with a tight stop.
Key Levels Summary
Resistance: $0.2405 (HH) → $0.2600 → $0.2800Support: $0.2271 → $0.2200 → $0.2170 (invalidation)Current Price: $0.2383
What Could Invalidate This Setup
A sharp 1H close below $0.2170 would break the ascending trendline and shift structure back toward neutral/bearish, favoring a deeper retracement toward $0.20 or lower.A failure to reclaim $0.2405 after multiple attempts, combined with fading RSI, could signal exhaustion rather than continuation.
Final Thoughts
FET/USDT is showing one of the cleaner trend-reversal structures on the board right now — a full transition from lower lows to higher highs, backed by a defended support shelf and momentum that still has room to run before overbought conditions kick in. Patient traders may prefer to wait for a retest of the $0.22 zone before entering, while momentum traders can track a breakout-and-retest of $0.2405 instead.
Disclaimer: This article is for informational and educational purposes only and does not constitute financial advice. Cryptocurrency trading, especially with leverage/perpetual futures, carries significant risk of loss. Always conduct your own research (DYOR) and consult a licensed financial advisor before making any trading decisions. It is what it is.
Fetch.ai (FET) is holding the higher-timeframe trend structure intact after tagging a fresh Higher High near $0.2405. Price is now cooling off into a well-defined support shelf, and the setup on the 1H chart is shaping into a classic pullback-before-continuation pattern.
Market Structure Overview
FET/USDT (Perpetual Futures, Binance, 1H timeframe) has completed a clean shift in trend structure:
Earlier price action printed a sequence of Lower Lows (LL) and Lower Highs (LH), confirming the prior downtrend from the $0.30 region down toward the $0.145 base.Around the $0.145–$0.155 zone, buyers stepped in decisively, breaking the downtrend structure and initiating a new ascending channel.The rally accelerated sharply after reclaiming the $0.20 handle, culminating in a Higher High (HH) near $0.2405 — the strongest signal yet that momentum has flipped in favor of the bulls.Price is currently trading at $0.2383, consolidating just beneath that HH after a mild -0.33% pullback.
This is textbook trend-reversal behavior: LL → LH → LL → LH → HH. As long as price respects the rising trendline and the support shelf below, the structure favors continuation to the upside.
The Key Zone to Watch
The chart highlights a critical support/demand shelf between $0.2200 and $0.2271. This zone matters for two reasons:
It was the prior resistance area before the breakout to the HH, meaning it should now act as support (a classic "resistance-turned-support" flip).It sits directly on top of the rising trendline that has guided this entire move since the $0.145 low, giving the zone extra confluence.
Below that, a secondary support line near $0.2170 marks the point where the broader bullish structure would be invalidated if lost with strength.
Momentum Check (RSI)
The RSI (14) is currently reading 64.45, with its moving average at 70.79. Momentum is bullish but not yet in extreme overbought territory, which leaves room for either:
A shallow retracement into the support shelf to "reset" momentum before the next leg, orA direct continuation if buyers refuse to let price drop back into the shelf at all.
Either scenario keeps the broader bullish bias intact unless support fails.
Trade Setup: Entry, Targets & Invalidation
Bias: Bullish continuation, contingent on the $0.2200–$0.2271 shelf holding.
Entry Zone (preferred, retest-based):
$0.2200 – $0.2271 on a pullback into the support shelf, ideally with a bullish rejection candle (long lower wick / bullish engulfing) confirming buyers are defending the level.
Alternative Entry (breakout-based, more aggressive):
A confirmed 1H close above $0.2405 (the current HH) with rising volume, adding exposure on a retest of that level as new support.
Stop-Loss / Invalidation:
Below $0.2170, under the secondary support line. A decisive close below this level would break the ascending structure and invalidate the bullish thesis.
Take-Profit Targets:
Target 1: $0.2600 — first measured resistance extension.Target 2: $0.2800 — aligns with the projected continuation move shown by the chart's trend extension, and a natural round-number liquidity zone.
Risk-to-Reward: Using the $0.2271 entry with a $0.2170 stop and a $0.2800 target, the setup offers roughly a 1:5 risk-to-reward ratio — favorable enough to justify a modest position size even with a tight stop.
Key Levels Summary
Resistance: $0.2405 (HH) → $0.2600 → $0.2800Support: $0.2271 → $0.2200 → $0.2170 (invalidation)Current Price: $0.2383
What Could Invalidate This Setup
A sharp 1H close below $0.2170 would break the ascending trendline and shift structure back toward neutral/bearish, favoring a deeper retracement toward $0.20 or lower.A failure to reclaim $0.2405 after multiple attempts, combined with fading RSI, could signal exhaustion rather than continuation.
Final Thoughts
FET/USDT is showing one of the cleaner trend-reversal structures on the board right now — a full transition from lower lows to higher highs, backed by a defended support shelf and momentum that still has room to run before overbought conditions kick in. Patient traders may prefer to wait for a retest of the $0.22 zone before entering, while momentum traders can track a breakout-and-retest of $0.2405 instead.
Disclaimer: This article is for informational and educational purposes only and does not constitute financial advice. Cryptocurrency trading, especially with leverage/perpetual futures, carries significant risk of loss. Always conduct your own research (DYOR) and consult a licensed financial advisor before making any trading decisions. It is what it is.
1
294
·
--
Pasayuvchi
Sarlavha: ONE Qisqa tayyorgarlik 🔻
$ONE USDT (Perp) – Ayiqcha
{future}(ONEUSDT)
Kirish: 0.0029–0.0030
TP: 0.0025 / 0.0023
SL: 0.0031
Kuchayib borayotgan pasayish kanali + LH/LL. Qayta sinovni kuting.
⚠️ Moliyaviy maslahat emas. O‘zingiz tekshiring (DYOR).
Darajalar bo‘yicha eslatmalar (chartingizdan):
Kirish zonasi: 0.00285–0.00302 dagi taklif (supply) qutisi, narx tushishdan oldin qayta sinab ko‘rishi mumkin, siz ko‘rsatgan qizil strelkalar shuni bildiradi. TP1 (0.0025): pastki kanal chizig‘i. TP2 (0.0023): kanal buzilsa keyingi tayanch hududi. SL (0.0031): taklif zonasi va kanal tepasidan biroz yuqorida.
@Binance_Square_Official #AIStocksWhatNext #BitcoinRejectedAt$87,300Twice #BCHJumps28%OnCMEFuturesListing #Binance #ChartSniper
Sarlavha: ONE Qisqa tayyorgarlik 🔻
$ONE USDT (Perp) – Ayiqcha
Kirish: 0.0029–0.0030
TP: 0.0025 / 0.0023
SL: 0.0031
Kuchayib borayotgan pasayish kanali + LH/LL. Qayta sinovni kuting.
⚠️ Moliyaviy maslahat emas. O‘zingiz tekshiring (DYOR).
Darajalar bo‘yicha eslatmalar (chartingizdan):
Kirish zonasi: 0.00285–0.00302 dagi taklif (supply) qutisi, narx tushishdan oldin qayta sinab ko‘rishi mumkin, siz ko‘rsatgan qizil strelkalar shuni bildiradi. TP1 (0.0025): pastki kanal chizig‘i. TP2 (0.0023): kanal buzilsa keyingi tayanch hududi. SL (0.0031): taklif zonasi va kanal tepasidan biroz yuqorida.
@Binance Square Official #AIStocksWhatNext #BitcoinRejectedAt$87,300Twice #BCHJumps28%OnCMEFuturesListing #Binance #ChartSniper
$ONE USDT (Perp) – Ayiqcha
Kirish: 0.0029–0.0030
TP: 0.0025 / 0.0023
SL: 0.0031
Kuchayib borayotgan pasayish kanali + LH/LL. Qayta sinovni kuting.
⚠️ Moliyaviy maslahat emas. O‘zingiz tekshiring (DYOR).
Darajalar bo‘yicha eslatmalar (chartingizdan):
Kirish zonasi: 0.00285–0.00302 dagi taklif (supply) qutisi, narx tushishdan oldin qayta sinab ko‘rishi mumkin, siz ko‘rsatgan qizil strelkalar shuni bildiradi. TP1 (0.0025): pastki kanal chizig‘i. TP2 (0.0023): kanal buzilsa keyingi tayanch hududi. SL (0.0031): taklif zonasi va kanal tepasidan biroz yuqorida.
@Binance Square Official #AIStocksWhatNext #BitcoinRejectedAt$87,300Twice #BCHJumps28%OnCMEFuturesListing #Binance #ChartSniper
437
·
--
Maqola
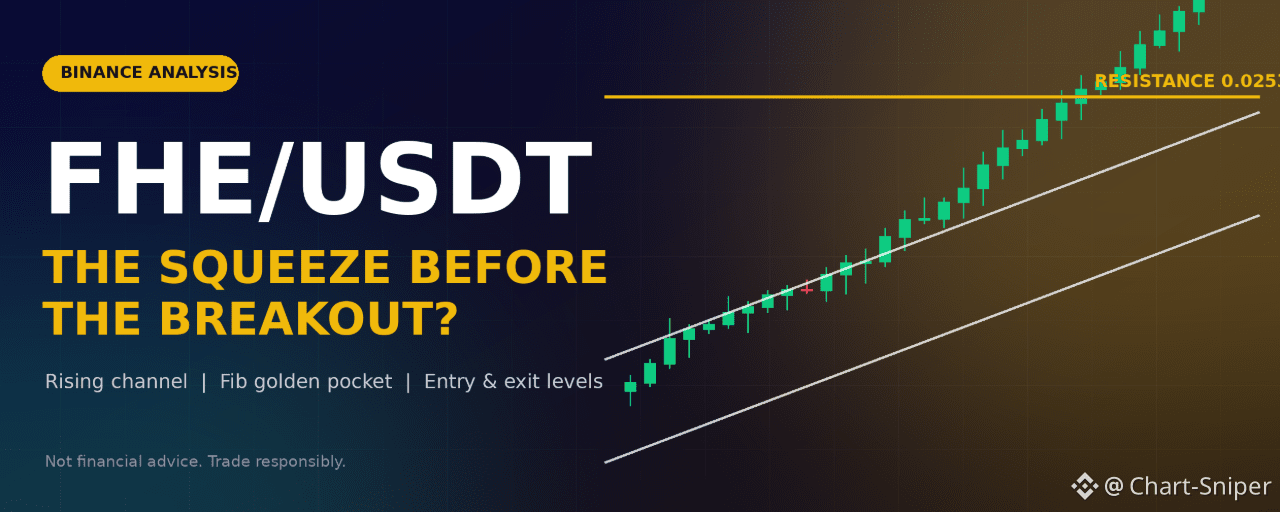
FHE/USDT: Narx O‘suvchi Kanallar Ichida Siqilmoqda va $0.0254 Shiftasi Keyingi Katta Harakatni Hal Qiladi$FHE
Bozor ko‘rinishi
FHE/USDT 0.02393 atrofida savdo qilmoqda. Bu davrda o‘tgan juda notinch sessiya narxni keskin 0.0253 gacha ko‘tarib, so‘ng teng darajada kuchli tushish bilan taxminan 0.0219 gacha olib bordi — shundan keyin xaridorlar qaytib kirishdi. Shov-shuvga qaramay, katta manzara ijobiy: 16-sentabr kuni taxminan 0.0193 atrofida bo‘lgan tebranish pastidan beri narx toza, o‘suvchi (ascending) kanal ichida ko‘tarilmoqda, ketma-ket yuqoriroq cho‘qqilar va yuqoriroq minimalar shakllanmoqda.
Hozir narx deyarli aynan 0.02406 gorizontal darajasida joylashgan — avvalgi ko‘tarilish to‘xtab qolgan nuqta va xaridorlar bilan sotuvchilar nazorat uchun kurashayotgan joy.
FHE/USDT: Narx O‘suvchi Kanallar Ichida Siqilmoqda va $0.0254 Shiftasi Keyingi Katta Harakatni Hal Qiladi
$FHE
Bozor ko‘rinishi
FHE/USDT 0.02393 atrofida savdo qilmoqda. Bu davrda o‘tgan juda notinch sessiya narxni keskin 0.0253 gacha ko‘tarib, so‘ng teng darajada kuchli tushish bilan taxminan 0.0219 gacha olib bordi — shundan keyin xaridorlar qaytib kirishdi. Shov-shuvga qaramay, katta manzara ijobiy: 16-sentabr kuni taxminan 0.0193 atrofida bo‘lgan tebranish pastidan beri narx toza, o‘suvchi (ascending) kanal ichida ko‘tarilmoqda, ketma-ket yuqoriroq cho‘qqilar va yuqoriroq minimalar shakllanmoqda.
Hozir narx deyarli aynan 0.02406 gorizontal darajasida joylashgan — avvalgi ko‘tarilish to‘xtab qolgan nuqta va xaridorlar bilan sotuvchilar nazorat uchun kurashayotgan joy.
Bozor ko‘rinishi
FHE/USDT 0.02393 atrofida savdo qilmoqda. Bu davrda o‘tgan juda notinch sessiya narxni keskin 0.0253 gacha ko‘tarib, so‘ng teng darajada kuchli tushish bilan taxminan 0.0219 gacha olib bordi — shundan keyin xaridorlar qaytib kirishdi. Shov-shuvga qaramay, katta manzara ijobiy: 16-sentabr kuni taxminan 0.0193 atrofida bo‘lgan tebranish pastidan beri narx toza, o‘suvchi (ascending) kanal ichida ko‘tarilmoqda, ketma-ket yuqoriroq cho‘qqilar va yuqoriroq minimalar shakllanmoqda.
Hozir narx deyarli aynan 0.02406 gorizontal darajasida joylashgan — avvalgi ko‘tarilish to‘xtab qolgan nuqta va xaridorlar bilan sotuvchilar nazorat uchun kurashayotgan joy.
319
·
--
Maqola
ENA/USDT: Bullar Trendline’da Yig‘ilmoqda — $0.31 Keyingi Manzilmi?$FHE
Ethena’ning ENA-si sentabrning ikkinchi yarmida keyingi bosqichidan oldin kuchli uptrendlar aynan shunday qiladigan ishni bajaryapti: pasaymasdan, faqat soviyapti. 9-sentabr o‘rtalaridagi pastliklardan keskin impulsiv yugurishdan keyin hozir ENA/USDT yaqinda erishilgan yuqoriroq qiymatidan sal pastroqda konsolidatsiyalanmoqda va 1H chart’dagi struktura tuzilishi pullback’ning ko‘pi bilan tugashiga yaqinroq ekanini ko‘rsatadi.
Strukturani o‘qish
Binance’dagi 1H ENA/USDT doimiy (perpetual) chart’da 15–16-sentabr oralig‘idagi 0.145 atrofidagi asosdan boshlab 0.190 gacha va keyin 0.2259 tebranish cho‘qqisiga qadar cho‘zilgan tipik yuqori-past → past- yuqori → yuqori-yuqori ketma-ketlik ko‘rinadi. Bu texnik ta’riflarning har qandayiga ko‘ra aniq ko‘tarilish trendi — har bir qaytish undan oldingi ko‘tarilishdan ham sayozroq bo‘lgan va xaridorlar oldingi tebranish pastligidan oldin doimiy ravishda qaytib kirib kelgan.
ENA/USDT: Bullar Trendline’da Yig‘ilmoqda — $0.31 Keyingi Manzilmi?
$FHE
Ethena’ning ENA-si sentabrning ikkinchi yarmida keyingi bosqichidan oldin kuchli uptrendlar aynan shunday qiladigan ishni bajaryapti: pasaymasdan, faqat soviyapti. 9-sentabr o‘rtalaridagi pastliklardan keskin impulsiv yugurishdan keyin hozir ENA/USDT yaqinda erishilgan yuqoriroq qiymatidan sal pastroqda konsolidatsiyalanmoqda va 1H chart’dagi struktura tuzilishi pullback’ning ko‘pi bilan tugashiga yaqinroq ekanini ko‘rsatadi.
Strukturani o‘qish
Binance’dagi 1H ENA/USDT doimiy (perpetual) chart’da 15–16-sentabr oralig‘idagi 0.145 atrofidagi asosdan boshlab 0.190 gacha va keyin 0.2259 tebranish cho‘qqisiga qadar cho‘zilgan tipik yuqori-past → past- yuqori → yuqori-yuqori ketma-ketlik ko‘rinadi. Bu texnik ta’riflarning har qandayiga ko‘ra aniq ko‘tarilish trendi — har bir qaytish undan oldingi ko‘tarilishdan ham sayozroq bo‘lgan va xaridorlar oldingi tebranish pastligidan oldin doimiy ravishda qaytib kirib kelgan.
Ethena’ning ENA-si sentabrning ikkinchi yarmida keyingi bosqichidan oldin kuchli uptrendlar aynan shunday qiladigan ishni bajaryapti: pasaymasdan, faqat soviyapti. 9-sentabr o‘rtalaridagi pastliklardan keskin impulsiv yugurishdan keyin hozir ENA/USDT yaqinda erishilgan yuqoriroq qiymatidan sal pastroqda konsolidatsiyalanmoqda va 1H chart’dagi struktura tuzilishi pullback’ning ko‘pi bilan tugashiga yaqinroq ekanini ko‘rsatadi.
Strukturani o‘qish
Binance’dagi 1H ENA/USDT doimiy (perpetual) chart’da 15–16-sentabr oralig‘idagi 0.145 atrofidagi asosdan boshlab 0.190 gacha va keyin 0.2259 tebranish cho‘qqisiga qadar cho‘zilgan tipik yuqori-past → past- yuqori → yuqori-yuqori ketma-ketlik ko‘rinadi. Bu texnik ta’riflarning har qandayiga ko‘ra aniq ko‘tarilish trendi — har bir qaytish undan oldingi ko‘tarilishdan ham sayozroq bo‘lgan va xaridorlar oldingi tebranish pastligidan oldin doimiy ravishda qaytib kirib kelgan.
334
·
--
Maqola
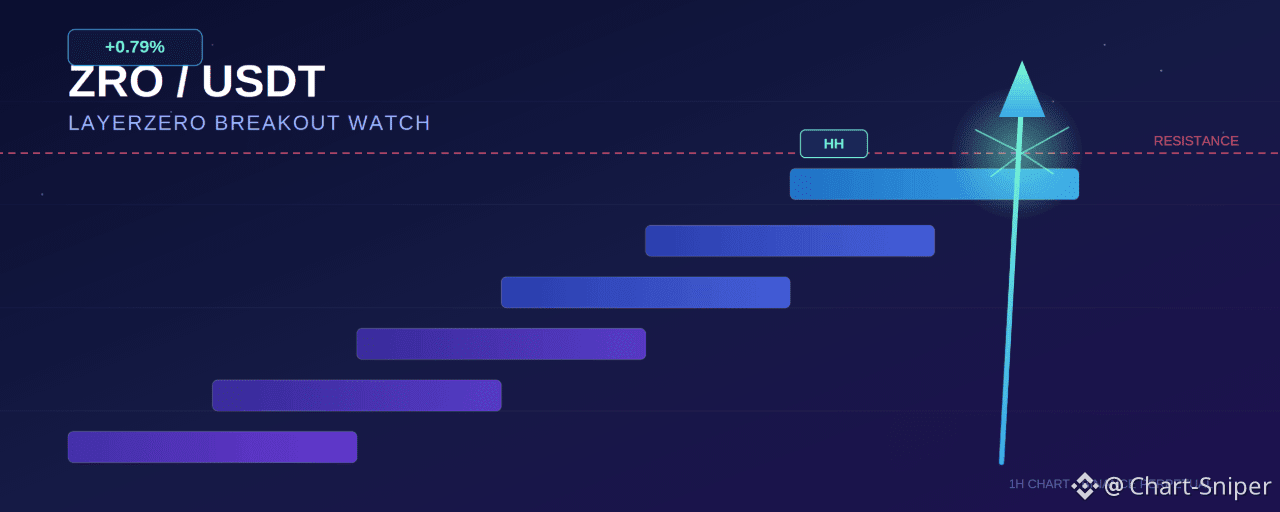
ZRO/USDT Breakout kuzatuvi: Bulllar yangi Higher High’ga portladi — $1.70 keyingimi?$ZRO
LayerZero (ZRO/USDT Perpetual) — 1H diagram, Binance
LayerZero’ning native tokeni haftalardan beri qilmagan ishni qildi: u aniq Higher High (Yuqori Yuqori) chop etdi va bu ko‘p haftalik pasayish tendensiyasi to‘liq bullish (o‘sish) bozor strukturasi tomon o‘zgarganini tasdiqladi. Sentyabr o‘rtalarida $0.93–$1.05 zonasida bazalashdan keyin ZRO klassik reversiya (teskari aylanish) namoyish qildi — va endi chart bitta savolni berayapti: bu rally (ko‘tarilish) yana bir bosqichga ega, yo qarshilikda pauzaga ketadimi?
Strukturani o‘qish
1H diagramma hammasini aniq ko‘rsatib turibdi. Narx $1.02 atrofida Lower Low (Quyi Past) ni shakllantirdi, so‘ng $0.95 yaqinida Higher Low (Yuqori Past) bilan pastga tayandi va nihoyatda intizom bilan ushlab kelayotgan ko‘tariluvchi kanalni qurdi. Yo‘l davomida u $1.20 atrofida Lower High (Quyi Yuqori) ni belgiladi, keyin esa $1.05 atrofida Lower Low bilan shakeout (chayqalish) bo‘lib, kechikkan sotuvchilarni yuvib yubordi — haqiqiy harakat oldidan klassik “spring” (sakrash).
ZRO/USDT Breakout kuzatuvi: Bulllar yangi Higher High’ga portladi — $1.70 keyingimi?
$ZRO
LayerZero (ZRO/USDT Perpetual) — 1H diagram, Binance
LayerZero’ning native tokeni haftalardan beri qilmagan ishni qildi: u aniq Higher High (Yuqori Yuqori) chop etdi va bu ko‘p haftalik pasayish tendensiyasi to‘liq bullish (o‘sish) bozor strukturasi tomon o‘zgarganini tasdiqladi. Sentyabr o‘rtalarida $0.93–$1.05 zonasida bazalashdan keyin ZRO klassik reversiya (teskari aylanish) namoyish qildi — va endi chart bitta savolni berayapti: bu rally (ko‘tarilish) yana bir bosqichga ega, yo qarshilikda pauzaga ketadimi?
Strukturani o‘qish
1H diagramma hammasini aniq ko‘rsatib turibdi. Narx $1.02 atrofida Lower Low (Quyi Past) ni shakllantirdi, so‘ng $0.95 yaqinida Higher Low (Yuqori Past) bilan pastga tayandi va nihoyatda intizom bilan ushlab kelayotgan ko‘tariluvchi kanalni qurdi. Yo‘l davomida u $1.20 atrofida Lower High (Quyi Yuqori) ni belgiladi, keyin esa $1.05 atrofida Lower Low bilan shakeout (chayqalish) bo‘lib, kechikkan sotuvchilarni yuvib yubordi — haqiqiy harakat oldidan klassik “spring” (sakrash).
LayerZero (ZRO/USDT Perpetual) — 1H diagram, Binance
LayerZero’ning native tokeni haftalardan beri qilmagan ishni qildi: u aniq Higher High (Yuqori Yuqori) chop etdi va bu ko‘p haftalik pasayish tendensiyasi to‘liq bullish (o‘sish) bozor strukturasi tomon o‘zgarganini tasdiqladi. Sentyabr o‘rtalarida $0.93–$1.05 zonasida bazalashdan keyin ZRO klassik reversiya (teskari aylanish) namoyish qildi — va endi chart bitta savolni berayapti: bu rally (ko‘tarilish) yana bir bosqichga ega, yo qarshilikda pauzaga ketadimi?
Strukturani o‘qish
1H diagramma hammasini aniq ko‘rsatib turibdi. Narx $1.02 atrofida Lower Low (Quyi Past) ni shakllantirdi, so‘ng $0.95 yaqinida Higher Low (Yuqori Past) bilan pastga tayandi va nihoyatda intizom bilan ushlab kelayotgan ko‘tariluvchi kanalni qurdi. Yo‘l davomida u $1.20 atrofida Lower High (Quyi Yuqori) ni belgiladi, keyin esa $1.05 atrofida Lower Low bilan shakeout (chayqalish) bo‘lib, kechikkan sotuvchilarni yuvib yubordi — haqiqiy harakat oldidan klassik “spring” (sakrash).
140
·
--
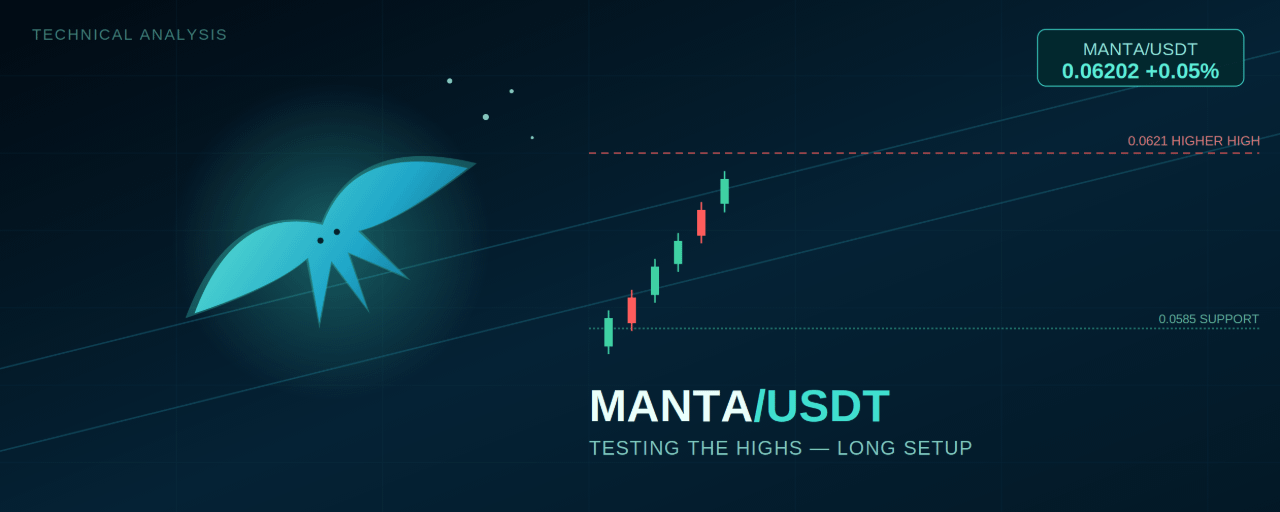
Maqola
MANTA/USDT: Nuqsonsiz ko‘tariluvchi kanal yugurishidan keyin yuqorilarni sinovdan o‘tkazish$MANTA
Manta Network taxtada yanada intizomli uptrend-lardan birini asta-sekin yig‘ib bormoqda — yuqoriroq pastliklar va yuqoriroq yuqoriliklarning barqaror o‘sishi, barchasi bitta ko‘tariluvchi kanal ichiga aniq joylashgan. Endi narx yaqinda shakllangan eng yuqori ko‘rsatkich tomon yana itarilmoqda, shuning uchun ssenariy uzoq pozitsiya tarafdorlari uchun klassik breakout-retest (yorib chiqish — qayta test) imkoniyatiga aylanib boryapti.
Strukturani o‘qish
Harakat 0.0552 atrofidagi Higher Low (yuqoriroq pastlik)dan boshlangan va shundan beri darslikdagidek davom etib kelmoqda — 0.0578 atrofida Lower High (quyiroq yuqorilik), 0.0592 atrofida ikkinchi Lower High va nihoyat 0.0621 da Higher High. Ushbu o‘sishning har bir bosqichi yaxshi belgilangan ko‘tariluvchi kanal ichida saqlanib, narx uning ostidagi ko‘tariluvchi tayanch chizig‘iga ham, ustidagi parallel chiziqqa ham mos kelgan.
MANTA/USDT: Nuqsonsiz ko‘tariluvchi kanal yugurishidan keyin yuqorilarni sinovdan o‘tkazish
$MANTA
Manta Network taxtada yanada intizomli uptrend-lardan birini asta-sekin yig‘ib bormoqda — yuqoriroq pastliklar va yuqoriroq yuqoriliklarning barqaror o‘sishi, barchasi bitta ko‘tariluvchi kanal ichiga aniq joylashgan. Endi narx yaqinda shakllangan eng yuqori ko‘rsatkich tomon yana itarilmoqda, shuning uchun ssenariy uzoq pozitsiya tarafdorlari uchun klassik breakout-retest (yorib chiqish — qayta test) imkoniyatiga aylanib boryapti.
Strukturani o‘qish
Harakat 0.0552 atrofidagi Higher Low (yuqoriroq pastlik)dan boshlangan va shundan beri darslikdagidek davom etib kelmoqda — 0.0578 atrofida Lower High (quyiroq yuqorilik), 0.0592 atrofida ikkinchi Lower High va nihoyat 0.0621 da Higher High. Ushbu o‘sishning har bir bosqichi yaxshi belgilangan ko‘tariluvchi kanal ichida saqlanib, narx uning ostidagi ko‘tariluvchi tayanch chizig‘iga ham, ustidagi parallel chiziqqa ham mos kelgan.
Manta Network taxtada yanada intizomli uptrend-lardan birini asta-sekin yig‘ib bormoqda — yuqoriroq pastliklar va yuqoriroq yuqoriliklarning barqaror o‘sishi, barchasi bitta ko‘tariluvchi kanal ichiga aniq joylashgan. Endi narx yaqinda shakllangan eng yuqori ko‘rsatkich tomon yana itarilmoqda, shuning uchun ssenariy uzoq pozitsiya tarafdorlari uchun klassik breakout-retest (yorib chiqish — qayta test) imkoniyatiga aylanib boryapti.
Strukturani o‘qish
Harakat 0.0552 atrofidagi Higher Low (yuqoriroq pastlik)dan boshlangan va shundan beri darslikdagidek davom etib kelmoqda — 0.0578 atrofida Lower High (quyiroq yuqorilik), 0.0592 atrofida ikkinchi Lower High va nihoyat 0.0621 da Higher High. Ushbu o‘sishning har bir bosqichi yaxshi belgilangan ko‘tariluvchi kanal ichida saqlanib, narx uning ostidagi ko‘tariluvchi tayanch chizig‘iga ham, ustidagi parallel chiziqqa ham mos kelgan.
194
·
--
Maqola
ARB/USDT: Breakout Tasdiqlandi — Kengayuvchi Kanal Yuqoriga Ishora Qilyapti$ARB
Arbitrum ko‘p kunlik konsolidatsiya diapazonidan haqiqiy ishonch bilan chiqib ketdi va ushbu breakoutdan keyingi davomiylik aynan trend treyderlar ko‘rishni xohlaydigan narsa bo‘ldi: keskin impulsiv harakat, muhim tayanchni ushlab qolgan sayoz pullback va yuqorilarga tomon yangi surilish. 15 daqiqalik perpetual grafikdagi strukturasi davom etish foydasiga aniq mos keladi.
Strukturani o‘qish
ARB ikki sessiyaning katta qismini taxminan 0.145 dan 0.165 oralig‘ida yon tomonlama savdolarda o‘tkazib, Ketma-ket Quyi Yuqorilarni (Lower Highs) va yakuniy Quyi Pastni (Lower Low) bosmaga chiqarib berdi; shundan so‘ng xaridorlar nihoyat nazoratni qo‘lga oldi. O‘sha Quyi Pastdan narx kuchli impulsiv ralli tomonga otildi va sessiyaning Yuqori Yuqorisini (Higher High) qariyb 0.238 atrofida keltirdi — bu oldingi butun diapazondan aniq yuqoriga chiqish (breakout).
ARB/USDT: Breakout Tasdiqlandi — Kengayuvchi Kanal Yuqoriga Ishora Qilyapti
$ARB
Arbitrum ko‘p kunlik konsolidatsiya diapazonidan haqiqiy ishonch bilan chiqib ketdi va ushbu breakoutdan keyingi davomiylik aynan trend treyderlar ko‘rishni xohlaydigan narsa bo‘ldi: keskin impulsiv harakat, muhim tayanchni ushlab qolgan sayoz pullback va yuqorilarga tomon yangi surilish. 15 daqiqalik perpetual grafikdagi strukturasi davom etish foydasiga aniq mos keladi.
Strukturani o‘qish
ARB ikki sessiyaning katta qismini taxminan 0.145 dan 0.165 oralig‘ida yon tomonlama savdolarda o‘tkazib, Ketma-ket Quyi Yuqorilarni (Lower Highs) va yakuniy Quyi Pastni (Lower Low) bosmaga chiqarib berdi; shundan so‘ng xaridorlar nihoyat nazoratni qo‘lga oldi. O‘sha Quyi Pastdan narx kuchli impulsiv ralli tomonga otildi va sessiyaning Yuqori Yuqorisini (Higher High) qariyb 0.238 atrofida keltirdi — bu oldingi butun diapazondan aniq yuqoriga chiqish (breakout).
Arbitrum ko‘p kunlik konsolidatsiya diapazonidan haqiqiy ishonch bilan chiqib ketdi va ushbu breakoutdan keyingi davomiylik aynan trend treyderlar ko‘rishni xohlaydigan narsa bo‘ldi: keskin impulsiv harakat, muhim tayanchni ushlab qolgan sayoz pullback va yuqorilarga tomon yangi surilish. 15 daqiqalik perpetual grafikdagi strukturasi davom etish foydasiga aniq mos keladi.
Strukturani o‘qish
ARB ikki sessiyaning katta qismini taxminan 0.145 dan 0.165 oralig‘ida yon tomonlama savdolarda o‘tkazib, Ketma-ket Quyi Yuqorilarni (Lower Highs) va yakuniy Quyi Pastni (Lower Low) bosmaga chiqarib berdi; shundan so‘ng xaridorlar nihoyat nazoratni qo‘lga oldi. O‘sha Quyi Pastdan narx kuchli impulsiv ralli tomonga otildi va sessiyaning Yuqori Yuqorisini (Higher High) qariyb 0.238 atrofida keltirdi — bu oldingi butun diapazondan aniq yuqoriga chiqish (breakout).
181
·
--
Maqola
ZK/USDT: Trendchiziq Ishini Davom Ettiryapti — Long Setap Faol$ZK
ZKsync so‘nggi 24 soatda taxtada eng barqaror “grinder”lardan biri bo‘lgan: u bitta ko‘tarilayotgan trendchiziq bo‘ylab intizomli pog‘onama-pog‘ona tarzda ko‘tarilib bordi va u hech qachon buzilmagan. Yangi Higher High ni belgilab olib, o‘sha trendchiziqni sinab ko‘rish uchun orqaga qaytgach, narx yana qayta sakrayapti — va struktura hali ham xaridorlar tomonida.
Strukturani o‘qish
Harakat 0.0089 atrofidagi pastdan qaytadi va u yerdan ZK butun sessiya davomida yuqoriroq pastlar va yuqoriroq yuqorilardan iborat bitta uzluksiz ko‘tarilish trendchizig‘ini hurmat qilgan. Yo‘lda u 0.0110 atrofidagi Lower High ni sindirib o‘tdi, keyin konsolidatsiyalandi va so‘ng sessiyaning Higher High ni keltirib chiqargan keskin impulsli shamga uchib ketdi.
ZK/USDT: Trendchiziq Ishini Davom Ettiryapti — Long Setap Faol
$ZK
ZKsync so‘nggi 24 soatda taxtada eng barqaror “grinder”lardan biri bo‘lgan: u bitta ko‘tarilayotgan trendchiziq bo‘ylab intizomli pog‘onama-pog‘ona tarzda ko‘tarilib bordi va u hech qachon buzilmagan. Yangi Higher High ni belgilab olib, o‘sha trendchiziqni sinab ko‘rish uchun orqaga qaytgach, narx yana qayta sakrayapti — va struktura hali ham xaridorlar tomonida.
Strukturani o‘qish
Harakat 0.0089 atrofidagi pastdan qaytadi va u yerdan ZK butun sessiya davomida yuqoriroq pastlar va yuqoriroq yuqorilardan iborat bitta uzluksiz ko‘tarilish trendchizig‘ini hurmat qilgan. Yo‘lda u 0.0110 atrofidagi Lower High ni sindirib o‘tdi, keyin konsolidatsiyalandi va so‘ng sessiyaning Higher High ni keltirib chiqargan keskin impulsli shamga uchib ketdi.
ZKsync so‘nggi 24 soatda taxtada eng barqaror “grinder”lardan biri bo‘lgan: u bitta ko‘tarilayotgan trendchiziq bo‘ylab intizomli pog‘onama-pog‘ona tarzda ko‘tarilib bordi va u hech qachon buzilmagan. Yangi Higher High ni belgilab olib, o‘sha trendchiziqni sinab ko‘rish uchun orqaga qaytgach, narx yana qayta sakrayapti — va struktura hali ham xaridorlar tomonida.
Strukturani o‘qish
Harakat 0.0089 atrofidagi pastdan qaytadi va u yerdan ZK butun sessiya davomida yuqoriroq pastlar va yuqoriroq yuqorilardan iborat bitta uzluksiz ko‘tarilish trendchizig‘ini hurmat qilgan. Yo‘lda u 0.0110 atrofidagi Lower High ni sindirib o‘tdi, keyin konsolidatsiyalandi va so‘ng sessiyaning Higher High ni keltirib chiqargan keskin impulsli shamga uchib ketdi.
159
·
--
Maqola
ETH/USDT: Standart Uptrend ichida dipni sotib olish$ETH
Ethereum so‘nggi seanslarda eng toza impulsli mitinglaridan birini namoyish etdi: u bir swing-loudan sakrab chiqib, ko‘tarilayotgan trend chizig‘i bo‘ylab yangi Higher High (yuqoriroq maksimum) tomon yo‘nalishda davom etdi. Endi esa narx sayoz pullback (qisqa tuzatish)ga kirib, soviyotgan paytda treyderlar o‘zidan bitta savolni so‘rayapti: bu sotib olish kerak bo‘lgan dipmi yoki yanada chuqorroq narsaning boshlanishimi? Tuzilma (structure) qanday joylashganini mana shunda ko‘rib chiqamiz.
Eslatma: manba grafik Bitstamp birjasidagi ETH/USD bo‘lib, ETH/USDT’ga bevosita emas — ularning ikkalasi deyarli bir xil harakat qiladi, shuning uchun pastdagi darajalar ETH/USDT’ga ham toza tarzda mos keladi.
ETH/USDT: Standart Uptrend ichida dipni sotib olish
$ETH
Ethereum so‘nggi seanslarda eng toza impulsli mitinglaridan birini namoyish etdi: u bir swing-loudan sakrab chiqib, ko‘tarilayotgan trend chizig‘i bo‘ylab yangi Higher High (yuqoriroq maksimum) tomon yo‘nalishda davom etdi. Endi esa narx sayoz pullback (qisqa tuzatish)ga kirib, soviyotgan paytda treyderlar o‘zidan bitta savolni so‘rayapti: bu sotib olish kerak bo‘lgan dipmi yoki yanada chuqorroq narsaning boshlanishimi? Tuzilma (structure) qanday joylashganini mana shunda ko‘rib chiqamiz.
Eslatma: manba grafik Bitstamp birjasidagi ETH/USD bo‘lib, ETH/USDT’ga bevosita emas — ularning ikkalasi deyarli bir xil harakat qiladi, shuning uchun pastdagi darajalar ETH/USDT’ga ham toza tarzda mos keladi.
Ethereum so‘nggi seanslarda eng toza impulsli mitinglaridan birini namoyish etdi: u bir swing-loudan sakrab chiqib, ko‘tarilayotgan trend chizig‘i bo‘ylab yangi Higher High (yuqoriroq maksimum) tomon yo‘nalishda davom etdi. Endi esa narx sayoz pullback (qisqa tuzatish)ga kirib, soviyotgan paytda treyderlar o‘zidan bitta savolni so‘rayapti: bu sotib olish kerak bo‘lgan dipmi yoki yanada chuqorroq narsaning boshlanishimi? Tuzilma (structure) qanday joylashganini mana shunda ko‘rib chiqamiz.
Eslatma: manba grafik Bitstamp birjasidagi ETH/USD bo‘lib, ETH/USDT’ga bevosita emas — ularning ikkalasi deyarli bir xil harakat qiladi, shuning uchun pastdagi darajalar ETH/USDT’ga ham toza tarzda mos keladi.
139
·
--
Maqola
OG/USDT: Ko‘tariluvchi kanal yuqoriroq nuqtalarga tomon yana bir bosqichni tayyorlamoqda$OG
OG Fan Token so‘nggi bir kun ichida darslikka xos ko‘tariluvchi (ascending) kanalni shakllantirib kelmoqda — va Fibonacci talab zonasidan toza qaytishdan so‘ng, narx yana tuzilmaning yuqori qismiga tomon bosim qilmoqda. 5 daqiqalik grafikni kuzatayotgan treyderlar uchun bu kanal tuzilmasi davom etish ehtimoli yuqori bo‘lgan setup sifatida namoyon bo‘lyapti: long tomoni aniq ustun, kanal saqlanib turguncha.
Tuzilmani o‘qish
Harakat sessiya boshidagi Yuqoriroq Yuqori (Higher High) bilan boshlandi, so‘ng 2.730 atrofida Quyiroq Pastlik (Lower Low) tomon keskin qaytish bo‘ldi. Shu pastdan xaridorlar qat’iy tarzda kirib keldi va o‘shandan beri narx yaxshi aniqlangan ko‘tariluvchi kanal ichida yuqoriga ko‘tarilmoqda — ketma-ket higher lows va higher highs, ikki ta toza ko‘tariluvchi trend chiziqlari bilan chegaralangan.
OG/USDT: Ko‘tariluvchi kanal yuqoriroq nuqtalarga tomon yana bir bosqichni tayyorlamoqda
$OG
OG Fan Token so‘nggi bir kun ichida darslikka xos ko‘tariluvchi (ascending) kanalni shakllantirib kelmoqda — va Fibonacci talab zonasidan toza qaytishdan so‘ng, narx yana tuzilmaning yuqori qismiga tomon bosim qilmoqda. 5 daqiqalik grafikni kuzatayotgan treyderlar uchun bu kanal tuzilmasi davom etish ehtimoli yuqori bo‘lgan setup sifatida namoyon bo‘lyapti: long tomoni aniq ustun, kanal saqlanib turguncha.
Tuzilmani o‘qish
Harakat sessiya boshidagi Yuqoriroq Yuqori (Higher High) bilan boshlandi, so‘ng 2.730 atrofida Quyiroq Pastlik (Lower Low) tomon keskin qaytish bo‘ldi. Shu pastdan xaridorlar qat’iy tarzda kirib keldi va o‘shandan beri narx yaxshi aniqlangan ko‘tariluvchi kanal ichida yuqoriga ko‘tarilmoqda — ketma-ket higher lows va higher highs, ikki ta toza ko‘tariluvchi trend chiziqlari bilan chegaralangan.
OG Fan Token so‘nggi bir kun ichida darslikka xos ko‘tariluvchi (ascending) kanalni shakllantirib kelmoqda — va Fibonacci talab zonasidan toza qaytishdan so‘ng, narx yana tuzilmaning yuqori qismiga tomon bosim qilmoqda. 5 daqiqalik grafikni kuzatayotgan treyderlar uchun bu kanal tuzilmasi davom etish ehtimoli yuqori bo‘lgan setup sifatida namoyon bo‘lyapti: long tomoni aniq ustun, kanal saqlanib turguncha.
Tuzilmani o‘qish
Harakat sessiya boshidagi Yuqoriroq Yuqori (Higher High) bilan boshlandi, so‘ng 2.730 atrofida Quyiroq Pastlik (Lower Low) tomon keskin qaytish bo‘ldi. Shu pastdan xaridorlar qat’iy tarzda kirib keldi va o‘shandan beri narx yaxshi aniqlangan ko‘tariluvchi kanal ichida yuqoriga ko‘tarilmoqda — ketma-ket higher lows va higher highs, ikki ta toza ko‘tariluvchi trend chiziqlari bilan chegaralangan.
1
643
·
--
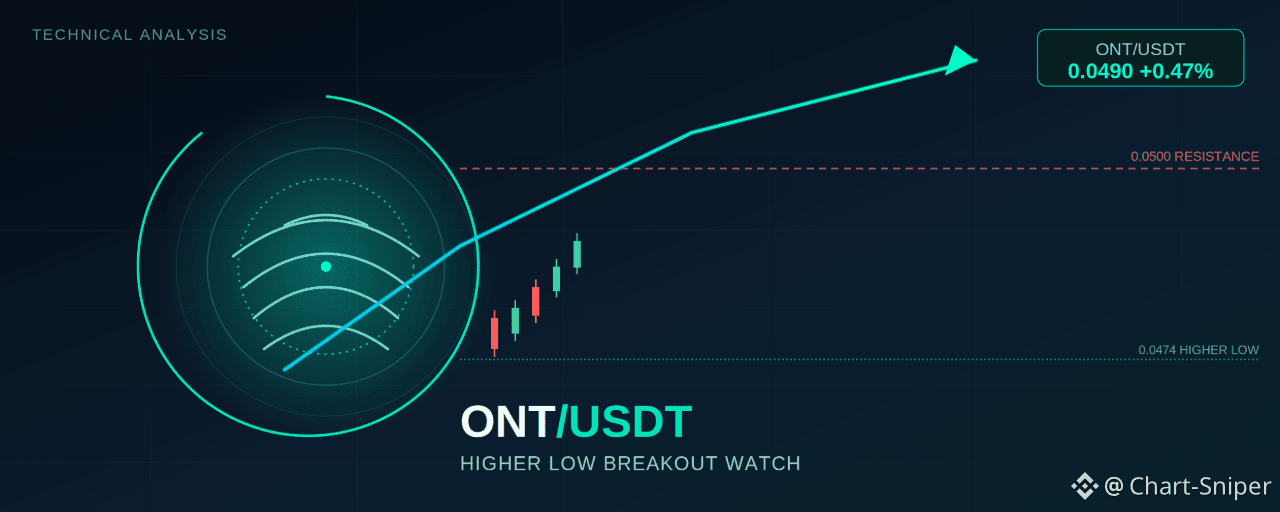
Maqola
ONT/USDT: Ushbu pasayish trendini teskari yo‘nalishga aylantira oladigan Higher Low$ONT
Ontology (ONT) so‘nggi uch seansning katta qismini Tetherga nisbatan pastga sekin bosib o‘tib, harakat qildi, lekin 15 daqiqalik grafik endi sotuvchilar tutqunligini yo‘qotayotganining birinchi real belgilarini ko‘rsatmoqda. Yangi Lower Lowga tamg‘alaganidan keyin narx Higher Lowni shakllantirdi — va tuzilishdagi aynan shu bitta o‘zgarish hozir diqqat bilan kuzatilishi kerak bo‘lgan pasayish trendidagi yorilishdir.
Tuzilmani o‘qish
Grafik so‘nib borayotgan pasayish tendensiyasi haqida aniq hikoya qiladi. ONT/USDT avval Lower Low (pastroq pastlik), so‘ng Lower High (pastroq yuqorilik) tomon qaytib ko‘tarildi, keyin yana ikkinchi Lower Highga o‘g‘rib, nihoyat 0.0474 atrofida Higher Low (yuqoriroq pastlik) yaqinida xaridorlar paydo bo‘ldi. Bu HL asosiy rivojlanish — bu ketma-ketlikdagi sotuvchilar endi narxni yangi tubga itarolmayotganining birinchi belgisi.
ONT/USDT: Ushbu pasayish trendini teskari yo‘nalishga aylantira oladigan Higher Low
$ONT
Ontology (ONT) so‘nggi uch seansning katta qismini Tetherga nisbatan pastga sekin bosib o‘tib, harakat qildi, lekin 15 daqiqalik grafik endi sotuvchilar tutqunligini yo‘qotayotganining birinchi real belgilarini ko‘rsatmoqda. Yangi Lower Lowga tamg‘alaganidan keyin narx Higher Lowni shakllantirdi — va tuzilishdagi aynan shu bitta o‘zgarish hozir diqqat bilan kuzatilishi kerak bo‘lgan pasayish trendidagi yorilishdir.
Tuzilmani o‘qish
Grafik so‘nib borayotgan pasayish tendensiyasi haqida aniq hikoya qiladi. ONT/USDT avval Lower Low (pastroq pastlik), so‘ng Lower High (pastroq yuqorilik) tomon qaytib ko‘tarildi, keyin yana ikkinchi Lower Highga o‘g‘rib, nihoyat 0.0474 atrofida Higher Low (yuqoriroq pastlik) yaqinida xaridorlar paydo bo‘ldi. Bu HL asosiy rivojlanish — bu ketma-ketlikdagi sotuvchilar endi narxni yangi tubga itarolmayotganining birinchi belgisi.
Ontology (ONT) so‘nggi uch seansning katta qismini Tetherga nisbatan pastga sekin bosib o‘tib, harakat qildi, lekin 15 daqiqalik grafik endi sotuvchilar tutqunligini yo‘qotayotganining birinchi real belgilarini ko‘rsatmoqda. Yangi Lower Lowga tamg‘alaganidan keyin narx Higher Lowni shakllantirdi — va tuzilishdagi aynan shu bitta o‘zgarish hozir diqqat bilan kuzatilishi kerak bo‘lgan pasayish trendidagi yorilishdir.
Tuzilmani o‘qish
Grafik so‘nib borayotgan pasayish tendensiyasi haqida aniq hikoya qiladi. ONT/USDT avval Lower Low (pastroq pastlik), so‘ng Lower High (pastroq yuqorilik) tomon qaytib ko‘tarildi, keyin yana ikkinchi Lower Highga o‘g‘rib, nihoyat 0.0474 atrofida Higher Low (yuqoriroq pastlik) yaqinida xaridorlar paydo bo‘ldi. Bu HL asosiy rivojlanish — bu ketma-ketlikdagi sotuvchilar endi narxni yangi tubga itarolmayotganining birinchi belgisi.
172
·
--
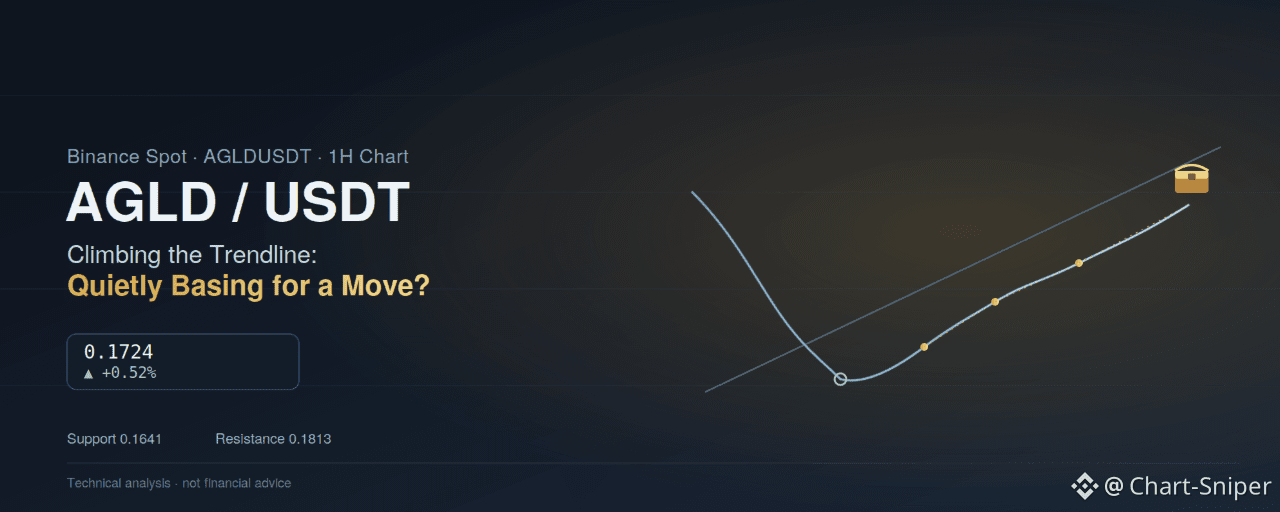
Maqola
AGLD/USDT Ko‘tarilayotgan trend chizig‘i ustida yuqoriroq turibdi — Adventure Gold jim turib “o‘sish”ga tayyorgarlik ko‘ryaptimi?$AGLD
1H grafik | Binance Spot | AGLDUSDT | 2026-yil 16-sentabr
Adventure Gold (AGLD) 0.1724 atrofida savdolashmoqda, sessiya boshida 0.1716 dan boshlab va 0.1716–0.1729 oralig‘ida tebranib, +0.52% ga oshgan. Hozirgi jadvaldagi boshqa, keskinroq va portlovchiroq setuplar bilan solishtirganda, AGLD grafigi sokinroq — ammo bu sokinlik ostida kuzatishga arziydigan tuzilma bor: yaqinda yuqoridan qattiq tushib ketgan token poydevor (floor) topdi va oxirgi bir yarim kun davomida himoyalangan trend chizig‘i bo‘ylab sekin ko‘tarilib, oxirgi qaytishiga to‘siq bo‘lgan qarshilik tomon yana yaqinlashmoqda.
AGLD/USDT Ko‘tarilayotgan trend chizig‘i ustida yuqoriroq turibdi — Adventure Gold jim turib “o‘sish”ga tayyorgarlik ko‘ryaptimi?
$AGLD
1H grafik | Binance Spot | AGLDUSDT | 2026-yil 16-sentabr
Adventure Gold (AGLD) 0.1724 atrofida savdolashmoqda, sessiya boshida 0.1716 dan boshlab va 0.1716–0.1729 oralig‘ida tebranib, +0.52% ga oshgan. Hozirgi jadvaldagi boshqa, keskinroq va portlovchiroq setuplar bilan solishtirganda, AGLD grafigi sokinroq — ammo bu sokinlik ostida kuzatishga arziydigan tuzilma bor: yaqinda yuqoridan qattiq tushib ketgan token poydevor (floor) topdi va oxirgi bir yarim kun davomida himoyalangan trend chizig‘i bo‘ylab sekin ko‘tarilib, oxirgi qaytishiga to‘siq bo‘lgan qarshilik tomon yana yaqinlashmoqda.
1H grafik | Binance Spot | AGLDUSDT | 2026-yil 16-sentabr
Adventure Gold (AGLD) 0.1724 atrofida savdolashmoqda, sessiya boshida 0.1716 dan boshlab va 0.1716–0.1729 oralig‘ida tebranib, +0.52% ga oshgan. Hozirgi jadvaldagi boshqa, keskinroq va portlovchiroq setuplar bilan solishtirganda, AGLD grafigi sokinroq — ammo bu sokinlik ostida kuzatishga arziydigan tuzilma bor: yaqinda yuqoridan qattiq tushib ketgan token poydevor (floor) topdi va oxirgi bir yarim kun davomida himoyalangan trend chizig‘i bo‘ylab sekin ko‘tarilib, oxirgi qaytishiga to‘siq bo‘lgan qarshilik tomon yana yaqinlashmoqda.
123
·
--
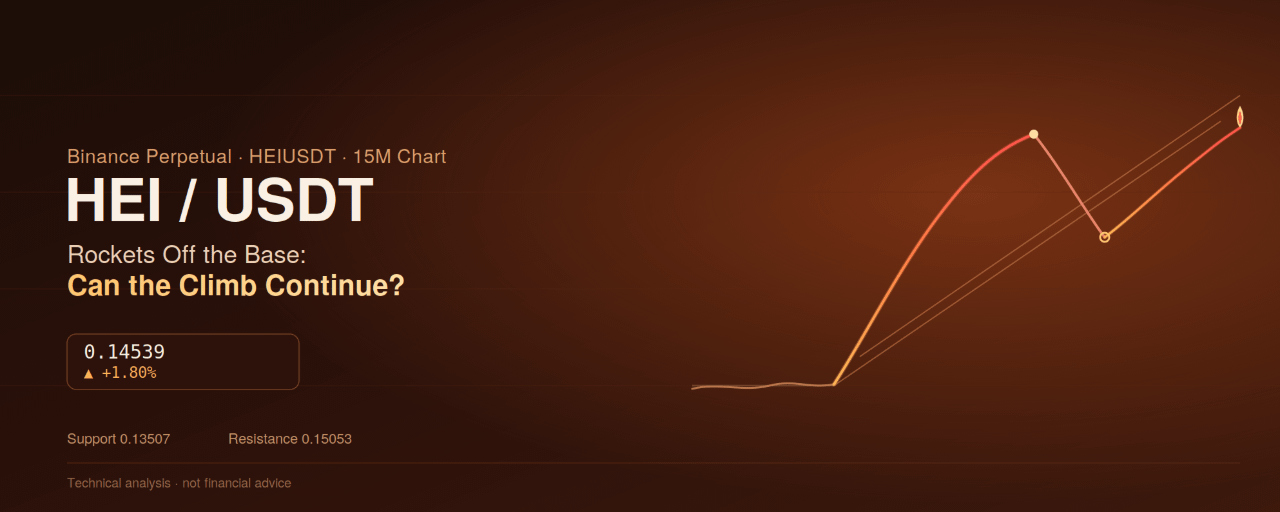
Maqola
HEI/USDT Ko‘p kunlik bazadan uchib chiqdi — kanal yana ko‘tarila oladimi?$HEI
15M diagram | Binance Perpetual | HEIUSDT | 2026-yil 16-sentabr
Heima (HEI) 0.14539 narxda savdo qilmoqda, sessiya davomida keskin +1.80% ga oshgan: 0.14282 dan ochilib, 0.14143 va 0.14608 oralig‘ida tebrangan. Biroq bu kunlik ko‘rsatkich oxirgi 24 soatda sodir bo‘lgan voqealar ko‘lamini zo‘rg‘a ifodalaydi: HEI uzoq vaqt davom etgan, tekis konsolidatsiyadan chiqib ketdi va deyarli parabola kabi ko‘tarildi; sessiyaning boshidagi eng past nuqtalardan yangi yuqoriga qadar 30% dan ko‘proq o‘sib, so‘ng klassik “pullback” (tuzatish)ga kirib, hozir yana yuqoriga qaytish bilan yakunlanayotgandek.
HEI/USDT Ko‘p kunlik bazadan uchib chiqdi — kanal yana ko‘tarila oladimi?
$HEI
15M diagram | Binance Perpetual | HEIUSDT | 2026-yil 16-sentabr
Heima (HEI) 0.14539 narxda savdo qilmoqda, sessiya davomida keskin +1.80% ga oshgan: 0.14282 dan ochilib, 0.14143 va 0.14608 oralig‘ida tebrangan. Biroq bu kunlik ko‘rsatkich oxirgi 24 soatda sodir bo‘lgan voqealar ko‘lamini zo‘rg‘a ifodalaydi: HEI uzoq vaqt davom etgan, tekis konsolidatsiyadan chiqib ketdi va deyarli parabola kabi ko‘tarildi; sessiyaning boshidagi eng past nuqtalardan yangi yuqoriga qadar 30% dan ko‘proq o‘sib, so‘ng klassik “pullback” (tuzatish)ga kirib, hozir yana yuqoriga qaytish bilan yakunlanayotgandek.
15M diagram | Binance Perpetual | HEIUSDT | 2026-yil 16-sentabr
Heima (HEI) 0.14539 narxda savdo qilmoqda, sessiya davomida keskin +1.80% ga oshgan: 0.14282 dan ochilib, 0.14143 va 0.14608 oralig‘ida tebrangan. Biroq bu kunlik ko‘rsatkich oxirgi 24 soatda sodir bo‘lgan voqealar ko‘lamini zo‘rg‘a ifodalaydi: HEI uzoq vaqt davom etgan, tekis konsolidatsiyadan chiqib ketdi va deyarli parabola kabi ko‘tarildi; sessiyaning boshidagi eng past nuqtalardan yangi yuqoriga qadar 30% dan ko‘proq o‘sib, so‘ng klassik “pullback” (tuzatish)ga kirib, hozir yana yuqoriga qaytish bilan yakunlanayotgandek.
129
·
--
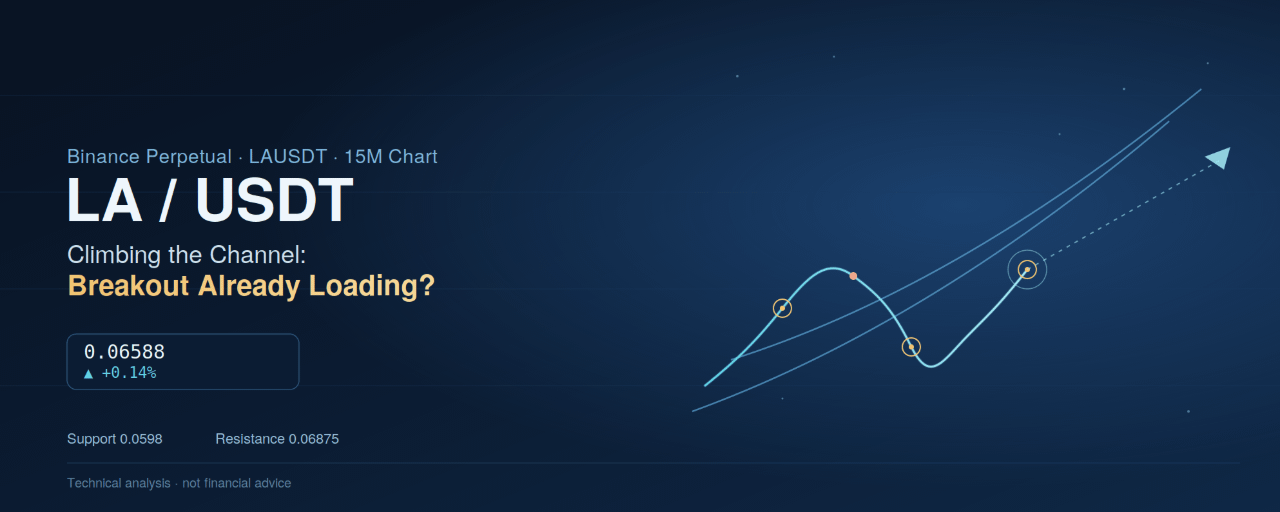
Maqola
LA/USDT O‘sish kanalining ichida ko‘tarilmoqda — keyingi breakaut tayyormi?$LA
15M Grafik | Binance Perpetual | LAUSDT | 2026-yil 16-sentabr
Lagrange (LA) 0.06588 da savdo qilmoqda, sessiya davomida 0.14% ga biroz o‘sib, 0.06578 dan ochilgan va 0.06597 gacha ko‘tarilib, 0.06561 gacha pasaygan. Kunlik sham ko‘rinishidan tekis, ammo ostidagi tuzilma hech qachon statik emas — haftaning boshidagi ikki kunlik keskin sotuvdan so‘ng, LA oxirgi bir yarim kun davomida haqiqiy o‘sish kanalini qurib, pastki relsidan uchinchi marta qaytdi va oxirgi ko‘tarilish urinishini to‘sgan qarshilik tomon sekin qaytayapti.
LA/USDT O‘sish kanalining ichida ko‘tarilmoqda — keyingi breakaut tayyormi?
$LA
15M Grafik | Binance Perpetual | LAUSDT | 2026-yil 16-sentabr
Lagrange (LA) 0.06588 da savdo qilmoqda, sessiya davomida 0.14% ga biroz o‘sib, 0.06578 dan ochilgan va 0.06597 gacha ko‘tarilib, 0.06561 gacha pasaygan. Kunlik sham ko‘rinishidan tekis, ammo ostidagi tuzilma hech qachon statik emas — haftaning boshidagi ikki kunlik keskin sotuvdan so‘ng, LA oxirgi bir yarim kun davomida haqiqiy o‘sish kanalini qurib, pastki relsidan uchinchi marta qaytdi va oxirgi ko‘tarilish urinishini to‘sgan qarshilik tomon sekin qaytayapti.
15M Grafik | Binance Perpetual | LAUSDT | 2026-yil 16-sentabr
Lagrange (LA) 0.06588 da savdo qilmoqda, sessiya davomida 0.14% ga biroz o‘sib, 0.06578 dan ochilgan va 0.06597 gacha ko‘tarilib, 0.06561 gacha pasaygan. Kunlik sham ko‘rinishidan tekis, ammo ostidagi tuzilma hech qachon statik emas — haftaning boshidagi ikki kunlik keskin sotuvdan so‘ng, LA oxirgi bir yarim kun davomida haqiqiy o‘sish kanalini qurib, pastki relsidan uchinchi marta qaytdi va oxirgi ko‘tarilish urinishini to‘sgan qarshilik tomon sekin qaytayapti.
284
·
--
📉 $ZEC USDT — QISQA SETUP
ZEC $1,178–$1,217 atrofida, yaqinda $1,200 dan yuqoridan keskin tuzatishdan keyin. Momentum o‘zgaruvchan bo‘lib qolmoqda: qaytadan burilgandan so‘ng sotuvchilar faol.
🔴 QISQA KIRISH: Bozor narxi
🛑 SL: $1,300
🎯 TP1: $1,100
🎯 TP2: $1,020
🎯 TP3: $950
⚡ Kirish: Bozor narxi — hozir ijro etiladi.
⚠️ Moliya bo‘yicha maslahat emas. Riskni ehtiyotkorlik bilan boshqaring.
@Binance_Square_Official #FedRateWatch #ZcashRises6% #XRPSinks10% #Binance #ChartSniper
{future}(ZECUSDT)
📉 $ZEC USDT — QISQA SETUP
ZEC $1,178–$1,217 atrofida, yaqinda $1,200 dan yuqoridan keskin tuzatishdan keyin. Momentum o‘zgaruvchan bo‘lib qolmoqda: qaytadan burilgandan so‘ng sotuvchilar faol.
🔴 QISQA KIRISH: Bozor narxi
🛑 SL: $1,300
🎯 TP1: $1,100
🎯 TP2: $1,020
🎯 TP3: $950
⚡ Kirish: Bozor narxi — hozir ijro etiladi.
⚠️ Moliya bo‘yicha maslahat emas. Riskni ehtiyotkorlik bilan boshqaring.
@Binance Square Official #FedRateWatch #ZcashRises6% #XRPSinks10% #Binance #ChartSniper
ZEC $1,178–$1,217 atrofida, yaqinda $1,200 dan yuqoridan keskin tuzatishdan keyin. Momentum o‘zgaruvchan bo‘lib qolmoqda: qaytadan burilgandan so‘ng sotuvchilar faol.
🔴 QISQA KIRISH: Bozor narxi
🛑 SL: $1,300
🎯 TP1: $1,100
🎯 TP2: $1,020
🎯 TP3: $950
⚡ Kirish: Bozor narxi — hozir ijro etiladi.
⚠️ Moliya bo‘yicha maslahat emas. Riskni ehtiyotkorlik bilan boshqaring.
@Binance Square Official #FedRateWatch #ZcashRises6% #XRPSinks10% #Binance #ChartSniper
194
Ko‘proq kontentni ko‘rish uchun tizimga kiring
Binance Square'da global kriptovalyuta foydalanuvchilariga qo‘shiling
⚡️ Kriptovalyuta haqida eng so‘nggi va foydali ma’lumotlarni oling.
💬 Dunyoning eng yirik kriptovalyuta birjasi tomonidan ishonchli deb topilgan.
👍 Tasdiqlangan mualliflardan haqiqiy tahlillarni kashf eting.
Email / telefon raqami
Trenddagi mavzular
CircleMints500MUSDCOnSolana
92,570 marta koʻrilgan
2,039 muhokama qilmoqda
#circlemints500musdconsolana
🚨 Solanada $500M USDC QO'SHIMCHA MINT QILINDI! 💵🔥
Circle Treasury Solanada 500M USDCni yangi mint qildi va global umumiy ta’minotni $75.2B ga yetkazdi! 📈✨
💡 Tezkor Haqiqatni Tekshirish:
🔹 Minting = Yangi Inventar (zaxira) yaratilishi (bu darhol sotib olish kuchi emas!🛒
🔹 Asosiy Trigger = DeFi, birjalar va pool’lar ichiga kapital joylashtirish! 🌐🚀
🎯 Kuzatib boring:
⚡ $SOL — Tarmoq faolligi kuchaymoqda va yangi likvidlik ekotizim o‘sishini davom ettiryapti!
💎 $RARE — Yuqori volatillikdagi altkoin bo‘lib, yangi bozor likvidligi va kayfiyatga tez reaksiyadir!🪐
💥 Siz hozir to‘playapsizmi yoki to‘liq kapital joylashtirilishini kutyapsizmi? Fikringizni pastga yozing! 👇✨
#CircleMints500MUSDCOnSolana
#PolymarketBankFailureBetsDrawFDICConcern
#BlackRockBuildsTokenizedPortfoliosForOndo
#BitwiseFilesToListNEARETFOnNYSEArca
Hifza Rubab
·4 ta layk
·4.5k marta koʻrilgan
PolymarketBankFailureBetsDrawFDICConcern
94,046 marta koʻrilgan
1,819 muhokama qilmoqda
BlackRockBuildsTokenizedPortfoliosForOndo
87,032 marta koʻrilgan
1,293 muhokama qilmoqda