

Hsaka Trades
2.7k Postlar

Hsaka Trades
Shikoyat qilish
Foydalanuvchini bloklash
we'll come Alpha coin, don't miss my signal 🚥🚦 btc,Eth,Sol
Ochiq savdo
Yuqori chastotali treyder
4.2 yil
643 Kuzatilmoqda
4.3K+ Kuzatuvchilar
2.1K+ Yoqdi
Postlar
Portfel
Barchasi
Iqtiboslar
Videolar
Jonli
·
--
O‘suvchi
Tasdiqlangan
$FIL 11.8 USDT ushlab turilmoqda
$FIL keyingi harakat ancha ravshanroq bo‘lishi mumkin bo‘lgan darajada o‘tiribdi.
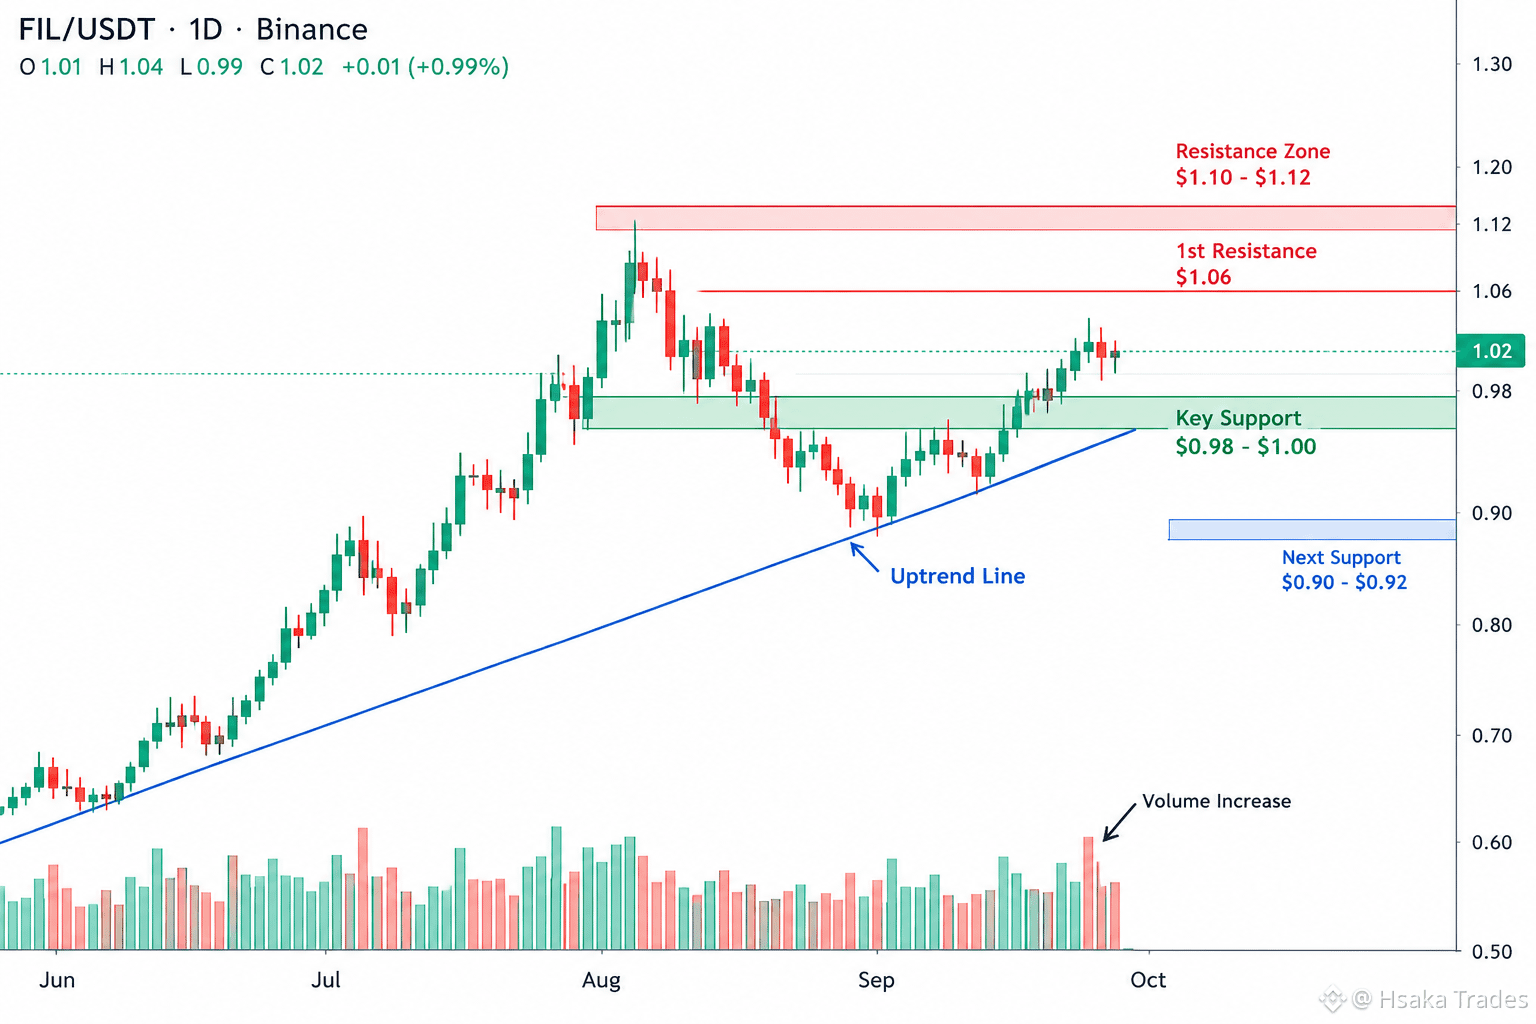
Filecoin yaqinda $1 hududidan yuqoriga chiqqach, hozir $1.02 atrofida savdo qilmoqda, ammo bugungi tortilish esa xaridorlar hali ham breakout (yorib o‘tish) tuzilmasini himoya qilishi kerakligini ko‘rsatmoqda.
Kundalik grafikda men kuzatayotgan asosiy zona $0.98–$1.00. Shu joyni ushlab turish yaqinda shakllangan higher-high/higher-low (yuqori cho‘qqi/yuqori tub) tuzilmasini tirik saqlaydi. Uning ustida $1.06 birinchi qarshilik, undan keyin esa $1.10–$1.12 hududi turadi.
Kattaroq katalizator ham yaqinlashmoqda: Coinvestor ma’lumotlariga ko‘ra, Filecoin’ning olti yillik vesting jadvali 15-oktabrda yakunlanishi kutilyapti, bu esa Binance News’ga ko‘ra yangi FIL ta’minotini taxminan 75% ga kamaytirishi mumkin.
Lekin men faqat narrativni quvib ketmagan bo‘lardim. Bozor voqea oldidan ta’minot o‘zgarishini baholashi (narxga kiritishi) mumkin, shuning uchun narx harakati va hajm (volume) hali ham muhim.
Mening fikrim:
FIL qaror qabul qilinadigan zonada. Hajm bilan birga $1.06 dan kuchli qayta egalik qilish tuzilmani yaxshilaydi, $0.98’ni yo‘qotish esa chart’ni yanada chuqurroq konsolidatsiyaga qaytarishi mumkin.
Avval texnik breakout’ni kuzatarmidingiz yoki oktabrdagi ta’minot o‘zgarishini?
#Filecoin
o‘tkazib yubormang 👉$SAND
{future}(SANDUSDT)
💵
$FIL keyingi harakat ancha ravshanroq bo‘lishi mumkin bo‘lgan darajada o‘tiribdi.
Filecoin yaqinda $1 hududidan yuqoriga chiqqach, hozir $1.02 atrofida savdo qilmoqda, ammo bugungi tortilish esa xaridorlar hali ham breakout (yorib o‘tish) tuzilmasini himoya qilishi kerakligini ko‘rsatmoqda.
Kundalik grafikda men kuzatayotgan asosiy zona $0.98–$1.00. Shu joyni ushlab turish yaqinda shakllangan higher-high/higher-low (yuqori cho‘qqi/yuqori tub) tuzilmasini tirik saqlaydi. Uning ustida $1.06 birinchi qarshilik, undan keyin esa $1.10–$1.12 hududi turadi.
Kattaroq katalizator ham yaqinlashmoqda: Coinvestor ma’lumotlariga ko‘ra, Filecoin’ning olti yillik vesting jadvali 15-oktabrda yakunlanishi kutilyapti, bu esa Binance News’ga ko‘ra yangi FIL ta’minotini taxminan 75% ga kamaytirishi mumkin.
Lekin men faqat narrativni quvib ketmagan bo‘lardim. Bozor voqea oldidan ta’minot o‘zgarishini baholashi (narxga kiritishi) mumkin, shuning uchun narx harakati va hajm (volume) hali ham muhim.
Mening fikrim:
FIL qaror qabul qilinadigan zonada. Hajm bilan birga $1.06 dan kuchli qayta egalik qilish tuzilmani yaxshilaydi, $0.98’ni yo‘qotish esa chart’ni yanada chuqurroq konsolidatsiyaga qaytarishi mumkin.
Avval texnik breakout’ni kuzatarmidingiz yoki oktabrdagi ta’minot o‘zgarishini?
#Filecoin
o‘tkazib yubormang 👉$SAND
💵
Filecoin yaqinda $1 hududidan yuqoriga chiqqach, hozir $1.02 atrofida savdo qilmoqda, ammo bugungi tortilish esa xaridorlar hali ham breakout (yorib o‘tish) tuzilmasini himoya qilishi kerakligini ko‘rsatmoqda.
Kundalik grafikda men kuzatayotgan asosiy zona $0.98–$1.00. Shu joyni ushlab turish yaqinda shakllangan higher-high/higher-low (yuqori cho‘qqi/yuqori tub) tuzilmasini tirik saqlaydi. Uning ustida $1.06 birinchi qarshilik, undan keyin esa $1.10–$1.12 hududi turadi.
Kattaroq katalizator ham yaqinlashmoqda: Coinvestor ma’lumotlariga ko‘ra, Filecoin’ning olti yillik vesting jadvali 15-oktabrda yakunlanishi kutilyapti, bu esa Binance News’ga ko‘ra yangi FIL ta’minotini taxminan 75% ga kamaytirishi mumkin.
Lekin men faqat narrativni quvib ketmagan bo‘lardim. Bozor voqea oldidan ta’minot o‘zgarishini baholashi (narxga kiritishi) mumkin, shuning uchun narx harakati va hajm (volume) hali ham muhim.
Mening fikrim:
FIL qaror qabul qilinadigan zonada. Hajm bilan birga $1.06 dan kuchli qayta egalik qilish tuzilmani yaxshilaydi, $0.98’ni yo‘qotish esa chart’ni yanada chuqurroq konsolidatsiyaga qaytarishi mumkin.
Avval texnik breakout’ni kuzatarmidingiz yoki oktabrdagi ta’minot o‘zgarishini?
#Filecoin
o‘tkazib yubormang 👉$SAND
💵
1
3
3
763
·
--
Tarjimani ko‘rish
$BTC is approaching a level where the next weekly candle could tell us a lot.
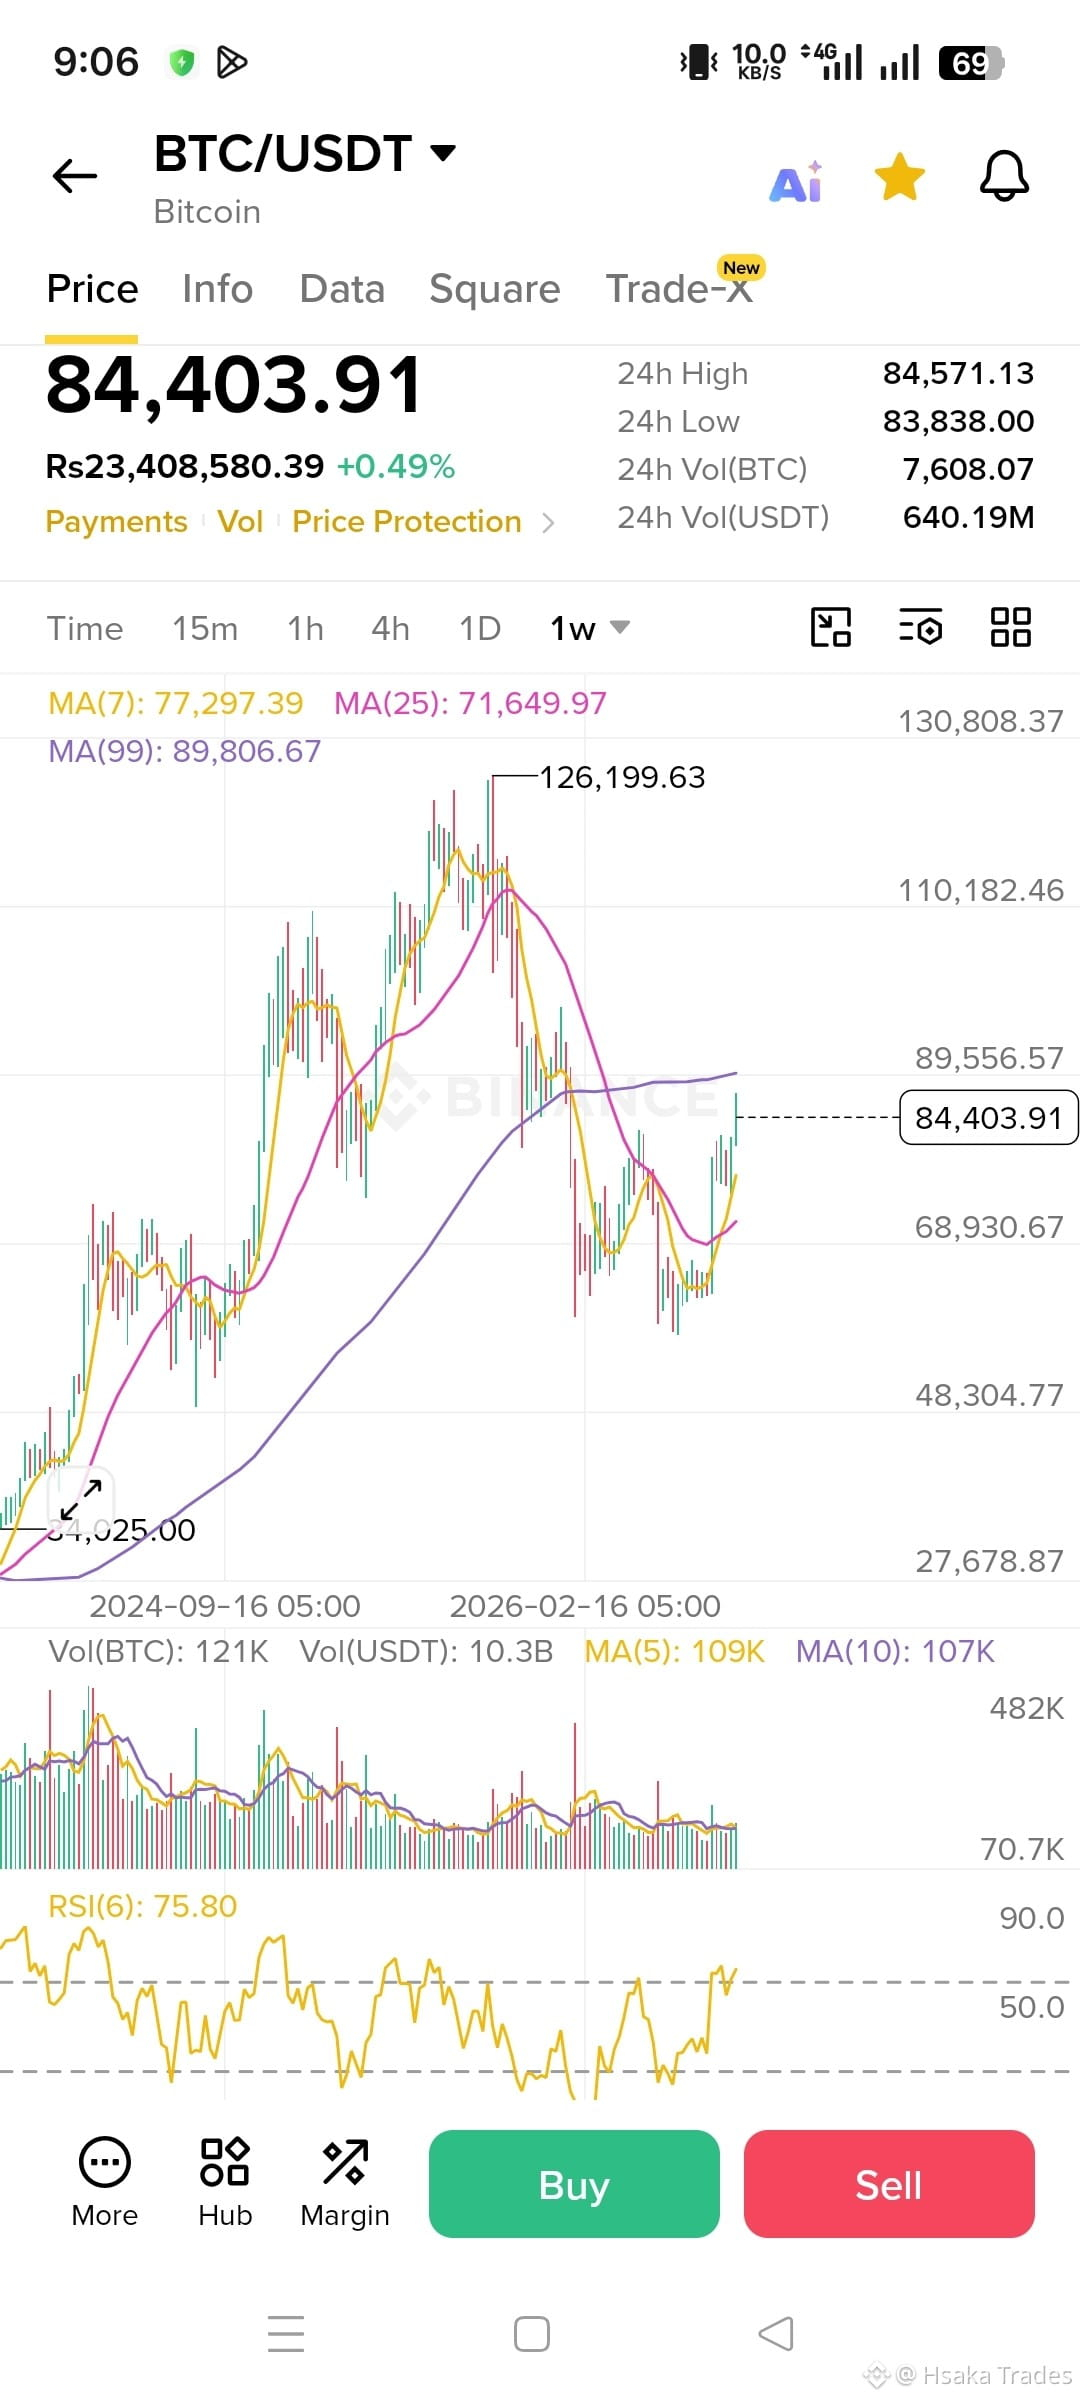
BTC is sitting around $84.4K on the weekly chart, above the MA(7) at $77.3K and MA(25) at $71.65K. That keeps the short-to-medium structure constructive, but there’s an important obstacle ahead: the MA(99) near $89.8K.
The chart also shows RSI(6) around 75.8, meaning momentum is strong but already stretched on this timeframe. Weekly volume doesn’t show a dramatic expansion either, so I’d rather see stronger participation before calling this a confirmed continuation.
For me, $89.5K–$90K is the key resistance zone. On the downside, $77K is the first area I’d watch, followed by roughly $71.6K if selling pressure increases.
Current derivatives data adds another piece: Binance BTC funding is positive while open interest is around $8B, so leveraged positioning is present, but funding is not at an extreme level.
My Take: BTC has recovered strongly, but this is where chasing becomes less attractive. I want to see how price reacts around the $89K–$90K area and whether volume confirms the move.
**Do you think BTC can break that resistance with real spot demand, or does the weekly RSI need to cool first?
#TrumpRejectsIranHormuzReopening
$BTC is approaching a level where the next weekly candle could tell us a lot.
BTC is sitting around $84.4K on the weekly chart, above the MA(7) at $77.3K and MA(25) at $71.65K. That keeps the short-to-medium structure constructive, but there’s an important obstacle ahead: the MA(99) near $89.8K.
The chart also shows RSI(6) around 75.8, meaning momentum is strong but already stretched on this timeframe. Weekly volume doesn’t show a dramatic expansion either, so I’d rather see stronger participation before calling this a confirmed continuation.
For me, $89.5K–$90K is the key resistance zone. On the downside, $77K is the first area I’d watch, followed by roughly $71.6K if selling pressure increases.
Current derivatives data adds another piece: Binance BTC funding is positive while open interest is around $8B, so leveraged positioning is present, but funding is not at an extreme level.
My Take: BTC has recovered strongly, but this is where chasing becomes less attractive. I want to see how price reacts around the $89K–$90K area and whether volume confirms the move.
**Do you think BTC can break that resistance with real spot demand, or does the weekly RSI need to cool first?
#TrumpRejectsIranHormuzReopening
BTC is sitting around $84.4K on the weekly chart, above the MA(7) at $77.3K and MA(25) at $71.65K. That keeps the short-to-medium structure constructive, but there’s an important obstacle ahead: the MA(99) near $89.8K.
The chart also shows RSI(6) around 75.8, meaning momentum is strong but already stretched on this timeframe. Weekly volume doesn’t show a dramatic expansion either, so I’d rather see stronger participation before calling this a confirmed continuation.
For me, $89.5K–$90K is the key resistance zone. On the downside, $77K is the first area I’d watch, followed by roughly $71.6K if selling pressure increases.
Current derivatives data adds another piece: Binance BTC funding is positive while open interest is around $8B, so leveraged positioning is present, but funding is not at an extreme level.
My Take: BTC has recovered strongly, but this is where chasing becomes less attractive. I want to see how price reacts around the $89K–$90K area and whether volume confirms the move.
**Do you think BTC can break that resistance with real spot demand, or does the weekly RSI need to cool first?
#TrumpRejectsIranHormuzReopening
67
·
--
Tarjimani ko‘rish
The interesting part isn’t just the green numbers — it’s what happens after the first big push.
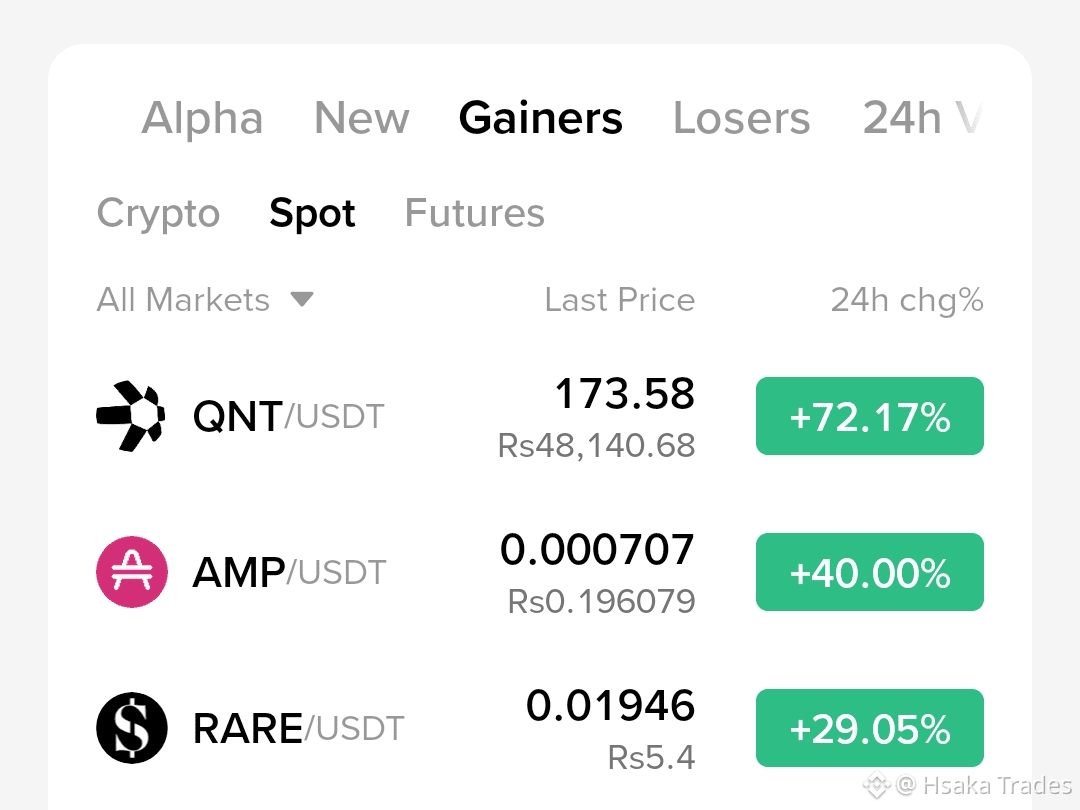
Looking at the Binance Spot gainers on this screen, three names immediately stand out: QNT +72.17%, AMP +40%, and RARE +29.05%.
$QNT is the one I’d watch most closely for confirmation, not because of the percentage alone. The move has come with a major jump in trading activity, and current derivatives data shows roughly $725M in 24h futures volume versus ~$33M spot volume, with about $30.8M open interest. Funding is also positive, which tells me leverage is participating in the move.
$AMP is showing a much smaller derivatives market, so a sharp percentage move can also mean thinner liquidity and faster reversals.
$RARE is interesting for a different reason: futures volume is around $119M against ~$15.7M spot volume, meaning derivatives are heavily involved in the current action.
My Take: I wouldn’t chase a candle simply because it is green. After a move like this, I want to see whether price can hold the breakout area and whether spot buying continues instead of the move becoming purely leverage-driven.
**Which one are you watching for the next move — QNT, AMP, or RARE?**
The interesting part isn’t just the green numbers — it’s what happens after the first big push.
Looking at the Binance Spot gainers on this screen, three names immediately stand out: QNT +72.17%, AMP +40%, and RARE +29.05%.
$QNT is the one I’d watch most closely for confirmation, not because of the percentage alone. The move has come with a major jump in trading activity, and current derivatives data shows roughly $725M in 24h futures volume versus ~$33M spot volume, with about $30.8M open interest. Funding is also positive, which tells me leverage is participating in the move.
$AMP is showing a much smaller derivatives market, so a sharp percentage move can also mean thinner liquidity and faster reversals.
$RARE is interesting for a different reason: futures volume is around $119M against ~$15.7M spot volume, meaning derivatives are heavily involved in the current action.
My Take: I wouldn’t chase a candle simply because it is green. After a move like this, I want to see whether price can hold the breakout area and whether spot buying continues instead of the move becoming purely leverage-driven.
**Which one are you watching for the next move — QNT, AMP, or RARE?**
Looking at the Binance Spot gainers on this screen, three names immediately stand out: QNT +72.17%, AMP +40%, and RARE +29.05%.
$QNT is the one I’d watch most closely for confirmation, not because of the percentage alone. The move has come with a major jump in trading activity, and current derivatives data shows roughly $725M in 24h futures volume versus ~$33M spot volume, with about $30.8M open interest. Funding is also positive, which tells me leverage is participating in the move.
$AMP is showing a much smaller derivatives market, so a sharp percentage move can also mean thinner liquidity and faster reversals.
$RARE is interesting for a different reason: futures volume is around $119M against ~$15.7M spot volume, meaning derivatives are heavily involved in the current action.
My Take: I wouldn’t chase a candle simply because it is green. After a move like this, I want to see whether price can hold the breakout area and whether spot buying continues instead of the move becoming purely leverage-driven.
**Which one are you watching for the next move — QNT, AMP, or RARE?**
641
·
--
🚨 MARSCOIN ko‘plab treyderlar tayyor bo‘lmagan harakatni amalga oshirdi.
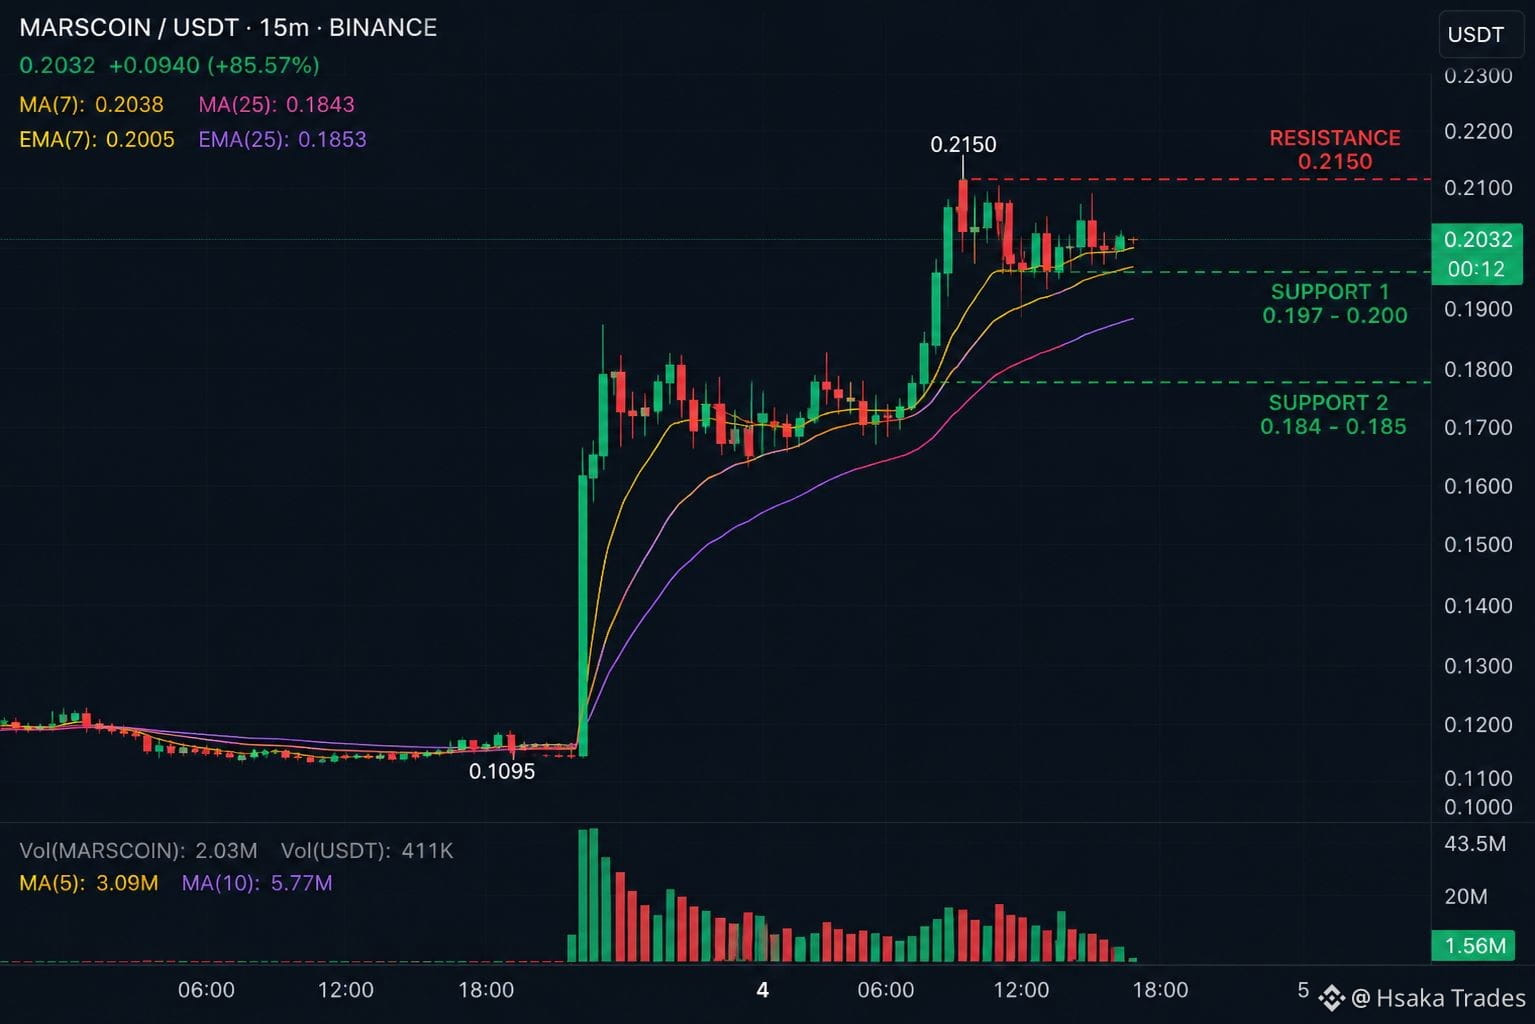
$MARSCOIN taxminan $0.2032 atrofida savdolanmoqda, 24 soatda qariyb 85% ga oshdi, ammo qiziq jihat yashil sham emas — balki breakoutdan keyin nima bo‘lishida.
15M grafikda narx $0.17 hududidan keskin o‘sib, yangi kun ichidagi eng yuqori daraja — taxminan $0.2150 ga chiqdi. Shu sakrashdan so‘ng narx darhol qulamadi, aksincha $0.20–$0.204 atrofida konsolidatsiyalanmoqda, bu esa xaridorlar breakout zonasini hanuz himoya qilayotganini ko‘rsatadi.
Qisqa muddatli struktura narx $0.197–$0.200 hududidan yuqorida turgan ekan, bullish bo‘lib qolmoqda. 7 EMA (~$0.2005) ham narxga yaqin joylashgan bo‘lib, bu bullar uchun muhim qisqa muddatli tayanch nuqta beradi.
Yuqorida $0.2150 aniq qarshilik hisoblanadi. Kuchli hajm bilan toza breakout $0.22+ tomonga yo‘l ochishi mumkin.
Ammo ogohlantirish bor: dastlabki pump paytida hajm juda yuqori bo‘lgan edi va hozir pasaya boshladi. Agar $0.197 kuchayib borayotgan sotuv hajmi bilan buzilsa, $0.184–$0.185 tomonga chuqurroq qaytish ehtimoli paydo bo‘ladi.
Menimcha, bu endi shamni quvish haqida emas. Gap MARSCOIN breakoutni ushlab tura oladimi va $0.20 ni qo‘llab-quvvatlashga aylantira oladimi — shunda.
Siz $0.2150 dan yuqoridagi breakoutni kutasizmi yoki $0.20 qayta sinovini?
#MARSCOIN #MARS don't miss 👉$ZEC
🚨 MARSCOIN ko‘plab treyderlar tayyor bo‘lmagan harakatni amalga oshirdi.
$MARSCOIN taxminan $0.2032 atrofida savdolanmoqda, 24 soatda qariyb 85% ga oshdi, ammo qiziq jihat yashil sham emas — balki breakoutdan keyin nima bo‘lishida.
15M grafikda narx $0.17 hududidan keskin o‘sib, yangi kun ichidagi eng yuqori daraja — taxminan $0.2150 ga chiqdi. Shu sakrashdan so‘ng narx darhol qulamadi, aksincha $0.20–$0.204 atrofida konsolidatsiyalanmoqda, bu esa xaridorlar breakout zonasini hanuz himoya qilayotganini ko‘rsatadi.
Qisqa muddatli struktura narx $0.197–$0.200 hududidan yuqorida turgan ekan, bullish bo‘lib qolmoqda. 7 EMA (~$0.2005) ham narxga yaqin joylashgan bo‘lib, bu bullar uchun muhim qisqa muddatli tayanch nuqta beradi.
Yuqorida $0.2150 aniq qarshilik hisoblanadi. Kuchli hajm bilan toza breakout $0.22+ tomonga yo‘l ochishi mumkin.
Ammo ogohlantirish bor: dastlabki pump paytida hajm juda yuqori bo‘lgan edi va hozir pasaya boshladi. Agar $0.197 kuchayib borayotgan sotuv hajmi bilan buzilsa, $0.184–$0.185 tomonga chuqurroq qaytish ehtimoli paydo bo‘ladi.
Menimcha, bu endi shamni quvish haqida emas. Gap MARSCOIN breakoutni ushlab tura oladimi va $0.20 ni qo‘llab-quvvatlashga aylantira oladimi — shunda.
Siz $0.2150 dan yuqoridagi breakoutni kutasizmi yoki $0.20 qayta sinovini?
#MARSCOIN #MARS don't miss 👉$ZEC
$MARSCOIN taxminan $0.2032 atrofida savdolanmoqda, 24 soatda qariyb 85% ga oshdi, ammo qiziq jihat yashil sham emas — balki breakoutdan keyin nima bo‘lishida.
15M grafikda narx $0.17 hududidan keskin o‘sib, yangi kun ichidagi eng yuqori daraja — taxminan $0.2150 ga chiqdi. Shu sakrashdan so‘ng narx darhol qulamadi, aksincha $0.20–$0.204 atrofida konsolidatsiyalanmoqda, bu esa xaridorlar breakout zonasini hanuz himoya qilayotganini ko‘rsatadi.
Qisqa muddatli struktura narx $0.197–$0.200 hududidan yuqorida turgan ekan, bullish bo‘lib qolmoqda. 7 EMA (~$0.2005) ham narxga yaqin joylashgan bo‘lib, bu bullar uchun muhim qisqa muddatli tayanch nuqta beradi.
Yuqorida $0.2150 aniq qarshilik hisoblanadi. Kuchli hajm bilan toza breakout $0.22+ tomonga yo‘l ochishi mumkin.
Ammo ogohlantirish bor: dastlabki pump paytida hajm juda yuqori bo‘lgan edi va hozir pasaya boshladi. Agar $0.197 kuchayib borayotgan sotuv hajmi bilan buzilsa, $0.184–$0.185 tomonga chuqurroq qaytish ehtimoli paydo bo‘ladi.
Menimcha, bu endi shamni quvish haqida emas. Gap MARSCOIN breakoutni ushlab tura oladimi va $0.20 ni qo‘llab-quvvatlashga aylantira oladimi — shunda.
Siz $0.2150 dan yuqoridagi breakoutni kutasizmi yoki $0.20 qayta sinovini?
#MARSCOIN #MARS don't miss 👉$ZEC
329
7
20
351
·
--
O‘suvchi
$MUBARAK 15.7 USDT ushlab turilmoqda
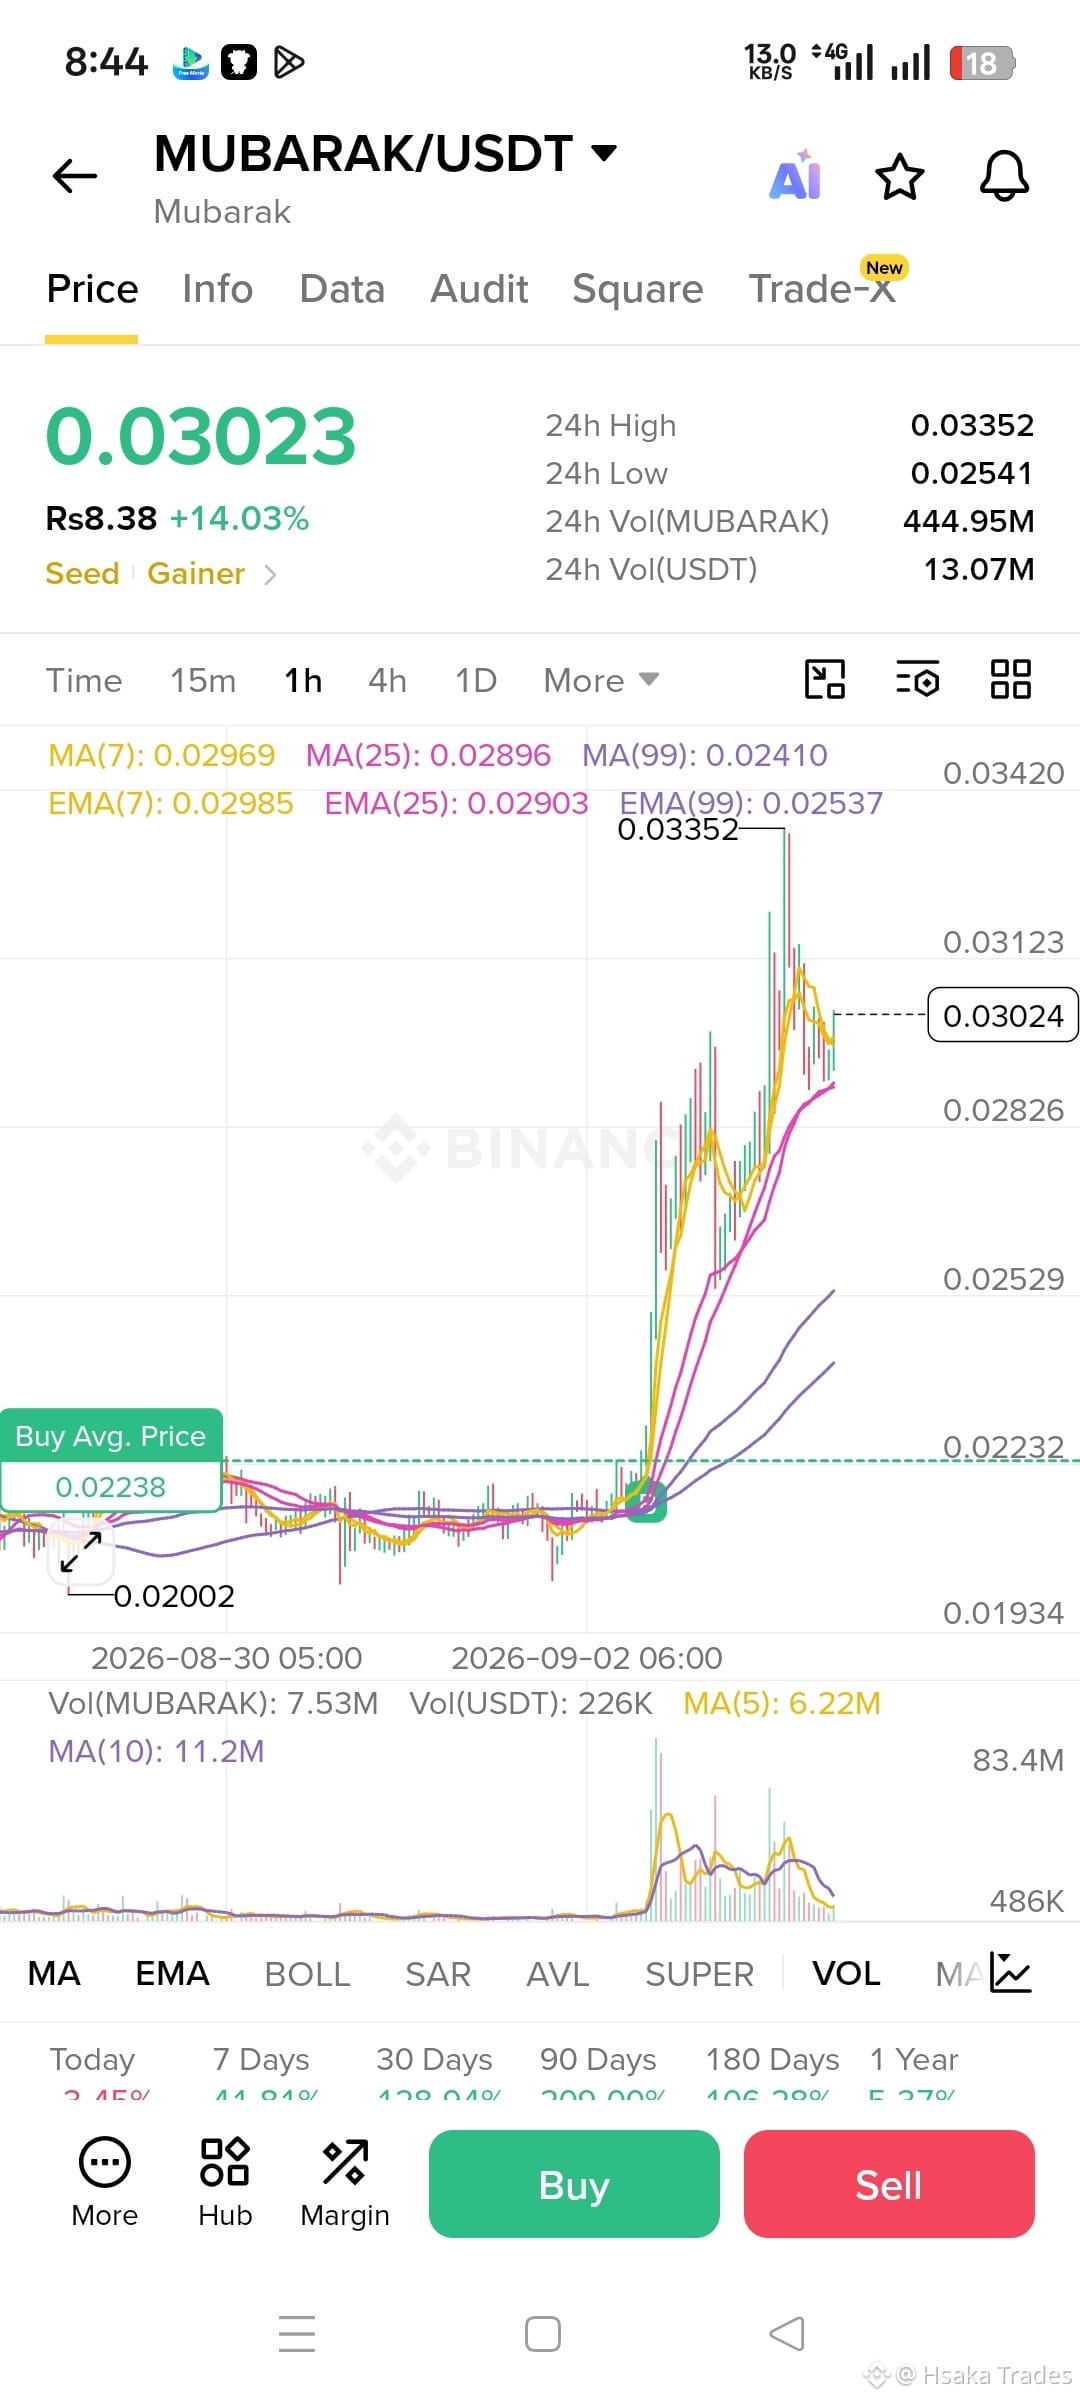
$MUBARAK yashil shamlarni quvish qanchalik xavfli bo‘lishi mumkinligini ko‘rsatib berdi. 👀
$MUBARAK keskin harakatdan so‘ng $0.022–0.023 hududidan taxminan $0.03023 atrofida savdo qilmoqda. 1H grafigida narx 7/25/99 MA va EMA ustida ushlab turibdi, bu esa qisqa muddatli struktura hali ham bullish ekanini ko‘rsatadi.
Lekin muhim tafsilot bor: momentum sovimoqda. Breakout katta hajm (volume) kengayishi bilan chiqqan, ammo so‘nggi shamlar esa pastroq hajmni ko‘rsatmoqda. Bu shuni anglatadiki, xaridorlar hali ham faol, lekin bozor endi oldingidek kuch bilan harakat qilmayapti.
Mening fikrimcha, $0.0283–$0.0290 asosiy tayanch zona. Uni ushlab tursa bullish struktura saqlanib qolishi mumkin. Uning ustida birinchi qarshilik $0.0312, undan keyin esa yaqinda kuzatilgan $0.0335 maksimumi turadi. $0.0335 dan kuchli hajm bilan aniq breakout bo‘lsa, faqat darajaga tegib o‘tishdan ko‘ra ancha ishonchli signal bo‘ladi.
Shaxsan men bu yerda quvib ketishdan tiyilgan bo‘lardim va narx tayanch atrofida qanday reaksiyaga kirishini kuzatardim. Asosiy sinov shuki, dastlabki hayajon so‘nib qolganidan keyin xaridorlar breakoutni himoya qila oladilarmi.
Binance ma’lumotlari ham MUBARAK’ning $0.03 atrofida, sezilarli spot hajm bilan savdo qilayotganini ko‘rsatadi va token atrofidagi e’tibor yuqori ekanini tasdiqlaydi.
Mening xulosam: struktura bullish ko‘rinadi, lekin tasdiq shov-shuvdan muhimroq.
Siz pullbackni kutasizmi yoki $0.0335 ustidan breakout savdosi qila olasizmi?
#MUBARAK $MUBARAK
$MUBARAK yashil shamlarni quvish qanchalik xavfli bo‘lishi mumkinligini ko‘rsatib berdi. 👀
$MUBARAK keskin harakatdan so‘ng $0.022–0.023 hududidan taxminan $0.03023 atrofida savdo qilmoqda. 1H grafigida narx 7/25/99 MA va EMA ustida ushlab turibdi, bu esa qisqa muddatli struktura hali ham bullish ekanini ko‘rsatadi.
Lekin muhim tafsilot bor: momentum sovimoqda. Breakout katta hajm (volume) kengayishi bilan chiqqan, ammo so‘nggi shamlar esa pastroq hajmni ko‘rsatmoqda. Bu shuni anglatadiki, xaridorlar hali ham faol, lekin bozor endi oldingidek kuch bilan harakat qilmayapti.
Mening fikrimcha, $0.0283–$0.0290 asosiy tayanch zona. Uni ushlab tursa bullish struktura saqlanib qolishi mumkin. Uning ustida birinchi qarshilik $0.0312, undan keyin esa yaqinda kuzatilgan $0.0335 maksimumi turadi. $0.0335 dan kuchli hajm bilan aniq breakout bo‘lsa, faqat darajaga tegib o‘tishdan ko‘ra ancha ishonchli signal bo‘ladi.
Shaxsan men bu yerda quvib ketishdan tiyilgan bo‘lardim va narx tayanch atrofida qanday reaksiyaga kirishini kuzatardim. Asosiy sinov shuki, dastlabki hayajon so‘nib qolganidan keyin xaridorlar breakoutni himoya qila oladilarmi.
Binance ma’lumotlari ham MUBARAK’ning $0.03 atrofida, sezilarli spot hajm bilan savdo qilayotganini ko‘rsatadi va token atrofidagi e’tibor yuqori ekanini tasdiqlaydi.
Mening xulosam: struktura bullish ko‘rinadi, lekin tasdiq shov-shuvdan muhimroq.
Siz pullbackni kutasizmi yoki $0.0335 ustidan breakout savdosi qila olasizmi?
#MUBARAK $MUBARAK
$MUBARAK keskin harakatdan so‘ng $0.022–0.023 hududidan taxminan $0.03023 atrofida savdo qilmoqda. 1H grafigida narx 7/25/99 MA va EMA ustida ushlab turibdi, bu esa qisqa muddatli struktura hali ham bullish ekanini ko‘rsatadi.
Lekin muhim tafsilot bor: momentum sovimoqda. Breakout katta hajm (volume) kengayishi bilan chiqqan, ammo so‘nggi shamlar esa pastroq hajmni ko‘rsatmoqda. Bu shuni anglatadiki, xaridorlar hali ham faol, lekin bozor endi oldingidek kuch bilan harakat qilmayapti.
Mening fikrimcha, $0.0283–$0.0290 asosiy tayanch zona. Uni ushlab tursa bullish struktura saqlanib qolishi mumkin. Uning ustida birinchi qarshilik $0.0312, undan keyin esa yaqinda kuzatilgan $0.0335 maksimumi turadi. $0.0335 dan kuchli hajm bilan aniq breakout bo‘lsa, faqat darajaga tegib o‘tishdan ko‘ra ancha ishonchli signal bo‘ladi.
Shaxsan men bu yerda quvib ketishdan tiyilgan bo‘lardim va narx tayanch atrofida qanday reaksiyaga kirishini kuzatardim. Asosiy sinov shuki, dastlabki hayajon so‘nib qolganidan keyin xaridorlar breakoutni himoya qila oladilarmi.
Binance ma’lumotlari ham MUBARAK’ning $0.03 atrofida, sezilarli spot hajm bilan savdo qilayotganini ko‘rsatadi va token atrofidagi e’tibor yuqori ekanini tasdiqlaydi.
Mening xulosam: struktura bullish ko‘rinadi, lekin tasdiq shov-shuvdan muhimroq.
Siz pullbackni kutasizmi yoki $0.0335 ustidan breakout savdosi qila olasizmi?
#MUBARAK $MUBARAK
4
160

·
--
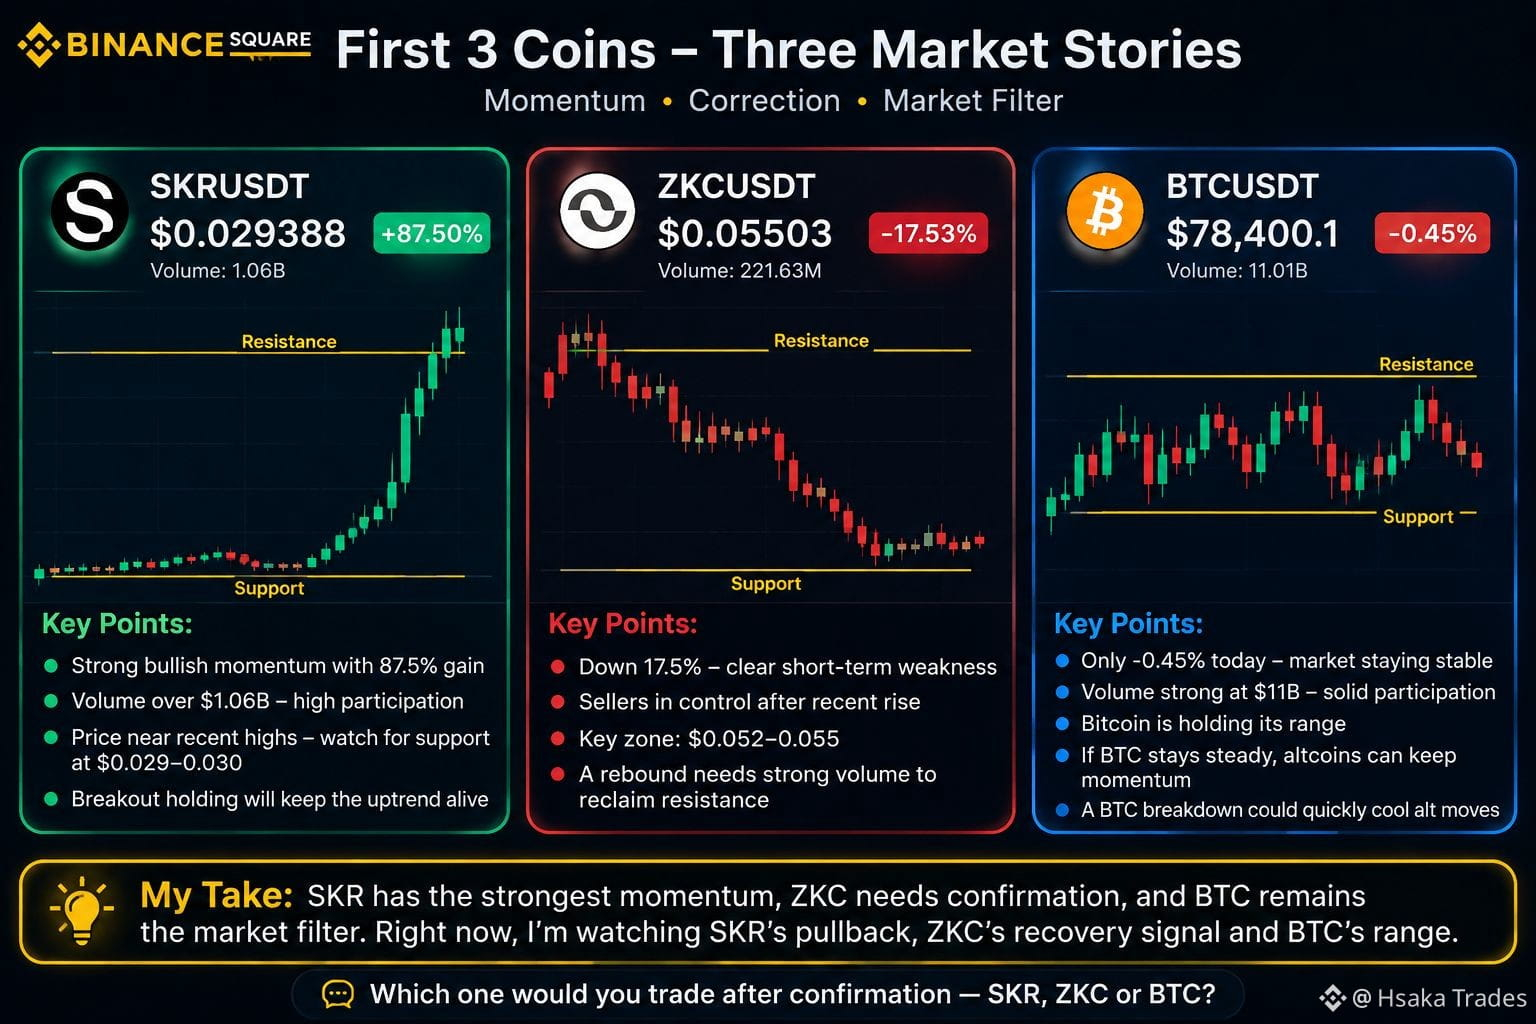
Uchta tanga. Uchta butunlay boshqacha bozor hikoyasi — va menimcha, bu foiz o‘sishidan ham muhimroq.
$SKR bu yerda eng ko‘rinarlisi: portlashsimon 87,5% harakatdan so‘ng taxminan $0.0294 atrofida savdo qilmoqda, hajmda esa taxminan $1.06 mlrd. ko‘rsatilgan. Bunday kengayish kech kirib keladigan xaridorlarni tez jalb qilishi mumkin. Mening fikrimcha, muhim sinov — narx chiqish (breakout) hududini ushlab tura oladimi, yo‘qmi; ya’ni butun harakatni orqaga qaytarib yubormasligi.
$ZKC esa aksini ko‘rsatmoqda. $0.0550 da — 17,5% pasaygan holda — sotuvchilar qisqa muddatda aniq nazoratni qo‘lga olgan. Buni teskari (reversal) deb aytishdan oldin narx barqarorlashib, qarshilik (resistance)ni qayta egallashini ko‘rishni istardim.
So‘ng
$BTC bor: $78,400. Faqat 0,45% past, hajm esa taxminan $11 mlrd. darajada juda katta bo‘lib qolmoqda. Bu menga shuni aytadi: Bitcoin nisbatan sokin, kichikroq kontraktlar esa ancha kuchli rotatsiyalarni (aylanishlarni) ko‘ryapti.
Mening xulosam: 87% li shamdan keyin men SKR ni quvib kirmayman. U birinchi real qaytishda o‘zini qanday tutishini kuzatyapman. ZKC xaridorlar qaytayotgani haqida dalilga muhtoj, BTC esa bozorning risk filtri bo‘lib qolmoqda.
**Tasdiqdan keyin qaysi birini savdo qilgan bo‘lardingiz — SKR, ZKC yoki BTC?**
Uchta tanga. Uchta butunlay boshqacha bozor hikoyasi — va menimcha, bu foiz o‘sishidan ham muhimroq.
$SKR bu yerda eng ko‘rinarlisi: portlashsimon 87,5% harakatdan so‘ng taxminan $0.0294 atrofida savdo qilmoqda, hajmda esa taxminan $1.06 mlrd. ko‘rsatilgan. Bunday kengayish kech kirib keladigan xaridorlarni tez jalb qilishi mumkin. Mening fikrimcha, muhim sinov — narx chiqish (breakout) hududini ushlab tura oladimi, yo‘qmi; ya’ni butun harakatni orqaga qaytarib yubormasligi.
$ZKC esa aksini ko‘rsatmoqda. $0.0550 da — 17,5% pasaygan holda — sotuvchilar qisqa muddatda aniq nazoratni qo‘lga olgan. Buni teskari (reversal) deb aytishdan oldin narx barqarorlashib, qarshilik (resistance)ni qayta egallashini ko‘rishni istardim.
So‘ng
$BTC bor: $78,400. Faqat 0,45% past, hajm esa taxminan $11 mlrd. darajada juda katta bo‘lib qolmoqda. Bu menga shuni aytadi: Bitcoin nisbatan sokin, kichikroq kontraktlar esa ancha kuchli rotatsiyalarni (aylanishlarni) ko‘ryapti.
Mening xulosam: 87% li shamdan keyin men SKR ni quvib kirmayman. U birinchi real qaytishda o‘zini qanday tutishini kuzatyapman. ZKC xaridorlar qaytayotgani haqida dalilga muhtoj, BTC esa bozorning risk filtri bo‘lib qolmoqda.
**Tasdiqdan keyin qaysi birini savdo qilgan bo‘lardingiz — SKR, ZKC yoki BTC?**
$SKR bu yerda eng ko‘rinarlisi: portlashsimon 87,5% harakatdan so‘ng taxminan $0.0294 atrofida savdo qilmoqda, hajmda esa taxminan $1.06 mlrd. ko‘rsatilgan. Bunday kengayish kech kirib keladigan xaridorlarni tez jalb qilishi mumkin. Mening fikrimcha, muhim sinov — narx chiqish (breakout) hududini ushlab tura oladimi, yo‘qmi; ya’ni butun harakatni orqaga qaytarib yubormasligi.
$ZKC esa aksini ko‘rsatmoqda. $0.0550 da — 17,5% pasaygan holda — sotuvchilar qisqa muddatda aniq nazoratni qo‘lga olgan. Buni teskari (reversal) deb aytishdan oldin narx barqarorlashib, qarshilik (resistance)ni qayta egallashini ko‘rishni istardim.
So‘ng
$BTC bor: $78,400. Faqat 0,45% past, hajm esa taxminan $11 mlrd. darajada juda katta bo‘lib qolmoqda. Bu menga shuni aytadi: Bitcoin nisbatan sokin, kichikroq kontraktlar esa ancha kuchli rotatsiyalarni (aylanishlarni) ko‘ryapti.
Mening xulosam: 87% li shamdan keyin men SKR ni quvib kirmayman. U birinchi real qaytishda o‘zini qanday tutishini kuzatyapman. ZKC xaridorlar qaytayotgani haqida dalilga muhtoj, BTC esa bozorning risk filtri bo‘lib qolmoqda.
**Tasdiqdan keyin qaysi birini savdo qilgan bo‘lardingiz — SKR, ZKC yoki BTC?**
3
322
·
--
$TRUMP
{future}(TRUMPUSDT)
tez harakatlanyapti — lekin haqiqiy sinov hali oldinda.
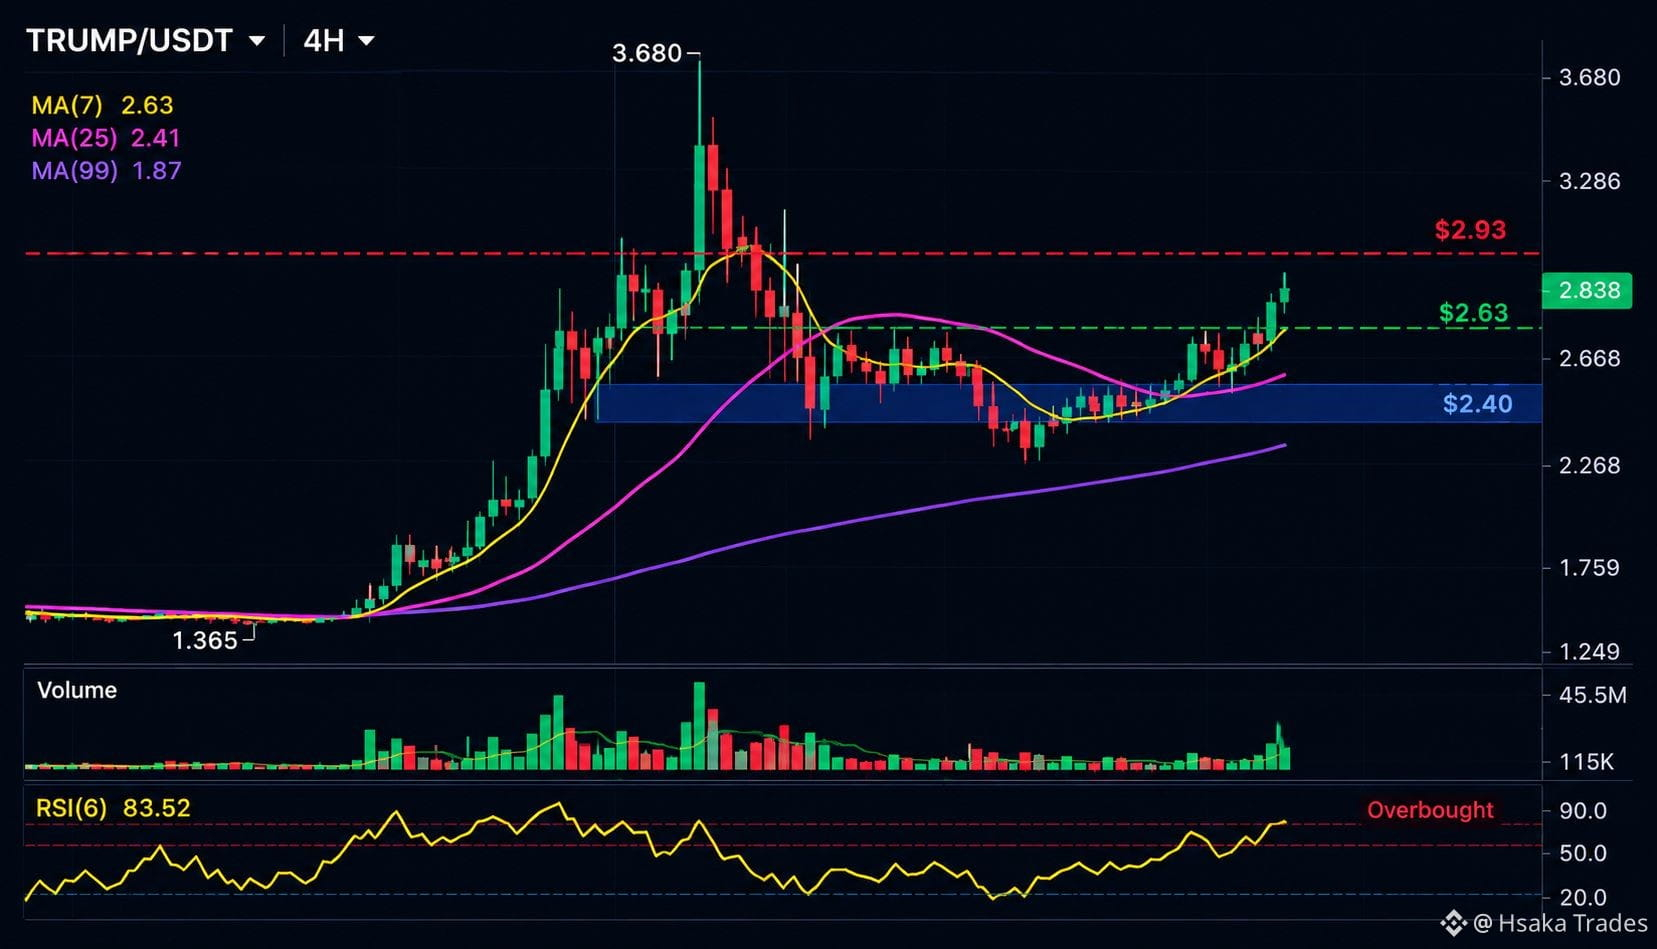
4H jadvalida $TRUMP qisqa muddatli harakatlanuvchi o‘rtachalarni qaytarib olgandan so‘ng atrofida $2.84 da savdolashmoqda. Hozir narx MA(7) da $2.63 va MA(25) da $2.41 ustida; MA(99) esa ancha pastda, taxminan $1.87 yaqinida joylashgan. Bu qisqa muddatda momentum aniq ravishda bullish tomonga o‘zgarganini ko‘rsatadi.
Lekin men bu shamni quvib ketmayman. RSI taxminan 83.5 atrofida: kuchli momentum bor, lekin ehtiyotsiz kirish uchun juda ham oz joy qolgan. Asosiy muammo esa qarshilik: $2.93 — bu darhol 24H yuqori nuqtasi, $3.00 atrofida esa foyda olish ham, yangi likvidlik ham jalb qilinishi ehtimoli bor.
Hajm (volume) hali ham faol, ammo so‘nggi ko‘rsatilgan 4H hajmi 5 davrlik o‘rtachasidan past. Buni haqiqiy davom etish deb aytishdan oldin $2.93 dan yuqoriga aniq breakoutni kuchliroq hajm bilan ko‘rishni xohlardim.
Mening fikrim: bullish struktura, haddan tashqari qizib ketgan momentum. Agar $2.63 retracement (tortinish) paytida ushlab qolinsa, xaridorlar nazorati hali ham saqlanib qoladi; $2.40 yo‘qolsa esa setup zaiflashadi.
Siz breakoutni kutasizmi yoki pullback orqali kirishni afzal ko‘rasizmi?
#TRUMP 👉 $ENA ni boy bermang
$TRUMP
tez harakatlanyapti — lekin haqiqiy sinov hali oldinda.
4H jadvalida $TRUMP qisqa muddatli harakatlanuvchi o‘rtachalarni qaytarib olgandan so‘ng atrofida $2.84 da savdolashmoqda. Hozir narx MA(7) da $2.63 va MA(25) da $2.41 ustida; MA(99) esa ancha pastda, taxminan $1.87 yaqinida joylashgan. Bu qisqa muddatda momentum aniq ravishda bullish tomonga o‘zgarganini ko‘rsatadi.
Lekin men bu shamni quvib ketmayman. RSI taxminan 83.5 atrofida: kuchli momentum bor, lekin ehtiyotsiz kirish uchun juda ham oz joy qolgan. Asosiy muammo esa qarshilik: $2.93 — bu darhol 24H yuqori nuqtasi, $3.00 atrofida esa foyda olish ham, yangi likvidlik ham jalb qilinishi ehtimoli bor.
Hajm (volume) hali ham faol, ammo so‘nggi ko‘rsatilgan 4H hajmi 5 davrlik o‘rtachasidan past. Buni haqiqiy davom etish deb aytishdan oldin $2.93 dan yuqoriga aniq breakoutni kuchliroq hajm bilan ko‘rishni xohlardim.
Mening fikrim: bullish struktura, haddan tashqari qizib ketgan momentum. Agar $2.63 retracement (tortinish) paytida ushlab qolinsa, xaridorlar nazorati hali ham saqlanib qoladi; $2.40 yo‘qolsa esa setup zaiflashadi.
Siz breakoutni kutasizmi yoki pullback orqali kirishni afzal ko‘rasizmi?
#TRUMP 👉 $ENA ni boy bermang
tez harakatlanyapti — lekin haqiqiy sinov hali oldinda.
4H jadvalida $TRUMP qisqa muddatli harakatlanuvchi o‘rtachalarni qaytarib olgandan so‘ng atrofida $2.84 da savdolashmoqda. Hozir narx MA(7) da $2.63 va MA(25) da $2.41 ustida; MA(99) esa ancha pastda, taxminan $1.87 yaqinida joylashgan. Bu qisqa muddatda momentum aniq ravishda bullish tomonga o‘zgarganini ko‘rsatadi.
Lekin men bu shamni quvib ketmayman. RSI taxminan 83.5 atrofida: kuchli momentum bor, lekin ehtiyotsiz kirish uchun juda ham oz joy qolgan. Asosiy muammo esa qarshilik: $2.93 — bu darhol 24H yuqori nuqtasi, $3.00 atrofida esa foyda olish ham, yangi likvidlik ham jalb qilinishi ehtimoli bor.
Hajm (volume) hali ham faol, ammo so‘nggi ko‘rsatilgan 4H hajmi 5 davrlik o‘rtachasidan past. Buni haqiqiy davom etish deb aytishdan oldin $2.93 dan yuqoriga aniq breakoutni kuchliroq hajm bilan ko‘rishni xohlardim.
Mening fikrim: bullish struktura, haddan tashqari qizib ketgan momentum. Agar $2.63 retracement (tortinish) paytida ushlab qolinsa, xaridorlar nazorati hali ham saqlanib qoladi; $2.40 yo‘qolsa esa setup zaiflashadi.
Siz breakoutni kutasizmi yoki pullback orqali kirishni afzal ko‘rasizmi?
#TRUMP 👉 $ENA ni boy bermang
1
228
·
--
O‘suvchi
30K savdo $DUSK 8.8K USDT
DUSK haqida qancha ko‘p o‘qisam, shunchalik uning maxfiylik yondashuvi e’tibordan chetda qolayotgandek tuyuladi.
Odamlar “blockchain maxfiyligi” deganda ko‘pincha faqat tranzaksiyalarni yashirishni nazarda tutishadi.
Lekin moliyaviy bozorlar bundan ham murakkabroq.
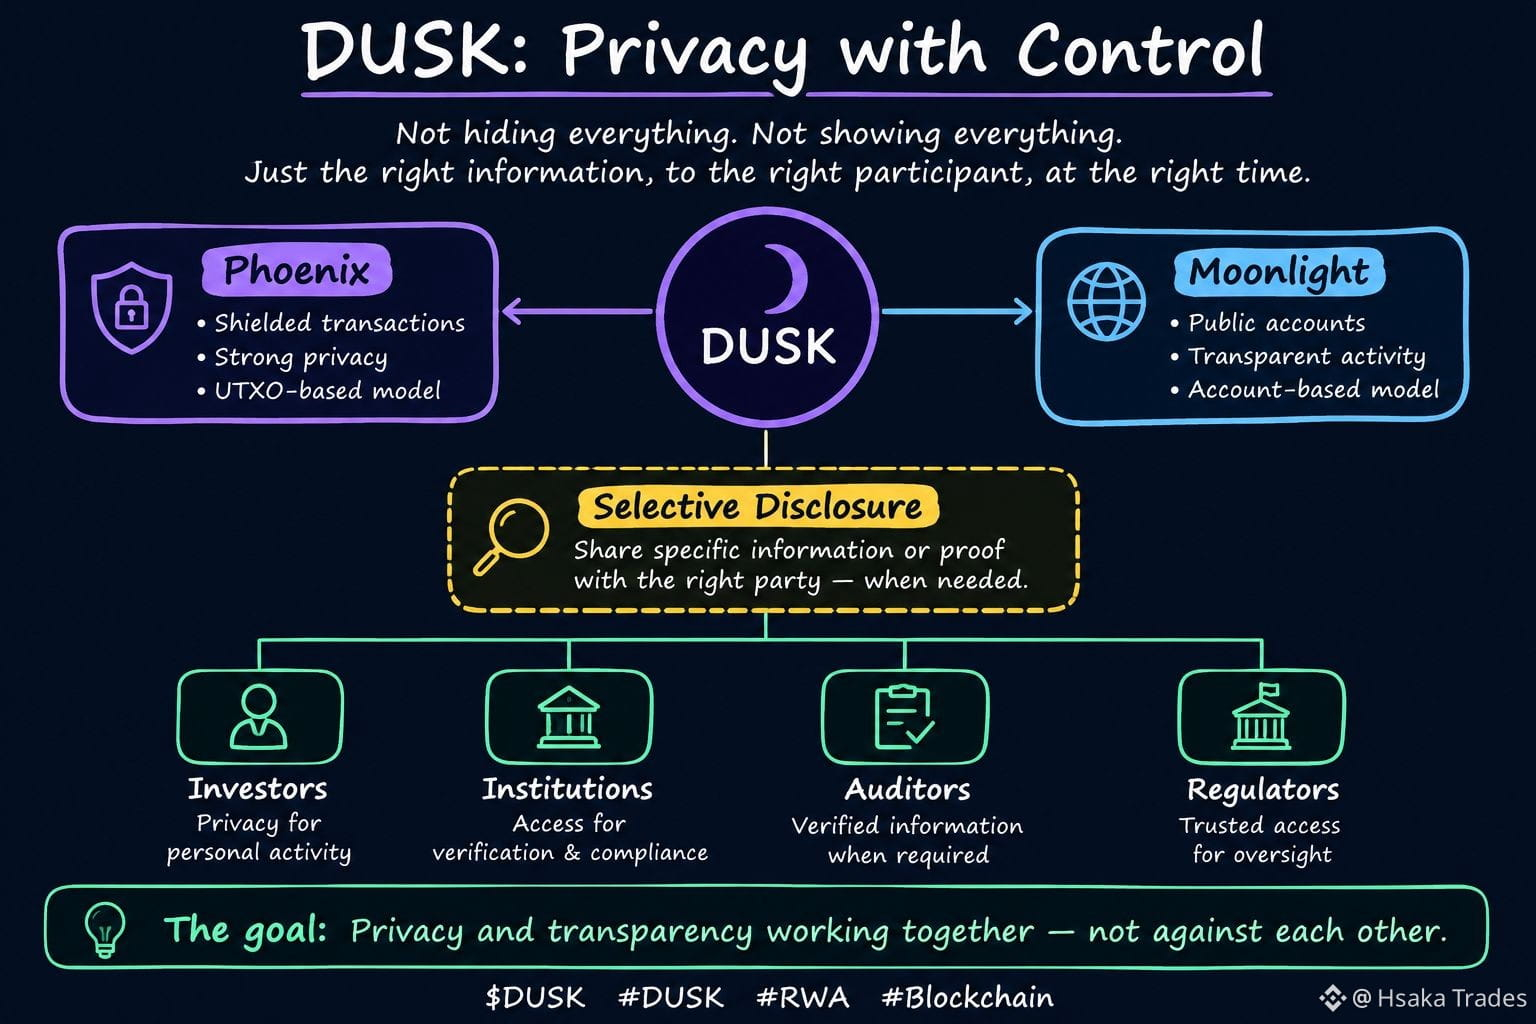
Bank, fond, emissiya qiluvchi yoki investor ayrim ma’lumotlar maxfiy qolishini xohlashi mumkin, biroq auditor yoki vakolatli muassasa tekshiruv uchun muayyan tafsilotlarga baribir kirishi kerak bo‘lishi mumkin.
Mana shunda DUSK qiziq bo‘ladi.
Uning arxitekturasi turli faoliyat turlarini ajratadi. Phoenix himoyalangan tranzaksiyalar uchun mo‘ljallangan, Moonlight esa ochiq, hisobga asoslangan tranzaksiyalardan foydalanadi. Zarurat bo‘lganda, tanlab oshkor qilish muayyan ma’lumotni ochish yoki tasdiqlash imkonini beradi.
Menga bu yondashuv yoqadigan tomoni shundaki, u maxfiylik va oshkoralikni bir-biriga qarama-qarshi narsa sifatida ko‘rsatmaydi.
Ularning turli rollari bo‘lishi mumkin.
Masalan, tokenlashtirilgan real dunyo aktivini olaylik. Men hammaning tranzaksiya tariximni ko‘rishini xohlamasligim mumkin, lekin bu qonuniy muassasa aynan o‘ziga kerak bo‘lgan ma’lumotni tekshira olmasligi kerak degani emas.
Bu farq muhim.
Mening nazarimda, DUSK haqidagi eng katta voqea faqat “RWA uchun maxfiylik” emas.
Bu moliyaviy jarayonning tagida turgan tizimni buzmasdan, turli ishtirokchilarga aynan ularga kerak bo‘lgan ko‘rinish darajasini berish haqida.
Bu real moliyaviy bozorlarga ancha yaqinroq tuyuladi.
Va rostini aytsam, DUSKni chuqurroq o‘rgangan sayin, bu jihat menga yanada yaqqolroq ko‘rinadi.
$DUSK #dusk @Dusk_Foundation
DUSK haqida qancha ko‘p o‘qisam, shunchalik uning maxfiylik yondashuvi e’tibordan chetda qolayotgandek tuyuladi.
Odamlar “blockchain maxfiyligi” deganda ko‘pincha faqat tranzaksiyalarni yashirishni nazarda tutishadi.
Lekin moliyaviy bozorlar bundan ham murakkabroq.
Bank, fond, emissiya qiluvchi yoki investor ayrim ma’lumotlar maxfiy qolishini xohlashi mumkin, biroq auditor yoki vakolatli muassasa tekshiruv uchun muayyan tafsilotlarga baribir kirishi kerak bo‘lishi mumkin.
Mana shunda DUSK qiziq bo‘ladi.
Uning arxitekturasi turli faoliyat turlarini ajratadi. Phoenix himoyalangan tranzaksiyalar uchun mo‘ljallangan, Moonlight esa ochiq, hisobga asoslangan tranzaksiyalardan foydalanadi. Zarurat bo‘lganda, tanlab oshkor qilish muayyan ma’lumotni ochish yoki tasdiqlash imkonini beradi.
Menga bu yondashuv yoqadigan tomoni shundaki, u maxfiylik va oshkoralikni bir-biriga qarama-qarshi narsa sifatida ko‘rsatmaydi.
Ularning turli rollari bo‘lishi mumkin.
Masalan, tokenlashtirilgan real dunyo aktivini olaylik. Men hammaning tranzaksiya tariximni ko‘rishini xohlamasligim mumkin, lekin bu qonuniy muassasa aynan o‘ziga kerak bo‘lgan ma’lumotni tekshira olmasligi kerak degani emas.
Bu farq muhim.
Mening nazarimda, DUSK haqidagi eng katta voqea faqat “RWA uchun maxfiylik” emas.
Bu moliyaviy jarayonning tagida turgan tizimni buzmasdan, turli ishtirokchilarga aynan ularga kerak bo‘lgan ko‘rinish darajasini berish haqida.
Bu real moliyaviy bozorlarga ancha yaqinroq tuyuladi.
Va rostini aytsam, DUSKni chuqurroq o‘rgangan sayin, bu jihat menga yanada yaqqolroq ko‘rinadi.
$DUSK #dusk @Dusk
Odamlar “blockchain maxfiyligi” deganda ko‘pincha faqat tranzaksiyalarni yashirishni nazarda tutishadi.
Lekin moliyaviy bozorlar bundan ham murakkabroq.
Bank, fond, emissiya qiluvchi yoki investor ayrim ma’lumotlar maxfiy qolishini xohlashi mumkin, biroq auditor yoki vakolatli muassasa tekshiruv uchun muayyan tafsilotlarga baribir kirishi kerak bo‘lishi mumkin.
Mana shunda DUSK qiziq bo‘ladi.
Uning arxitekturasi turli faoliyat turlarini ajratadi. Phoenix himoyalangan tranzaksiyalar uchun mo‘ljallangan, Moonlight esa ochiq, hisobga asoslangan tranzaksiyalardan foydalanadi. Zarurat bo‘lganda, tanlab oshkor qilish muayyan ma’lumotni ochish yoki tasdiqlash imkonini beradi.
Menga bu yondashuv yoqadigan tomoni shundaki, u maxfiylik va oshkoralikni bir-biriga qarama-qarshi narsa sifatida ko‘rsatmaydi.
Ularning turli rollari bo‘lishi mumkin.
Masalan, tokenlashtirilgan real dunyo aktivini olaylik. Men hammaning tranzaksiya tariximni ko‘rishini xohlamasligim mumkin, lekin bu qonuniy muassasa aynan o‘ziga kerak bo‘lgan ma’lumotni tekshira olmasligi kerak degani emas.
Bu farq muhim.
Mening nazarimda, DUSK haqidagi eng katta voqea faqat “RWA uchun maxfiylik” emas.
Bu moliyaviy jarayonning tagida turgan tizimni buzmasdan, turli ishtirokchilarga aynan ularga kerak bo‘lgan ko‘rinish darajasini berish haqida.
Bu real moliyaviy bozorlarga ancha yaqinroq tuyuladi.
Va rostini aytsam, DUSKni chuqurroq o‘rgangan sayin, bu jihat menga yanada yaqqolroq ko‘rinadi.
$DUSK #dusk @Dusk
1
37
·
--
30K savdo $DUSK 6.3K USDT
#dusk $DUSK @Dusk_Foundation
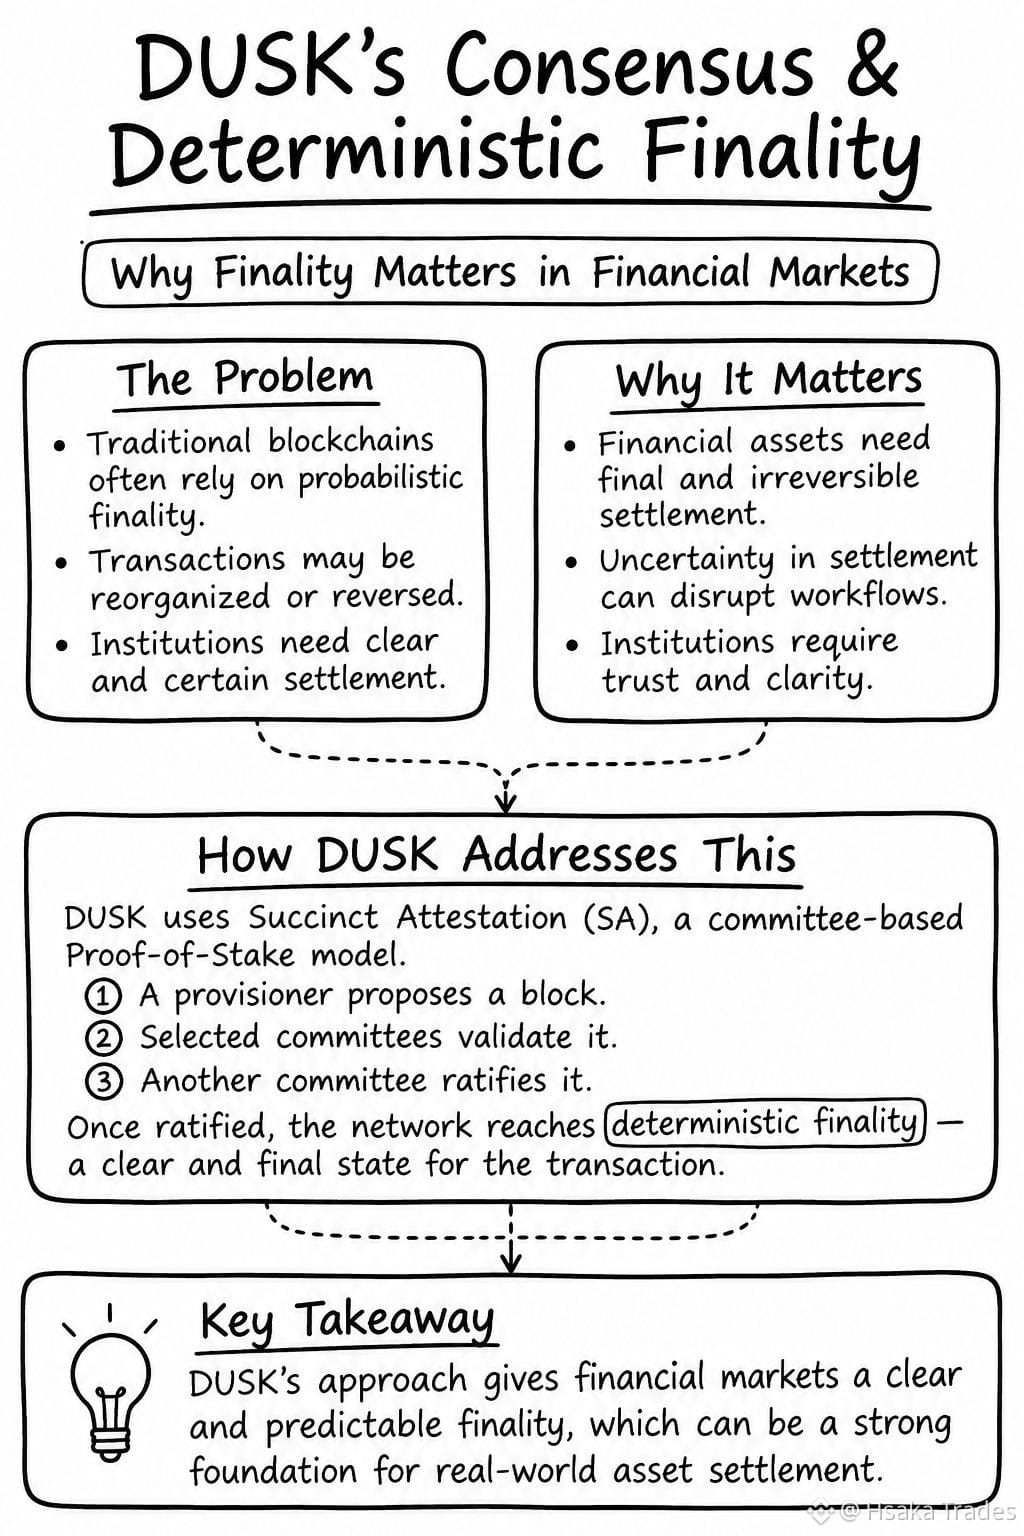
Men Dusk’ning konsensus dizaynini ko‘rib chiqayotganimda bitta oddiy savolga tiqilib qoldim: tranzaksiya qachon amalda yakuniy hisoblanadi?
Dusk’ning Succinct Attestation (SA) butun tarmoqdan konsensusning har bir qismini qabul qilishni talab qiladigan yo‘ldan boshqa yo‘lni tanlaydi. Provisioner bir blok taklif qiladi, tanlangan komitetlar uni tekshiradi va blok keyin ratifikatsiya qilinadi. Ratifikatsiyadan so‘ng tarmoq deterministik yakuniylikka erishadi.
Bu ayniqsa ko‘chirilayotgan aktiv moliyaviy aktiv bo‘lsa juda muhim.
Tokenlashtirilgan qimmatli qog‘ozlar bilan hisob-kitob noaniq bo‘la olmaydi. Muassasa transfer tugallangan deb hisoblanadigan aniq nuqtaga muhtoj, chunki undan keyin keladigan hamma narsa — yozuvlar, moslashtirish (reconciliation) va keyingi tranzaksiya — shu holatga bog‘liq.
Meningcha, Dusk’ning aynan shu qismi ko‘proq e’tiborga loyiq. SA faqat kelishuvga erishish haqida emas; u ehtimoliy (probabilistik) tasdiqqa tayanmasdan, aniq natijaga erishishga qurilgan.
Dusk tilga olinganda maxfiylik ko‘proq e’tibor oladi. Adolatli. Ammo konsensus qatlamining qiziqarli tomoni boshqa: moliyaviy bozorlar aniq qayerda turganini bilishi kerak.
Tez tranzaksiya foydali. Aniq yakuniylikka ega tranzaksiya esa atrofida jarayonlar qurish mumkin bo‘lgan narsa.
Real hayotdagi aktivlar on-chain’ga ko‘chib borgan sari, bu farq anchagina ahamiyat kasb etishi mumkin.
Tezroq blokcheynlarni qurish poygasida deterministik yakuniylik e’tibordan chetda qolmayaptimi?
#dusk $DUSK @Dusk
Men Dusk’ning konsensus dizaynini ko‘rib chiqayotganimda bitta oddiy savolga tiqilib qoldim: tranzaksiya qachon amalda yakuniy hisoblanadi?
Dusk’ning Succinct Attestation (SA) butun tarmoqdan konsensusning har bir qismini qabul qilishni talab qiladigan yo‘ldan boshqa yo‘lni tanlaydi. Provisioner bir blok taklif qiladi, tanlangan komitetlar uni tekshiradi va blok keyin ratifikatsiya qilinadi. Ratifikatsiyadan so‘ng tarmoq deterministik yakuniylikka erishadi.
Bu ayniqsa ko‘chirilayotgan aktiv moliyaviy aktiv bo‘lsa juda muhim.
Tokenlashtirilgan qimmatli qog‘ozlar bilan hisob-kitob noaniq bo‘la olmaydi. Muassasa transfer tugallangan deb hisoblanadigan aniq nuqtaga muhtoj, chunki undan keyin keladigan hamma narsa — yozuvlar, moslashtirish (reconciliation) va keyingi tranzaksiya — shu holatga bog‘liq.
Meningcha, Dusk’ning aynan shu qismi ko‘proq e’tiborga loyiq. SA faqat kelishuvga erishish haqida emas; u ehtimoliy (probabilistik) tasdiqqa tayanmasdan, aniq natijaga erishishga qurilgan.
Dusk tilga olinganda maxfiylik ko‘proq e’tibor oladi. Adolatli. Ammo konsensus qatlamining qiziqarli tomoni boshqa: moliyaviy bozorlar aniq qayerda turganini bilishi kerak.
Tez tranzaksiya foydali. Aniq yakuniylikka ega tranzaksiya esa atrofida jarayonlar qurish mumkin bo‘lgan narsa.
Real hayotdagi aktivlar on-chain’ga ko‘chib borgan sari, bu farq anchagina ahamiyat kasb etishi mumkin.
Tezroq blokcheynlarni qurish poygasida deterministik yakuniylik e’tibordan chetda qolmayaptimi?
Men Dusk’ning konsensus dizaynini ko‘rib chiqayotganimda bitta oddiy savolga tiqilib qoldim: tranzaksiya qachon amalda yakuniy hisoblanadi?
Dusk’ning Succinct Attestation (SA) butun tarmoqdan konsensusning har bir qismini qabul qilishni talab qiladigan yo‘ldan boshqa yo‘lni tanlaydi. Provisioner bir blok taklif qiladi, tanlangan komitetlar uni tekshiradi va blok keyin ratifikatsiya qilinadi. Ratifikatsiyadan so‘ng tarmoq deterministik yakuniylikka erishadi.
Bu ayniqsa ko‘chirilayotgan aktiv moliyaviy aktiv bo‘lsa juda muhim.
Tokenlashtirilgan qimmatli qog‘ozlar bilan hisob-kitob noaniq bo‘la olmaydi. Muassasa transfer tugallangan deb hisoblanadigan aniq nuqtaga muhtoj, chunki undan keyin keladigan hamma narsa — yozuvlar, moslashtirish (reconciliation) va keyingi tranzaksiya — shu holatga bog‘liq.
Meningcha, Dusk’ning aynan shu qismi ko‘proq e’tiborga loyiq. SA faqat kelishuvga erishish haqida emas; u ehtimoliy (probabilistik) tasdiqqa tayanmasdan, aniq natijaga erishishga qurilgan.
Dusk tilga olinganda maxfiylik ko‘proq e’tibor oladi. Adolatli. Ammo konsensus qatlamining qiziqarli tomoni boshqa: moliyaviy bozorlar aniq qayerda turganini bilishi kerak.
Tez tranzaksiya foydali. Aniq yakuniylikka ega tranzaksiya esa atrofida jarayonlar qurish mumkin bo‘lgan narsa.
Real hayotdagi aktivlar on-chain’ga ko‘chib borgan sari, bu farq anchagina ahamiyat kasb etishi mumkin.
Tezroq blokcheynlarni qurish poygasida deterministik yakuniylik e’tibordan chetda qolmayaptimi?
2
1
6
181
·
--
30K savdo $DUSK 5.9K USDT
#dusk $DUSK @Dusk_Foundation
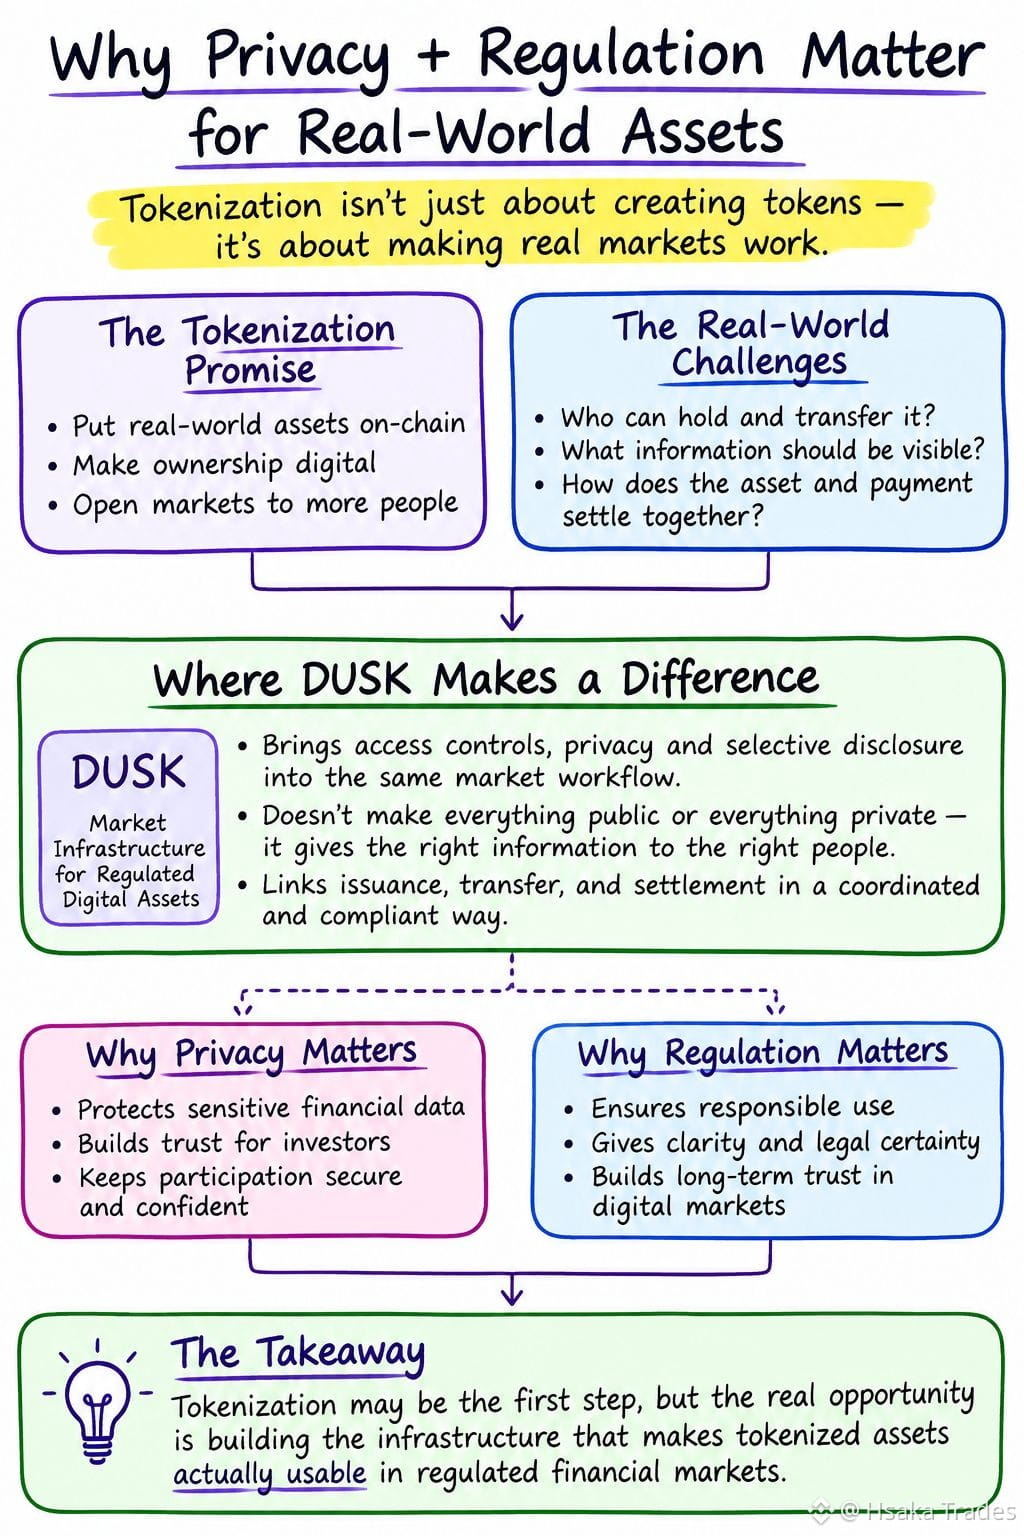
Men RWA tokenizatsiyasiga qanchalik chuqurroq kirib borsam, tokenni yaratish qiyin emasligini shunchalik ko‘proq angladim.
Eng qiyin qismi esa keyin boshlanadi.
Tartibga solingan aktiv hali ham uni kim ushlab turishi, uni kimga o‘tkazishi mumkinligi, qaysi ma’lumotlar ko‘rinishi kerakligi va aktiv hamda to‘lov qanday birga hisob-kitob qilinishini belgilaydigan qoidalarga muhtoj bo‘ladi. Ana shu bo‘laklar turli tizimlarda joylashganda, moslashtirish (reconciliation) va qo‘lda bajariladigan jarayonlar yana bir muammoga aylanishi mumkin.
Menga eng ko‘p ajralib turadigan narsa aynan shu—$DUSK .
DUSK kirish nazorati, maxfiylik, tanlab oshkor qilish va hisob-kitobni ayni bitta bozor infratuzilmasi bo‘yicha suhbatga olib kiradi. Qiziq jihat shundaki, maxfiylik hamma narsani butunlay ko‘rinmas qilish degani emas. Vakolatli tomonlar har bir moliyaviy tafsilotni hammaga oshkor qilmasdan, o‘zlariga kerak bo‘lgan ma’lumotni baribir olishlari mumkin.
Bu farq real moliyaviy bozorlarda muhim.
Ehtimol, tokenizatsiyaning o‘zi eng katta yutuq emasdir.
Ehtimol, kattaroq imkoniyat—tokenizatsiya qilingan aktivlarni aslida ishlatish mumkin bo‘ladigan infratuzilmani yaratishdir.
Men DUSK hikoyasining ana shu qismi ko‘proq e’tibor talab qiladi, deb o‘ylayman.
Keyingi RWA (real aktivlar) bo‘yicha musobaqa haqiqatan ham token ortidagi infratuzilma haqida bo‘ladimi?
#dusk $DUSK @Dusk
Men RWA tokenizatsiyasiga qanchalik chuqurroq kirib borsam, tokenni yaratish qiyin emasligini shunchalik ko‘proq angladim.
Eng qiyin qismi esa keyin boshlanadi.
Tartibga solingan aktiv hali ham uni kim ushlab turishi, uni kimga o‘tkazishi mumkinligi, qaysi ma’lumotlar ko‘rinishi kerakligi va aktiv hamda to‘lov qanday birga hisob-kitob qilinishini belgilaydigan qoidalarga muhtoj bo‘ladi. Ana shu bo‘laklar turli tizimlarda joylashganda, moslashtirish (reconciliation) va qo‘lda bajariladigan jarayonlar yana bir muammoga aylanishi mumkin.
Menga eng ko‘p ajralib turadigan narsa aynan shu—$DUSK .
DUSK kirish nazorati, maxfiylik, tanlab oshkor qilish va hisob-kitobni ayni bitta bozor infratuzilmasi bo‘yicha suhbatga olib kiradi. Qiziq jihat shundaki, maxfiylik hamma narsani butunlay ko‘rinmas qilish degani emas. Vakolatli tomonlar har bir moliyaviy tafsilotni hammaga oshkor qilmasdan, o‘zlariga kerak bo‘lgan ma’lumotni baribir olishlari mumkin.
Bu farq real moliyaviy bozorlarda muhim.
Ehtimol, tokenizatsiyaning o‘zi eng katta yutuq emasdir.
Ehtimol, kattaroq imkoniyat—tokenizatsiya qilingan aktivlarni aslida ishlatish mumkin bo‘ladigan infratuzilmani yaratishdir.
Men DUSK hikoyasining ana shu qismi ko‘proq e’tibor talab qiladi, deb o‘ylayman.
Keyingi RWA (real aktivlar) bo‘yicha musobaqa haqiqatan ham token ortidagi infratuzilma haqida bo‘ladimi?
Men RWA tokenizatsiyasiga qanchalik chuqurroq kirib borsam, tokenni yaratish qiyin emasligini shunchalik ko‘proq angladim.
Eng qiyin qismi esa keyin boshlanadi.
Tartibga solingan aktiv hali ham uni kim ushlab turishi, uni kimga o‘tkazishi mumkinligi, qaysi ma’lumotlar ko‘rinishi kerakligi va aktiv hamda to‘lov qanday birga hisob-kitob qilinishini belgilaydigan qoidalarga muhtoj bo‘ladi. Ana shu bo‘laklar turli tizimlarda joylashganda, moslashtirish (reconciliation) va qo‘lda bajariladigan jarayonlar yana bir muammoga aylanishi mumkin.
Menga eng ko‘p ajralib turadigan narsa aynan shu—$DUSK .
DUSK kirish nazorati, maxfiylik, tanlab oshkor qilish va hisob-kitobni ayni bitta bozor infratuzilmasi bo‘yicha suhbatga olib kiradi. Qiziq jihat shundaki, maxfiylik hamma narsani butunlay ko‘rinmas qilish degani emas. Vakolatli tomonlar har bir moliyaviy tafsilotni hammaga oshkor qilmasdan, o‘zlariga kerak bo‘lgan ma’lumotni baribir olishlari mumkin.
Bu farq real moliyaviy bozorlarda muhim.
Ehtimol, tokenizatsiyaning o‘zi eng katta yutuq emasdir.
Ehtimol, kattaroq imkoniyat—tokenizatsiya qilingan aktivlarni aslida ishlatish mumkin bo‘ladigan infratuzilmani yaratishdir.
Men DUSK hikoyasining ana shu qismi ko‘proq e’tibor talab qiladi, deb o‘ylayman.
Keyingi RWA (real aktivlar) bo‘yicha musobaqa haqiqatan ham token ortidagi infratuzilma haqida bo‘ladimi?
4
155
·
--
30K savdo $DUSK 4.7K USDT
#dusk $DUSK @Dusk_Foundation
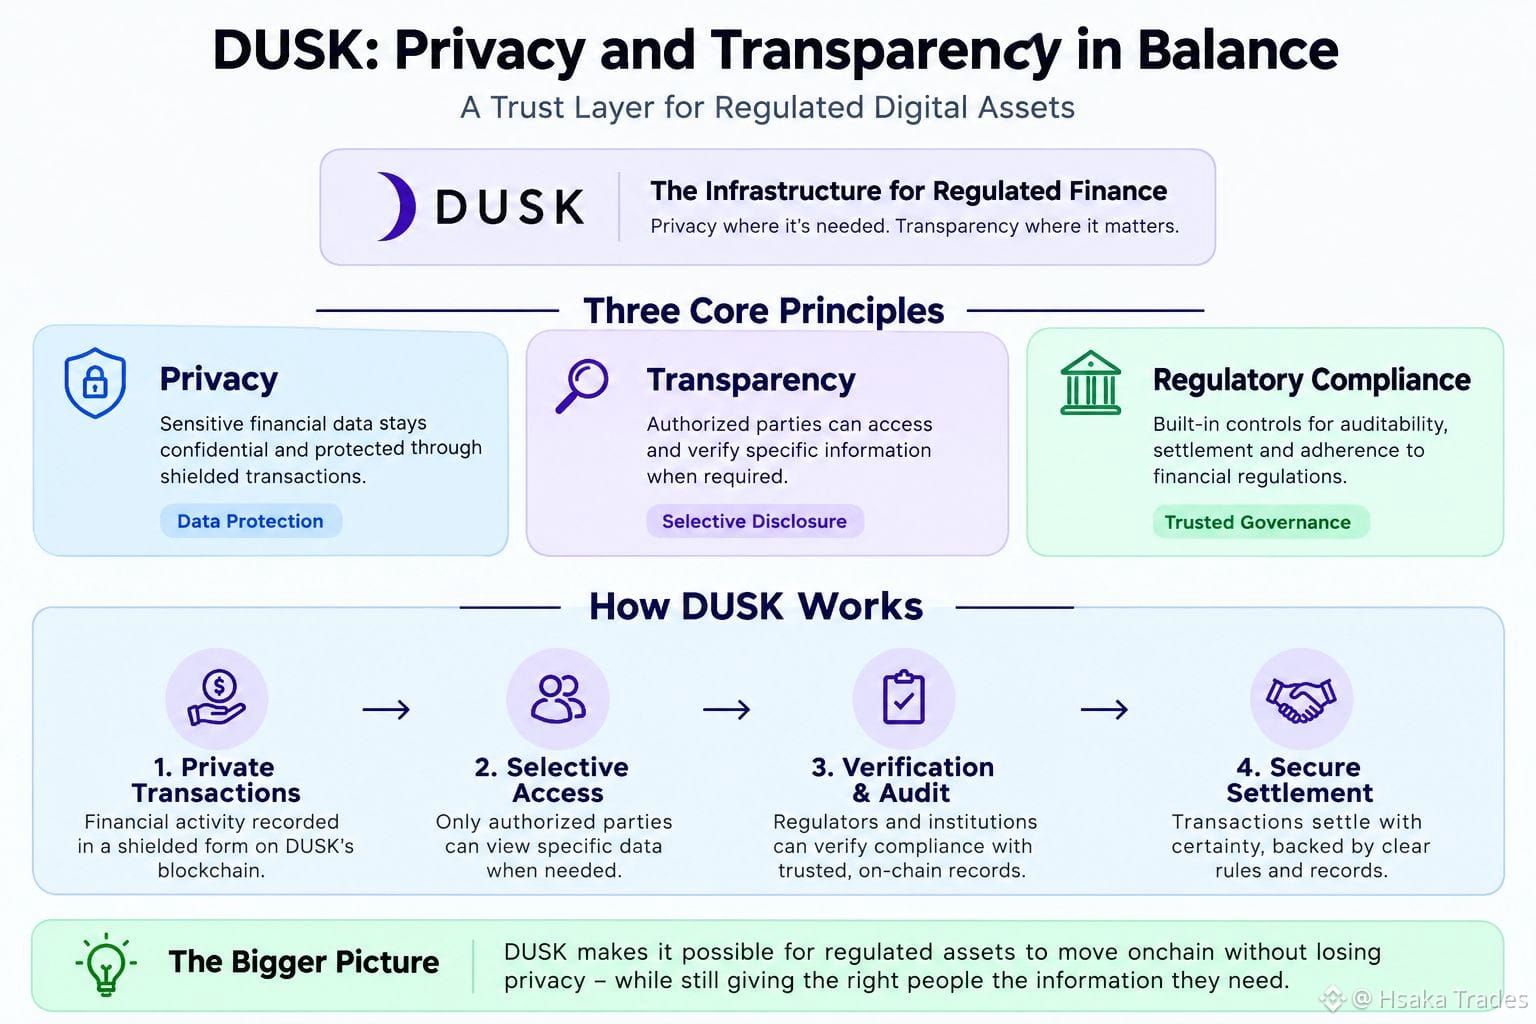
Men DUSKni ko‘rib chiqayotganimda, oddiyroq bir narsani o‘ylab qoldim: moliyaviy maxfiylikni to‘g‘ri qilish aslida juda qiyin.
Bank har bir mijozning pozitsiyasini, savdo tafsilotini yoki mulkchilik yozuvini ommaviy reestrga joylay olmaydi. Ammo tartibga soluvchilar baribir nima bo‘lganini bilishi va qoidalar bajarilganini tekshirishi kerak.
Maqsad shunda.
Hammasini ommaga chiqarish shart emas. Kerak bo‘lganda, aynan o‘sha paytda mavjud bo‘lishi kerak bo‘lgan to‘g‘ri ma’lumot kerak.
DUSK buni himoyalangan (shielded) tranzaksiyalar va tanlab oshkor qilish yondashuvi bilan amalga oshiradi. Nozik faoliyat maxfiy qolishi mumkin, shu bilan birga vakolatli tomonlar zarur bo‘lganda muayyan ma’lumotni tekshirishi ham mumkin.
Tokenizatsiya qilingan qimmatli qog‘ozlar uchun bu shunchaki aktivni onchain’ga joylashdan ham oshadi. Investor tekshiruvlari, o‘tkazish cheklovlari, mulkchilik yozuvlari, hisobot va hisob-kitob kabi masalalar ham bor. Dusk tokenizatsiyani shunchaki yana bir token deb ko‘rishdan ko‘ra, jarayonning o‘sha qismlari atrofida qurilyapti.
Menga oson tuyulgan tomoni ham shumi.
Agar jiddiy moliyaviy aktivlar onchain’ga o‘tsa, hamma narsaning hamma uchun ko‘rinishi shartmi?
#dusk $DUSK @Dusk
Men DUSKni ko‘rib chiqayotganimda, oddiyroq bir narsani o‘ylab qoldim: moliyaviy maxfiylikni to‘g‘ri qilish aslida juda qiyin.
Bank har bir mijozning pozitsiyasini, savdo tafsilotini yoki mulkchilik yozuvini ommaviy reestrga joylay olmaydi. Ammo tartibga soluvchilar baribir nima bo‘lganini bilishi va qoidalar bajarilganini tekshirishi kerak.
Maqsad shunda.
Hammasini ommaga chiqarish shart emas. Kerak bo‘lganda, aynan o‘sha paytda mavjud bo‘lishi kerak bo‘lgan to‘g‘ri ma’lumot kerak.
DUSK buni himoyalangan (shielded) tranzaksiyalar va tanlab oshkor qilish yondashuvi bilan amalga oshiradi. Nozik faoliyat maxfiy qolishi mumkin, shu bilan birga vakolatli tomonlar zarur bo‘lganda muayyan ma’lumotni tekshirishi ham mumkin.
Tokenizatsiya qilingan qimmatli qog‘ozlar uchun bu shunchaki aktivni onchain’ga joylashdan ham oshadi. Investor tekshiruvlari, o‘tkazish cheklovlari, mulkchilik yozuvlari, hisobot va hisob-kitob kabi masalalar ham bor. Dusk tokenizatsiyani shunchaki yana bir token deb ko‘rishdan ko‘ra, jarayonning o‘sha qismlari atrofida qurilyapti.
Menga oson tuyulgan tomoni ham shumi.
Agar jiddiy moliyaviy aktivlar onchain’ga o‘tsa, hamma narsaning hamma uchun ko‘rinishi shartmi?
Men DUSKni ko‘rib chiqayotganimda, oddiyroq bir narsani o‘ylab qoldim: moliyaviy maxfiylikni to‘g‘ri qilish aslida juda qiyin.
Bank har bir mijozning pozitsiyasini, savdo tafsilotini yoki mulkchilik yozuvini ommaviy reestrga joylay olmaydi. Ammo tartibga soluvchilar baribir nima bo‘lganini bilishi va qoidalar bajarilganini tekshirishi kerak.
Maqsad shunda.
Hammasini ommaga chiqarish shart emas. Kerak bo‘lganda, aynan o‘sha paytda mavjud bo‘lishi kerak bo‘lgan to‘g‘ri ma’lumot kerak.
DUSK buni himoyalangan (shielded) tranzaksiyalar va tanlab oshkor qilish yondashuvi bilan amalga oshiradi. Nozik faoliyat maxfiy qolishi mumkin, shu bilan birga vakolatli tomonlar zarur bo‘lganda muayyan ma’lumotni tekshirishi ham mumkin.
Tokenizatsiya qilingan qimmatli qog‘ozlar uchun bu shunchaki aktivni onchain’ga joylashdan ham oshadi. Investor tekshiruvlari, o‘tkazish cheklovlari, mulkchilik yozuvlari, hisobot va hisob-kitob kabi masalalar ham bor. Dusk tokenizatsiyani shunchaki yana bir token deb ko‘rishdan ko‘ra, jarayonning o‘sha qismlari atrofida qurilyapti.
Menga oson tuyulgan tomoni ham shumi.
Agar jiddiy moliyaviy aktivlar onchain’ga o‘tsa, hamma narsaning hamma uchun ko‘rinishi shartmi?
1
195
·
--
🎙️ @Dusk's trading tahlili
mutaxassis fikrlari bozor tendensiyalari

Tugashi
03 soat 37 daqiqa 24 soniya
281
3
0
·
--
Tasdiqlangan
30K savdo $DUSK 3.4K USDT
#dusk $DUSK @Dusk_Foundation
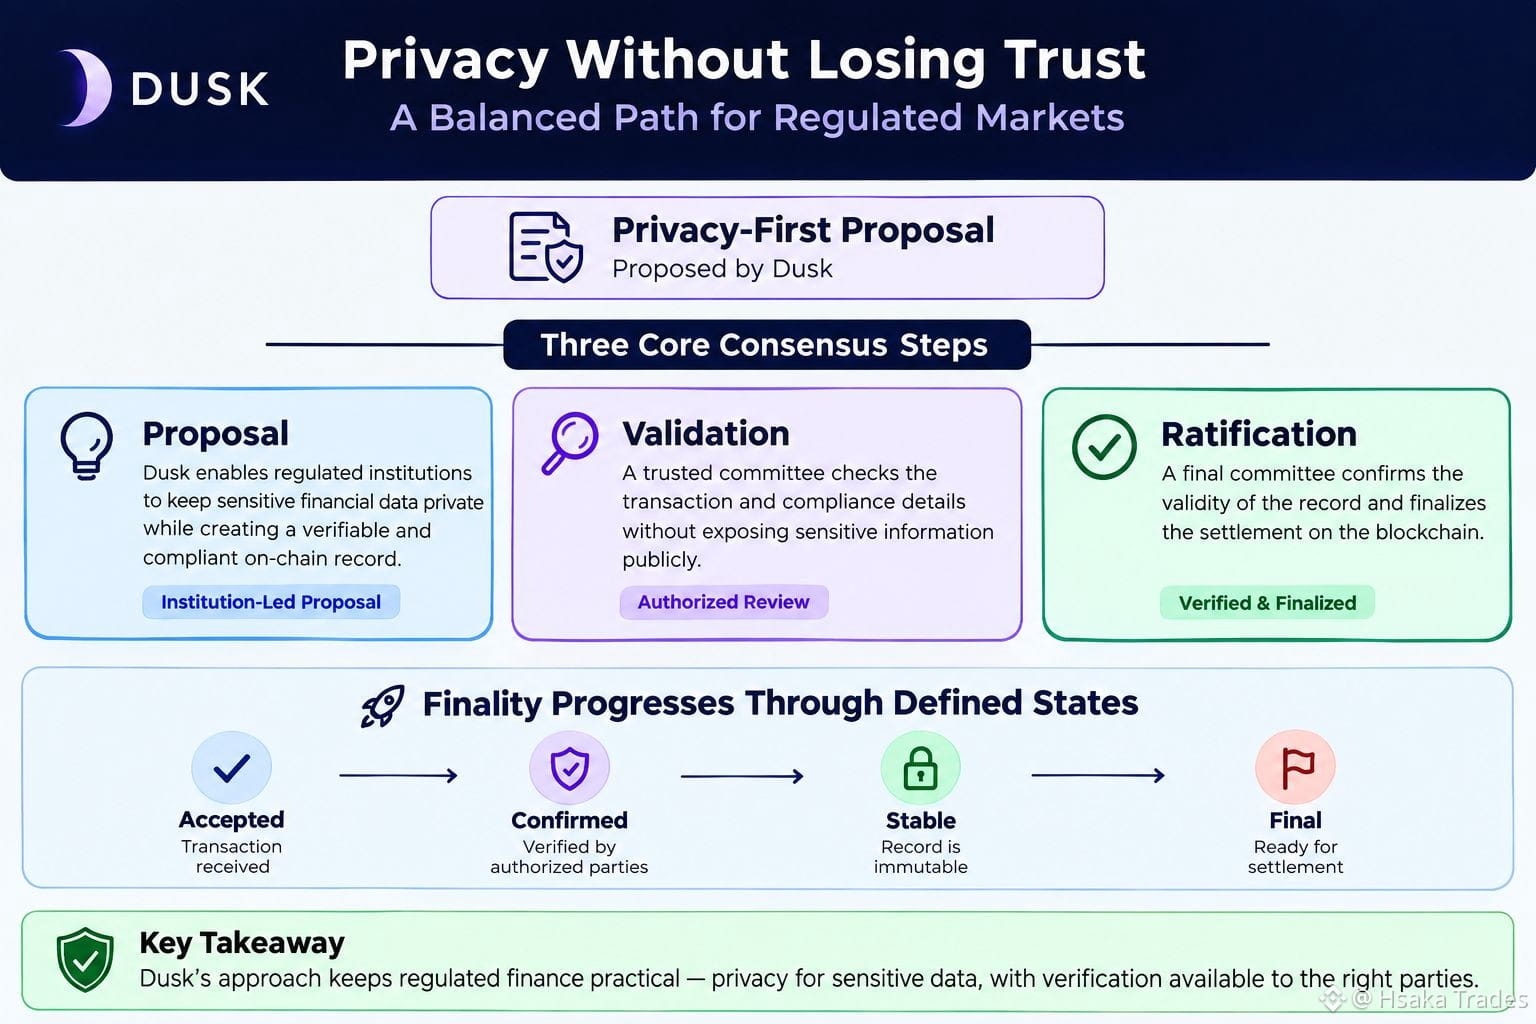
Men Dusk va NPEX haqida o‘qiyotgan edim, asosiy hikoya tokenizatsiyalangan qimmatli qog‘ozlar haqida bo‘lishini kutgandim. Meni eng ko‘proq o‘ylantirgan narsa esa unchalik ko‘zga tashlanmaydigan jihat bo‘ldi: moliyaviy ma’lumotlar qanchalik sezgir ekanligi va u qanday boshqarilishi.
Dusk NPEXni Niderlandiyada joylashgan, AUMi taxminan €300M bo‘lgan birja sifatida ta’riflaydi va ularning tartibga solingan qimmatli qog‘ozlarni on-chein qilish ustida ishlayotganini aytadi.
Bu meni tartibga solingan bozor ichida aslida nima bo‘layotgani haqida o‘ylantirdi. Investorlar ma’lumotlari, egalik yozuvlari, tranzaksiyalar va muvofiqlik (compliance) ma’lumotlari barchasi ehtiyotkorlik bilan ishlov berishni talab qiladi. Nazorat qiluvchi organlar hamda vakolatli ishtirokchilarga faoliyatni tekshirish uchun yetarli ma’lumot kerak, biroq har bir detallarni ommaga ochiq ko‘rsatish esa boshqa bir muammo keltirib chiqarishi mumkin.
Meni eng qiziqtiradigan qismi aynan Duskning shu tomonidir.
Gap faqat ma’lumotni yashirish haqida emas. Sezgir ma’lumotlar himoyalangan holda qolishi mumkin, bunda esa to‘g‘ri taraflar muvofiqlik, hisob-kitob (settlement) va rekonsilyatsiya uchun nimalar kerak bo‘lsa, baribir tekshira oladi.
Bu menga odatiy tokenizatsiya haqidagi hikoyadan ko‘ra ko‘proq amaliy tuyuladi. Agar blokcheyn tartibga solingan qimmatli qog‘ozlarni qo‘llab-quvvatlamoqchi bo‘lsa, u faqat aktivni raqamli ko‘rinishda ifodalash bilan cheklanmasdan, ularning ortidagi real jarayonlarni ham uddalashi kerak.
Moliyaviy bozorlarda maxfiylik va audit (tekshiruvga yaroqlilik) birga ishlay oladimi?
#dusk $DUSK @Dusk
Men Dusk va NPEX haqida o‘qiyotgan edim, asosiy hikoya tokenizatsiyalangan qimmatli qog‘ozlar haqida bo‘lishini kutgandim. Meni eng ko‘proq o‘ylantirgan narsa esa unchalik ko‘zga tashlanmaydigan jihat bo‘ldi: moliyaviy ma’lumotlar qanchalik sezgir ekanligi va u qanday boshqarilishi.
Dusk NPEXni Niderlandiyada joylashgan, AUMi taxminan €300M bo‘lgan birja sifatida ta’riflaydi va ularning tartibga solingan qimmatli qog‘ozlarni on-chein qilish ustida ishlayotganini aytadi.
Bu meni tartibga solingan bozor ichida aslida nima bo‘layotgani haqida o‘ylantirdi. Investorlar ma’lumotlari, egalik yozuvlari, tranzaksiyalar va muvofiqlik (compliance) ma’lumotlari barchasi ehtiyotkorlik bilan ishlov berishni talab qiladi. Nazorat qiluvchi organlar hamda vakolatli ishtirokchilarga faoliyatni tekshirish uchun yetarli ma’lumot kerak, biroq har bir detallarni ommaga ochiq ko‘rsatish esa boshqa bir muammo keltirib chiqarishi mumkin.
Meni eng qiziqtiradigan qismi aynan Duskning shu tomonidir.
Gap faqat ma’lumotni yashirish haqida emas. Sezgir ma’lumotlar himoyalangan holda qolishi mumkin, bunda esa to‘g‘ri taraflar muvofiqlik, hisob-kitob (settlement) va rekonsilyatsiya uchun nimalar kerak bo‘lsa, baribir tekshira oladi.
Bu menga odatiy tokenizatsiya haqidagi hikoyadan ko‘ra ko‘proq amaliy tuyuladi. Agar blokcheyn tartibga solingan qimmatli qog‘ozlarni qo‘llab-quvvatlamoqchi bo‘lsa, u faqat aktivni raqamli ko‘rinishda ifodalash bilan cheklanmasdan, ularning ortidagi real jarayonlarni ham uddalashi kerak.
Moliyaviy bozorlarda maxfiylik va audit (tekshiruvga yaroqlilik) birga ishlay oladimi?
Men Dusk va NPEX haqida o‘qiyotgan edim, asosiy hikoya tokenizatsiyalangan qimmatli qog‘ozlar haqida bo‘lishini kutgandim. Meni eng ko‘proq o‘ylantirgan narsa esa unchalik ko‘zga tashlanmaydigan jihat bo‘ldi: moliyaviy ma’lumotlar qanchalik sezgir ekanligi va u qanday boshqarilishi.
Dusk NPEXni Niderlandiyada joylashgan, AUMi taxminan €300M bo‘lgan birja sifatida ta’riflaydi va ularning tartibga solingan qimmatli qog‘ozlarni on-chein qilish ustida ishlayotganini aytadi.
Bu meni tartibga solingan bozor ichida aslida nima bo‘layotgani haqida o‘ylantirdi. Investorlar ma’lumotlari, egalik yozuvlari, tranzaksiyalar va muvofiqlik (compliance) ma’lumotlari barchasi ehtiyotkorlik bilan ishlov berishni talab qiladi. Nazorat qiluvchi organlar hamda vakolatli ishtirokchilarga faoliyatni tekshirish uchun yetarli ma’lumot kerak, biroq har bir detallarni ommaga ochiq ko‘rsatish esa boshqa bir muammo keltirib chiqarishi mumkin.
Meni eng qiziqtiradigan qismi aynan Duskning shu tomonidir.
Gap faqat ma’lumotni yashirish haqida emas. Sezgir ma’lumotlar himoyalangan holda qolishi mumkin, bunda esa to‘g‘ri taraflar muvofiqlik, hisob-kitob (settlement) va rekonsilyatsiya uchun nimalar kerak bo‘lsa, baribir tekshira oladi.
Bu menga odatiy tokenizatsiya haqidagi hikoyadan ko‘ra ko‘proq amaliy tuyuladi. Agar blokcheyn tartibga solingan qimmatli qog‘ozlarni qo‘llab-quvvatlamoqchi bo‘lsa, u faqat aktivni raqamli ko‘rinishda ifodalash bilan cheklanmasdan, ularning ortidagi real jarayonlarni ham uddalashi kerak.
Moliyaviy bozorlarda maxfiylik va audit (tekshiruvga yaroqlilik) birga ishlay oladimi?
1
2
143
·
--
Tasdiqlangan
30K savdo $DUSK 3.2K USDT
DUSK ekotizimi bo‘yicha yangiliklar
Dusk ekotizimi qiziqarli yondashuvni tanlagan: maxfiylik va ommaviy tranzaksiyalar bir-biridan butunlay ajratilgan tizimlar sifatida qaralmasdan birga mavjud bo‘lishi mumkin.
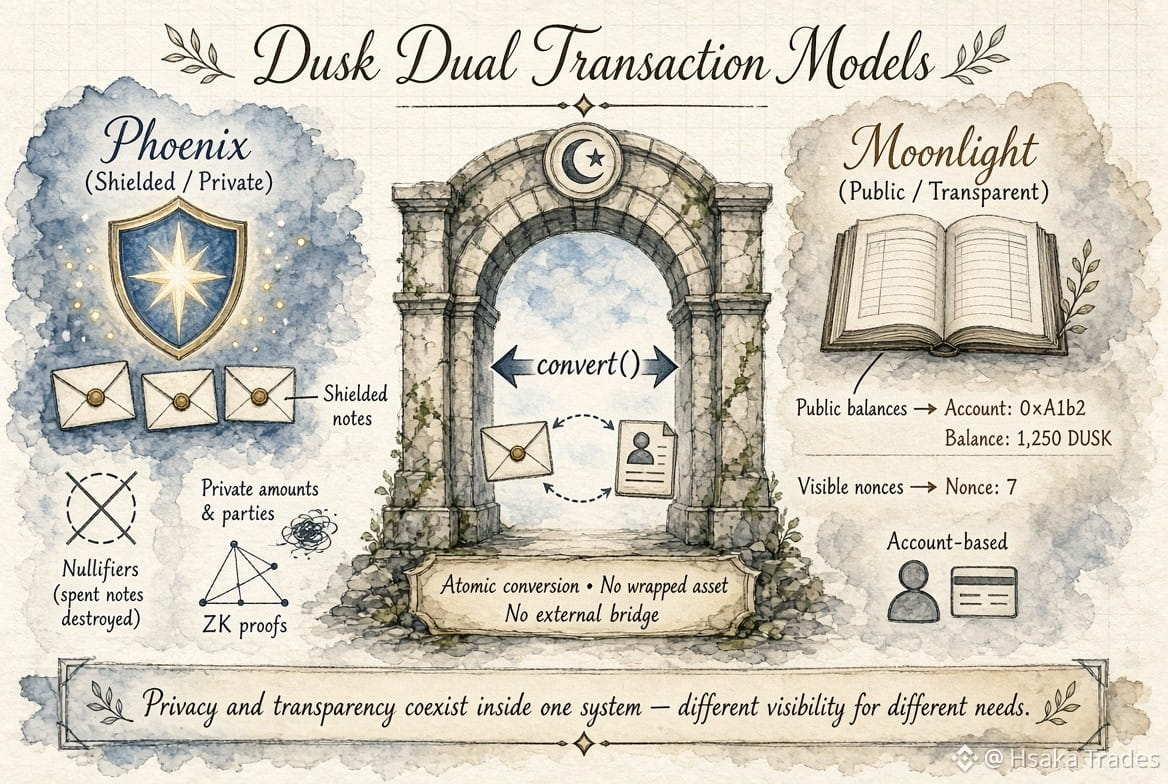
Duskda ikkita alohida tranzaksiya modeli bor: Phoenix va Moonlight.
Phoenix — UTXO-ga asoslangan bo‘lib, tranzaksiya ma’lumotlarini maxfiy saqlash uchun shielded (yashirilgan) note’lar va nullifierlardan foydalanadi. Moonlight esa account-ga asoslangan: balanslar va noncelar omma uchun ko‘rinib turadi.
Asosiy bog‘lovchi mexanizm — Transfer Contract. Uning "convert" funksiyasi shartnoma oqimi (contract flow) ichida Phoenix shielded note va Moonlight public account balansi o‘rtasida ekvivalent qiymatni ko‘chira oladi; buning uchun alohida wrapped asset yoki tashqi bridge talab qilinmaydi.
Ushbu arxitektura Duskning maxfiylikka doir, muvofiqlikka yo‘naltirilgan moliyaviy ish oqimlari va real aktivlar infratuzilmasi bilan bog‘liq ishlariga mos keladi — bunda turli tranzaksiyalar turlicha ko‘rinish darajasini talab qilishi mumkin.
Yana bir texnik tafsilot — indexing. Phoenix’dan Moonlight’ga konversiya to‘g‘ridan-to‘g‘ri deposit (kiritish)dan ajratilishi kerak, shunda walletlar va indexerlar faoliyatni to‘g‘ri talqin qila oladi.
Bu esa amaliy ekotizim savolini tug‘diradi: Dusk ushbu voqea (event) tasnifi uchun referens indexer implementatsiyasini taqdim etadimi, yoki har bir integrator mantiqni mustaqil ravishda o‘zi implement qilishi kerakmi?
#dusk $DUSK @Dusk_Foundation
DUSK ekotizimi bo‘yicha yangiliklar
Dusk ekotizimi qiziqarli yondashuvni tanlagan: maxfiylik va ommaviy tranzaksiyalar bir-biridan butunlay ajratilgan tizimlar sifatida qaralmasdan birga mavjud bo‘lishi mumkin.
Duskda ikkita alohida tranzaksiya modeli bor: Phoenix va Moonlight.
Phoenix — UTXO-ga asoslangan bo‘lib, tranzaksiya ma’lumotlarini maxfiy saqlash uchun shielded (yashirilgan) note’lar va nullifierlardan foydalanadi. Moonlight esa account-ga asoslangan: balanslar va noncelar omma uchun ko‘rinib turadi.
Asosiy bog‘lovchi mexanizm — Transfer Contract. Uning "convert" funksiyasi shartnoma oqimi (contract flow) ichida Phoenix shielded note va Moonlight public account balansi o‘rtasida ekvivalent qiymatni ko‘chira oladi; buning uchun alohida wrapped asset yoki tashqi bridge talab qilinmaydi.
Ushbu arxitektura Duskning maxfiylikka doir, muvofiqlikka yo‘naltirilgan moliyaviy ish oqimlari va real aktivlar infratuzilmasi bilan bog‘liq ishlariga mos keladi — bunda turli tranzaksiyalar turlicha ko‘rinish darajasini talab qilishi mumkin.
Yana bir texnik tafsilot — indexing. Phoenix’dan Moonlight’ga konversiya to‘g‘ridan-to‘g‘ri deposit (kiritish)dan ajratilishi kerak, shunda walletlar va indexerlar faoliyatni to‘g‘ri talqin qila oladi.
Bu esa amaliy ekotizim savolini tug‘diradi: Dusk ushbu voqea (event) tasnifi uchun referens indexer implementatsiyasini taqdim etadimi, yoki har bir integrator mantiqni mustaqil ravishda o‘zi implement qilishi kerakmi?
#dusk $DUSK @Dusk
Dusk ekotizimi qiziqarli yondashuvni tanlagan: maxfiylik va ommaviy tranzaksiyalar bir-biridan butunlay ajratilgan tizimlar sifatida qaralmasdan birga mavjud bo‘lishi mumkin.
Duskda ikkita alohida tranzaksiya modeli bor: Phoenix va Moonlight.
Phoenix — UTXO-ga asoslangan bo‘lib, tranzaksiya ma’lumotlarini maxfiy saqlash uchun shielded (yashirilgan) note’lar va nullifierlardan foydalanadi. Moonlight esa account-ga asoslangan: balanslar va noncelar omma uchun ko‘rinib turadi.
Asosiy bog‘lovchi mexanizm — Transfer Contract. Uning "convert" funksiyasi shartnoma oqimi (contract flow) ichida Phoenix shielded note va Moonlight public account balansi o‘rtasida ekvivalent qiymatni ko‘chira oladi; buning uchun alohida wrapped asset yoki tashqi bridge talab qilinmaydi.
Ushbu arxitektura Duskning maxfiylikka doir, muvofiqlikka yo‘naltirilgan moliyaviy ish oqimlari va real aktivlar infratuzilmasi bilan bog‘liq ishlariga mos keladi — bunda turli tranzaksiyalar turlicha ko‘rinish darajasini talab qilishi mumkin.
Yana bir texnik tafsilot — indexing. Phoenix’dan Moonlight’ga konversiya to‘g‘ridan-to‘g‘ri deposit (kiritish)dan ajratilishi kerak, shunda walletlar va indexerlar faoliyatni to‘g‘ri talqin qila oladi.
Bu esa amaliy ekotizim savolini tug‘diradi: Dusk ushbu voqea (event) tasnifi uchun referens indexer implementatsiyasini taqdim etadimi, yoki har bir integrator mantiqni mustaqil ravishda o‘zi implement qilishi kerakmi?
#dusk $DUSK @Dusk
3
3
141
·
--
30K savdo $DUSK 3.1K USDT
Men DUSK’ni boshqa RWA zanjirlaridan ajratib turadigan jihatlarni yanada chuqurroq ko‘rib chiqdim va bir narsa menga tushunarli bo‘ldi: aktivni tokenizatsiya qilish muammoning faqat bitta qismi, xolos.
Regulyatsiyalangan moliyada asosiy qiyinchilik aktivning o‘zi emas—balki uning atrofidagi barcha omillar: uni ushlab turishga kimlar ruxsat etilgan, qaysi transferlarga ruxsat beriladi, qaysi ma’lumotlar maxfiy qolishi kerak, nimalar oshkor qilinishi lozim va aktiv hamda to‘lov yakunda qanday tartibda yakuniy hisob-kitob qilinadi.
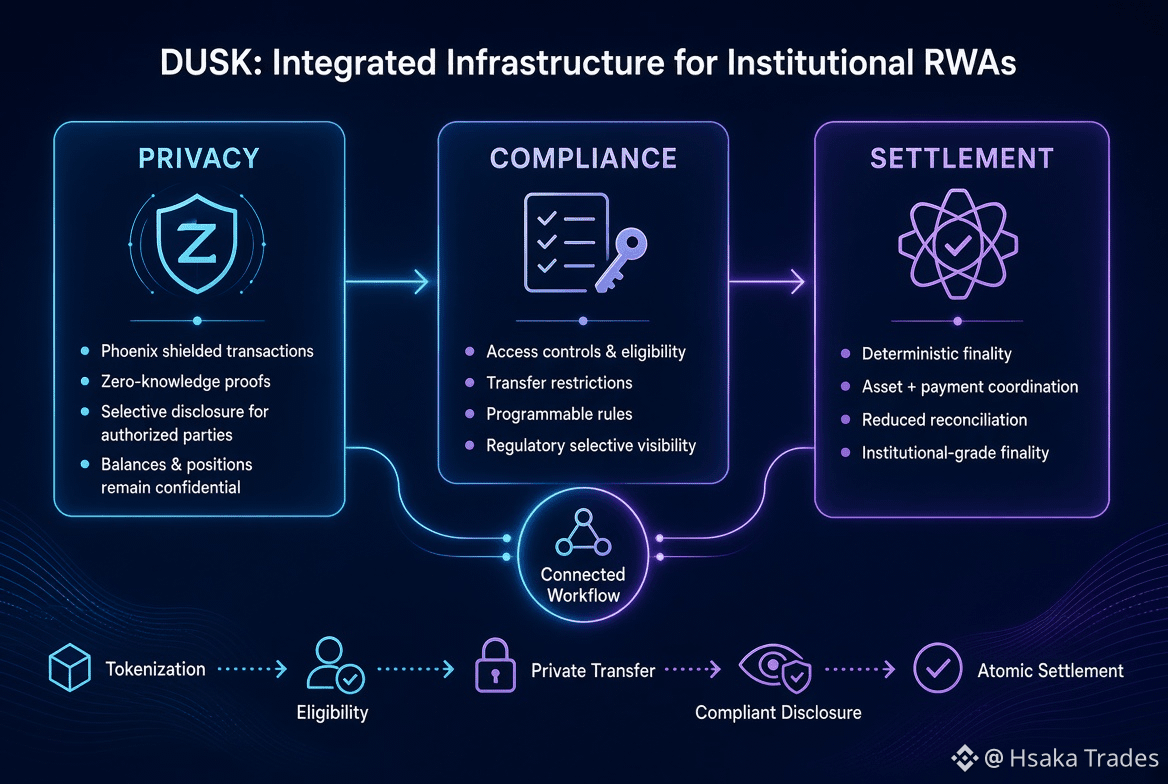
Diqqatimni tortgan narsa shuki, DUSK bularni bir xil ish jarayonining o‘zaro bog‘langan bo‘laklari sifatida ko‘radi. Uning bazaviy infratuzilmasi kirish nazorati, tanlangan oshkor bilan maxfiylik va alohida qo‘shimcha sifatida ko‘rib chiqilmaydigan deterministik yakuniy hisob-kitobni birlashtiradi.
Men doim institutlar blokcheyndan har bir balans, pozitsiya yoki tranzaksiyani butun bozor ko‘rishiga chiqarmasdan qanday foydalanishi mumkinligi haqida o‘ylardim.
DUSKning javobi qiziqarli: Phoenix nol bilimga asoslangan isbotlar yordamida tranzaksiya tafsilotlarini yashira oladi, shu bilan birga oshkor qilish talab qilinganda vakolatli tomonlar muayyan ma’lumotni baribir olishi mumkin.
Keyingi muhim bo‘lak—hisob-kitob (settlement). DUSK aktiv va to‘lov qismlarini deterministik yakuniylik bilan muvofiqlashtirish uchun mo‘ljallangan, bozor infratuzilmasi esa yarim-yupqa topshirishlar (handoffs)ni qisqartirishga intiladi; bu kabi bo‘linishlar esa reconciliation (moslashtirish) ishini ko‘paytiradi.
Shundan so‘ng men DUSKni yana bir tokenizatsiya zanjiri sifatida emas, balki regulyatsiyalangan bozorlardagi real ehtiyojlar atrofida qurilgan infratuzilma sifatida ko‘rdim.
Maxfiylik, muvofiqlik (compliance) va hisob-kitobni integratsiya qilish institutional RWAlarda haqiqiy raqobat ustuniga aylanishi mumkinmi?
#dusk $DUSK @Dusk_Foundation
Men DUSK’ni boshqa RWA zanjirlaridan ajratib turadigan jihatlarni yanada chuqurroq ko‘rib chiqdim va bir narsa menga tushunarli bo‘ldi: aktivni tokenizatsiya qilish muammoning faqat bitta qismi, xolos.
Regulyatsiyalangan moliyada asosiy qiyinchilik aktivning o‘zi emas—balki uning atrofidagi barcha omillar: uni ushlab turishga kimlar ruxsat etilgan, qaysi transferlarga ruxsat beriladi, qaysi ma’lumotlar maxfiy qolishi kerak, nimalar oshkor qilinishi lozim va aktiv hamda to‘lov yakunda qanday tartibda yakuniy hisob-kitob qilinadi.
Diqqatimni tortgan narsa shuki, DUSK bularni bir xil ish jarayonining o‘zaro bog‘langan bo‘laklari sifatida ko‘radi. Uning bazaviy infratuzilmasi kirish nazorati, tanlangan oshkor bilan maxfiylik va alohida qo‘shimcha sifatida ko‘rib chiqilmaydigan deterministik yakuniy hisob-kitobni birlashtiradi.
Men doim institutlar blokcheyndan har bir balans, pozitsiya yoki tranzaksiyani butun bozor ko‘rishiga chiqarmasdan qanday foydalanishi mumkinligi haqida o‘ylardim.
DUSKning javobi qiziqarli: Phoenix nol bilimga asoslangan isbotlar yordamida tranzaksiya tafsilotlarini yashira oladi, shu bilan birga oshkor qilish talab qilinganda vakolatli tomonlar muayyan ma’lumotni baribir olishi mumkin.
Keyingi muhim bo‘lak—hisob-kitob (settlement). DUSK aktiv va to‘lov qismlarini deterministik yakuniylik bilan muvofiqlashtirish uchun mo‘ljallangan, bozor infratuzilmasi esa yarim-yupqa topshirishlar (handoffs)ni qisqartirishga intiladi; bu kabi bo‘linishlar esa reconciliation (moslashtirish) ishini ko‘paytiradi.
Shundan so‘ng men DUSKni yana bir tokenizatsiya zanjiri sifatida emas, balki regulyatsiyalangan bozorlardagi real ehtiyojlar atrofida qurilgan infratuzilma sifatida ko‘rdim.
Maxfiylik, muvofiqlik (compliance) va hisob-kitobni integratsiya qilish institutional RWAlarda haqiqiy raqobat ustuniga aylanishi mumkinmi?
#dusk $DUSK @Dusk
Regulyatsiyalangan moliyada asosiy qiyinchilik aktivning o‘zi emas—balki uning atrofidagi barcha omillar: uni ushlab turishga kimlar ruxsat etilgan, qaysi transferlarga ruxsat beriladi, qaysi ma’lumotlar maxfiy qolishi kerak, nimalar oshkor qilinishi lozim va aktiv hamda to‘lov yakunda qanday tartibda yakuniy hisob-kitob qilinadi.
Diqqatimni tortgan narsa shuki, DUSK bularni bir xil ish jarayonining o‘zaro bog‘langan bo‘laklari sifatida ko‘radi. Uning bazaviy infratuzilmasi kirish nazorati, tanlangan oshkor bilan maxfiylik va alohida qo‘shimcha sifatida ko‘rib chiqilmaydigan deterministik yakuniy hisob-kitobni birlashtiradi.
Men doim institutlar blokcheyndan har bir balans, pozitsiya yoki tranzaksiyani butun bozor ko‘rishiga chiqarmasdan qanday foydalanishi mumkinligi haqida o‘ylardim.
DUSKning javobi qiziqarli: Phoenix nol bilimga asoslangan isbotlar yordamida tranzaksiya tafsilotlarini yashira oladi, shu bilan birga oshkor qilish talab qilinganda vakolatli tomonlar muayyan ma’lumotni baribir olishi mumkin.
Keyingi muhim bo‘lak—hisob-kitob (settlement). DUSK aktiv va to‘lov qismlarini deterministik yakuniylik bilan muvofiqlashtirish uchun mo‘ljallangan, bozor infratuzilmasi esa yarim-yupqa topshirishlar (handoffs)ni qisqartirishga intiladi; bu kabi bo‘linishlar esa reconciliation (moslashtirish) ishini ko‘paytiradi.
Shundan so‘ng men DUSKni yana bir tokenizatsiya zanjiri sifatida emas, balki regulyatsiyalangan bozorlardagi real ehtiyojlar atrofida qurilgan infratuzilma sifatida ko‘rdim.
Maxfiylik, muvofiqlik (compliance) va hisob-kitobni integratsiya qilish institutional RWAlarda haqiqiy raqobat ustuniga aylanishi mumkinmi?
#dusk $DUSK @Dusk
3
145
·
--
$BTW
{future}(BTWUSDT)
: Birinchi harakatni quvib ketmang
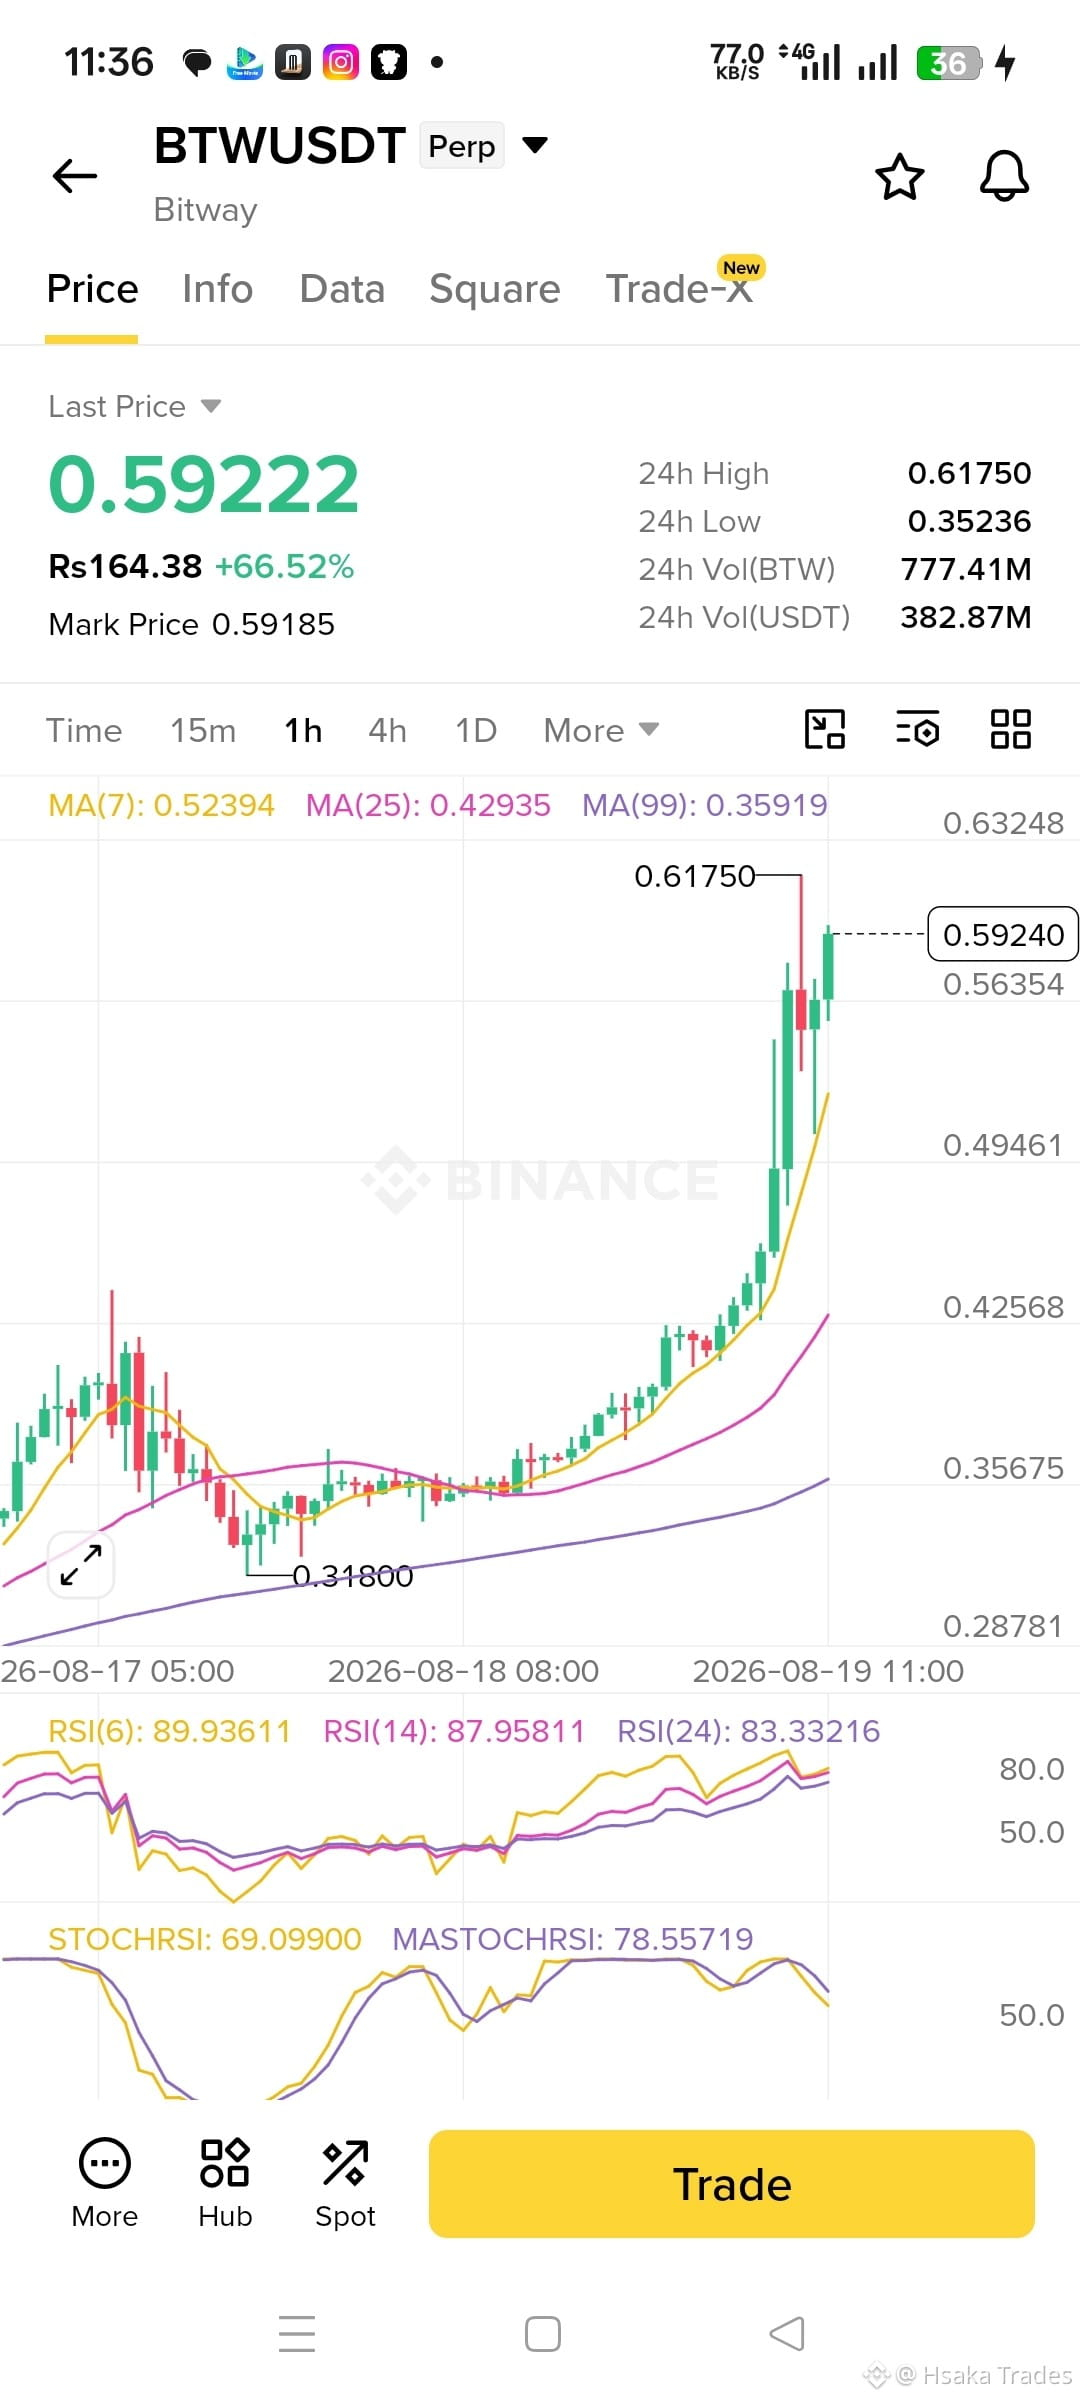
$BTW ning qiziqarli tomoni sham emas — xaridorlar tuzilmani haqiqatan ham himoya qila oladimi-yo‘qmi.
Narx harakati muhim bir zonaga yaqinlashyapti, u yerda qo‘llab-quvvatlash va qarshilik keyingi yo‘nalishni hal qilishi mumkin. Agar xaridorlar qo‘llab-quvvatlashni ushlab, kengayib borayotgan hajm bilan qarshilikdan yuqoriga itarsa, bu harakatni yanada kuchli tasdiqlaydi. Ammo agar narx darajadan pastga/bo‘ylab sinib ketsa-yu, hajm sust qolsa, bu shunchaki bozor teskari o‘girilishidan oldin likvidlikni “supurib olish” bo‘lishi mumkin.
Men ochiq foiz (open interest) va funding orqali leverage (leveraj) pozitsiyasiga ham e’tibor qilyapman. Agar OI keskin oshsa, narx esa yuqoriga harakat qilsa, volatillik tez kuchayishi ehtimoli bor. So‘nggi high va low atrofidagi likvidlik haqiqiy jang maydoniga aylanishi mumkin.
Mening fikrim: $BTW ni shunchaki momentum qiziqarli ko‘rinayotgani uchun quvib ketishni xohlamayman. Qarshilik ustida tasdiqlangan breakout, sog‘lom hajm va narxning barqaror qabul qilinishini ko‘rishni afzal ko‘raman.
Eng kuchli harakat odatda bozor aynan tasdiqlaydigan harakatdir.
$BTW bo‘yicha tasdiqni kutasizmi, yoki breakoutdan oldinroq tavakkal qilasizmi?
$BTW
: Birinchi harakatni quvib ketmang
$BTW ning qiziqarli tomoni sham emas — xaridorlar tuzilmani haqiqatan ham himoya qila oladimi-yo‘qmi.
Narx harakati muhim bir zonaga yaqinlashyapti, u yerda qo‘llab-quvvatlash va qarshilik keyingi yo‘nalishni hal qilishi mumkin. Agar xaridorlar qo‘llab-quvvatlashni ushlab, kengayib borayotgan hajm bilan qarshilikdan yuqoriga itarsa, bu harakatni yanada kuchli tasdiqlaydi. Ammo agar narx darajadan pastga/bo‘ylab sinib ketsa-yu, hajm sust qolsa, bu shunchaki bozor teskari o‘girilishidan oldin likvidlikni “supurib olish” bo‘lishi mumkin.
Men ochiq foiz (open interest) va funding orqali leverage (leveraj) pozitsiyasiga ham e’tibor qilyapman. Agar OI keskin oshsa, narx esa yuqoriga harakat qilsa, volatillik tez kuchayishi ehtimoli bor. So‘nggi high va low atrofidagi likvidlik haqiqiy jang maydoniga aylanishi mumkin.
Mening fikrim: $BTW ni shunchaki momentum qiziqarli ko‘rinayotgani uchun quvib ketishni xohlamayman. Qarshilik ustida tasdiqlangan breakout, sog‘lom hajm va narxning barqaror qabul qilinishini ko‘rishni afzal ko‘raman.
Eng kuchli harakat odatda bozor aynan tasdiqlaydigan harakatdir.
$BTW bo‘yicha tasdiqni kutasizmi, yoki breakoutdan oldinroq tavakkal qilasizmi?
: Birinchi harakatni quvib ketmang
$BTW ning qiziqarli tomoni sham emas — xaridorlar tuzilmani haqiqatan ham himoya qila oladimi-yo‘qmi.
Narx harakati muhim bir zonaga yaqinlashyapti, u yerda qo‘llab-quvvatlash va qarshilik keyingi yo‘nalishni hal qilishi mumkin. Agar xaridorlar qo‘llab-quvvatlashni ushlab, kengayib borayotgan hajm bilan qarshilikdan yuqoriga itarsa, bu harakatni yanada kuchli tasdiqlaydi. Ammo agar narx darajadan pastga/bo‘ylab sinib ketsa-yu, hajm sust qolsa, bu shunchaki bozor teskari o‘girilishidan oldin likvidlikni “supurib olish” bo‘lishi mumkin.
Men ochiq foiz (open interest) va funding orqali leverage (leveraj) pozitsiyasiga ham e’tibor qilyapman. Agar OI keskin oshsa, narx esa yuqoriga harakat qilsa, volatillik tez kuchayishi ehtimoli bor. So‘nggi high va low atrofidagi likvidlik haqiqiy jang maydoniga aylanishi mumkin.
Mening fikrim: $BTW ni shunchaki momentum qiziqarli ko‘rinayotgani uchun quvib ketishni xohlamayman. Qarshilik ustida tasdiqlangan breakout, sog‘lom hajm va narxning barqaror qabul qilinishini ko‘rishni afzal ko‘raman.
Eng kuchli harakat odatda bozor aynan tasdiqlaydigan harakatdir.
$BTW bo‘yicha tasdiqni kutasizmi, yoki breakoutdan oldinroq tavakkal qilasizmi?
2
419
Ko‘proq kontentni ko‘rish uchun tizimga kiring
Binance Square'da global kriptovalyuta foydalanuvchilariga qo‘shiling
⚡️ Kriptovalyuta haqida eng so‘nggi va foydali ma’lumotlarni oling.
💬 Dunyoning eng yirik kriptovalyuta birjasi tomonidan ishonchli deb topilgan.
👍 Tasdiqlangan mualliflardan haqiqiy tahlillarni kashf eting.
Email / telefon raqami
Trenddagi mavzular
SECProposesCryptoCustodyRules
7,727 marta koʻrilgan
148 muhokama qilmoqda
🚀 Kripto sanoati uchun katta marraga erishildi!
Nurul Hasnat Samir
·0 ta layk
·51 marta koʻrilgan
SECApproves3xLongCryptoCommodityETPs
10,132 marta koʻrilgan
168 muhokama qilmoqda
G7PlansToReleaseUpTo100MBarrelsOilDiesel
11,430 marta koʻrilgan
210 muhokama qilmoqda