
DragonFlyOfficial
59 Публікації

DragonFlyOfficial
Поскаржитись
Заблокувати користувача
🚀 Crypto Trader | Content Creator | 6 Years Experience
Sharing analysis, altcoin research & trading strategies
Helping traders grow with real market insights
57 Підписки
24 Підписники
64 Вподобань
Публікації
Переглянути переклад
AMDB GAINS 10.6%: IS THE AMD CONNECTION BEHIND TODAY’S MOVE? 📈
🔍 What Started the Story?
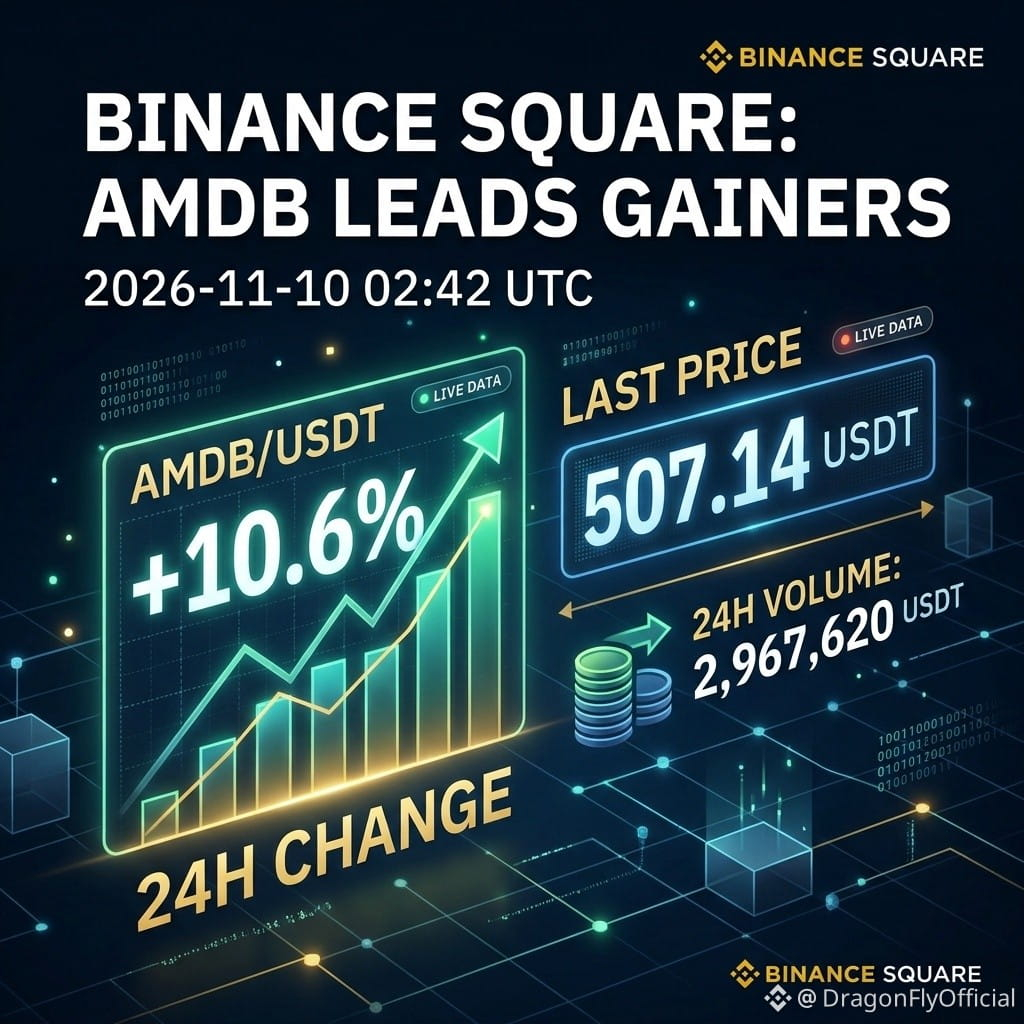
AMDB/USDT recorded a last price of 507.14 USDT, gaining 10.6% in 24 hours. Its trading volume reached approximately 2,967,620 USDT. That performance placed AMDB among today's top gainers on Binance Square.
At first glance, it looks like another strong crypto rally. But there is an important detail behind this asset.
💡 What Makes AMDB Different?
AMDB is a tokenized version of Advanced Micro Devices (AMD) bStocks. It provides economic exposure to AMD shares through a blockchain-based asset.
This creates an important connection between two markets: traditional stocks and digital assets.
The possible reasons behind today's rise include stronger demand for AMDB, changing expectations around AMD's business, or increased interest in tokenized stocks. However, the available data does not confirm one specific catalyst.
⚠️ Could the Rally Lose Strength?
A 10.6% increase is impressive, but one day's performance does not guarantee continued growth.
AMDB faces several risks:
Changes in AMD's underlying share value.
Sudden changes in buying and selling pressure.
Limited liquidity and possible price differences between markets.
Additional risks related to tokenized assets and their issuers.
📊 What Should Traders Watch Next?
The key question is whether trading activity can remain strong and whether $AMDB
{spot}(AMDBUSDT)
continues to follow its underlying asset. Volume near 2.97 million USDT shows meaningful activity, but it does not guarantee that buyers will remain in control.
The Dragonfly Official Takeaway
AMDB's 10.6% gain deserves attention, but smart traders look beyond the percentage. Keep positions small, use stop losses, and risk only what you can afford to lose. Crypto trading is risky, and this analysis is not financial advice.
#AMDB #AMD #CryptoMarket #TokenizedStocks #MarketAnalysis
AMDB GAINS 10.6%: IS THE AMD CONNECTION BEHIND TODAY’S MOVE? 📈
🔍 What Started the Story?
AMDB/USDT recorded a last price of 507.14 USDT, gaining 10.6% in 24 hours. Its trading volume reached approximately 2,967,620 USDT. That performance placed AMDB among today's top gainers on Binance Square.
At first glance, it looks like another strong crypto rally. But there is an important detail behind this asset.
💡 What Makes AMDB Different?
AMDB is a tokenized version of Advanced Micro Devices (AMD) bStocks. It provides economic exposure to AMD shares through a blockchain-based asset.
This creates an important connection between two markets: traditional stocks and digital assets.
The possible reasons behind today's rise include stronger demand for AMDB, changing expectations around AMD's business, or increased interest in tokenized stocks. However, the available data does not confirm one specific catalyst.
⚠️ Could the Rally Lose Strength?
A 10.6% increase is impressive, but one day's performance does not guarantee continued growth.
AMDB faces several risks:
Changes in AMD's underlying share value.
Sudden changes in buying and selling pressure.
Limited liquidity and possible price differences between markets.
Additional risks related to tokenized assets and their issuers.
📊 What Should Traders Watch Next?
The key question is whether trading activity can remain strong and whether $AMDB
continues to follow its underlying asset. Volume near 2.97 million USDT shows meaningful activity, but it does not guarantee that buyers will remain in control.
The Dragonfly Official Takeaway
AMDB's 10.6% gain deserves attention, but smart traders look beyond the percentage. Keep positions small, use stop losses, and risk only what you can afford to lose. Crypto trading is risky, and this analysis is not financial advice.
#AMDB #AMD #CryptoMarket #TokenizedStocks #MarketAnalysis
🔍 What Started the Story?
AMDB/USDT recorded a last price of 507.14 USDT, gaining 10.6% in 24 hours. Its trading volume reached approximately 2,967,620 USDT. That performance placed AMDB among today's top gainers on Binance Square.
At first glance, it looks like another strong crypto rally. But there is an important detail behind this asset.
💡 What Makes AMDB Different?
AMDB is a tokenized version of Advanced Micro Devices (AMD) bStocks. It provides economic exposure to AMD shares through a blockchain-based asset.
This creates an important connection between two markets: traditional stocks and digital assets.
The possible reasons behind today's rise include stronger demand for AMDB, changing expectations around AMD's business, or increased interest in tokenized stocks. However, the available data does not confirm one specific catalyst.
⚠️ Could the Rally Lose Strength?
A 10.6% increase is impressive, but one day's performance does not guarantee continued growth.
AMDB faces several risks:
Changes in AMD's underlying share value.
Sudden changes in buying and selling pressure.
Limited liquidity and possible price differences between markets.
Additional risks related to tokenized assets and their issuers.
📊 What Should Traders Watch Next?
The key question is whether trading activity can remain strong and whether $AMDB
continues to follow its underlying asset. Volume near 2.97 million USDT shows meaningful activity, but it does not guarantee that buyers will remain in control.
The Dragonfly Official Takeaway
AMDB's 10.6% gain deserves attention, but smart traders look beyond the percentage. Keep positions small, use stop losses, and risk only what you can afford to lose. Crypto trading is risky, and this analysis is not financial advice.
#AMDB #AMD #CryptoMarket #TokenizedStocks #MarketAnalysis
5
Переглянути переклад
$SIGN
{future}(SIGNUSDT)
RISES 9.4%: DOES EVERY PRICE JUMP MEAN STRONG BUYING?
📚 Myth vs Reality: Green Does Not Always Mean Growth
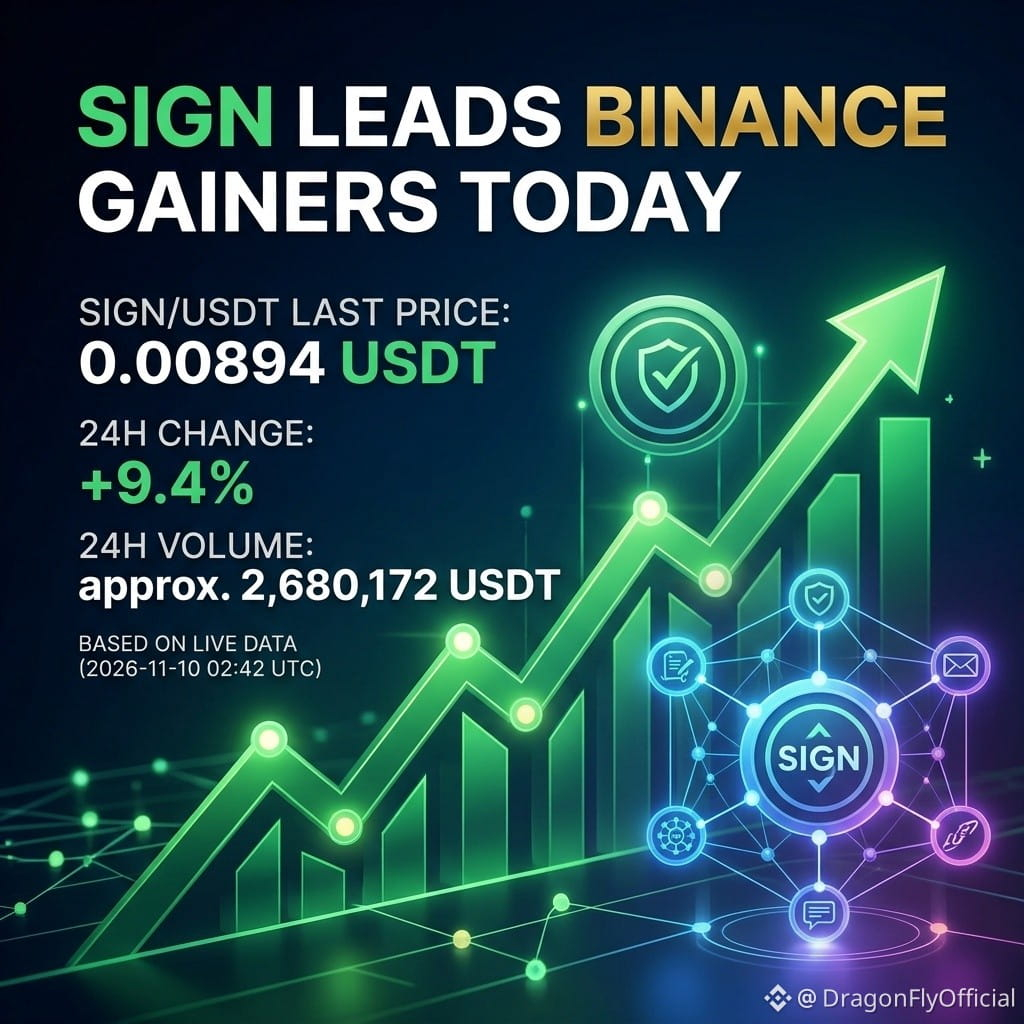
A common myth in crypto is that a coin rising nearly 10% must have strong long-term demand. That is not always true. SIGN/USDT has gained 9.4% in 24 hours, reaching $0.00894. But one positive day does not guarantee a lasting trend.
📈 The Pros: Buyers Are Showing Interest
SIGN recorded approximately $2.68 million in 24-hour trading volume. This shows meaningful trading activity alongside its price increase. Higher volume can indicate growing market attention, although it does not prove that buyers will remain active.
⚠️ The Cons: Momentum Can Reverse
A 9.4% gain can attract short-term traders looking for quick profits. If buying interest weakens or sellers begin taking profits, the price could lose momentum. High trading activity also means that market conditions can change quickly.
🔍 What Is Still Unknown?
The available figures do not confirm the exact reason behind this increase. Without verified evidence of a specific announcement, partnership, or project development driving the move, connecting the rally to a particular event would be speculation.
💡 Final Reminder
Keep positions small, use a stop loss, and risk only what you can afford to lose. Crypto trading involves risk, and this is not financial advice. Stay careful, question the hype, and always think independently.
#SIGN #CryptoMarke t #Altcoins #CryptoAnalysis #TradingRisk
$SIGN
RISES 9.4%: DOES EVERY PRICE JUMP MEAN STRONG BUYING?
📚 Myth vs Reality: Green Does Not Always Mean Growth
A common myth in crypto is that a coin rising nearly 10% must have strong long-term demand. That is not always true. SIGN/USDT has gained 9.4% in 24 hours, reaching $0.00894. But one positive day does not guarantee a lasting trend.
📈 The Pros: Buyers Are Showing Interest
SIGN recorded approximately $2.68 million in 24-hour trading volume. This shows meaningful trading activity alongside its price increase. Higher volume can indicate growing market attention, although it does not prove that buyers will remain active.
⚠️ The Cons: Momentum Can Reverse
A 9.4% gain can attract short-term traders looking for quick profits. If buying interest weakens or sellers begin taking profits, the price could lose momentum. High trading activity also means that market conditions can change quickly.
🔍 What Is Still Unknown?
The available figures do not confirm the exact reason behind this increase. Without verified evidence of a specific announcement, partnership, or project development driving the move, connecting the rally to a particular event would be speculation.
💡 Final Reminder
Keep positions small, use a stop loss, and risk only what you can afford to lose. Crypto trading involves risk, and this is not financial advice. Stay careful, question the hype, and always think independently.
#SIGN #CryptoMarke t #Altcoins #CryptoAnalysis #TradingRisk
RISES 9.4%: DOES EVERY PRICE JUMP MEAN STRONG BUYING?
📚 Myth vs Reality: Green Does Not Always Mean Growth
A common myth in crypto is that a coin rising nearly 10% must have strong long-term demand. That is not always true. SIGN/USDT has gained 9.4% in 24 hours, reaching $0.00894. But one positive day does not guarantee a lasting trend.
📈 The Pros: Buyers Are Showing Interest
SIGN recorded approximately $2.68 million in 24-hour trading volume. This shows meaningful trading activity alongside its price increase. Higher volume can indicate growing market attention, although it does not prove that buyers will remain active.
⚠️ The Cons: Momentum Can Reverse
A 9.4% gain can attract short-term traders looking for quick profits. If buying interest weakens or sellers begin taking profits, the price could lose momentum. High trading activity also means that market conditions can change quickly.
🔍 What Is Still Unknown?
The available figures do not confirm the exact reason behind this increase. Without verified evidence of a specific announcement, partnership, or project development driving the move, connecting the rally to a particular event would be speculation.
💡 Final Reminder
Keep positions small, use a stop loss, and risk only what you can afford to lose. Crypto trading involves risk, and this is not financial advice. Stay careful, question the hype, and always think independently.
#SIGN #CryptoMarke t #Altcoins #CryptoAnalysis #TradingRisk
38
Переглянути переклад
BEB RISES 9.3%: THE SURPRISE BEHIND TODAY’S MARKET MOVE
📈 A Strong Start
$BEB
{spot}(BEBUSDT)
has moved into the spotlight with a 9.3% gain in the last 24 hours. Its BEB/USDT price reached 194.89, while trading volume climbed to approximately 1,965,139 USDT as of November 10, 2026, at 02:42 UTC.
📊 The Interesting Twist
The move looks encouraging, but a green price chart does not tell the whole story. Volume shows how much value has been traded, while price change shows how the market has moved. Together, these figures show meaningful trading activity alongside a positive price move.
🔍 What Could Be Behind It?
Possible factors include increased buyer interest, short-term speculation, fresh market attention, or changing trader expectations. However, the available data does not confirm which factor caused BEB to rise. It would be misleading to present any single explanation as fact.
💡 The Lesson for Traders
Dragonfly Official encourages readers to look beyond the percentage gain. Watch whether trading activity remains strong, whether the price can maintain its progress, and whether new market information supports the move. No verified entry, stop-loss, or profit target is available from the supplied figures, so avoid treating this gain as a trading signal.
Keep positions small, use a suitable stop loss, and risk only what you can afford to lose. Crypto trading is risky, and this is not financial advice.
What to Watch Next: Can BEB maintain its momentum, or will profit-taking change the story?
#BEB
#CryptoMarket #MarketAnalysis #Altcoins #CryptoTrading
BEB RISES 9.3%: THE SURPRISE BEHIND TODAY’S MARKET MOVE
📈 A Strong Start
$BEB
has moved into the spotlight with a 9.3% gain in the last 24 hours. Its BEB/USDT price reached 194.89, while trading volume climbed to approximately 1,965,139 USDT as of November 10, 2026, at 02:42 UTC.
📊 The Interesting Twist
The move looks encouraging, but a green price chart does not tell the whole story. Volume shows how much value has been traded, while price change shows how the market has moved. Together, these figures show meaningful trading activity alongside a positive price move.
🔍 What Could Be Behind It?
Possible factors include increased buyer interest, short-term speculation, fresh market attention, or changing trader expectations. However, the available data does not confirm which factor caused BEB to rise. It would be misleading to present any single explanation as fact.
💡 The Lesson for Traders
Dragonfly Official encourages readers to look beyond the percentage gain. Watch whether trading activity remains strong, whether the price can maintain its progress, and whether new market information supports the move. No verified entry, stop-loss, or profit target is available from the supplied figures, so avoid treating this gain as a trading signal.
Keep positions small, use a suitable stop loss, and risk only what you can afford to lose. Crypto trading is risky, and this is not financial advice.
What to Watch Next: Can BEB maintain its momentum, or will profit-taking change the story?
#BEB
#CryptoMarket #MarketAnalysis #Altcoins #CryptoTrading
📈 A Strong Start
$BEB
has moved into the spotlight with a 9.3% gain in the last 24 hours. Its BEB/USDT price reached 194.89, while trading volume climbed to approximately 1,965,139 USDT as of November 10, 2026, at 02:42 UTC.
📊 The Interesting Twist
The move looks encouraging, but a green price chart does not tell the whole story. Volume shows how much value has been traded, while price change shows how the market has moved. Together, these figures show meaningful trading activity alongside a positive price move.
🔍 What Could Be Behind It?
Possible factors include increased buyer interest, short-term speculation, fresh market attention, or changing trader expectations. However, the available data does not confirm which factor caused BEB to rise. It would be misleading to present any single explanation as fact.
💡 The Lesson for Traders
Dragonfly Official encourages readers to look beyond the percentage gain. Watch whether trading activity remains strong, whether the price can maintain its progress, and whether new market information supports the move. No verified entry, stop-loss, or profit target is available from the supplied figures, so avoid treating this gain as a trading signal.
Keep positions small, use a suitable stop loss, and risk only what you can afford to lose. Crypto trading is risky, and this is not financial advice.
What to Watch Next: Can BEB maintain its momentum, or will profit-taking change the story?
#BEB
#CryptoMarket #MarketAnalysis #Altcoins #CryptoTrading
GRAM ЗРОСЛА НА 9,4%: НАЙБІЛЬШИЙ МІФ ПРО ЗРОСТАННЯ РИНКУ
📊 Міф: Зростання на 9,4% свідчить про високу довіру до ринку
Факт: GRAM/USDT торгується за ціною 1,105, що на 9,4% вище, ніж 24 години тому. Обсяг торгів становить приблизно 12,24 мільйона USDT. Це помітний рух, але сам по собі зелений відсоток не доводить, що покупці впевнені в ринку або що ралі триватиме.
🔍 Міф: Великий обсяг торгів гарантує подальше зростання
Факт: Обсяг торгів показує, яка вартість активів перейшла з рук у руки. Заявлений 24-годинний обсяг торгів GRAM свідчить про значну торговельну активність. Однак лише за обсягом неможливо визначити, хто контролює ринок — покупці чи продавці. Зростання ціни та великий обсяг торгів заслуговують на увагу, але не гарантують тривалого зростання.
💡 Що могло спричинити цей рух?
Зростанню могли посприяти підвищений інтерес до ринку, короткострокові спекуляції, новий попит або загальні настрої на крипторинку. Однак перевіреної інформації недостатньо, щоб визначити конкретну причину динаміки GRAM. Розглядайте це як можливі пояснення, а не підтверджені факти.
Підсумок
Відводьте позиціям невелику частку портфеля, встановлюйте стоп-лос і ризикуйте лише тією сумою, яку можете дозволити собі втратити. Торгівля криптовалютою пов’язана з ризиком, і це не фінансова порада. Сильний рух ринку вартий уваги, але не сліпої довіри.
Вас також може зацікавити.
Easy MCP AI
Реклама
Налаштування реклами
Публікуйте прямо з чату
Створюйте чернетки й публікуйте дописи у WordPress за допомогою ШІ.
Дізнатися більше
Дізнайтеся про рекламу та персоналізацію
GRAM ЗРОСЛА НА 9,4%: НАЙБІЛЬШИЙ МІФ ПРО ЗРОСТАННЯ РИНКУ
📊 Міф: Зростання на 9,4% свідчить про високу довіру до ринку
Факт: GRAM/USDT торгується за ціною 1,105, що на 9,4% вище, ніж 24 години тому. Обсяг торгів становить приблизно 12,24 мільйона USDT. Це помітний рух, але сам по собі зелений відсоток не доводить, що покупці впевнені в ринку або що ралі триватиме.
🔍 Міф: Великий обсяг торгів гарантує подальше зростання
Факт: Обсяг торгів показує, яка вартість активів перейшла з рук у руки. Заявлений 24-годинний обсяг торгів GRAM свідчить про значну торговельну активність. Однак лише за обсягом неможливо визначити, хто контролює ринок — покупці чи продавці. Зростання ціни та великий обсяг торгів заслуговують на увагу, але не гарантують тривалого зростання.
💡 Що могло спричинити цей рух?
Зростанню могли посприяти підвищений інтерес до ринку, короткострокові спекуляції, новий попит або загальні настрої на крипторинку. Однак перевіреної інформації недостатньо, щоб визначити конкретну причину динаміки GRAM. Розглядайте це як можливі пояснення, а не підтверджені факти.
Підсумок
Відводьте позиціям невелику частку портфеля, встановлюйте стоп-лос і ризикуйте лише тією сумою, яку можете дозволити собі втратити. Торгівля криптовалютою пов’язана з ризиком, і це не фінансова порада. Сильний рух ринку вартий уваги, але не сліпої довіри.
Вас також може зацікавити.
Easy MCP AI
Реклама
Налаштування реклами
Публікуйте прямо з чату
Створюйте чернетки й публікуйте дописи у WordPress за допомогою ШІ.
Дізнатися більше
Дізнайтеся про рекламу та персоналізацію
📊 Міф: Зростання на 9,4% свідчить про високу довіру до ринку
Факт: GRAM/USDT торгується за ціною 1,105, що на 9,4% вище, ніж 24 години тому. Обсяг торгів становить приблизно 12,24 мільйона USDT. Це помітний рух, але сам по собі зелений відсоток не доводить, що покупці впевнені в ринку або що ралі триватиме.
🔍 Міф: Великий обсяг торгів гарантує подальше зростання
Факт: Обсяг торгів показує, яка вартість активів перейшла з рук у руки. Заявлений 24-годинний обсяг торгів GRAM свідчить про значну торговельну активність. Однак лише за обсягом неможливо визначити, хто контролює ринок — покупці чи продавці. Зростання ціни та великий обсяг торгів заслуговують на увагу, але не гарантують тривалого зростання.
💡 Що могло спричинити цей рух?
Зростанню могли посприяти підвищений інтерес до ринку, короткострокові спекуляції, новий попит або загальні настрої на крипторинку. Однак перевіреної інформації недостатньо, щоб визначити конкретну причину динаміки GRAM. Розглядайте це як можливі пояснення, а не підтверджені факти.
Підсумок
Відводьте позиціям невелику частку портфеля, встановлюйте стоп-лос і ризикуйте лише тією сумою, яку можете дозволити собі втратити. Торгівля криптовалютою пов’язана з ризиком, і це не фінансова порада. Сильний рух ринку вартий уваги, але не сліпої довіри.
Вас також може зацікавити.
Easy MCP AI
Реклама
Налаштування реклами
Публікуйте прямо з чату
Створюйте чернетки й публікуйте дописи у WordPress за допомогою ШІ.
Дізнатися більше
Дізнайтеся про рекламу та персоналізацію
155
Переглянути переклад
LITEB GAINS 10.7%: WHAT CHANGED, AND CAN THE MOMENTUM LAST?
📊 Before vs Now
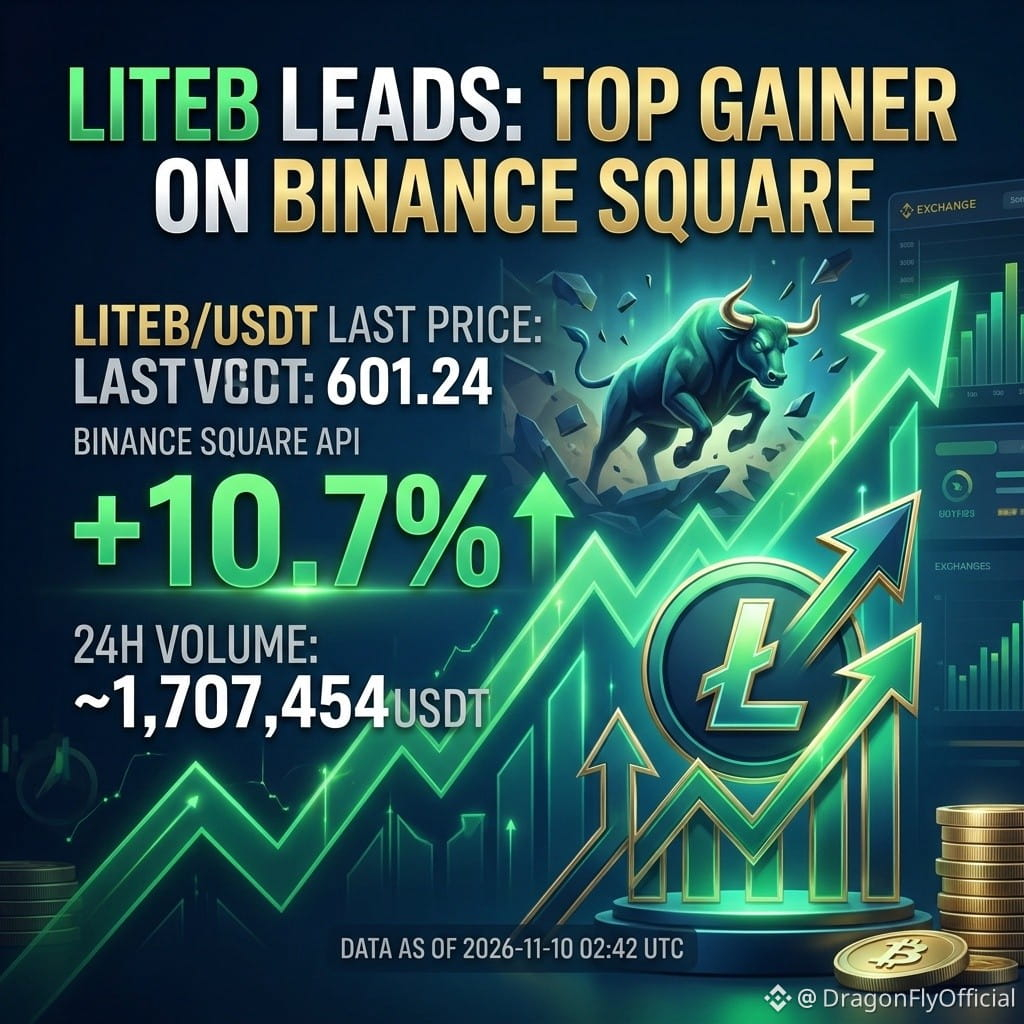
LITEB is attracting attention after a noticeable price increase. Its latest reported 24-hour performance shows a 10.7% gain, with LITEB/USDT trading at 601.24. Its 24-hour trading volume is approximately 1,707,454 USDT. This puts LITEB among today's notable gainers.
📈 The Pros
The strongest positive sign is the combination of price growth and substantial trading activity. A 10.7% increase shows that buyers have been active, while the reported volume indicates meaningful market participation.
Higher volume can make a price move more interesting because it shows that trading activity is taking place alongside the increase. However, it does not guarantee that the rally will continue.
⚠️ The Cons
A rising price does not always mean a strong long-term trend. Some increases happen because of short-term speculation, sudden buying pressure, or limited market liquidity.
There is also insufficient verified information here to identify a specific announcement, partnership, or project development behind LITEB's move. Investors should avoid assuming a positive news event caused the gain.
💡 Final Reminder
Dragonfly Official encourages independent research. Keep positions small, use appropriate stop losses, and never risk money you cannot afford to lose. Crypto trading is risky, and this is not financial advice.
Stay careful, question the hype, and always think independently.
#LITEB #CryptoMarke t #TopGainers #CryptoAnalys #RiskManagement
LITEB GAINS 10.7%: WHAT CHANGED, AND CAN THE MOMENTUM LAST?
📊 Before vs Now
LITEB is attracting attention after a noticeable price increase. Its latest reported 24-hour performance shows a 10.7% gain, with LITEB/USDT trading at 601.24. Its 24-hour trading volume is approximately 1,707,454 USDT. This puts LITEB among today's notable gainers.
📈 The Pros
The strongest positive sign is the combination of price growth and substantial trading activity. A 10.7% increase shows that buyers have been active, while the reported volume indicates meaningful market participation.
Higher volume can make a price move more interesting because it shows that trading activity is taking place alongside the increase. However, it does not guarantee that the rally will continue.
⚠️ The Cons
A rising price does not always mean a strong long-term trend. Some increases happen because of short-term speculation, sudden buying pressure, or limited market liquidity.
There is also insufficient verified information here to identify a specific announcement, partnership, or project development behind LITEB's move. Investors should avoid assuming a positive news event caused the gain.
💡 Final Reminder
Dragonfly Official encourages independent research. Keep positions small, use appropriate stop losses, and never risk money you cannot afford to lose. Crypto trading is risky, and this is not financial advice.
Stay careful, question the hype, and always think independently.
#LITEB #CryptoMarke t #TopGainers #CryptoAnalys #RiskManagement
📊 Before vs Now
LITEB is attracting attention after a noticeable price increase. Its latest reported 24-hour performance shows a 10.7% gain, with LITEB/USDT trading at 601.24. Its 24-hour trading volume is approximately 1,707,454 USDT. This puts LITEB among today's notable gainers.
📈 The Pros
The strongest positive sign is the combination of price growth and substantial trading activity. A 10.7% increase shows that buyers have been active, while the reported volume indicates meaningful market participation.
Higher volume can make a price move more interesting because it shows that trading activity is taking place alongside the increase. However, it does not guarantee that the rally will continue.
⚠️ The Cons
A rising price does not always mean a strong long-term trend. Some increases happen because of short-term speculation, sudden buying pressure, or limited market liquidity.
There is also insufficient verified information here to identify a specific announcement, partnership, or project development behind LITEB's move. Investors should avoid assuming a positive news event caused the gain.
💡 Final Reminder
Dragonfly Official encourages independent research. Keep positions small, use appropriate stop losses, and never risk money you cannot afford to lose. Crypto trading is risky, and this is not financial advice.
Stay careful, question the hype, and always think independently.
#LITEB #CryptoMarke t #TopGainers #CryptoAnalys #RiskManagement
5
Переглянути переклад
BEAMX CLIMBS 10.8%: IS GAMING SECTOR INTEREST RETURNING?
🎮 Start With the Basics
Imagine checking your crypto portfolio and finding BEAMX among the day's strongest performers. The token has attracted fresh market attention, but is this the beginning of stronger momentum or simply a short-term price move?
BEAMX is associated with Beam, a blockchain ecosystem focused on Web3 gaming. Its goal is to support gaming applications, digital assets, and blockchain-based experiences.
📊 The Numbers Behind the Move
As of November 10, 2026, at 02:42 UTC, BEAMX/USDT recorded:
💡 A Beginner's Trading Guide
Before considering a position, check whether trading activity remains strong, monitor broader crypto market conditions, and look for sustained price strength rather than reacting to one daily percentage change.
There is no verified entry price, stop-loss level, or take-profit target established by the available data. Avoid guessing these levels or chasing a sudden rally.
⚠️ The Risks Still Matter
A 10.8% gain does not guarantee another upward move. Profit-taking, changing sentiment, and sudden selling pressure can reverse gains quickly.
Keep positions small, use a suitable stop loss, and risk only what you can afford to lose. Crypto trading is risky, and this is not financial advice.
Dragonfly Official Takeaway: BEAMX has delivered an impressive daily gain, but sustainable strength matters more than a single green candle.
Do you think BEAMX can maintain its momentum?
#BEAMX #beams #CryptoMarke t #altcoinscrash #CryptoTrading
BEAMX CLIMBS 10.8%: IS GAMING SECTOR INTEREST RETURNING?
🎮 Start With the Basics
Imagine checking your crypto portfolio and finding BEAMX among the day's strongest performers. The token has attracted fresh market attention, but is this the beginning of stronger momentum or simply a short-term price move?
BEAMX is associated with Beam, a blockchain ecosystem focused on Web3 gaming. Its goal is to support gaming applications, digital assets, and blockchain-based experiences.
📊 The Numbers Behind the Move
As of November 10, 2026, at 02:42 UTC, BEAMX/USDT recorded:
💡 A Beginner's Trading Guide
Before considering a position, check whether trading activity remains strong, monitor broader crypto market conditions, and look for sustained price strength rather than reacting to one daily percentage change.
There is no verified entry price, stop-loss level, or take-profit target established by the available data. Avoid guessing these levels or chasing a sudden rally.
⚠️ The Risks Still Matter
A 10.8% gain does not guarantee another upward move. Profit-taking, changing sentiment, and sudden selling pressure can reverse gains quickly.
Keep positions small, use a suitable stop loss, and risk only what you can afford to lose. Crypto trading is risky, and this is not financial advice.
Dragonfly Official Takeaway: BEAMX has delivered an impressive daily gain, but sustainable strength matters more than a single green candle.
Do you think BEAMX can maintain its momentum?
#BEAMX #beams #CryptoMarke t #altcoinscrash #CryptoTrading
🎮 Start With the Basics
Imagine checking your crypto portfolio and finding BEAMX among the day's strongest performers. The token has attracted fresh market attention, but is this the beginning of stronger momentum or simply a short-term price move?
BEAMX is associated with Beam, a blockchain ecosystem focused on Web3 gaming. Its goal is to support gaming applications, digital assets, and blockchain-based experiences.
📊 The Numbers Behind the Move
As of November 10, 2026, at 02:42 UTC, BEAMX/USDT recorded:
💡 A Beginner's Trading Guide
Before considering a position, check whether trading activity remains strong, monitor broader crypto market conditions, and look for sustained price strength rather than reacting to one daily percentage change.
There is no verified entry price, stop-loss level, or take-profit target established by the available data. Avoid guessing these levels or chasing a sudden rally.
⚠️ The Risks Still Matter
A 10.8% gain does not guarantee another upward move. Profit-taking, changing sentiment, and sudden selling pressure can reverse gains quickly.
Keep positions small, use a suitable stop loss, and risk only what you can afford to lose. Crypto trading is risky, and this is not financial advice.
Dragonfly Official Takeaway: BEAMX has delivered an impressive daily gain, but sustainable strength matters more than a single green candle.
Do you think BEAMX can maintain its momentum?
#BEAMX #beams #CryptoMarke t #altcoinscrash #CryptoTrading
97
Переглянути переклад
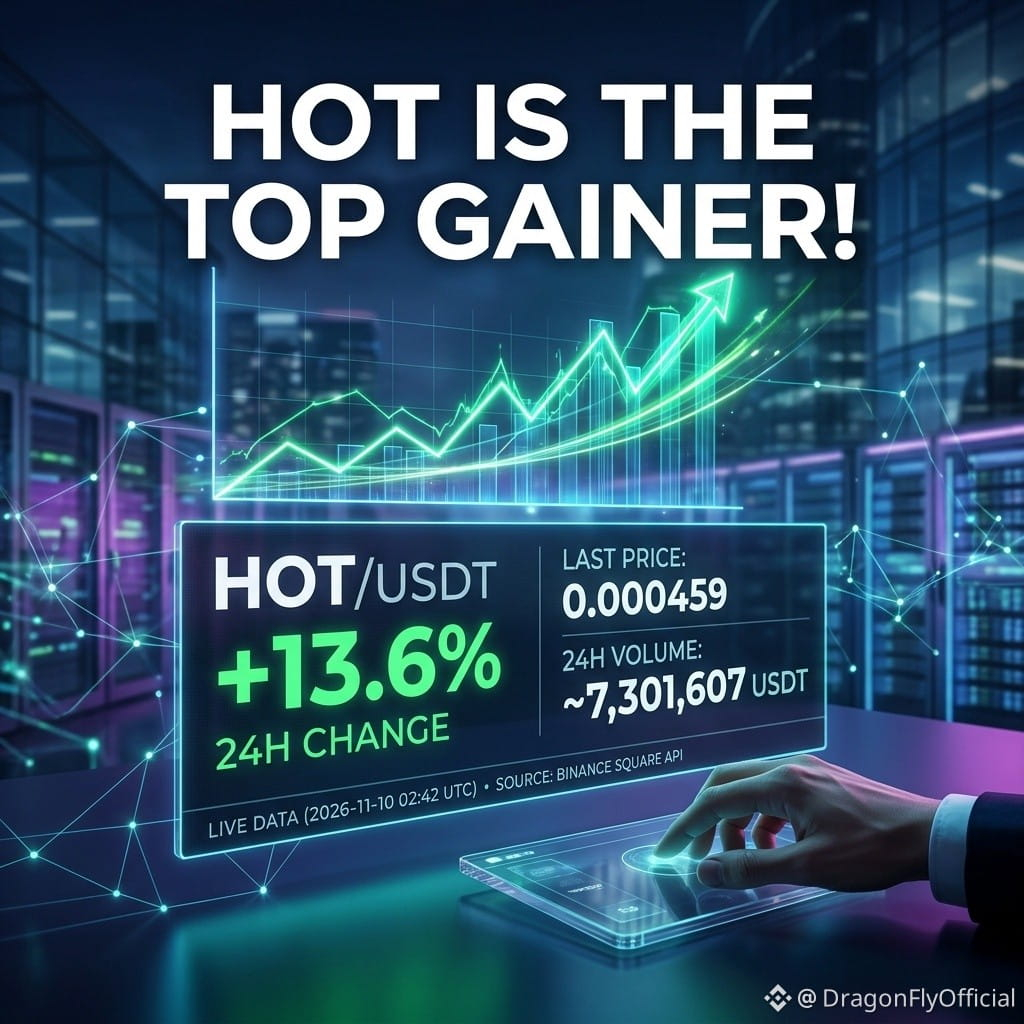
HOT GAINS 13.6%: WHAT IS SUPPORTING THE RALLY, AND WHAT COULD GO WRONG?
🔍 Balanced View: Momentum Needs Confirmation
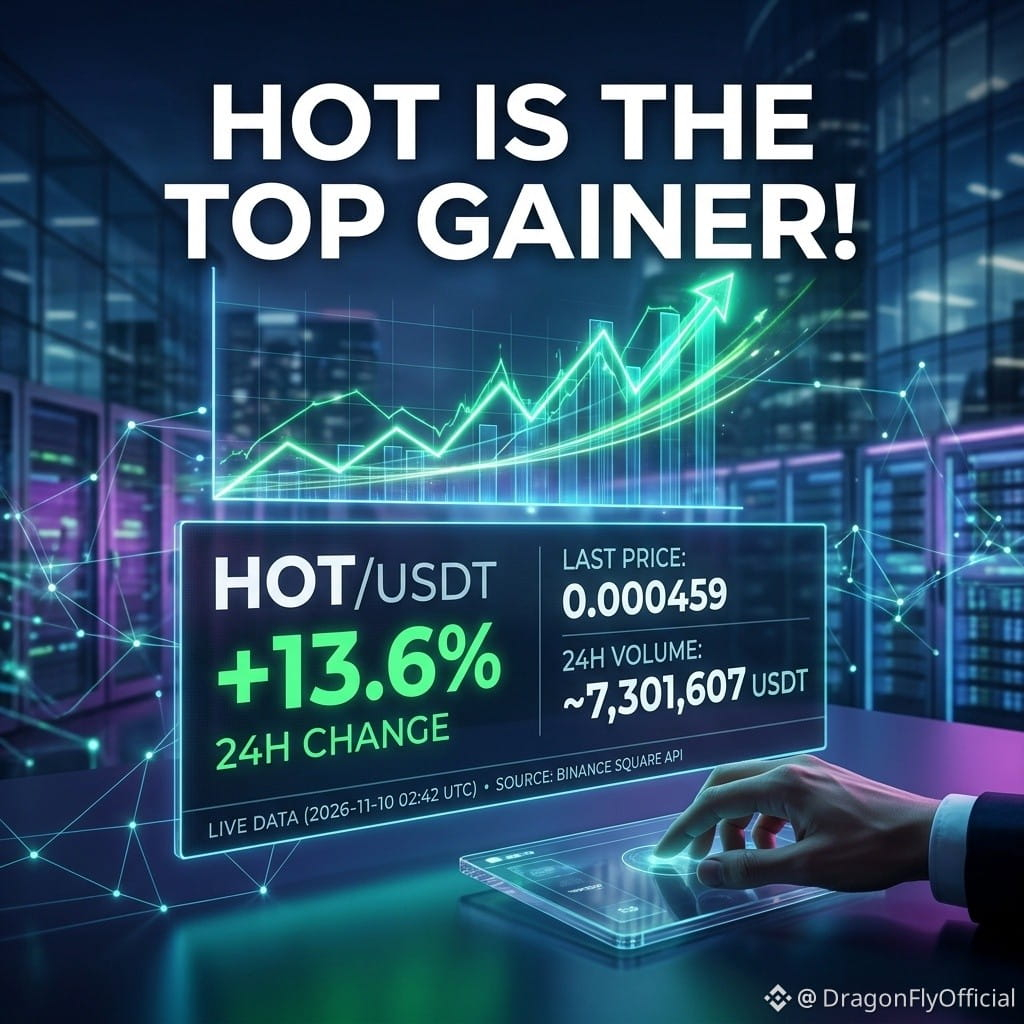
HOT's 13.6% gain shows positive short-term momentum, but one day's performance cannot establish a lasting recovery. Traders should avoid chasing sudden increases without checking market conditions and their own risk limits.
💡 What to Watch Next
Watch whether trading volume remains strong, whether buyers maintain interest, and whether HOT can sustain its momentum.
Dragonfly Official reminds readers that crypto trading is risky. Keep positions small, use a stop loss where appropriate, and risk only what you can afford to lose. This is not financial advice.
$HOT
HOT GAINS 13.6%: WHAT IS SUPPORTING THE RALLY, AND WHAT COULD GO WRONG?
🔍 Balanced View: Momentum Needs Confirmation
HOT's 13.6% gain shows positive short-term momentum, but one day's performance cannot establish a lasting recovery. Traders should avoid chasing sudden increases without checking market conditions and their own risk limits.
💡 What to Watch Next
Watch whether trading volume remains strong, whether buyers maintain interest, and whether HOT can sustain its momentum.
Dragonfly Official reminds readers that crypto trading is risky. Keep positions small, use a stop loss where appropriate, and risk only what you can afford to lose. This is not financial advice.
$HOT
🔍 Balanced View: Momentum Needs Confirmation
HOT's 13.6% gain shows positive short-term momentum, but one day's performance cannot establish a lasting recovery. Traders should avoid chasing sudden increases without checking market conditions and their own risk limits.
💡 What to Watch Next
Watch whether trading volume remains strong, whether buyers maintain interest, and whether HOT can sustain its momentum.
Dragonfly Official reminds readers that crypto trading is risky. Keep positions small, use a stop loss where appropriate, and risk only what you can afford to lose. This is not financial advice.
$HOT
165
TST ЗРОСЛА НА 12%: ЧИ ЗРОСТАЄ ІНТЕРЕС ДО ПОКУПОК, ЧИ ЦЕ КОРОТКОЧАСНИЙ РУХ?
❓ Що відбувається?
TST привернула увагу ринку, зрісши на 12,0% за 24 години. Але чи є це зростання початком сильнішого імпульсу, чи лише тимчасовим сплеском купівельної активності? Дані торгів дають кілька корисних підказок.
📊 Огляд ринку
Станом на 10 листопада 2026 року, 02:42 UTC:
Торгова пара: TST/USDT
Остання ціна: $0.01281
Зміна за 24 години: +12.0%
Обсяг торгів за 24 години: приблизно $8,162,403
Поєднання позитивної зміни ціни та значної торгової активності свідчить про чималий інтерес учасників ринку до TST.
🔍 Можливі причини
Цей рух могли спричинити посилення інтересу до купівлі, відновлення уваги трейдерів, спекулятивна активність або загальні настрої на ринку. Однак наявні дані не підтверджують, який саме чинник став причиною.
Саме по собі зростання ціни не доводить, що довгостроковий попит збільшується. Перш ніж вважати цей рух стійким трендом, трейдерам варто дочекатися продовження активності.
⚖️ Інший бік
Швидке зростання може привабити короткострокових трейдерів, які прагнуть швидкого прибутку. Якщо інтерес до купівлі ослабне або активізуються продавці, ціна може розвернутися. Великий обсяг торгів не гарантує продовження висхідного руху.
⚠️ Наостанок
Торгівля криптовалютою пов’язана з ризиком, а цей аналіз не є фінансовою порадою. Будьте обачні, перевіряйте факти та завжди мисліть самостійно, перш ніж ухвалювати торгове рішення.
#TST #CryptoMarket #TopGainersonBinance r #CryptoAnalysisb #TradingRisk
TST ЗРОСЛА НА 12%: ЧИ ЗРОСТАЄ ІНТЕРЕС ДО ПОКУПОК, ЧИ ЦЕ КОРОТКОЧАСНИЙ РУХ?
❓ Що відбувається?
TST привернула увагу ринку, зрісши на 12,0% за 24 години. Але чи є це зростання початком сильнішого імпульсу, чи лише тимчасовим сплеском купівельної активності? Дані торгів дають кілька корисних підказок.
📊 Огляд ринку
Станом на 10 листопада 2026 року, 02:42 UTC:
Торгова пара: TST/USDT
Остання ціна: $0.01281
Зміна за 24 години: +12.0%
Обсяг торгів за 24 години: приблизно $8,162,403
Поєднання позитивної зміни ціни та значної торгової активності свідчить про чималий інтерес учасників ринку до TST.
🔍 Можливі причини
Цей рух могли спричинити посилення інтересу до купівлі, відновлення уваги трейдерів, спекулятивна активність або загальні настрої на ринку. Однак наявні дані не підтверджують, який саме чинник став причиною.
Саме по собі зростання ціни не доводить, що довгостроковий попит збільшується. Перш ніж вважати цей рух стійким трендом, трейдерам варто дочекатися продовження активності.
⚖️ Інший бік
Швидке зростання може привабити короткострокових трейдерів, які прагнуть швидкого прибутку. Якщо інтерес до купівлі ослабне або активізуються продавці, ціна може розвернутися. Великий обсяг торгів не гарантує продовження висхідного руху.
⚠️ Наостанок
Торгівля криптовалютою пов’язана з ризиком, а цей аналіз не є фінансовою порадою. Будьте обачні, перевіряйте факти та завжди мисліть самостійно, перш ніж ухвалювати торгове рішення.
#TST #CryptoMarket #TopGainersonBinance r #CryptoAnalysisb #TradingRisk
❓ Що відбувається?
TST привернула увагу ринку, зрісши на 12,0% за 24 години. Але чи є це зростання початком сильнішого імпульсу, чи лише тимчасовим сплеском купівельної активності? Дані торгів дають кілька корисних підказок.
📊 Огляд ринку
Станом на 10 листопада 2026 року, 02:42 UTC:
Торгова пара: TST/USDT
Остання ціна: $0.01281
Зміна за 24 години: +12.0%
Обсяг торгів за 24 години: приблизно $8,162,403
Поєднання позитивної зміни ціни та значної торгової активності свідчить про чималий інтерес учасників ринку до TST.
🔍 Можливі причини
Цей рух могли спричинити посилення інтересу до купівлі, відновлення уваги трейдерів, спекулятивна активність або загальні настрої на ринку. Однак наявні дані не підтверджують, який саме чинник став причиною.
Саме по собі зростання ціни не доводить, що довгостроковий попит збільшується. Перш ніж вважати цей рух стійким трендом, трейдерам варто дочекатися продовження активності.
⚖️ Інший бік
Швидке зростання може привабити короткострокових трейдерів, які прагнуть швидкого прибутку. Якщо інтерес до купівлі ослабне або активізуються продавці, ціна може розвернутися. Великий обсяг торгів не гарантує продовження висхідного руху.
⚠️ Наостанок
Торгівля криптовалютою пов’язана з ризиком, а цей аналіз не є фінансовою порадою. Будьте обачні, перевіряйте факти та завжди мисліть самостійно, перш ніж ухвалювати торгове рішення.
#TST #CryptoMarket #TopGainersonBinance r #CryptoAnalysisb #TradingRisk
233
ЧОМУ SOXLB ЗРОС НА 18,3%? ФАКТИ ПРО СЬОГОДНІШНЬОГО ЛІДЕРА ЗРОСТАННЯ
📈 МІФ: ЧЕРГОВИЙ КРИПТОПАМП
ФАКТ: ІНШИЙ ТИП АКТИВУ
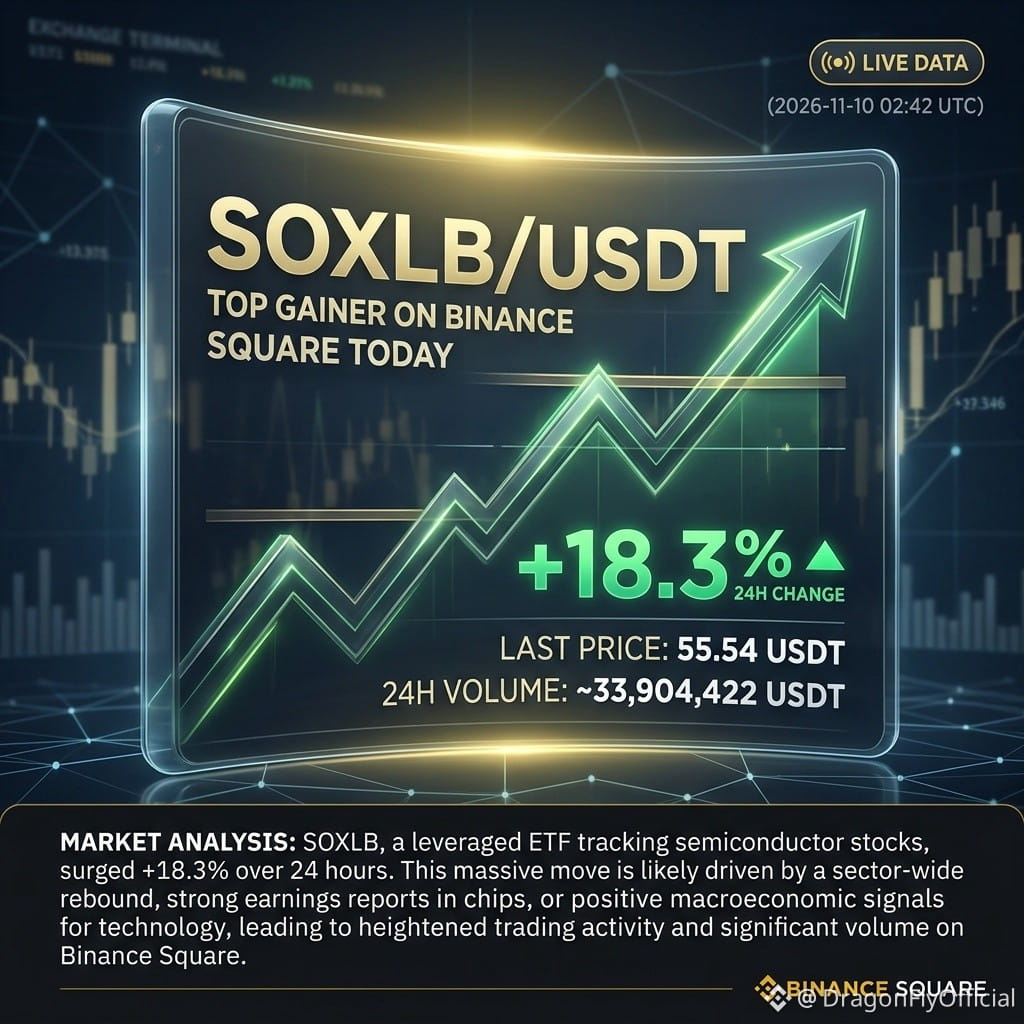
SOXLB — це не звичайна криптовалюта. Це токенізований фінансовий актив, пов’язаний з ETF Semicon Bull 3X, який забезпечує кредитне плече для інвестицій в акції виробників напівпровідників. Це означає, що його динаміка пов’язана з традиційним ринком напівпровідників, а не лише з настроями на крипторинку.
📊 ОГЛЯД РИНКУ
Згідно з останніми оприлюдненими даними станом на 10 листопада 2026 року, 02:42 UTC:
Торгова пара: SOXLB/USDT
Остання ціна: 55,54 USDT
Зростання за 24 години: +18,3%
Обсяг торгів за 24 години: приблизно 33 904 422 USDT
Таке значне зростання ціни та активні торги привернули увагу до SOXLB як до одного з лідерів зростання сьогодні.
⚠️ МІФ: ЗРОСТАННЯ НА 18,3% ОЗНАЧАЄ НИЗЬКИЙ РИЗИК
ФАКТ: КРЕДИТНЕ ПЛЕЧЕ МОЖЕ ПРАЦЮВАТИ В ОБИДВА БОКИ
Базовий ETF SOXLB використовує щоденне кредитне плече 3X. Це може збільшити прибуток, але також може посилити збитки. Щоденне кредитне плече та ефект складного відсотка можуть призвести до несподіваних результатів у разі тривалого утримання активу.
💡 ПЕРСПЕКТИВИ ТОРГІВЛІ
Значне денне зростання варте уваги, але не є приводом купувати бездумно. Перед ухваленням рішення стежте за динамікою ринку напівпровідників, обсягом торгів і стабільністю ціни. На основі наявних даних неможливо визначити надійні рівні входу, стоп-лосу чи цільової ціни.
Відводьте позиціям невелику частку портфеля, використовуйте доречний стоп-лос і ризикуйте лише тією сумою, яку можете дозволити собі втратити.
Висновок від Dragonfly Official: значне зростання привертає увагу, але саме розуміння кредитного плеча та управління ризиками відрізняють обґрунтовані рішення від спекуляцій.
Торгівля криптовалютою пов’язана з ризиком. Це не фінансова порада.
$SOXLB
{spot}(SOXLBUSDT)
ЧОМУ SOXLB ЗРОС НА 18,3%? ФАКТИ ПРО СЬОГОДНІШНЬОГО ЛІДЕРА ЗРОСТАННЯ
📈 МІФ: ЧЕРГОВИЙ КРИПТОПАМП
ФАКТ: ІНШИЙ ТИП АКТИВУ
SOXLB — це не звичайна криптовалюта. Це токенізований фінансовий актив, пов’язаний з ETF Semicon Bull 3X, який забезпечує кредитне плече для інвестицій в акції виробників напівпровідників. Це означає, що його динаміка пов’язана з традиційним ринком напівпровідників, а не лише з настроями на крипторинку.
📊 ОГЛЯД РИНКУ
Згідно з останніми оприлюдненими даними станом на 10 листопада 2026 року, 02:42 UTC:
Торгова пара: SOXLB/USDT
Остання ціна: 55,54 USDT
Зростання за 24 години: +18,3%
Обсяг торгів за 24 години: приблизно 33 904 422 USDT
Таке значне зростання ціни та активні торги привернули увагу до SOXLB як до одного з лідерів зростання сьогодні.
⚠️ МІФ: ЗРОСТАННЯ НА 18,3% ОЗНАЧАЄ НИЗЬКИЙ РИЗИК
ФАКТ: КРЕДИТНЕ ПЛЕЧЕ МОЖЕ ПРАЦЮВАТИ В ОБИДВА БОКИ
Базовий ETF SOXLB використовує щоденне кредитне плече 3X. Це може збільшити прибуток, але також може посилити збитки. Щоденне кредитне плече та ефект складного відсотка можуть призвести до несподіваних результатів у разі тривалого утримання активу.
💡 ПЕРСПЕКТИВИ ТОРГІВЛІ
Значне денне зростання варте уваги, але не є приводом купувати бездумно. Перед ухваленням рішення стежте за динамікою ринку напівпровідників, обсягом торгів і стабільністю ціни. На основі наявних даних неможливо визначити надійні рівні входу, стоп-лосу чи цільової ціни.
Відводьте позиціям невелику частку портфеля, використовуйте доречний стоп-лос і ризикуйте лише тією сумою, яку можете дозволити собі втратити.
Висновок від Dragonfly Official: значне зростання привертає увагу, але саме розуміння кредитного плеча та управління ризиками відрізняють обґрунтовані рішення від спекуляцій.
Торгівля криптовалютою пов’язана з ризиком. Це не фінансова порада.
$SOXLB
📈 МІФ: ЧЕРГОВИЙ КРИПТОПАМП
ФАКТ: ІНШИЙ ТИП АКТИВУ
SOXLB — це не звичайна криптовалюта. Це токенізований фінансовий актив, пов’язаний з ETF Semicon Bull 3X, який забезпечує кредитне плече для інвестицій в акції виробників напівпровідників. Це означає, що його динаміка пов’язана з традиційним ринком напівпровідників, а не лише з настроями на крипторинку.
📊 ОГЛЯД РИНКУ
Згідно з останніми оприлюдненими даними станом на 10 листопада 2026 року, 02:42 UTC:
Торгова пара: SOXLB/USDT
Остання ціна: 55,54 USDT
Зростання за 24 години: +18,3%
Обсяг торгів за 24 години: приблизно 33 904 422 USDT
Таке значне зростання ціни та активні торги привернули увагу до SOXLB як до одного з лідерів зростання сьогодні.
⚠️ МІФ: ЗРОСТАННЯ НА 18,3% ОЗНАЧАЄ НИЗЬКИЙ РИЗИК
ФАКТ: КРЕДИТНЕ ПЛЕЧЕ МОЖЕ ПРАЦЮВАТИ В ОБИДВА БОКИ
Базовий ETF SOXLB використовує щоденне кредитне плече 3X. Це може збільшити прибуток, але також може посилити збитки. Щоденне кредитне плече та ефект складного відсотка можуть призвести до несподіваних результатів у разі тривалого утримання активу.
💡 ПЕРСПЕКТИВИ ТОРГІВЛІ
Значне денне зростання варте уваги, але не є приводом купувати бездумно. Перед ухваленням рішення стежте за динамікою ринку напівпровідників, обсягом торгів і стабільністю ціни. На основі наявних даних неможливо визначити надійні рівні входу, стоп-лосу чи цільової ціни.
Відводьте позиціям невелику частку портфеля, використовуйте доречний стоп-лос і ризикуйте лише тією сумою, яку можете дозволити собі втратити.
Висновок від Dragonfly Official: значне зростання привертає увагу, але саме розуміння кредитного плеча та управління ризиками відрізняють обґрунтовані рішення від спекуляцій.
Торгівля криптовалютою пов’язана з ризиком. Це не фінансова порада.
$SOXLB
74
INIT ЗРОСЛА НА 57,6%: ЦЕ СПРАВЖНЄ ВІДНОВЛЕННЯ ЧИ КОРОТКОСТРОКОВА ХВИЛЯ ПОКУПОК?
📊 МІФ: ЗРОСТАННЯ ЦІНИ НА 57% ОЗНАЧАЄ, ЩО ТЕПЕР МОНЕТУ БЕЗПЕЧНО КУПУВАТИ.
Не обов’язково. Різке зростання може свідчити про значний інтерес ринку, але також може призвести до підвищеної волатильності та раптових розворотів. INIT — гарний приклад того, чому трейдерам варто дивитися не лише на відсоток зростання.
📈 П: ЩО СТАЛОСЯ З INIT?
Станом на 10 листопада 2026 року, 02:42 UTC, для INIT/USDT зафіксовано:
Остання ціна: 0,19856 USDT
Зміна за 24 години: +57,6%
Обсяг торгів за 24 години: приблизно 13,61 мільйона USDT
Завдяки такому сильному результату INIT стала однією з найприбутковіших монет дня.
🔍 П: ЧОМУ ЦЕ ЗРОСТАННЯ ВАЖЛИВЕ?
Поєднання значного зростання ціни та високої торгової активності свідчить про посилення участі ринку.
Однак більший обсяг торгів не підтверджує автоматично довгостроковий попит. Він також може відображати короткострокові спекуляції, торгівлю на імпульсі та реакцію трейдерів на швидкі зміни ціни.
💡 П: ЩО МОЖЕ ПІДШТОВХУВАТИ ЗРОСТАННЯ?
Initia — це блокчейн-екосистема, тож упевненість у її технологіях, активність екосистеми та загальні настрої на ринку можуть впливати на інтерес до INIT.
Однак наявні дані не підтверджують жодної конкретної причини цього зростання. Трейдерам не варто сприймати припущення як доведений каталізатор.
⚠️ П: ЯКІ НАЙБІЛЬШІ РИЗИКИ?
Після стрімкого зростання фіксація прибутку може спричинити раптовий тиск продавців. Імпульс може згаснути, а волатильність цін — призвести до неочікуваних збитків. Купувати актив лише тому, що його ціна зростає, не маючи чіткого плану, може бути небезпечно.
#INIT #Initia #Крипторинок #ЛідерЗростання #Криптотрейдинг
INIT ЗРОСЛА НА 57,6%: ЦЕ СПРАВЖНЄ ВІДНОВЛЕННЯ ЧИ КОРОТКОСТРОКОВА ХВИЛЯ ПОКУПОК?
📊 МІФ: ЗРОСТАННЯ ЦІНИ НА 57% ОЗНАЧАЄ, ЩО ТЕПЕР МОНЕТУ БЕЗПЕЧНО КУПУВАТИ.
Не обов’язково. Різке зростання може свідчити про значний інтерес ринку, але також може призвести до підвищеної волатильності та раптових розворотів. INIT — гарний приклад того, чому трейдерам варто дивитися не лише на відсоток зростання.
📈 П: ЩО СТАЛОСЯ З INIT?
Станом на 10 листопада 2026 року, 02:42 UTC, для INIT/USDT зафіксовано:
Остання ціна: 0,19856 USDT
Зміна за 24 години: +57,6%
Обсяг торгів за 24 години: приблизно 13,61 мільйона USDT
Завдяки такому сильному результату INIT стала однією з найприбутковіших монет дня.
🔍 П: ЧОМУ ЦЕ ЗРОСТАННЯ ВАЖЛИВЕ?
Поєднання значного зростання ціни та високої торгової активності свідчить про посилення участі ринку.
Однак більший обсяг торгів не підтверджує автоматично довгостроковий попит. Він також може відображати короткострокові спекуляції, торгівлю на імпульсі та реакцію трейдерів на швидкі зміни ціни.
💡 П: ЩО МОЖЕ ПІДШТОВХУВАТИ ЗРОСТАННЯ?
Initia — це блокчейн-екосистема, тож упевненість у її технологіях, активність екосистеми та загальні настрої на ринку можуть впливати на інтерес до INIT.
Однак наявні дані не підтверджують жодної конкретної причини цього зростання. Трейдерам не варто сприймати припущення як доведений каталізатор.
⚠️ П: ЯКІ НАЙБІЛЬШІ РИЗИКИ?
Після стрімкого зростання фіксація прибутку може спричинити раптовий тиск продавців. Імпульс може згаснути, а волатильність цін — призвести до неочікуваних збитків. Купувати актив лише тому, що його ціна зростає, не маючи чіткого плану, може бути небезпечно.
#INIT #Initia #Крипторинок #ЛідерЗростання #Криптотрейдинг
📊 МІФ: ЗРОСТАННЯ ЦІНИ НА 57% ОЗНАЧАЄ, ЩО ТЕПЕР МОНЕТУ БЕЗПЕЧНО КУПУВАТИ.
Не обов’язково. Різке зростання може свідчити про значний інтерес ринку, але також може призвести до підвищеної волатильності та раптових розворотів. INIT — гарний приклад того, чому трейдерам варто дивитися не лише на відсоток зростання.
📈 П: ЩО СТАЛОСЯ З INIT?
Станом на 10 листопада 2026 року, 02:42 UTC, для INIT/USDT зафіксовано:
Остання ціна: 0,19856 USDT
Зміна за 24 години: +57,6%
Обсяг торгів за 24 години: приблизно 13,61 мільйона USDT
Завдяки такому сильному результату INIT стала однією з найприбутковіших монет дня.
🔍 П: ЧОМУ ЦЕ ЗРОСТАННЯ ВАЖЛИВЕ?
Поєднання значного зростання ціни та високої торгової активності свідчить про посилення участі ринку.
Однак більший обсяг торгів не підтверджує автоматично довгостроковий попит. Він також може відображати короткострокові спекуляції, торгівлю на імпульсі та реакцію трейдерів на швидкі зміни ціни.
💡 П: ЩО МОЖЕ ПІДШТОВХУВАТИ ЗРОСТАННЯ?
Initia — це блокчейн-екосистема, тож упевненість у її технологіях, активність екосистеми та загальні настрої на ринку можуть впливати на інтерес до INIT.
Однак наявні дані не підтверджують жодної конкретної причини цього зростання. Трейдерам не варто сприймати припущення як доведений каталізатор.
⚠️ П: ЯКІ НАЙБІЛЬШІ РИЗИКИ?
Після стрімкого зростання фіксація прибутку може спричинити раптовий тиск продавців. Імпульс може згаснути, а волатильність цін — призвести до неочікуваних збитків. Купувати актив лише тому, що його ціна зростає, не маючи чіткого плану, може бути небезпечно.
#INIT #Initia #Крипторинок #ЛідерЗростання #Криптотрейдинг
136
Переглянути переклад
GNS SURGES 34.7%: WHAT IS DRIVING THE SUDDEN BUYING INTEREST?
📈 WHAT HAPPENED TO GNS?
GNS/USDT has recorded a strong 34.7% gain in 24 hours, reaching $0.427. Its 24-hour trading volume has also reached approximately $6.46 million. This makes GNS a coin worth watching as traders look for opportunities in the market.
🔍 WHAT IS GNS?
GNS is the token of Gains Network, a decentralized trading ecosystem. Its main focus is providing on-chain leveraged trading. In simple words, it allows users to trade different markets through blockchain-based technology.
📊 WHY IS THE PRICE RISING?
A 34.7% increase alongside millions of dollars in trading volume suggests strong market activity. Possible factors include increased buying interest, short-term speculation, renewed attention toward the project, or broader market sentiment.
However, the available figures do not confirm which factor caused the rally. Higher volume shows increased trading activity, not necessarily long-term investor demand.
💡 WHAT SHOULD TRADERS WATCH?
Before considering a position, watch whether buying activity continues, whether volume remains strong, and whether the price can maintain its recent gains. Avoid chasing a sudden pump without confirmation. No reliable entry, stop-loss, or take-profit levels can be established from the supplied data alone.
⚠️ THE BIGGER PICTURE
GNS has delivered an impressive daily move, but sharp rallies can reverse quickly. Keep position sizes small, use a suitable stop loss, and risk only what you can afford to lose.
GNS SURGES 34.7%: WHAT IS DRIVING THE SUDDEN BUYING INTEREST?
📈 WHAT HAPPENED TO GNS?
GNS/USDT has recorded a strong 34.7% gain in 24 hours, reaching $0.427. Its 24-hour trading volume has also reached approximately $6.46 million. This makes GNS a coin worth watching as traders look for opportunities in the market.
🔍 WHAT IS GNS?
GNS is the token of Gains Network, a decentralized trading ecosystem. Its main focus is providing on-chain leveraged trading. In simple words, it allows users to trade different markets through blockchain-based technology.
📊 WHY IS THE PRICE RISING?
A 34.7% increase alongside millions of dollars in trading volume suggests strong market activity. Possible factors include increased buying interest, short-term speculation, renewed attention toward the project, or broader market sentiment.
However, the available figures do not confirm which factor caused the rally. Higher volume shows increased trading activity, not necessarily long-term investor demand.
💡 WHAT SHOULD TRADERS WATCH?
Before considering a position, watch whether buying activity continues, whether volume remains strong, and whether the price can maintain its recent gains. Avoid chasing a sudden pump without confirmation. No reliable entry, stop-loss, or take-profit levels can be established from the supplied data alone.
⚠️ THE BIGGER PICTURE
GNS has delivered an impressive daily move, but sharp rallies can reverse quickly. Keep position sizes small, use a suitable stop loss, and risk only what you can afford to lose.
📈 WHAT HAPPENED TO GNS?
GNS/USDT has recorded a strong 34.7% gain in 24 hours, reaching $0.427. Its 24-hour trading volume has also reached approximately $6.46 million. This makes GNS a coin worth watching as traders look for opportunities in the market.
🔍 WHAT IS GNS?
GNS is the token of Gains Network, a decentralized trading ecosystem. Its main focus is providing on-chain leveraged trading. In simple words, it allows users to trade different markets through blockchain-based technology.
📊 WHY IS THE PRICE RISING?
A 34.7% increase alongside millions of dollars in trading volume suggests strong market activity. Possible factors include increased buying interest, short-term speculation, renewed attention toward the project, or broader market sentiment.
However, the available figures do not confirm which factor caused the rally. Higher volume shows increased trading activity, not necessarily long-term investor demand.
💡 WHAT SHOULD TRADERS WATCH?
Before considering a position, watch whether buying activity continues, whether volume remains strong, and whether the price can maintain its recent gains. Avoid chasing a sudden pump without confirmation. No reliable entry, stop-loss, or take-profit levels can be established from the supplied data alone.
⚠️ THE BIGGER PICTURE
GNS has delivered an impressive daily move, but sharp rallies can reverse quickly. Keep position sizes small, use a suitable stop loss, and risk only what you can afford to lose.
27
Переглянути переклад
YOUR ACCOUNT CHANGED. SEND YOUR MESSAGE AGAIN
YOUR ACCOUNT CHANGED. SEND YOUR MESSAGE AGAIN
📊 ЩО ЩОЙНО СТАЛОСЯ?
На крипторинку сталася ще одна масштабна хвиля ліквідацій: за 24 години 9 листопада було ліквідовано позиції з кредитним плечем на суму приблизно 1,16 мільярда доларів.
Раптове падіння ринку застало тисячі трейдерів зненацька. За цей період було ліквідовано позиції понад 167 000 трейдерів, що показує, як швидко ситуація на ринку може обернутися проти тих, хто використовує кредитне плече.
Найбільше постраждали довгі позиції — приблизно 1,04 мільярда доларів. На короткі позиції припало близько 117 мільйонів доларів.
🔍 ЧОМУ ЗБИТКИ СТАЛИ ТАКИМИ ВЕЛИКИМИ?
Головною проблемою стало надмірне кредитне плече на тлі падіння цін.
Довга позиція — це угода, яка приносить прибуток у разі зростання цін. Коли трейдери позичають кошти або використовують кредитне плече, щоб збільшити розмір позиції, навіть відносно невелике падіння ціни може призвести до значних збитків.
Якщо доступної маржі стає недостатньо, біржі автоматично закривають позиції. Таке примусове закриття називається ліквідацією.
Тиск продажів може штовхнути ціни ще нижче, спричиняючи нові ліквідації та ланцюгову реакцію.
Трейдери Ethereum зазнали особливо великих збитків: було ліквідовано позицій на суму понад 500 мільйонів доларів, тоді як для Bitcoin цей показник становив приблизно 309 мільйонів доларів.
⚠️ ЩО ЦЕ ОЗНАЧАЄ ДЛЯ РИНКУ?
Дані про ліквідації свідчать, що перед останнім падінням трейдери, які грали на підвищення, мали значний обсяг відкритих позицій.
Bitcoin ненадовго опустився нижче 74 000 доларів, посиливши тиск на й без того нервовий ринок. Однак масштабні ліквідації не обов’язково означають, що починається триваліший ведмежий ринок.
.
Вони свідчать про те, що з ринку зникло надмірне кредитне плече, але не гарантують негайного відновлення.
📈 ЩО МОЖЕ СТАТИСЯ ДАЛІ?
Подальший напрямок руху ринку залежатиме від того, чи повернуться покупці з достатньою силою, щоб підтримати ціни.
Якщо тиск продажів триватиме, можливі подальша волатильність і примусове закриття позицій. Якщо попит на купівлю зросте, ринок може стабілізуватися, адже слабші позиції з кредитним плечем уже було ліквідовано.
📊 ЩО ЩОЙНО СТАЛОСЯ?
На крипторинку сталася ще одна масштабна хвиля ліквідацій: за 24 години 9 листопада було ліквідовано позиції з кредитним плечем на суму приблизно 1,16 мільярда доларів.
Раптове падіння ринку застало тисячі трейдерів зненацька. За цей період було ліквідовано позиції понад 167 000 трейдерів, що показує, як швидко ситуація на ринку може обернутися проти тих, хто використовує кредитне плече.
Найбільше постраждали довгі позиції — приблизно 1,04 мільярда доларів. На короткі позиції припало близько 117 мільйонів доларів.
🔍 ЧОМУ ЗБИТКИ СТАЛИ ТАКИМИ ВЕЛИКИМИ?
Головною проблемою стало надмірне кредитне плече на тлі падіння цін.
Довга позиція — це угода, яка приносить прибуток у разі зростання цін. Коли трейдери позичають кошти або використовують кредитне плече, щоб збільшити розмір позиції, навіть відносно невелике падіння ціни може призвести до значних збитків.
Якщо доступної маржі стає недостатньо, біржі автоматично закривають позиції. Таке примусове закриття називається ліквідацією.
Тиск продажів може штовхнути ціни ще нижче, спричиняючи нові ліквідації та ланцюгову реакцію.
Трейдери Ethereum зазнали особливо великих збитків: було ліквідовано позицій на суму понад 500 мільйонів доларів, тоді як для Bitcoin цей показник становив приблизно 309 мільйонів доларів.
⚠️ ЩО ЦЕ ОЗНАЧАЄ ДЛЯ РИНКУ?
Дані про ліквідації свідчать, що перед останнім падінням трейдери, які грали на підвищення, мали значний обсяг відкритих позицій.
Bitcoin ненадовго опустився нижче 74 000 доларів, посиливши тиск на й без того нервовий ринок. Однак масштабні ліквідації не обов’язково означають, що починається триваліший ведмежий ринок.
.
Вони свідчать про те, що з ринку зникло надмірне кредитне плече, але не гарантують негайного відновлення.
📈 ЩО МОЖЕ СТАТИСЯ ДАЛІ?
Подальший напрямок руху ринку залежатиме від того, чи повернуться покупці з достатньою силою, щоб підтримати ціни.
Якщо тиск продажів триватиме, можливі подальша волатильність і примусове закриття позицій. Якщо попит на купівлю зросте, ринок може стабілізуватися, адже слабші позиції з кредитним плечем уже було ліквідовано.
На крипторинку сталася ще одна масштабна хвиля ліквідацій: за 24 години 9 листопада було ліквідовано позиції з кредитним плечем на суму приблизно 1,16 мільярда доларів.
Раптове падіння ринку застало тисячі трейдерів зненацька. За цей період було ліквідовано позиції понад 167 000 трейдерів, що показує, як швидко ситуація на ринку може обернутися проти тих, хто використовує кредитне плече.
Найбільше постраждали довгі позиції — приблизно 1,04 мільярда доларів. На короткі позиції припало близько 117 мільйонів доларів.
🔍 ЧОМУ ЗБИТКИ СТАЛИ ТАКИМИ ВЕЛИКИМИ?
Головною проблемою стало надмірне кредитне плече на тлі падіння цін.
Довга позиція — це угода, яка приносить прибуток у разі зростання цін. Коли трейдери позичають кошти або використовують кредитне плече, щоб збільшити розмір позиції, навіть відносно невелике падіння ціни може призвести до значних збитків.
Якщо доступної маржі стає недостатньо, біржі автоматично закривають позиції. Таке примусове закриття називається ліквідацією.
Тиск продажів може штовхнути ціни ще нижче, спричиняючи нові ліквідації та ланцюгову реакцію.
Трейдери Ethereum зазнали особливо великих збитків: було ліквідовано позицій на суму понад 500 мільйонів доларів, тоді як для Bitcoin цей показник становив приблизно 309 мільйонів доларів.
⚠️ ЩО ЦЕ ОЗНАЧАЄ ДЛЯ РИНКУ?
Дані про ліквідації свідчать, що перед останнім падінням трейдери, які грали на підвищення, мали значний обсяг відкритих позицій.
Bitcoin ненадовго опустився нижче 74 000 доларів, посиливши тиск на й без того нервовий ринок. Однак масштабні ліквідації не обов’язково означають, що починається триваліший ведмежий ринок.
.
Вони свідчать про те, що з ринку зникло надмірне кредитне плече, але не гарантують негайного відновлення.
📈 ЩО МОЖЕ СТАТИСЯ ДАЛІ?
Подальший напрямок руху ринку залежатиме від того, чи повернуться покупці з достатньою силою, щоб підтримати ціни.
Якщо тиск продажів триватиме, можливі подальша волатильність і примусове закриття позицій. Якщо попит на купівлю зросте, ринок може стабілізуватися, адже слабші позиції з кредитним плечем уже було ліквідовано.
52
ANTHROPIC НА ПОРОЗІ IPO: ЧИ ВТРИМАЄ ВОНА СВОЮ ОЦІНКУ ЧИ ВІДКЛАДЕ ГУЧНИЙ ДЕБЮТ?
🏢 ГУЧНИЙ ЗАПУСК — ВАЖЛИВЕ ПИТАННЯ
Уявіть, що ви створили одну з найдорожчих компаній у світі, яка займається штучним інтелектом. Ваші технології залучають мільйони користувачів, інвестори в захваті, і ви готуєтеся вийти на фондовий ринок. Але незадовго до запуску деякі покупці починають ставити під сумнів ціну.
Саме з таким викликом зіткнулася Anthropic — компанія, що створила Claude AI, — готуючись до масштабного первинного публічного розміщення акцій (IPO). Запланований на листопад вихід на біржу привертає увагу, але довіра інвесторів проходить серйозне випробування.
📊 ПИТАННЯ НА 1,5 ТРИЛЬЙОНА ДОЛАРІВ
Можливу оцінку Anthropic перед IPO обговорюють на рівні близько 1,5 трильйона доларів — це менше за попередні очікування, що сягали майже 2 трильйонів.
Однак деякі потенційні інвестори вважають, що навіть 1,5 трильйона доларів — це надто дорого за нинішніх ринкових умов. За повідомленнями, частина з них хоче отримати більшу знижку, перш ніж вкладати гроші.
Перед компанією постає непростий вибір: зберегти амбітні очікування чи запропонувати акції за нижчою оцінкою, щоб залучити більше охочих їх купити.
⚠️ ЧОМУ ІНВЕСТОРИ ВАГАЮТЬСЯ
На ширшому технологічному ринку відбувся різкий розпродаж, що посилив тиск на компанії, пов’язані зі штучним інтелектом.
Інвестори також аналізують фінансове становище Anthropic, зокрема операційні витрати, квартальні збитки та значні зобов’язання щодо обчислювальної інфраструктури й бізнес-партнерів.
Ще одне важливе питання — зростання доходів. Інвестори чекають на жовтневі показники, щоб зрозуміти, чи покращилася ситуація після нещодавнього уповільнення зростання компанії.
💡 ВАЖЛИВИЙ УРОК ДЛЯ ІНВЕСТОРІВ В AI
Ситуація з Anthropic показує важливу відмінність між успіхом бізнесу та оцінкою компанії на фондовому ринку.
Компанія може мати потужні технології, високий попит і вражаючі темпи зростання доходів, але це не означає, що будь-яка ціна, яку просять інвестори, автоматично виправдана.
Для індустрії штучного інтелекту це IPO може стати важливою перевіркою того, чи готові інвестори й надалі платити величезну премію за майбутнє зростання.
ANTHROPIC НА ПОРОЗІ IPO: ЧИ ВТРИМАЄ ВОНА СВОЮ ОЦІНКУ ЧИ ВІДКЛАДЕ ГУЧНИЙ ДЕБЮТ?
🏢 ГУЧНИЙ ЗАПУСК — ВАЖЛИВЕ ПИТАННЯ
Уявіть, що ви створили одну з найдорожчих компаній у світі, яка займається штучним інтелектом. Ваші технології залучають мільйони користувачів, інвестори в захваті, і ви готуєтеся вийти на фондовий ринок. Але незадовго до запуску деякі покупці починають ставити під сумнів ціну.
Саме з таким викликом зіткнулася Anthropic — компанія, що створила Claude AI, — готуючись до масштабного первинного публічного розміщення акцій (IPO). Запланований на листопад вихід на біржу привертає увагу, але довіра інвесторів проходить серйозне випробування.
📊 ПИТАННЯ НА 1,5 ТРИЛЬЙОНА ДОЛАРІВ
Можливу оцінку Anthropic перед IPO обговорюють на рівні близько 1,5 трильйона доларів — це менше за попередні очікування, що сягали майже 2 трильйонів.
Однак деякі потенційні інвестори вважають, що навіть 1,5 трильйона доларів — це надто дорого за нинішніх ринкових умов. За повідомленнями, частина з них хоче отримати більшу знижку, перш ніж вкладати гроші.
Перед компанією постає непростий вибір: зберегти амбітні очікування чи запропонувати акції за нижчою оцінкою, щоб залучити більше охочих їх купити.
⚠️ ЧОМУ ІНВЕСТОРИ ВАГАЮТЬСЯ
На ширшому технологічному ринку відбувся різкий розпродаж, що посилив тиск на компанії, пов’язані зі штучним інтелектом.
Інвестори також аналізують фінансове становище Anthropic, зокрема операційні витрати, квартальні збитки та значні зобов’язання щодо обчислювальної інфраструктури й бізнес-партнерів.
Ще одне важливе питання — зростання доходів. Інвестори чекають на жовтневі показники, щоб зрозуміти, чи покращилася ситуація після нещодавнього уповільнення зростання компанії.
💡 ВАЖЛИВИЙ УРОК ДЛЯ ІНВЕСТОРІВ В AI
Ситуація з Anthropic показує важливу відмінність між успіхом бізнесу та оцінкою компанії на фондовому ринку.
Компанія може мати потужні технології, високий попит і вражаючі темпи зростання доходів, але це не означає, що будь-яка ціна, яку просять інвестори, автоматично виправдана.
Для індустрії штучного інтелекту це IPO може стати важливою перевіркою того, чи готові інвестори й надалі платити величезну премію за майбутнє зростання.
🏢 ГУЧНИЙ ЗАПУСК — ВАЖЛИВЕ ПИТАННЯ
Уявіть, що ви створили одну з найдорожчих компаній у світі, яка займається штучним інтелектом. Ваші технології залучають мільйони користувачів, інвестори в захваті, і ви готуєтеся вийти на фондовий ринок. Але незадовго до запуску деякі покупці починають ставити під сумнів ціну.
Саме з таким викликом зіткнулася Anthropic — компанія, що створила Claude AI, — готуючись до масштабного первинного публічного розміщення акцій (IPO). Запланований на листопад вихід на біржу привертає увагу, але довіра інвесторів проходить серйозне випробування.
📊 ПИТАННЯ НА 1,5 ТРИЛЬЙОНА ДОЛАРІВ
Можливу оцінку Anthropic перед IPO обговорюють на рівні близько 1,5 трильйона доларів — це менше за попередні очікування, що сягали майже 2 трильйонів.
Однак деякі потенційні інвестори вважають, що навіть 1,5 трильйона доларів — це надто дорого за нинішніх ринкових умов. За повідомленнями, частина з них хоче отримати більшу знижку, перш ніж вкладати гроші.
Перед компанією постає непростий вибір: зберегти амбітні очікування чи запропонувати акції за нижчою оцінкою, щоб залучити більше охочих їх купити.
⚠️ ЧОМУ ІНВЕСТОРИ ВАГАЮТЬСЯ
На ширшому технологічному ринку відбувся різкий розпродаж, що посилив тиск на компанії, пов’язані зі штучним інтелектом.
Інвестори також аналізують фінансове становище Anthropic, зокрема операційні витрати, квартальні збитки та значні зобов’язання щодо обчислювальної інфраструктури й бізнес-партнерів.
Ще одне важливе питання — зростання доходів. Інвестори чекають на жовтневі показники, щоб зрозуміти, чи покращилася ситуація після нещодавнього уповільнення зростання компанії.
💡 ВАЖЛИВИЙ УРОК ДЛЯ ІНВЕСТОРІВ В AI
Ситуація з Anthropic показує важливу відмінність між успіхом бізнесу та оцінкою компанії на фондовому ринку.
Компанія може мати потужні технології, високий попит і вражаючі темпи зростання доходів, але це не означає, що будь-яка ціна, яку просять інвестори, автоматично виправдана.
Для індустрії штучного інтелекту це IPO може стати важливою перевіркою того, чи готові інвестори й надалі платити величезну премію за майбутнє зростання.
136
Переглянути переклад
CPI TESTS DECEMBER RATE OUTLOOK: WILL INFLATION FORCE THE FED TO KEEP RATES HIGHER? 📊
Will the next US inflation report change expectations for December interest rates? Investors are waiting for October's Consumer Price Index (CPI), scheduled for November 10 at 8:30 a.m. ET.
This report matters because inflation remains a major concern for the Federal Reserve. Its results could influence borrowing costs, stock markets, the US dollar, Bitcoin, and the wider crypto market.
📊 INFLATION PRESSURE
September's US CPI increased to 3.7% year over year, compared with 3.4% in August. This shows that inflation pressure has not disappeared.
The Fed aims to bring inflation down to 2%. When prices continue rising too quickly, policymakers may keep interest rates high or increase them to slow spending and demand.
⚖️ DECEMBER DECISION
The Federal Reserve kept its benchmark interest rate at 3.75%–4.00% in October. However, expectations for December have shifted toward another possible increase.
Recent stronger employment data and persistent inflation have strengthened the case for tighter monetary policy. Markets are now paying close attention to whether the next CPI report supports that expectation.
₿ CRYPTO IMPACT
If inflation comes in hotter than exp
ected, investors may anticipate higher interest rates for longer. That could put pressure on riskier investments, including cryptocurrencies.
If inflation cools, market confidence could improve as investors reassess the Fed's future decisions. However, lower inflation does not automatically guarantee a rate cut.
💡 WHAT MATTERS
Dragonfly Official highlights three important factors to watch:
Headline CPI: The overall change in consumer prices.
Core CPI: Inflation excluding food and energy, which helps reveal underlying price pressure.
Market reaction: Bitcoin, the US dollar, bond yields, and stock markets may respond differently depending on the results.
WHAT COMES NEXT?
The October CPI report arrives November 10, followed by the December 9 Fed decision.
CPI TESTS DECEMBER RATE OUTLOOK: WILL INFLATION FORCE THE FED TO KEEP RATES HIGHER? 📊
Will the next US inflation report change expectations for December interest rates? Investors are waiting for October's Consumer Price Index (CPI), scheduled for November 10 at 8:30 a.m. ET.
This report matters because inflation remains a major concern for the Federal Reserve. Its results could influence borrowing costs, stock markets, the US dollar, Bitcoin, and the wider crypto market.
📊 INFLATION PRESSURE
September's US CPI increased to 3.7% year over year, compared with 3.4% in August. This shows that inflation pressure has not disappeared.
The Fed aims to bring inflation down to 2%. When prices continue rising too quickly, policymakers may keep interest rates high or increase them to slow spending and demand.
⚖️ DECEMBER DECISION
The Federal Reserve kept its benchmark interest rate at 3.75%–4.00% in October. However, expectations for December have shifted toward another possible increase.
Recent stronger employment data and persistent inflation have strengthened the case for tighter monetary policy. Markets are now paying close attention to whether the next CPI report supports that expectation.
₿ CRYPTO IMPACT
If inflation comes in hotter than exp
ected, investors may anticipate higher interest rates for longer. That could put pressure on riskier investments, including cryptocurrencies.
If inflation cools, market confidence could improve as investors reassess the Fed's future decisions. However, lower inflation does not automatically guarantee a rate cut.
💡 WHAT MATTERS
Dragonfly Official highlights three important factors to watch:
Headline CPI: The overall change in consumer prices.
Core CPI: Inflation excluding food and energy, which helps reveal underlying price pressure.
Market reaction: Bitcoin, the US dollar, bond yields, and stock markets may respond differently depending on the results.
WHAT COMES NEXT?
The October CPI report arrives November 10, followed by the December 9 Fed decision.
Will the next US inflation report change expectations for December interest rates? Investors are waiting for October's Consumer Price Index (CPI), scheduled for November 10 at 8:30 a.m. ET.
This report matters because inflation remains a major concern for the Federal Reserve. Its results could influence borrowing costs, stock markets, the US dollar, Bitcoin, and the wider crypto market.
📊 INFLATION PRESSURE
September's US CPI increased to 3.7% year over year, compared with 3.4% in August. This shows that inflation pressure has not disappeared.
The Fed aims to bring inflation down to 2%. When prices continue rising too quickly, policymakers may keep interest rates high or increase them to slow spending and demand.
⚖️ DECEMBER DECISION
The Federal Reserve kept its benchmark interest rate at 3.75%–4.00% in October. However, expectations for December have shifted toward another possible increase.
Recent stronger employment data and persistent inflation have strengthened the case for tighter monetary policy. Markets are now paying close attention to whether the next CPI report supports that expectation.
₿ CRYPTO IMPACT
If inflation comes in hotter than exp
ected, investors may anticipate higher interest rates for longer. That could put pressure on riskier investments, including cryptocurrencies.
If inflation cools, market confidence could improve as investors reassess the Fed's future decisions. However, lower inflation does not automatically guarantee a rate cut.
💡 WHAT MATTERS
Dragonfly Official highlights three important factors to watch:
Headline CPI: The overall change in consumer prices.
Core CPI: Inflation excluding food and energy, which helps reveal underlying price pressure.
Market reaction: Bitcoin, the US dollar, bond yields, and stock markets may respond differently depending on the results.
WHAT COMES NEXT?
The October CPI report arrives November 10, followed by the December 9 Fed decision.
44
Переглянути переклад
📊 FROM STRENGTH TO WEAKNESS: WHAT CHANGED?
Bitcoin was trading near $86,500 in early October. Now, after five consecutive weekly losses, it has fallen to approximately $74,800. This represents a decline of around 13.6% in five weeks. The latest weekly loss was approximately 4.5%, making it the steepest decline in the current losing streak.
For beginners, a red weekly candle simply means Bitcoin closed the week below its opening price. Five consecutive red candles show that selling pressure has continued for several weeks.
Several factors are affecting market confidence:
1. ETF Outflows: Investors withdrew approximately $1.28 billion from US spot Bitcoin ETFs during the first week of November, adding pressure to the market.
2. Market Uncertainty: Concerns about economic conditions, interest rates and technology stocks have weakened investor confidence.
3. Forced Liquidations: When leveraged traders cannot maintain their positions, exchanges automatically close them. This can create additional selling pressure and accelerate price drops.
📉 WHY FIVE LOSING WEEKS MATTER
Five consecutive weekly losses are unusual in Bitcoin's history. However, this pattern does not automatically mean another major crash is coming.
Previous losing streaks have produced different outcomes. Sometimes prices continued falling, while other times the market recovered. History offers useful lessons, but it cannot guarantee what happens next.
⚠️ WHAT SHOULD INVESTORS WATCH NOW?
Bitcoin's recent low near $73,500 is an important area to monitor. A sustained recovery above $75,000 could help improve short-term confidence. On the other hand, an
other decline below the recent low could increase selling pressure.
Bitcoin's five-week losing streak is a serious warning about market weakness, but it is not proof that recovery is impossible. Patience, research and discipline matter most when the market tests investors.
Crypto trading involves risk, and investors can lose their capital. Manage position sizes carefully, use stop losses and never risk money you cannot afford to lose
📊 FROM STRENGTH TO WEAKNESS: WHAT CHANGED?
Bitcoin was trading near $86,500 in early October. Now, after five consecutive weekly losses, it has fallen to approximately $74,800. This represents a decline of around 13.6% in five weeks. The latest weekly loss was approximately 4.5%, making it the steepest decline in the current losing streak.
For beginners, a red weekly candle simply means Bitcoin closed the week below its opening price. Five consecutive red candles show that selling pressure has continued for several weeks.
Several factors are affecting market confidence:
1. ETF Outflows: Investors withdrew approximately $1.28 billion from US spot Bitcoin ETFs during the first week of November, adding pressure to the market.
2. Market Uncertainty: Concerns about economic conditions, interest rates and technology stocks have weakened investor confidence.
3. Forced Liquidations: When leveraged traders cannot maintain their positions, exchanges automatically close them. This can create additional selling pressure and accelerate price drops.
📉 WHY FIVE LOSING WEEKS MATTER
Five consecutive weekly losses are unusual in Bitcoin's history. However, this pattern does not automatically mean another major crash is coming.
Previous losing streaks have produced different outcomes. Sometimes prices continued falling, while other times the market recovered. History offers useful lessons, but it cannot guarantee what happens next.
⚠️ WHAT SHOULD INVESTORS WATCH NOW?
Bitcoin's recent low near $73,500 is an important area to monitor. A sustained recovery above $75,000 could help improve short-term confidence. On the other hand, an
other decline below the recent low could increase selling pressure.
Bitcoin's five-week losing streak is a serious warning about market weakness, but it is not proof that recovery is impossible. Patience, research and discipline matter most when the market tests investors.
Crypto trading involves risk, and investors can lose their capital. Manage position sizes carefully, use stop losses and never risk money you cannot afford to lose
Bitcoin was trading near $86,500 in early October. Now, after five consecutive weekly losses, it has fallen to approximately $74,800. This represents a decline of around 13.6% in five weeks. The latest weekly loss was approximately 4.5%, making it the steepest decline in the current losing streak.
For beginners, a red weekly candle simply means Bitcoin closed the week below its opening price. Five consecutive red candles show that selling pressure has continued for several weeks.
Several factors are affecting market confidence:
1. ETF Outflows: Investors withdrew approximately $1.28 billion from US spot Bitcoin ETFs during the first week of November, adding pressure to the market.
2. Market Uncertainty: Concerns about economic conditions, interest rates and technology stocks have weakened investor confidence.
3. Forced Liquidations: When leveraged traders cannot maintain their positions, exchanges automatically close them. This can create additional selling pressure and accelerate price drops.
📉 WHY FIVE LOSING WEEKS MATTER
Five consecutive weekly losses are unusual in Bitcoin's history. However, this pattern does not automatically mean another major crash is coming.
Previous losing streaks have produced different outcomes. Sometimes prices continued falling, while other times the market recovered. History offers useful lessons, but it cannot guarantee what happens next.
⚠️ WHAT SHOULD INVESTORS WATCH NOW?
Bitcoin's recent low near $73,500 is an important area to monitor. A sustained recovery above $75,000 could help improve short-term confidence. On the other hand, an
other decline below the recent low could increase selling pressure.
Bitcoin's five-week losing streak is a serious warning about market weakness, but it is not proof that recovery is impossible. Patience, research and discipline matter most when the market tests investors.
Crypto trading involves risk, and investors can lose their capital. Manage position sizes carefully, use stop losses and never risk money you cannot afford to lose
87
ГЕНДИРЕКТОР NVIDIA ПІД СЛІДСТВОМ: ЩО НАСПРАВДІ ОЗНАЧАЄ ВИБАЧЕННЯ ХУАНГА
🔍 МІФ 1: ЦЕ ЛИШЕ СКАНДАЛ ЧЕРЕЗ ОСОБИСТІ СТОСУНКИ
Факт: Суперечка виходить за межі особистого життя Хуанга.
8 листопада 2026 року Хуанг визнав у повідомленні для співробітників, що зраджував дружині. Він вибачився перед родиною, колегами, членами ради директорів, партнерами та акціонерами й узяв на себе відповідальність за свої вчинки.
Однак серйозніше занепокоєння викликають повідомлення про те, що жінку, пов’язану з його стосунками, американські розвідувальні служби підозрювали у зв’язках із китайською розвідкою.
Ці звинувачення не підтверджені як доведені факти.
⚠️ МІФ 2: NVIDIA ВЖЕ ЗІТКНУЛАСЯ З ПІДТВЕРДЖЕНОЮ КРАДІЖКОЮ ДАНИХ
Факт: Розслідування має встановити, що насправді сталося.
Рада директорів NVIDIA розпочала незалежне розслідування, яке проводять незалежні директори за підтримки зовнішніх юридичних радників.
Компанія заявила, що наразі не має підстав вважати, ніби національній безпеці або конфіденційній інформації NVIDIA було завдано шкоди.
Ця відмінність важлива. Сам факт розслідування не означає автоматично, що мало місце шпигунство чи викрадення інформації.
📊 МІФ 3: ХУАНГА ЗВІЛЬНИЛИ З ПОСАДИ ГЕНДИРЕКТОРА
Факт: Під час розслідування він залишається на чолі компанії.
NVIDIA повідомила, що Хуанг і надалі безперервно керуватиме компанією. Він також пообіцяв повністю співпрацювати зі слідством і підтвердив свою відданість захисту компанії та підтримці національної безпеки США.
Попри це, ситуація порушує важливі питання щодо відповідальності керівників, корпоративної безпеки та підзвітності лідерів.
Ця історія нагадує, що корпоративне лідерство — це не лише бізнес-результати. Довіра, прозорість, особиста відповідальність і безпека також мають значення.
Справжнім випробуванням для NVIDIA стане те, чи надасть незалежне розслідування чіткі відповіді та чи збереже довіру співробітників, клієнтів та інвесторів.
Як ви думаєте, чи зможе NVIDIA зберегти довіру інвесторів, поки триває це розслідування?
ГЕНДИРЕКТОР NVIDIA ПІД СЛІДСТВОМ: ЩО НАСПРАВДІ ОЗНАЧАЄ ВИБАЧЕННЯ ХУАНГА
🔍 МІФ 1: ЦЕ ЛИШЕ СКАНДАЛ ЧЕРЕЗ ОСОБИСТІ СТОСУНКИ
Факт: Суперечка виходить за межі особистого життя Хуанга.
8 листопада 2026 року Хуанг визнав у повідомленні для співробітників, що зраджував дружині. Він вибачився перед родиною, колегами, членами ради директорів, партнерами та акціонерами й узяв на себе відповідальність за свої вчинки.
Однак серйозніше занепокоєння викликають повідомлення про те, що жінку, пов’язану з його стосунками, американські розвідувальні служби підозрювали у зв’язках із китайською розвідкою.
Ці звинувачення не підтверджені як доведені факти.
⚠️ МІФ 2: NVIDIA ВЖЕ ЗІТКНУЛАСЯ З ПІДТВЕРДЖЕНОЮ КРАДІЖКОЮ ДАНИХ
Факт: Розслідування має встановити, що насправді сталося.
Рада директорів NVIDIA розпочала незалежне розслідування, яке проводять незалежні директори за підтримки зовнішніх юридичних радників.
Компанія заявила, що наразі не має підстав вважати, ніби національній безпеці або конфіденційній інформації NVIDIA було завдано шкоди.
Ця відмінність важлива. Сам факт розслідування не означає автоматично, що мало місце шпигунство чи викрадення інформації.
📊 МІФ 3: ХУАНГА ЗВІЛЬНИЛИ З ПОСАДИ ГЕНДИРЕКТОРА
Факт: Під час розслідування він залишається на чолі компанії.
NVIDIA повідомила, що Хуанг і надалі безперервно керуватиме компанією. Він також пообіцяв повністю співпрацювати зі слідством і підтвердив свою відданість захисту компанії та підтримці національної безпеки США.
Попри це, ситуація порушує важливі питання щодо відповідальності керівників, корпоративної безпеки та підзвітності лідерів.
Ця історія нагадує, що корпоративне лідерство — це не лише бізнес-результати. Довіра, прозорість, особиста відповідальність і безпека також мають значення.
Справжнім випробуванням для NVIDIA стане те, чи надасть незалежне розслідування чіткі відповіді та чи збереже довіру співробітників, клієнтів та інвесторів.
Як ви думаєте, чи зможе NVIDIA зберегти довіру інвесторів, поки триває це розслідування?
🔍 МІФ 1: ЦЕ ЛИШЕ СКАНДАЛ ЧЕРЕЗ ОСОБИСТІ СТОСУНКИ
Факт: Суперечка виходить за межі особистого життя Хуанга.
8 листопада 2026 року Хуанг визнав у повідомленні для співробітників, що зраджував дружині. Він вибачився перед родиною, колегами, членами ради директорів, партнерами та акціонерами й узяв на себе відповідальність за свої вчинки.
Однак серйозніше занепокоєння викликають повідомлення про те, що жінку, пов’язану з його стосунками, американські розвідувальні служби підозрювали у зв’язках із китайською розвідкою.
Ці звинувачення не підтверджені як доведені факти.
⚠️ МІФ 2: NVIDIA ВЖЕ ЗІТКНУЛАСЯ З ПІДТВЕРДЖЕНОЮ КРАДІЖКОЮ ДАНИХ
Факт: Розслідування має встановити, що насправді сталося.
Рада директорів NVIDIA розпочала незалежне розслідування, яке проводять незалежні директори за підтримки зовнішніх юридичних радників.
Компанія заявила, що наразі не має підстав вважати, ніби національній безпеці або конфіденційній інформації NVIDIA було завдано шкоди.
Ця відмінність важлива. Сам факт розслідування не означає автоматично, що мало місце шпигунство чи викрадення інформації.
📊 МІФ 3: ХУАНГА ЗВІЛЬНИЛИ З ПОСАДИ ГЕНДИРЕКТОРА
Факт: Під час розслідування він залишається на чолі компанії.
NVIDIA повідомила, що Хуанг і надалі безперервно керуватиме компанією. Він також пообіцяв повністю співпрацювати зі слідством і підтвердив свою відданість захисту компанії та підтримці національної безпеки США.
Попри це, ситуація порушує важливі питання щодо відповідальності керівників, корпоративної безпеки та підзвітності лідерів.
Ця історія нагадує, що корпоративне лідерство — це не лише бізнес-результати. Довіра, прозорість, особиста відповідальність і безпека також мають значення.
Справжнім випробуванням для NVIDIA стане те, чи надасть незалежне розслідування чіткі відповіді та чи збереже довіру співробітників, клієнтів та інвесторів.
Як ви думаєте, чи зможе NVIDIA зберегти довіру інвесторів, поки триває це розслідування?
292
Переглянути переклад
#BinanceProcesses$4.65BWithdrawals
Binance Processes $4.65 Billion in Withdrawals: A Major Test of User Confidence
Binance has processed approximately $4.65 billion in customer withdrawals within the first nine and a half hours after reopening withdrawal services on November 1. The massive movement of funds comes after a reported $6.3 billion security incident that raised serious concerns across the crypto market.
$3.64 Billion in Net Outflows
During the reporting period, Binance processed:
$4.649 billion in withdrawals.
$1.01 billion in deposits.
Approximately $3.64 billion in net outflows.
The net outflow represents around 2.1% of Binance's reported $171 billion in total assets.
Withdrawals Gradually Stabilize
Binance restored withdrawals in phases, beginning at 06:00 UTC on November 1. By 12:36 UTC, withdrawals had resumed across all 15 networks and assets included in the initial phase, covering major cryptocurrencies such as BTC, ETH, BNB, SOL, XRP, USDT and USDC.
The exchange also reported that withdrawal activity had declined after its initial surge, while deposits remained substantial.
Security and Transparency Matter
Binance says it is replacing affected assets using its own resources and has covered approximately 95% of the impacted amount. The exchange is also preparing an updated Proof of Reserves report to provide users with a fresh view of its asset backing.
What Does This Mean for Crypto?
This situation highlights an important lesson for the entire cryptocurrency industry: security, transparency and access to customer funds are essential for maintaining trust.
Billions of dollars in withdrawals do not automatically mean an exchange is collapsing. However, users will closely monitor withdrawal services, reserve reports and the exchange's recovery progress.
The coming days will be important for Binance as it works to restore confidence and demonstrate the strength of its security systems.
For every crypto exchange, trust is built through transparency, strong security and consistent protection of user assets.
#BinanceProcesses$4.65BWithdrawals
Binance Processes $4.65 Billion in Withdrawals: A Major Test of User Confidence
Binance has processed approximately $4.65 billion in customer withdrawals within the first nine and a half hours after reopening withdrawal services on November 1. The massive movement of funds comes after a reported $6.3 billion security incident that raised serious concerns across the crypto market.
$3.64 Billion in Net Outflows
During the reporting period, Binance processed:
$4.649 billion in withdrawals.
$1.01 billion in deposits.
Approximately $3.64 billion in net outflows.
The net outflow represents around 2.1% of Binance's reported $171 billion in total assets.
Withdrawals Gradually Stabilize
Binance restored withdrawals in phases, beginning at 06:00 UTC on November 1. By 12:36 UTC, withdrawals had resumed across all 15 networks and assets included in the initial phase, covering major cryptocurrencies such as BTC, ETH, BNB, SOL, XRP, USDT and USDC.
The exchange also reported that withdrawal activity had declined after its initial surge, while deposits remained substantial.
Security and Transparency Matter
Binance says it is replacing affected assets using its own resources and has covered approximately 95% of the impacted amount. The exchange is also preparing an updated Proof of Reserves report to provide users with a fresh view of its asset backing.
What Does This Mean for Crypto?
This situation highlights an important lesson for the entire cryptocurrency industry: security, transparency and access to customer funds are essential for maintaining trust.
Billions of dollars in withdrawals do not automatically mean an exchange is collapsing. However, users will closely monitor withdrawal services, reserve reports and the exchange's recovery progress.
The coming days will be important for Binance as it works to restore confidence and demonstrate the strength of its security systems.
For every crypto exchange, trust is built through transparency, strong security and consistent protection of user assets.
Binance Processes $4.65 Billion in Withdrawals: A Major Test of User Confidence
Binance has processed approximately $4.65 billion in customer withdrawals within the first nine and a half hours after reopening withdrawal services on November 1. The massive movement of funds comes after a reported $6.3 billion security incident that raised serious concerns across the crypto market.
$3.64 Billion in Net Outflows
During the reporting period, Binance processed:
$4.649 billion in withdrawals.
$1.01 billion in deposits.
Approximately $3.64 billion in net outflows.
The net outflow represents around 2.1% of Binance's reported $171 billion in total assets.
Withdrawals Gradually Stabilize
Binance restored withdrawals in phases, beginning at 06:00 UTC on November 1. By 12:36 UTC, withdrawals had resumed across all 15 networks and assets included in the initial phase, covering major cryptocurrencies such as BTC, ETH, BNB, SOL, XRP, USDT and USDC.
The exchange also reported that withdrawal activity had declined after its initial surge, while deposits remained substantial.
Security and Transparency Matter
Binance says it is replacing affected assets using its own resources and has covered approximately 95% of the impacted amount. The exchange is also preparing an updated Proof of Reserves report to provide users with a fresh view of its asset backing.
What Does This Mean for Crypto?
This situation highlights an important lesson for the entire cryptocurrency industry: security, transparency and access to customer funds are essential for maintaining trust.
Billions of dollars in withdrawals do not automatically mean an exchange is collapsing. However, users will closely monitor withdrawal services, reserve reports and the exchange's recovery progress.
The coming days will be important for Binance as it works to restore confidence and demonstrate the strength of its security systems.
For every crypto exchange, trust is built through transparency, strong security and consistent protection of user assets.
1
81
Ліквідовано позицій на $1,5 млрд: коли довіра до ринку перетворюється на пастку кредитного плеча
МІФ
Багато трейдерів вважають, що коли крипторинок різко падає, гроші втрачають лише інвестори, які купили не вчасно. Але насправді все набагато масштабніше. Раптове падіння ринку може призвести до автоматичного закриття тисяч позицій із кредитним плечем, створюючи ще більший тиск на весь ринок.
Саме це сталося 30 жовтня 2026 року, коли протягом 24 годин було ліквідовано криптовалютні позиції з кредитним плечем на суму приблизно $1,53 млрд.
ЗБИТКИ
Цифри показують, наскільки сильно ринок був налаштований на зростання цін.
Приблизно $1,29 млрд припало на довгі позиції — це близько 83,8% усіх ліквідацій. Довгі позиції — це угоди, розраховані на зростання цін на криптовалюти.
Постраждали понад 240 000 трейдерів, що показує, як швидко волатильність ринку може вплинути на учасників різних торгових платформ.
На біткоїн припало приблизно $499 млн ліквідацій, а на Ethereum — ще $358 млн. Solana, XRP і Dogecoin також зазнали значних примусових закриттів позицій.
ПЕРЕВАГА
Хоча ліквідації завдають серйозних збитків трейдерам, яких вони торкнулися, вони також можуть змінити структуру ринку.
Коли надмірне кредитне плече зникає, на ринку може поменшати високоризикових позицій. Це може послабити тиск, спричинений трейдерами, які використовують позикові кошти.
Ще однією важливою подією став рух цін в обох напрямках. Після початкового падіння ціни почали відновлюватися, створивши тиск на трейдерів, які робили ставку на подальше зниження.
Це показує, що події, пов’язані з ліквідаціями, не означають автоматично, що ринок і далі рухатиметься в одному напрямку.
НАЙБІЛЬШИЙ РИЗИК
Проблема полягає в тому, як працює кредитне плече.
Уявімо, що трейдер відкриває позицію на $10 000, вкладаючи лише $1 000 власного капіталу. Навіть відносно невеликий рух ціни проти цієї позиції може спричинити значні збитки порівняно з початковим капіталом.
Ліквідовано позицій на $1,5 млрд: коли довіра до ринку перетворюється на пастку кредитного плеча
МІФ
Багато трейдерів вважають, що коли крипторинок різко падає, гроші втрачають лише інвестори, які купили не вчасно. Але насправді все набагато масштабніше. Раптове падіння ринку може призвести до автоматичного закриття тисяч позицій із кредитним плечем, створюючи ще більший тиск на весь ринок.
Саме це сталося 30 жовтня 2026 року, коли протягом 24 годин було ліквідовано криптовалютні позиції з кредитним плечем на суму приблизно $1,53 млрд.
ЗБИТКИ
Цифри показують, наскільки сильно ринок був налаштований на зростання цін.
Приблизно $1,29 млрд припало на довгі позиції — це близько 83,8% усіх ліквідацій. Довгі позиції — це угоди, розраховані на зростання цін на криптовалюти.
Постраждали понад 240 000 трейдерів, що показує, як швидко волатильність ринку може вплинути на учасників різних торгових платформ.
На біткоїн припало приблизно $499 млн ліквідацій, а на Ethereum — ще $358 млн. Solana, XRP і Dogecoin також зазнали значних примусових закриттів позицій.
ПЕРЕВАГА
Хоча ліквідації завдають серйозних збитків трейдерам, яких вони торкнулися, вони також можуть змінити структуру ринку.
Коли надмірне кредитне плече зникає, на ринку може поменшати високоризикових позицій. Це може послабити тиск, спричинений трейдерами, які використовують позикові кошти.
Ще однією важливою подією став рух цін в обох напрямках. Після початкового падіння ціни почали відновлюватися, створивши тиск на трейдерів, які робили ставку на подальше зниження.
Це показує, що події, пов’язані з ліквідаціями, не означають автоматично, що ринок і далі рухатиметься в одному напрямку.
НАЙБІЛЬШИЙ РИЗИК
Проблема полягає в тому, як працює кредитне плече.
Уявімо, що трейдер відкриває позицію на $10 000, вкладаючи лише $1 000 власного капіталу. Навіть відносно невеликий рух ціни проти цієї позиції може спричинити значні збитки порівняно з початковим капіталом.
МІФ
Багато трейдерів вважають, що коли крипторинок різко падає, гроші втрачають лише інвестори, які купили не вчасно. Але насправді все набагато масштабніше. Раптове падіння ринку може призвести до автоматичного закриття тисяч позицій із кредитним плечем, створюючи ще більший тиск на весь ринок.
Саме це сталося 30 жовтня 2026 року, коли протягом 24 годин було ліквідовано криптовалютні позиції з кредитним плечем на суму приблизно $1,53 млрд.
ЗБИТКИ
Цифри показують, наскільки сильно ринок був налаштований на зростання цін.
Приблизно $1,29 млрд припало на довгі позиції — це близько 83,8% усіх ліквідацій. Довгі позиції — це угоди, розраховані на зростання цін на криптовалюти.
Постраждали понад 240 000 трейдерів, що показує, як швидко волатильність ринку може вплинути на учасників різних торгових платформ.
На біткоїн припало приблизно $499 млн ліквідацій, а на Ethereum — ще $358 млн. Solana, XRP і Dogecoin також зазнали значних примусових закриттів позицій.
ПЕРЕВАГА
Хоча ліквідації завдають серйозних збитків трейдерам, яких вони торкнулися, вони також можуть змінити структуру ринку.
Коли надмірне кредитне плече зникає, на ринку може поменшати високоризикових позицій. Це може послабити тиск, спричинений трейдерами, які використовують позикові кошти.
Ще однією важливою подією став рух цін в обох напрямках. Після початкового падіння ціни почали відновлюватися, створивши тиск на трейдерів, які робили ставку на подальше зниження.
Це показує, що події, пов’язані з ліквідаціями, не означають автоматично, що ринок і далі рухатиметься в одному напрямку.
НАЙБІЛЬШИЙ РИЗИК
Проблема полягає в тому, як працює кредитне плече.
Уявімо, що трейдер відкриває позицію на $10 000, вкладаючи лише $1 000 власного капіталу. Навіть відносно невеликий рух ціни проти цієї позиції може спричинити значні збитки порівняно з початковим капіталом.

1
142
Переглянути переклад
FedWatch: The Market Is Not Expecting What You Think
MYTH: FedWatch Predicts the Federal Reserve's Next Decision
Many people look at FedWatch and assume it tells them exactly what the Federal Reserve will do at its next meeting. That is not true.
FACT: FedWatch Measures Market Expectations
FedWatch is a tool that estimates the probability of future Federal Reserve interest rate decisions. It uses prices from 30-day federal funds futures contracts to calculate what interest rate traders are expecting.
In simple words, it shows whether market participants think the Fed is more likely to raise rates, cut rates, or keep them unchanged.
But there is one important difference: market expectations are not official Fed decisions.
MYTH: A High Probability Means the Decision Is Guaranteed
Imagine FedWatch shows an 80% probability of an interest rate cut. Does that mean the Fed must cut rates?
Absolutely not.
An 80% probability represents market pricing, not a promise. The remaining possibility still matters, and expectations can change quickly when new economic information becomes available.
A probability of 80% does not mean the Fed has already made its decision.
FACT: Economic Data Can Change Everything
Interest rate expectations are closely connected to the health of the US economy.
There are several important factors that market participants watch:
Inflation: If prices continue rising too quickly, the Fed may keep rates higher or consider further increases.
Employment: A strong labour market can give policymakers more room to maintain tighter monetary policy.
Economic growth: Strong growth can support higher rates, while weakening activity may increase the case for cuts.
Consumer spending: Changes in household spending can provide clues about future inflation and economic demand.
Financial conditions: Borrowing costs, credit availability and broader financial stability also influence policy decisions.
This is why FedWatch probabilities can change after important economic reports, even when the next Fed meeting is still weeks away.
FedWatch: The Market Is Not Expecting What You Think
MYTH: FedWatch Predicts the Federal Reserve's Next Decision
Many people look at FedWatch and assume it tells them exactly what the Federal Reserve will do at its next meeting. That is not true.
FACT: FedWatch Measures Market Expectations
FedWatch is a tool that estimates the probability of future Federal Reserve interest rate decisions. It uses prices from 30-day federal funds futures contracts to calculate what interest rate traders are expecting.
In simple words, it shows whether market participants think the Fed is more likely to raise rates, cut rates, or keep them unchanged.
But there is one important difference: market expectations are not official Fed decisions.
MYTH: A High Probability Means the Decision Is Guaranteed
Imagine FedWatch shows an 80% probability of an interest rate cut. Does that mean the Fed must cut rates?
Absolutely not.
An 80% probability represents market pricing, not a promise. The remaining possibility still matters, and expectations can change quickly when new economic information becomes available.
A probability of 80% does not mean the Fed has already made its decision.
FACT: Economic Data Can Change Everything
Interest rate expectations are closely connected to the health of the US economy.
There are several important factors that market participants watch:
Inflation: If prices continue rising too quickly, the Fed may keep rates higher or consider further increases.
Employment: A strong labour market can give policymakers more room to maintain tighter monetary policy.
Economic growth: Strong growth can support higher rates, while weakening activity may increase the case for cuts.
Consumer spending: Changes in household spending can provide clues about future inflation and economic demand.
Financial conditions: Borrowing costs, credit availability and broader financial stability also influence policy decisions.
This is why FedWatch probabilities can change after important economic reports, even when the next Fed meeting is still weeks away.
MYTH: FedWatch Predicts the Federal Reserve's Next Decision
Many people look at FedWatch and assume it tells them exactly what the Federal Reserve will do at its next meeting. That is not true.
FACT: FedWatch Measures Market Expectations
FedWatch is a tool that estimates the probability of future Federal Reserve interest rate decisions. It uses prices from 30-day federal funds futures contracts to calculate what interest rate traders are expecting.
In simple words, it shows whether market participants think the Fed is more likely to raise rates, cut rates, or keep them unchanged.
But there is one important difference: market expectations are not official Fed decisions.
MYTH: A High Probability Means the Decision Is Guaranteed
Imagine FedWatch shows an 80% probability of an interest rate cut. Does that mean the Fed must cut rates?
Absolutely not.
An 80% probability represents market pricing, not a promise. The remaining possibility still matters, and expectations can change quickly when new economic information becomes available.
A probability of 80% does not mean the Fed has already made its decision.
FACT: Economic Data Can Change Everything
Interest rate expectations are closely connected to the health of the US economy.
There are several important factors that market participants watch:
Inflation: If prices continue rising too quickly, the Fed may keep rates higher or consider further increases.
Employment: A strong labour market can give policymakers more room to maintain tighter monetary policy.
Economic growth: Strong growth can support higher rates, while weakening activity may increase the case for cuts.
Consumer spending: Changes in household spending can provide clues about future inflation and economic demand.
Financial conditions: Borrowing costs, credit availability and broader financial stability also influence policy decisions.
This is why FedWatch probabilities can change after important economic reports, even when the next Fed meeting is still weeks away.
69
Увійдіть, щоб переглянути інший контент
Приєднуйтесь до користувачів криптовалют по всьому світу на Binance Square
⚡️ Отримуйте актуальну та корисну інформацію про криптовалюти.
💬 Приєднуйтесь до найбільшої у світі криптобіржі.
👍 Відкрийте справжні ідеї від перевірених авторів.
Електронна пошта / номер телефону
Трендові теми
fomcвідстеження
113,805 переглядів
525 обговорюють
#fomcвідстеження Жовтневий ІСЦ США у центрі уваги: ринки оцінюють перспективи підвищення ставок у грудні
Дані щодо інфляції у США, які мають оприлюднити наступного тижня, будуть під пильною увагою інвесторів, які оцінюватимуть, чи можуть стійкі цінові чинники спонукати Федеральну резервну систему знову підвищити процентні ставки у грудні. Водночас дедалі більші побоювання щодо інвестиційного буму у сфері ШІ та його потенційного впливу на економічне зростання додають невизначеності прогнозам щодо монетарної політики.$AAPLB
SergioDiaz
·1 вподобань
·109 переглядів
CPITestsDecemberRateOutlook
740,421 переглядів
3,606 обговорюють
AnthropicRejectsIPODelayValuationinQuestion
82,115 переглядів
765 обговорюють