
Robert Anthony
775 Posts

Robert Anthony
Crypto Strategist | High-Frequency Scalper & Price Action Specialist 📈#BinanceSquare #CryptoTrading #Bitcoin #Altcoins #BullRun2026 #TechnicalAnalysis #Trading
Open Trade

NES Holder
High-Frequency Trader
4.2 Years
126 Following
2.2K+ Followers
966 Liked
Posts
Portfolio
All
Quotes
PINNED
FDV (Fully Diluted Valuation) is the total market value of a cryptocurrency if every single token that will ever exist is in circulation.
Simple Formula
\[ \text{FDV} = \text{Current Token Price} \times \text{Total Maximum Supply} \]
Example
Token price = $0.20
Total supply = 1,000,000,000 (1 billion)
FDV = $0.20 × 1,000,000,000 = $200 million
Key Points
Market Cap uses only the circulating supply (tokens already unlocked and trading).
FDV uses the total/maximum supply (including locked, vested, future emissions, etc.).
Market Cap = Price × Circulating Supply
FDV = Price × Total Supply
Why FDV matters
Shows the potential valuation if the project fully unlocks all tokens.
Helps compare projects fairly (especially early-stage ones with low circulating supply).
High FDV + low circulating supply can mean big future sell pressure when tokens unlock.
TermMax ($TMX) context
Total supply = 1,000,000,000 TMX (fixed)
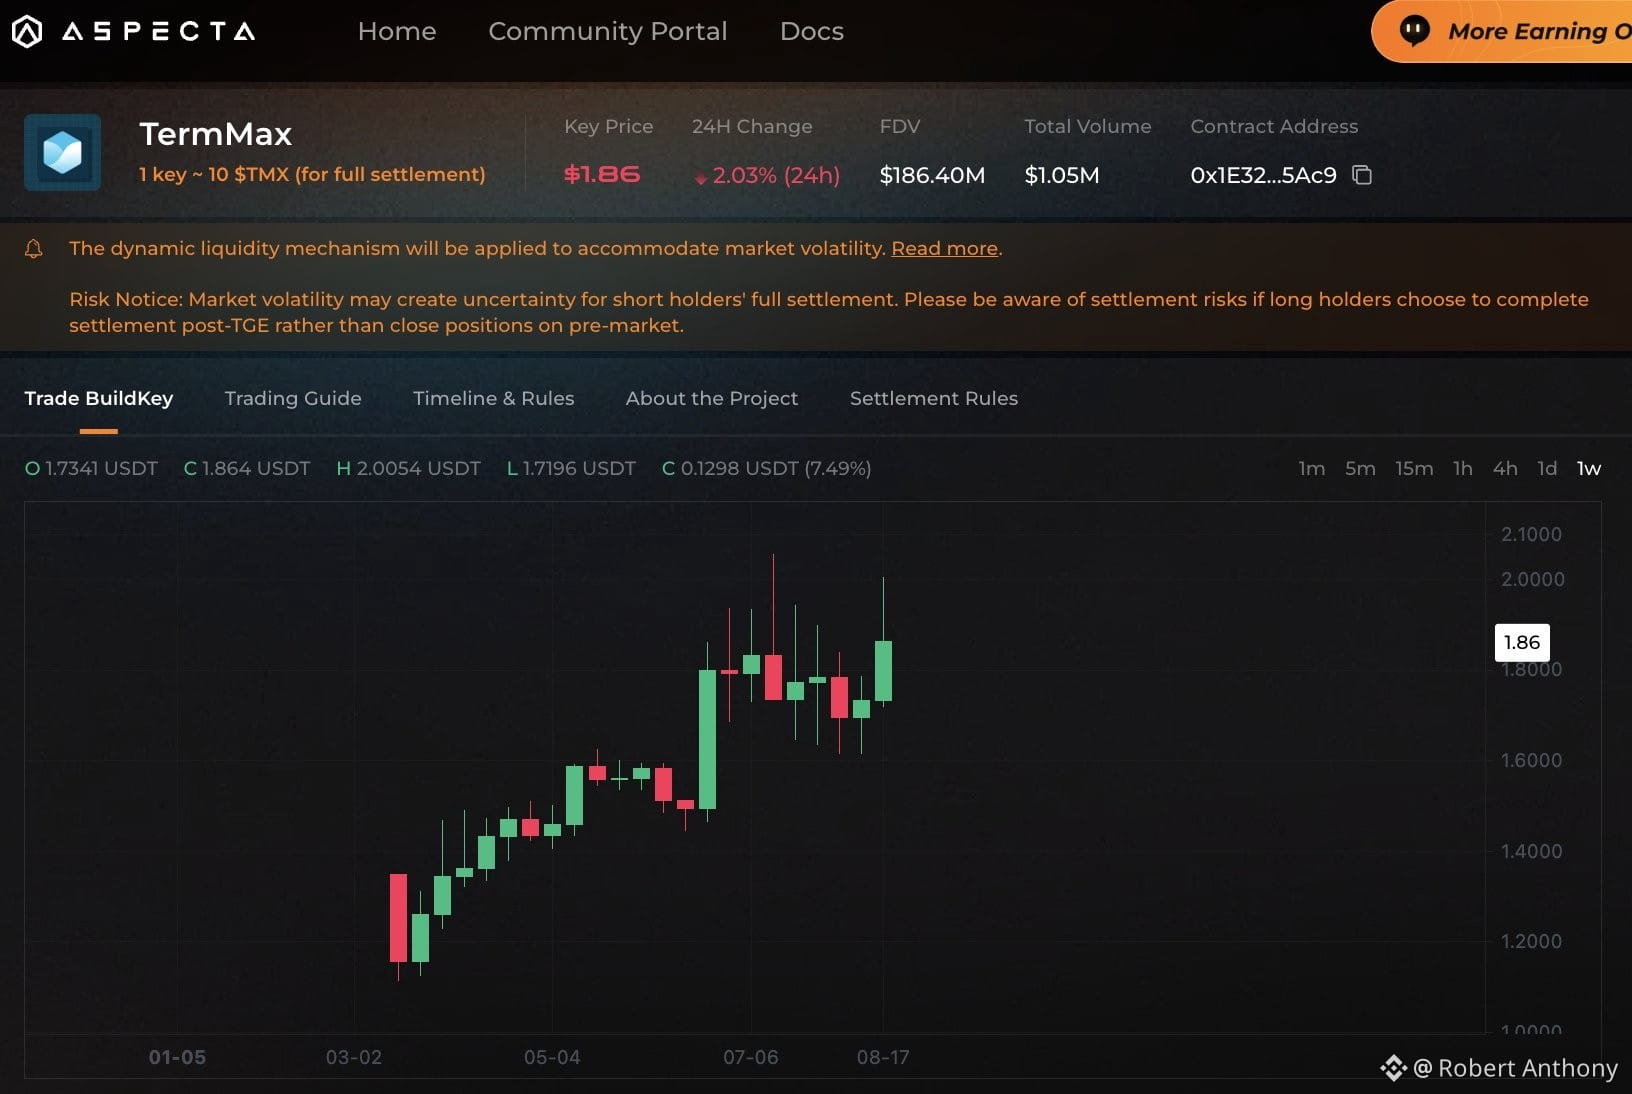
If pre-market price implies ~$0.17, then FDV ≈ $170 million
Would you like a quick comparison of Market Cap vs FDV or how unlocks affect it?
@TermMax #TermMax
#BinanceSquareTalks #BinanceSquareFamily
Simple Formula
\[ \text{FDV} = \text{Current Token Price} \times \text{Total Maximum Supply} \]
Example
Token price = $0.20
Total supply = 1,000,000,000 (1 billion)
FDV = $0.20 × 1,000,000,000 = $200 million
Key Points
Market Cap uses only the circulating supply (tokens already unlocked and trading).
FDV uses the total/maximum supply (including locked, vested, future emissions, etc.).
Market Cap = Price × Circulating Supply
FDV = Price × Total Supply
Why FDV matters
Shows the potential valuation if the project fully unlocks all tokens.
Helps compare projects fairly (especially early-stage ones with low circulating supply).
High FDV + low circulating supply can mean big future sell pressure when tokens unlock.
TermMax ($TMX) context
Total supply = 1,000,000,000 TMX (fixed)
If pre-market price implies ~$0.17, then FDV ≈ $170 million
Would you like a quick comparison of Market Cap vs FDV or how unlocks affect it?
@TermMax #TermMax
#BinanceSquareTalks #BinanceSquareFamily
PINNED
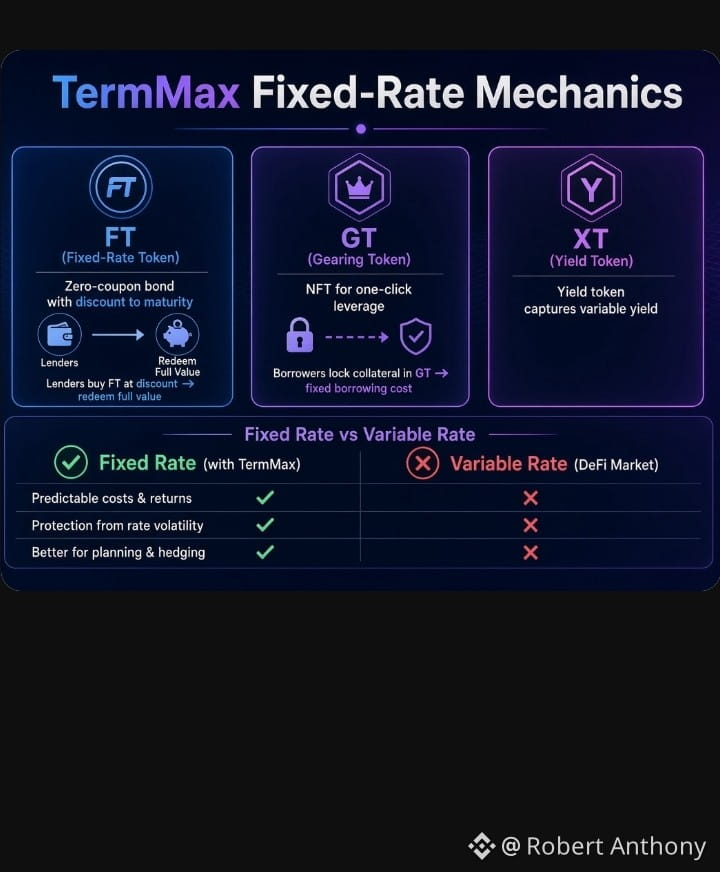
TermMax Fixed-Rate Mechanics in simple terms 👇
Unlike normal DeFi (variable rates that keep changing), TermMax locks your rate the moment you enter.
🔹 Lenders buy FT (Fixed-Rate Token) at a discount → redeem full value at maturity = fixed yield
🔹 Borrowers lock collateral in GT → get funds at a fixed cost for a fixed term
🔹 One-click leverage possible with no rate surprises
You know exactly what you earn or pay from day one. No rate shocks.
That’s why fixed-rate DeFi is heating up before $TMX TGE.
Who’s already using TermMax???
#TermMax #TMX #FixedRate #DeFi #BinanceWallet
@TermMax
Unlike normal DeFi (variable rates that keep changing), TermMax locks your rate the moment you enter.
🔹 Lenders buy FT (Fixed-Rate Token) at a discount → redeem full value at maturity = fixed yield
🔹 Borrowers lock collateral in GT → get funds at a fixed cost for a fixed term
🔹 One-click leverage possible with no rate surprises
You know exactly what you earn or pay from day one. No rate shocks.
That’s why fixed-rate DeFi is heating up before $TMX TGE.
Who’s already using TermMax???
#TermMax #TMX #FixedRate #DeFi #BinanceWallet
@TermMax
Robert Anthony
·
--
FDV (Fully Diluted Valuation) is the total market value of a cryptocurrency if every single token that will ever exist is in circulation.
Simple Formula
\[ \text{FDV} = \text{Current Token Price} \times \text{Total Maximum Supply} \]
Example
Token price = $0.20
Total supply = 1,000,000,000 (1 billion)
FDV = $0.20 × 1,000,000,000 = $200 million
Key Points
Market Cap uses only the circulating supply (tokens already unlocked and trading).
FDV uses the total/maximum supply (including locked, vested, future emissions, etc.).
Market Cap = Price × Circulating Supply
FDV = Price × Total Supply
Why FDV matters
Shows the potential valuation if the project fully unlocks all tokens.
Helps compare projects fairly (especially early-stage ones with low circulating supply).
High FDV + low circulating supply can mean big future sell pressure when tokens unlock.
TermMax ($TMX) context
Total supply = 1,000,000,000 TMX (fixed)
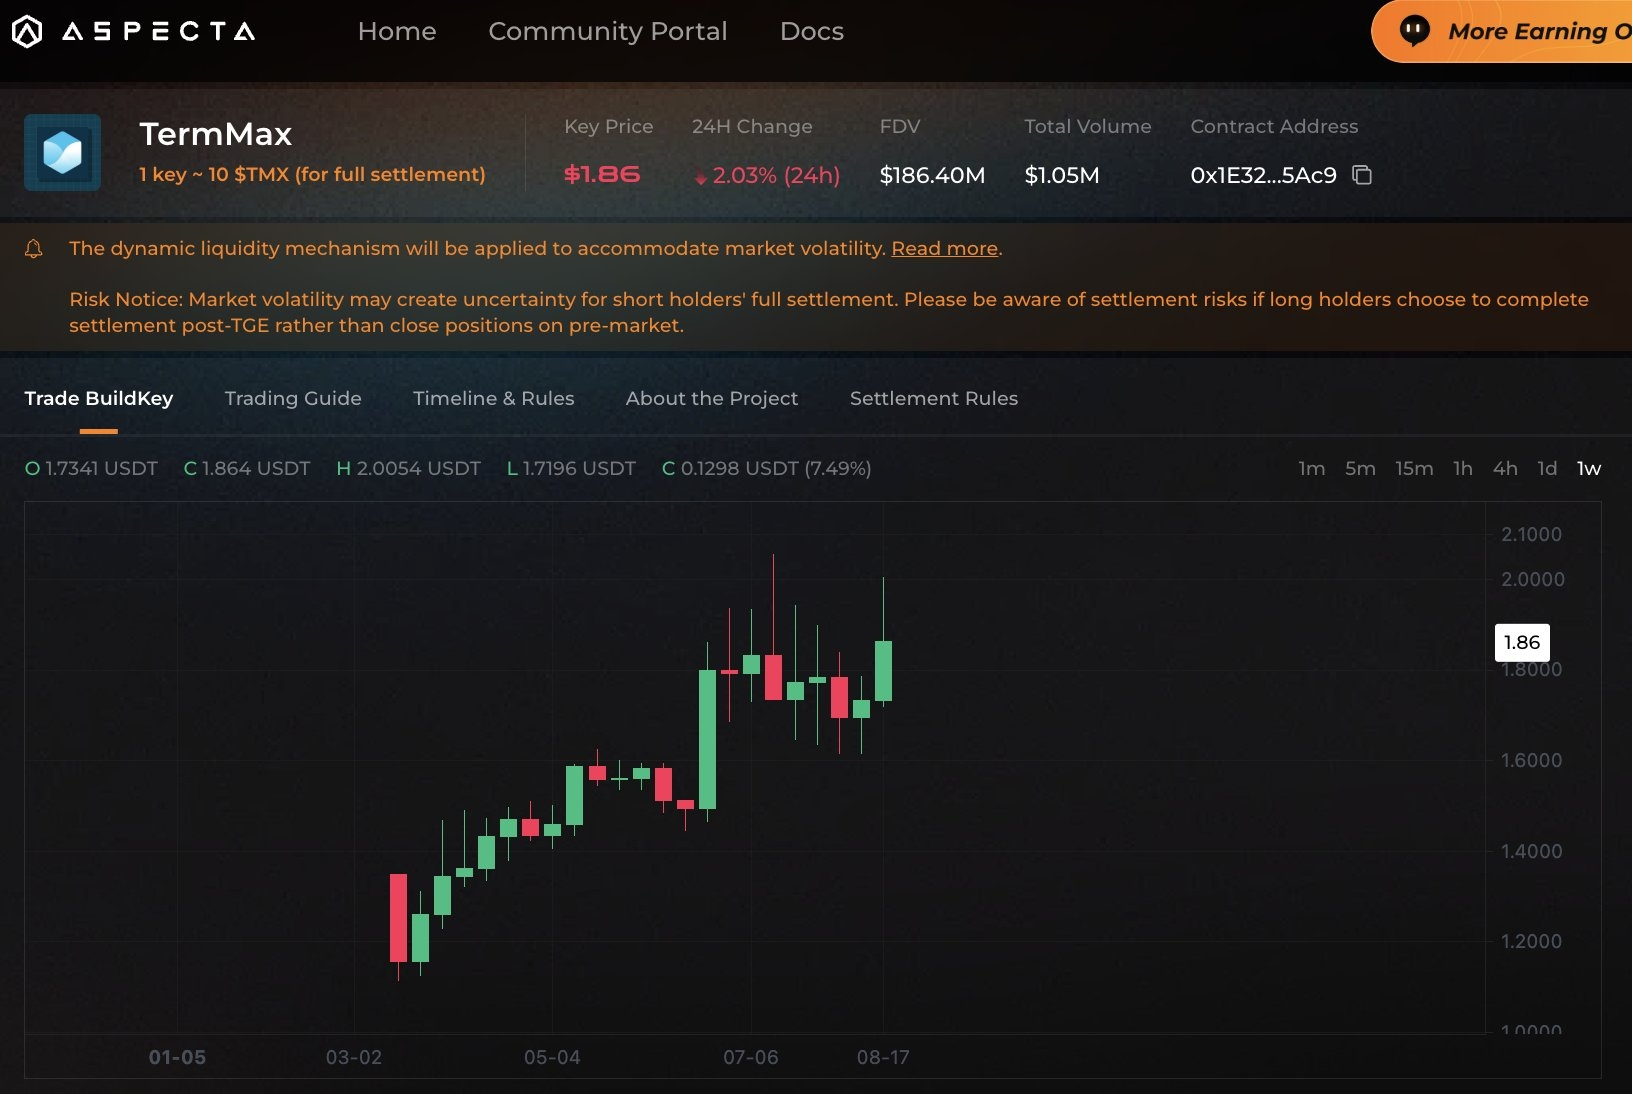
If pre-market price implies ~$0.17, then FDV ≈ $170 million
Would you like a quick comparison of Market Cap vs FDV or how unlocks affect it?
@TermMax #TermMax
#BinanceSquareTalks #BinanceSquareFamily
Simple Formula
\[ \text{FDV} = \text{Current Token Price} \times \text{Total Maximum Supply} \]
Example
Token price = $0.20
Total supply = 1,000,000,000 (1 billion)
FDV = $0.20 × 1,000,000,000 = $200 million
Key Points
Market Cap uses only the circulating supply (tokens already unlocked and trading).
FDV uses the total/maximum supply (including locked, vested, future emissions, etc.).
Market Cap = Price × Circulating Supply
FDV = Price × Total Supply
Why FDV matters
Shows the potential valuation if the project fully unlocks all tokens.
Helps compare projects fairly (especially early-stage ones with low circulating supply).
High FDV + low circulating supply can mean big future sell pressure when tokens unlock.
TermMax ($TMX) context
Total supply = 1,000,000,000 TMX (fixed)
If pre-market price implies ~$0.17, then FDV ≈ $170 million
Would you like a quick comparison of Market Cap vs FDV or how unlocks affect it?
@TermMax #TermMax
#BinanceSquareTalks #BinanceSquareFamily
Robert Anthony
·
--
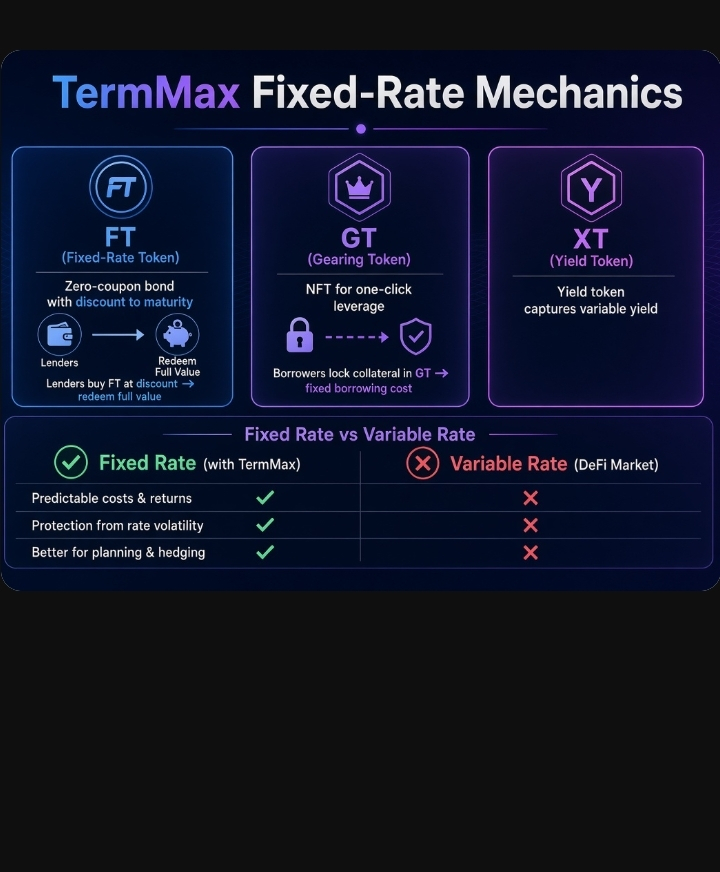
TermMax Fixed-Rate Mechanics in simple terms 👇
Unlike normal DeFi (variable rates that keep changing), TermMax locks your rate the moment you enter.
🔹 Lenders buy FT (Fixed-Rate Token) at a discount → redeem full value at maturity = fixed yield
🔹 Borrowers lock collateral in GT → get funds at a fixed cost for a fixed term
🔹 One-click leverage possible with no rate surprises
You know exactly what you earn or pay from day one. No rate shocks.
That’s why fixed-rate DeFi is heating up before $TMX TGE.
Who’s already using TermMax???
#TermMax #TMX #FixedRate #DeFi #BinanceWallet
@TermMax
Unlike normal DeFi (variable rates that keep changing), TermMax locks your rate the moment you enter.
🔹 Lenders buy FT (Fixed-Rate Token) at a discount → redeem full value at maturity = fixed yield
🔹 Borrowers lock collateral in GT → get funds at a fixed cost for a fixed term
🔹 One-click leverage possible with no rate surprises
You know exactly what you earn or pay from day one. No rate shocks.
That’s why fixed-rate DeFi is heating up before $TMX TGE.
Who’s already using TermMax???
#TermMax #TMX #FixedRate #DeFi #BinanceWallet
@TermMax
#TermMax和牛来相较如何
Lucky Draw🎁🎁🎁
💰 Pool: 1,700,000 $TMX
👥 Up To 80,000 Winners
🏆 ≈ 21.25 $TMX Per Winner
Just Open The Binance Wallet & Check Booster Campaigns
#BinanceSquareTalks #BNB走势 #BTC突破7万大关 #ETH🔥🔥🔥🔥🔥🔥
@TermMax
Lucky Draw🎁🎁🎁
💰 Pool: 1,700,000 $TMX
👥 Up To 80,000 Winners
🏆 ≈ 21.25 $TMX Per Winner
Just Open The Binance Wallet & Check Booster Campaigns
#BinanceSquareTalks #BNB走势 #BTC突破7万大关 #ETH🔥🔥🔥🔥🔥🔥
@TermMax
#TermMax booster campaign alert 🔎🔎
Here’s a short 118-word post:
$TMX TGE is locked for August 25 — just days away.
Total supply: fixed at 1 billion.
Initial circulating supply expected around 20% (200M tokens).
Pre-market on Aspecta currently implies an FDV of roughly $170M–$185M. No official market cap yet since the token is still pre-TGE.
TermMax already sits at $90M+ TVL across 10 chains with strong user metrics. Once live, circulating market cap will depend on the opening price and exact unlock schedule.
Fixed-rate DeFi narrative + solid fundamentals heading into launch. Watching closely.
DYOR — pre-market FDV can shift fast.
#TermMax #FDV #DeFi #BinanceWallet @TermMax
Here’s a short 118-word post:
$TMX TGE is locked for August 25 — just days away.
Total supply: fixed at 1 billion.
Initial circulating supply expected around 20% (200M tokens).
Pre-market on Aspecta currently implies an FDV of roughly $170M–$185M. No official market cap yet since the token is still pre-TGE.
TermMax already sits at $90M+ TVL across 10 chains with strong user metrics. Once live, circulating market cap will depend on the opening price and exact unlock schedule.
Fixed-rate DeFi narrative + solid fundamentals heading into launch. Watching closely.
DYOR — pre-market FDV can shift fast.
#TermMax #FDV #DeFi #BinanceWallet @TermMax
30D trade $NVDAB55.7 USDT
TermMax is bringing real fixed-rate DeFi to the masses — one-click leveraging, predictable borrowing costs, and stable yields.
No more rate surprises.
Total rewards: 2,000,000 $TMX
• Lucky draw: 1.7M TMX for ~80k winners
• Extra pool for Binance Square creator
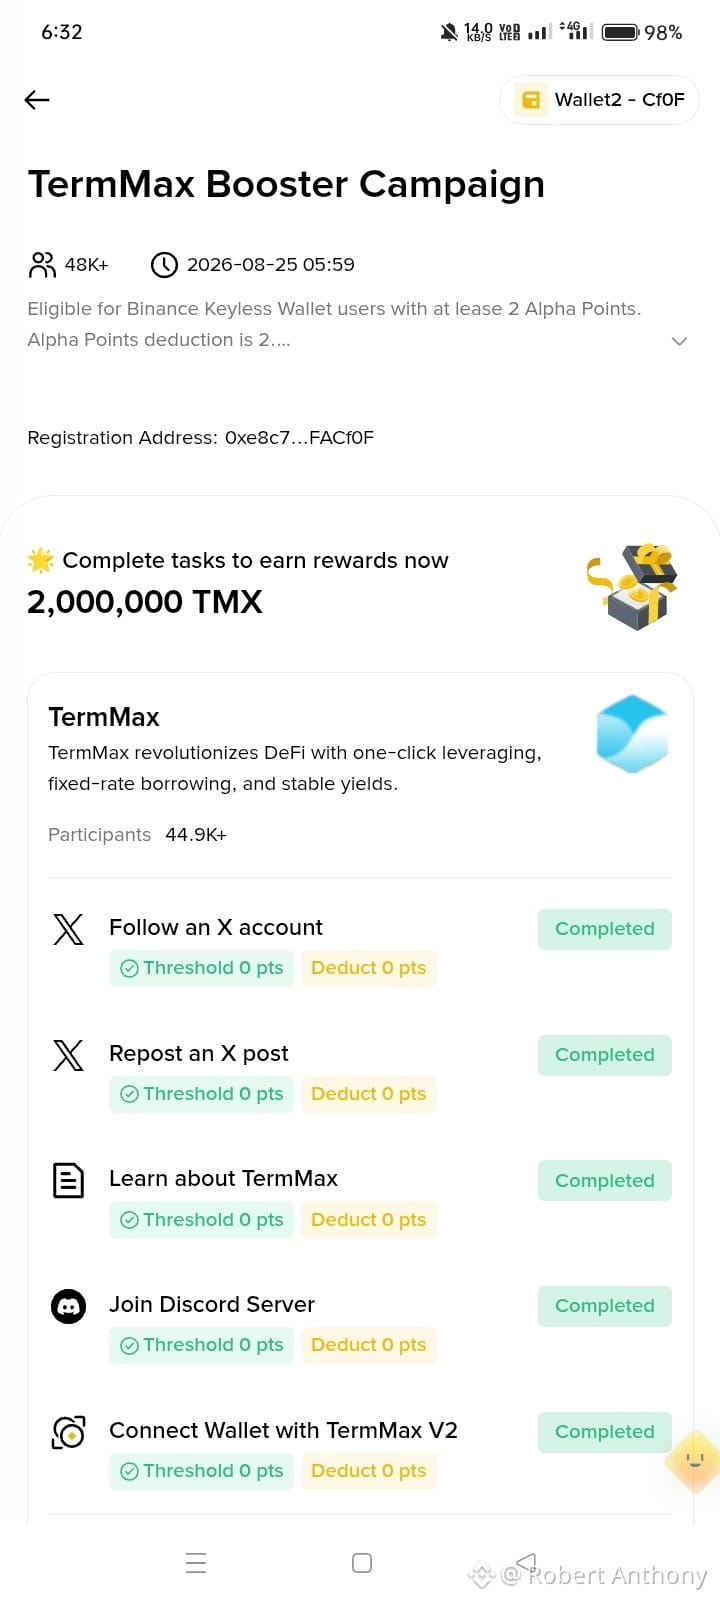
Requirements are simple: Binance Keyless Wallet + 2 Alpha Points (deducted on entry). I finished:
 Follow
@TermMaxFi
 Repost the campaign post
 Learn about TermMax
 Join Discord
 Connect wallet on TermMax V2 All green. Now waiting for the draw and $TMX TGE around Aug 25. If you still have Alpha Points and a Keyless Wallet, jump in before it ends (Aug 24 UTC). Tokens come with project lock-up, so understand the risks. Fixed rates + Binance exposure = interesting combo heading into TGE. Who else is in? #TermMax和牛来相较如何 #BinanceWallet #DeFi
@TermMax #DollarFallsTo10WeekLow #EthereumFoundationLaunchesGlamsterdamTestnet
No more rate surprises.
Total rewards: 2,000,000 $TMX
• Lucky draw: 1.7M TMX for ~80k winners
• Extra pool for Binance Square creator
Requirements are simple: Binance Keyless Wallet + 2 Alpha Points (deducted on entry). I finished:
 Follow
@TermMaxFi
 Repost the campaign post
 Learn about TermMax
 Join Discord
 Connect wallet on TermMax V2 All green. Now waiting for the draw and $TMX TGE around Aug 25. If you still have Alpha Points and a Keyless Wallet, jump in before it ends (Aug 24 UTC). Tokens come with project lock-up, so understand the risks. Fixed rates + Binance exposure = interesting combo heading into TGE. Who else is in? #TermMax和牛来相较如何 #BinanceWallet #DeFi
@TermMax #DollarFallsTo10WeekLow #EthereumFoundationLaunchesGlamsterdamTestnet
Focus on Token Metrics & Low Cap Potential (High Trader Interest)
Low Cap Hidden Gem: Decoding TermMax (TMX) Valuation & Growth Potential
Token Supply: Capped at a strict 20,000,000 max supply.
Market Capitalization: Lean circulating market cap sitting near $598K.
Fully Diluted Valuation (FDV): Valued around $23.1M.
#TMX token when listing then price up or dow?
#TermMax everyone vote now.#VOTEme end after 7 days??
@TermMax $NVDAB $BTC
#USMemoryStocksExtendGainsSanDiskUp10.5% #DOJProbesA16zOverRivalAIBoardSeats
Low Cap Hidden Gem: Decoding TermMax (TMX) Valuation & Growth Potential
Token Supply: Capped at a strict 20,000,000 max supply.
Market Capitalization: Lean circulating market cap sitting near $598K.
Fully Diluted Valuation (FDV): Valued around $23.1M.
#TMX token when listing then price up or dow?
#TermMax everyone vote now.#VOTEme end after 7 days??
@TermMax $NVDAB $BTC
#USMemoryStocksExtendGainsSanDiskUp10.5% #DOJProbesA16zOverRivalAIBoardSeats
up
down
1 hr(s) left
Title: TermMax Booster is Live – Who’s Farming $TMX?
2,000,000 $TMX is up for grabs right now on Binance Wallet!
Lucky Draw: 1.7M $TMX for 80,000 winners
Binance Square: Top 1,000 share 300,000 $TMX (≈300 each)
TermMax gives fixed rates — no more surprise interest changes. Lend or borrow with clear yield and clear cost.
Just need Binance Keyless Wallet + 2 Alpha Points. Completely free.
Posting window ends 21 August. Daily posts = better rank!
Are you already in?
Completed the 5 tasks?
Posting every day?
Drop a 🔥 below if you’re grinding this with me!
#TermMax #TMX #BinanceSquare
#FreeCrypto #DeFi
@TermMax
2,000,000 $TMX is up for grabs right now on Binance Wallet!
Lucky Draw: 1.7M $TMX for 80,000 winners
Binance Square: Top 1,000 share 300,000 $TMX (≈300 each)
TermMax gives fixed rates — no more surprise interest changes. Lend or borrow with clear yield and clear cost.
Just need Binance Keyless Wallet + 2 Alpha Points. Completely free.
Posting window ends 21 August. Daily posts = better rank!
Are you already in?
Completed the 5 tasks?
Posting every day?
Drop a 🔥 below if you’re grinding this with me!
#TermMax #TMX #BinanceSquare
#FreeCrypto #DeFi
@TermMax
TermMax Booster is live on Binance Wallet!
Share 2,000,000 $TMX — complete the tasks or post on Binance Square.
Top 1,000 posters split 300,000 $TMX.
Fixed-rate lending & borrowing is the future. Let’s go! #TermMax #TMX #BinanceSquare
@TermMax
Share 2,000,000 $TMX — complete the tasks or post on Binance Square.
Top 1,000 posters split 300,000 $TMX.
Fixed-rate lending & borrowing is the future. Let’s go! #TermMax #TMX #BinanceSquare
@TermMax
Robert Anthony
·
--
TermMax ($TMX) – TGE Overview (Aug 25, 2026)
Total Supply: 1,000,000,000 TMX (fixed, no inflation). Initial Circulating at TGE: ~20% = 200 million TMX (mainly Community + Liquidity). Rest unlocks over 12–48 months
Current Pre-Market (Aspecta)
Implied FDV ≈ $185–190M →
price ≈ $0.185–0.19.
At TGE this suggests an opening Market Cap of roughly $37–38M.Possible Price View
Realistic open: $0.12–0.18
Base case: $0.18–0.25
Optimistic short-term: $0.30+
Are you predicted price must commented now???
@TermMax #TermMax #TMXBooster
#BTC
Total Supply: 1,000,000,000 TMX (fixed, no inflation). Initial Circulating at TGE: ~20% = 200 million TMX (mainly Community + Liquidity). Rest unlocks over 12–48 months
Current Pre-Market (Aspecta)
Implied FDV ≈ $185–190M →
price ≈ $0.185–0.19.
At TGE this suggests an opening Market Cap of roughly $37–38M.Possible Price View
Realistic open: $0.12–0.18
Base case: $0.18–0.25
Optimistic short-term: $0.30+
Are you predicted price must commented now???
@TermMax #TermMax #TMXBooster
#BTC
TermMax ($TMX) – TGE Overview (Aug 25, 2026)
Total Supply: 1,000,000,000 TMX (fixed, no inflation). Initial Circulating at TGE: ~20% = 200 million TMX (mainly Community + Liquidity). Rest unlocks over 12–48 months
Current Pre-Market (Aspecta)
Implied FDV ≈ $185–190M →
price ≈ $0.185–0.19.
At TGE this suggests an opening Market Cap of roughly $37–38M.Possible Price View
Realistic open: $0.12–0.18
Base case: $0.18–0.25
Optimistic short-term: $0.30+
Are you predicted price must commented now???
@TermMax #TermMax #TMXBooster
#BTC
Total Supply: 1,000,000,000 TMX (fixed, no inflation). Initial Circulating at TGE: ~20% = 200 million TMX (mainly Community + Liquidity). Rest unlocks over 12–48 months
Current Pre-Market (Aspecta)
Implied FDV ≈ $185–190M →
price ≈ $0.185–0.19.
At TGE this suggests an opening Market Cap of roughly $37–38M.Possible Price View
Realistic open: $0.12–0.18
Base case: $0.18–0.25
Optimistic short-term: $0.30+
Are you predicted price must commented now???
@TermMax #TermMax #TMXBooster
#BTC
TermMax Booster is live on Binance Wallet!
Share 2,000,000 $TMX — complete the tasks or post on Binance Square.
Top 1,000 posters split 300,000 $TMX.
Fixed-rate lending & borrowing is the future. Let’s go! #TermMax #BinanceSquare @TermMax
Share 2,000,000 $TMX — complete the tasks or post on Binance Square.
Top 1,000 posters split 300,000 $TMX.
Fixed-rate lending & borrowing is the future. Let’s go! #TermMax #BinanceSquare @TermMax
Robert Anthony
·
--
#termmax @TermMax
@TermMax is transforming the decentralized finance landscape by introducing innovative fixed-rate borrowing and lending solutions. By offering predictable yields and secure financial instruments, it provides users with enhanced capital efficiency and stability in the crypto market. Discover how #TermMax is building a smarter, more reliable Web3 ecosystem today!
@TermMax is transforming the decentralized finance landscape by introducing innovative fixed-rate borrowing and lending solutions. By offering predictable yields and secure financial instruments, it provides users with enhanced capital efficiency and stability in the crypto market. Discover how #TermMax is building a smarter, more reliable Web3 ecosystem today!
#termmax @TermMax
@TermMax is transforming the decentralized finance landscape by introducing innovative fixed-rate borrowing and lending solutions. By offering predictable yields and secure financial instruments, it provides users with enhanced capital efficiency and stability in the crypto market. Discover how #TermMax is building a smarter, more reliable Web3 ecosystem today!
@TermMax is transforming the decentralized finance landscape by introducing innovative fixed-rate borrowing and lending solutions. By offering predictable yields and secure financial instruments, it provides users with enhanced capital efficiency and stability in the crypto market. Discover how #TermMax is building a smarter, more reliable Web3 ecosystem today!
#BinanceTurns9 Binance Turns 9 - Built By You
Happy 9th anniversary, Binance. Proud to be part of the community as we celebrate nearly a decade of industry-defining growth and innovation. Looking forward to what comes next.
Happy 9th anniversary, Binance. Proud to be part of the community as we celebrate nearly a decade of industry-defining growth and innovation. Looking forward to what comes next.

#BinanceTurns9 Binance Turns 9 - Built By You
Happy 9th anniversary, Binance. Proud to be part of the community as we celebrate nearly a decade of industry-defining growth and innovation. Looking forward to what comes next.
#BinanceTurns9
Happy 9th anniversary, Binance. Proud to be part of the community as we celebrate nearly a decade of industry-defining growth and innovation. Looking forward to what comes next.
#BinanceTurns9
#BinancePickAndWin
"The 2026 Football Challenge on Binance is live now! It is time to test our football knowledge and technical analysis skills. I am choosing my favorite teams for the matches. Don't miss this chance to participate and win rewards!
"The 2026 Football Challenge on Binance is live now! It is time to test our football knowledge and technical analysis skills. I am choosing my favorite teams for the matches. Don't miss this chance to participate and win rewards!

Log in to explore more content