
#strategyreports$35bnetreserves
strategyreports$35bnetreserves
Hot
Latest


Article
Strategy Reports $35 Billion in Net Reserves as All Bitcoin Holdings Remain Unpledged#StrategyReports$35BNetReservesBNetReservesStrategy Reports $35 Billion in Net Reserves as All Bitcoin Holdings Remain Unpledged
Strategy has reported a major improvement in its financial position, stating that its net reserves have reached approximately $35 billion and that none of its Bitcoin holdings are currently pledged as collateral.
The development marks a significant contrast with the 2022 crypto bear market, when the company reported negative net reserves and had approximately one-third of its Bitcoin holdings committed as collateral.
For market participants, the latest update highlights an important aspect of Strategy's Bitcoin treasury model: financial flexibility during periods of market volatility. Holding Bitcoin without collateral obligations can reduce exposure to lender-related liquidation pressure and provide greater flexibility in managing its balance sheet.
However, the $35 billion reserve figure should not be confused with immediately available cash. Its value remains closely connected to Bitcoin's market price and the company's outstanding financial obligations.
Market Perspective: Strategy's financial resilience is an important factor for institutional Bitcoin investors to monitor. The key question now is whether the company can maintain this position through another extended period of market weakness.
Bitcoin's price movements and Strategy's future treasury decisions will remain important indicators for assessing institutional confidence.$SKDD
{future}(SKDDUSDT)
$BTC
{future}(BTCUSDT)
$MSTR
{future}(MSTRUSDT)
Strategy Reports $35 Billion in Net Reserves as All Bitcoin Holdings Remain Unpledged
#StrategyReports$35BNetReservesBNetReservesStrategy Reports $35 Billion in Net Reserves as All Bitcoin Holdings Remain Unpledged
Strategy has reported a major improvement in its financial position, stating that its net reserves have reached approximately $35 billion and that none of its Bitcoin holdings are currently pledged as collateral.
The development marks a significant contrast with the 2022 crypto bear market, when the company reported negative net reserves and had approximately one-third of its Bitcoin holdings committed as collateral.
For market participants, the latest update highlights an important aspect of Strategy's Bitcoin treasury model: financial flexibility during periods of market volatility. Holding Bitcoin without collateral obligations can reduce exposure to lender-related liquidation pressure and provide greater flexibility in managing its balance sheet.
However, the $35 billion reserve figure should not be confused with immediately available cash. Its value remains closely connected to Bitcoin's market price and the company's outstanding financial obligations.
Market Perspective: Strategy's financial resilience is an important factor for institutional Bitcoin investors to monitor. The key question now is whether the company can maintain this position through another extended period of market weakness.
Bitcoin's price movements and Strategy's future treasury decisions will remain important indicators for assessing institutional confidence.$SKDD
$BTC
$MSTR
Strategy has reported a major improvement in its financial position, stating that its net reserves have reached approximately $35 billion and that none of its Bitcoin holdings are currently pledged as collateral.
The development marks a significant contrast with the 2022 crypto bear market, when the company reported negative net reserves and had approximately one-third of its Bitcoin holdings committed as collateral.
For market participants, the latest update highlights an important aspect of Strategy's Bitcoin treasury model: financial flexibility during periods of market volatility. Holding Bitcoin without collateral obligations can reduce exposure to lender-related liquidation pressure and provide greater flexibility in managing its balance sheet.
However, the $35 billion reserve figure should not be confused with immediately available cash. Its value remains closely connected to Bitcoin's market price and the company's outstanding financial obligations.
Market Perspective: Strategy's financial resilience is an important factor for institutional Bitcoin investors to monitor. The key question now is whether the company can maintain this position through another extended period of market weakness.
Bitcoin's price movements and Strategy's future treasury decisions will remain important indicators for assessing institutional confidence.$SKDD
$BTC
$MSTR
1
97

Verified
Article
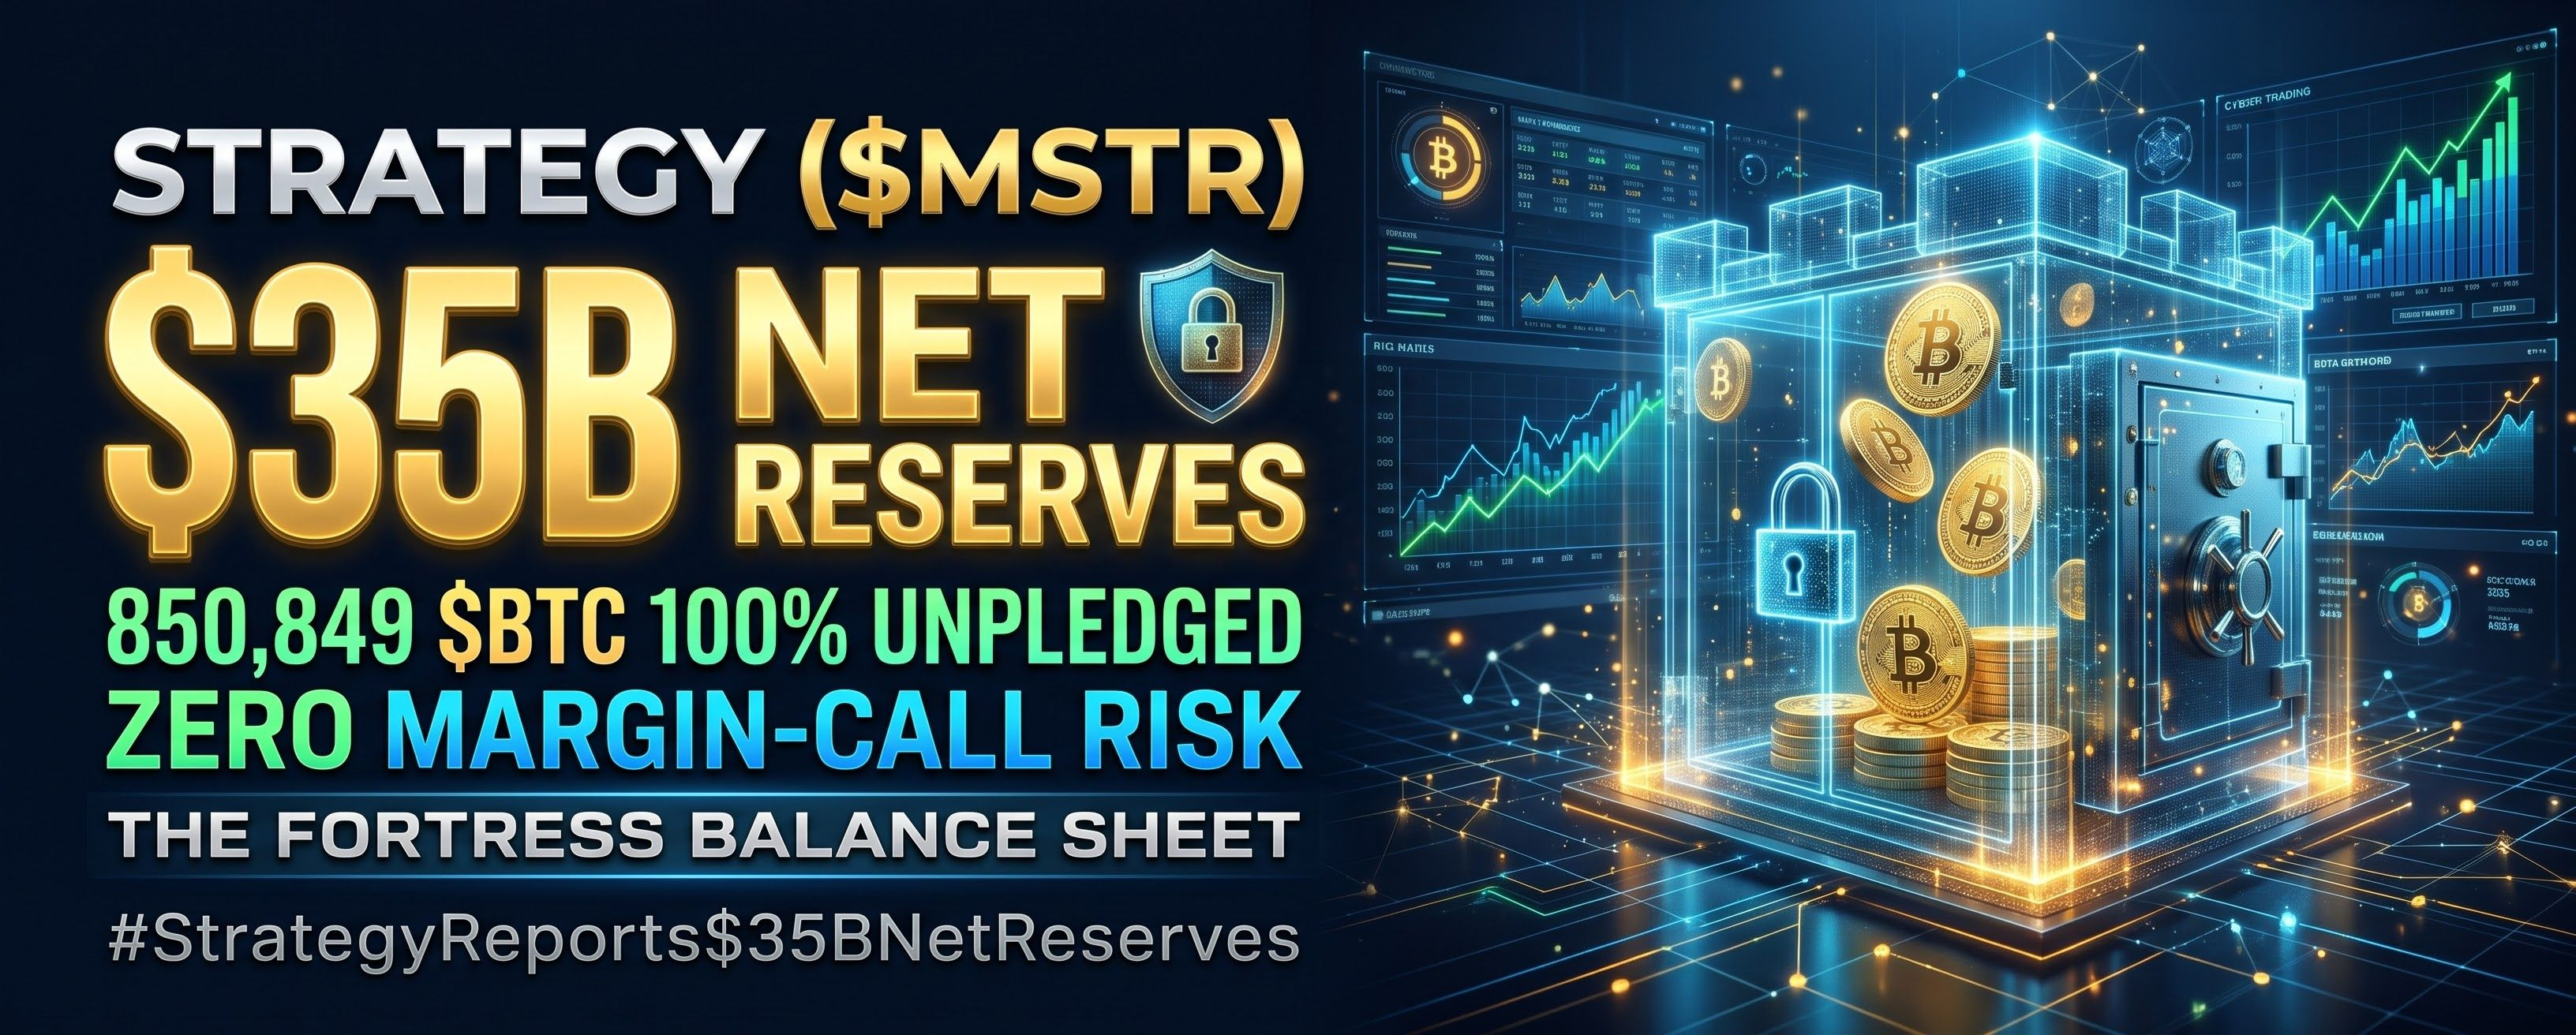
From Collateral Risk to Fortress Balance Sheet: Inside Strategy’s $35B Net Reserve ShiftStrategy (MSTR) just hit a major milestone—reporting $35B in Net Reserves ($35.93B on its live dashboard) with 100% of its 850,849 BTC completely unpledged.
What matters for traders:
🔹 Zero Margin-Call Risk: In 2022, Strategy’s net reserve was negative with one-third of its BTC pledged as collateral. Now, all 850,849 BTC (~4.05% of supply, worth $55.35B) sit free and clear.
🔹 Dedicated Cash Buffer: Net of $6.71B in debt and $12.71B in preferred stock, a $4.75B USD reserve plus $151M cash covers dividends and interest without touching its Bitcoin.
🔹 Valuation Discount: Despite an unrealized loss below its $75,452 average cost, MSTR’s ~$34.85B market cap trades slightly under its net BTC reserve.
Removing collateralized debt eliminates forced-selling risk during volatile pullbacks. 📉
How are you positioning on BTC andMSTR here—buying the discount or waiting for momentum? 👇
$BTC $MSTR $MMT
{future}(MMTUSDT)
{future}(BTCUSDT)
{future}(MSTRUSDT)
#strategyreports$35bnetreserves #Bitcoin #strategy #CryptoNews
From Collateral Risk to Fortress Balance Sheet: Inside Strategy’s $35B Net Reserve Shift
Strategy (MSTR) just hit a major milestone—reporting $35B in Net Reserves ($35.93B on its live dashboard) with 100% of its 850,849 BTC completely unpledged.
What matters for traders:
🔹 Zero Margin-Call Risk: In 2022, Strategy’s net reserve was negative with one-third of its BTC pledged as collateral. Now, all 850,849 BTC (~4.05% of supply, worth $55.35B) sit free and clear.
🔹 Dedicated Cash Buffer: Net of $6.71B in debt and $12.71B in preferred stock, a $4.75B USD reserve plus $151M cash covers dividends and interest without touching its Bitcoin.
🔹 Valuation Discount: Despite an unrealized loss below its $75,452 average cost, MSTR’s ~$34.85B market cap trades slightly under its net BTC reserve.
Removing collateralized debt eliminates forced-selling risk during volatile pullbacks. 📉
How are you positioning on BTC andMSTR here—buying the discount or waiting for momentum? 👇
$BTC $MSTR $MMT
#strategyreports$35bnetreserves #Bitcoin #strategy #CryptoNews
What matters for traders:
🔹 Zero Margin-Call Risk: In 2022, Strategy’s net reserve was negative with one-third of its BTC pledged as collateral. Now, all 850,849 BTC (~4.05% of supply, worth $55.35B) sit free and clear.
🔹 Dedicated Cash Buffer: Net of $6.71B in debt and $12.71B in preferred stock, a $4.75B USD reserve plus $151M cash covers dividends and interest without touching its Bitcoin.
🔹 Valuation Discount: Despite an unrealized loss below its $75,452 average cost, MSTR’s ~$34.85B market cap trades slightly under its net BTC reserve.
Removing collateralized debt eliminates forced-selling risk during volatile pullbacks. 📉
How are you positioning on BTC andMSTR here—buying the discount or waiting for momentum? 👇
$BTC $MSTR $MMT
#strategyreports$35bnetreserves #Bitcoin #strategy #CryptoNews
SHERAZ FAHEEM 01:
Strategy’s reported $35 billion net result is a major headline for the Bitcoin market. The details behind this figure are just as important as the headline itself.
2
2
1.6k

·
--
Bearish
#StrategyReports$35BNetReserves
Strategy Reports $3.5B Net Reserves!
Strategy is drawing attention across the crypto market with its reported $3.5 billion in net reserves. The development comes as Bitcoin faces significant price pressure, putting the company's financial position and long-term BTC strategy under the spotlight.
💰 What Happened?
Strategy reports approximately $3.5 billion in net reserves.
The company's massive Bitcoin exposure remains a major focus for investors.
Market volatility is increasing attention on its financial strength.
Investors are watching whether Strategy can maintain its aggressive Bitcoin strategy.
🔍 Why It Matters
Strategy is one of the largest corporate Bitcoin holders. Strong reserves could provide additional financial flexibility during market downturns.
However, continued $BTC weakness could still affect investor sentiment and the company's overall market valuation.
🚀 What's Next?
Investors will monitor Strategy's reserve position, financing decisions, and future Bitcoin purchases.
Will Strategy's reserves strengthen confidence in Bitcoin, or will market pressure continue?
#strategy #bitcoin #BTC
#StrategyReports$35BNetReserves
Strategy Reports $3.5B Net Reserves!
Strategy is drawing attention across the crypto market with its reported $3.5 billion in net reserves. The development comes as Bitcoin faces significant price pressure, putting the company's financial position and long-term BTC strategy under the spotlight.
💰 What Happened?
Strategy reports approximately $3.5 billion in net reserves.
The company's massive Bitcoin exposure remains a major focus for investors.
Market volatility is increasing attention on its financial strength.
Investors are watching whether Strategy can maintain its aggressive Bitcoin strategy.
🔍 Why It Matters
Strategy is one of the largest corporate Bitcoin holders. Strong reserves could provide additional financial flexibility during market downturns.
However, continued $BTC weakness could still affect investor sentiment and the company's overall market valuation.
🚀 What's Next?
Investors will monitor Strategy's reserve position, financing decisions, and future Bitcoin purchases.
Will Strategy's reserves strengthen confidence in Bitcoin, or will market pressure continue?
#strategy #bitcoin #BTC
Strategy Reports $3.5B Net Reserves!
Strategy is drawing attention across the crypto market with its reported $3.5 billion in net reserves. The development comes as Bitcoin faces significant price pressure, putting the company's financial position and long-term BTC strategy under the spotlight.
💰 What Happened?
Strategy reports approximately $3.5 billion in net reserves.
The company's massive Bitcoin exposure remains a major focus for investors.
Market volatility is increasing attention on its financial strength.
Investors are watching whether Strategy can maintain its aggressive Bitcoin strategy.
🔍 Why It Matters
Strategy is one of the largest corporate Bitcoin holders. Strong reserves could provide additional financial flexibility during market downturns.
However, continued $BTC weakness could still affect investor sentiment and the company's overall market valuation.
🚀 What's Next?
Investors will monitor Strategy's reserve position, financing decisions, and future Bitcoin purchases.
Will Strategy's reserves strengthen confidence in Bitcoin, or will market pressure continue?
#strategy #bitcoin #BTC
SHERAZ FAHEEM 01:
This development highlights how closely Strategy’s financial results are connected to Bitcoin market conditions. Investors will be watching the bigger picture.
1
1
284

·
--
🚨 $35 BILLION IN NET RESERVES — SO WHY SHOULD $MSTR INVESTORS STILL BE NERVOUS?! 💀📉
BIG RESERVES DON'T MEAN ZERO RISK.
Michael Saylor's Strategy reports approximately $35B in net reserves.
Sounds incredibly bullish, right?
NOW LOOK AT THE OTHER SIDE. 👇
💰 Strategy holds a massive Bitcoin position.
📉 Its BTC holdings are reportedly worth less than their total acquisition cost.
🏦 Debt and preferred-stock obligations still exist.
⚠️ And its net reserves can shrink rapidly if Bitcoin keeps falling.
HERE'S THE PART MOST PEOPLE MISS:
Unpledged Bitcoin reduces collateral-related liquidation pressure.
But it doesn't eliminate refinancing risk, preferred dividends or dilution.
🔥 A STRONGER BALANCE SHEET IS NOT THE SAME AS A RISK-FREE INVESTMENT.
If $BTC enters another prolonged bear market, Strategy's financial flexibility could face a serious test.
👀 IS $MSTR A GENIUS BITCOIN STRATEGY — OR THE MOST AGGRESSIVE CORPORATE BET ON ONE ASSET?
#CanBTCReboundAfterFallingBelow60K? #AnthropicPlungesTowardIPOPriceonDay2 #GlobalStocksFaceLongestLosingStreakSince2023 #CFTCStaffInvestigatedTrumpMemeCoinThenBackedOff #StrategyReports$35BNetReserves
🚨 $35 BILLION IN NET RESERVES — SO WHY SHOULD $MSTR INVESTORS STILL BE NERVOUS?! 💀📉
BIG RESERVES DON'T MEAN ZERO RISK.
Michael Saylor's Strategy reports approximately $35B in net reserves.
Sounds incredibly bullish, right?
NOW LOOK AT THE OTHER SIDE. 👇
💰 Strategy holds a massive Bitcoin position.
📉 Its BTC holdings are reportedly worth less than their total acquisition cost.
🏦 Debt and preferred-stock obligations still exist.
⚠️ And its net reserves can shrink rapidly if Bitcoin keeps falling.
HERE'S THE PART MOST PEOPLE MISS:
Unpledged Bitcoin reduces collateral-related liquidation pressure.
But it doesn't eliminate refinancing risk, preferred dividends or dilution.
🔥 A STRONGER BALANCE SHEET IS NOT THE SAME AS A RISK-FREE INVESTMENT.
If $BTC enters another prolonged bear market, Strategy's financial flexibility could face a serious test.
👀 IS $MSTR A GENIUS BITCOIN STRATEGY — OR THE MOST AGGRESSIVE CORPORATE BET ON ONE ASSET?
#CanBTCReboundAfterFallingBelow60K? #AnthropicPlungesTowardIPOPriceonDay2 #GlobalStocksFaceLongestLosingStreakSince2023 #CFTCStaffInvestigatedTrumpMemeCoinThenBackedOff #StrategyReports$35BNetReserves
BIG RESERVES DON'T MEAN ZERO RISK.
Michael Saylor's Strategy reports approximately $35B in net reserves.
Sounds incredibly bullish, right?
NOW LOOK AT THE OTHER SIDE. 👇
💰 Strategy holds a massive Bitcoin position.
📉 Its BTC holdings are reportedly worth less than their total acquisition cost.
🏦 Debt and preferred-stock obligations still exist.
⚠️ And its net reserves can shrink rapidly if Bitcoin keeps falling.
HERE'S THE PART MOST PEOPLE MISS:
Unpledged Bitcoin reduces collateral-related liquidation pressure.
But it doesn't eliminate refinancing risk, preferred dividends or dilution.
🔥 A STRONGER BALANCE SHEET IS NOT THE SAME AS A RISK-FREE INVESTMENT.
If $BTC enters another prolonged bear market, Strategy's financial flexibility could face a serious test.
👀 IS $MSTR A GENIUS BITCOIN STRATEGY — OR THE MOST AGGRESSIVE CORPORATE BET ON ONE ASSET?
#CanBTCReboundAfterFallingBelow60K? #AnthropicPlungesTowardIPOPriceonDay2 #GlobalStocksFaceLongestLosingStreakSince2023 #CFTCStaffInvestigatedTrumpMemeCoinThenBackedOff #StrategyReports$35BNetReserves
216

·
--

Article
🏦 Strategy Reports $35B Net Reserves: Debt-Free Bitcoin Position or Just the Start of a New Test?#StrategyReports$35BNetReserves
## 🔥 Introduction: From Underwater to Fortress
Few corporate Bitcoin stories are as dramatic as **Strategy's**. 😮 Back in 2022, the company was described as **"underwater"** on its Bitcoin position and had to **pledge about a third of its BTC holdings** as collateral. That period was stressful for investors, and many wondered whether the strategy would survive. 😰
Now the picture looks very different. According to a widely shared market update, Strategy reports **$35 billion in net reserves with zero collateral pledged**. The question being asked everywhere: **can we finally sleep easy?** 😴
---
## 📊 The Big Numbers at a Glance
- 💰 **Net reserves:** about **$35 billion**
- 🔓 **BTC collateral pledged:** **zero**
- 📅 **2022 situation:** about **one-third** of holdings pledged
- 🔄 **Overall story:** a remarkable comeback from a difficult period
Going from pledging a large portion of holdings to having none tied up is a major improvement in the company's financial position. 💪
---
## 🔁 Looking Back: The 2022 Pressure Test
To understand why this matters, remember what happened in 2022. 📚 Bitcoin fell sharply, and the value of Strategy's holdings dropped below what the company had paid. That left it **underwater**, meaning the position was worth less than its cost. 📉
To manage this, the company had to **pledge roughly a third of its Bitcoin** as collateral. This created a real fear: if BTC fell further, could the company face **margin calls** and be forced to sell? ⚠️
That fear is a big reason why this new update is being celebrated. 🎉
---
## 🛡️ What "Zero Collateral" Really Means
This is the most important part of the story. 💡
When a company has **no BTC pledged as collateral**, it is **not exposed to liquidation or margin calls** tied to those holdings. 🔒
| 😰 Pledged Collateral | 😌 Zero Collateral |
|---|---|
| Lenders can demand more assets if price falls | No collateral-based margin call |
| Risk of forced selling | Much lower forced-selling risk |
| Pressure rises quickly in a crash | Flexibility to wait out volatility |
According to the post, even if **BTC retests $50K**, the company could remain calm because there is no collateral that lenders can call on. 🧘
---
## 🧠 Easing the Psychological Pressure
Strong finances matter for **confidence**, not just numbers. 🧩
The post argues that this position helps ease psychological pressure if things get shaky, or even if the company is **dropped from the MSCI index**. 📉 Index removal can trigger selling from funds that track the index, so having a strong balance sheet gives the company more room to absorb that kind of shock. 🛡️
In short, a strong cushion helps investors stay calm when headlines turn negative. ✅
---
## ⚠️ Reality Check: "Can We Sleep Easy?"
The headline asks a fair question, but the honest answer is **not entirely**. 😅
- 🔸 **No collateral risk** does not mean **no price risk**. If Bitcoin falls, the value of the holdings still falls.
- 🔸 **Paper losses** can still hurt sentiment, even without forced selling.
- 🔸 **"Debt-free" and "no collateral" are not always the same thing.** It is worth checking the company's official filings to see exactly what obligations it has.
- 🔸 **Index changes** and market sentiment can still pressure the stock.
So the position looks **much stronger**, but strong is not the same as risk-free. 🧐
---
## 🐋 Don't FOMO Just Because Whales Are Holding
A smart reminder from the post: **don't go all-in just because big holders are strong.** 🐳
A large company with a strong balance sheet can wait years for a recovery. A retail trader usually has less cushion, may use leverage, and faces different risks. ⚠️
- 🔹 A whale's **time horizon** is not yours
- 🔹 A whale's **risk capacity** is not yours
- 🔹 Following a headline without a plan is how traders get hurt 💸
---
## 🧭 What Should Traders Do Now?
1. **🧘 Stay disciplined.** Don't chase the price because of one positive headline.
2. **🛑 Use stop-losses.** Know your exit before you enter.
3. **💰 Take partial profits.** Locking in some gains reduces regret and risk.
4. **🪜 Scale in gradually.** Avoid putting all your capital in at once.
5. **🚫 Be careful with leverage.** Borrowed money turns a normal dip into a danger zone.
---
## 🔭 What to Watch Next
- ₿ **Bitcoin's price action**, especially around key support levels like $50K and $60K
- 📊 **The MSCI index decision** and its possible market impact
- 📄 **Company filings** for exact details on reserves and obligations
- 🌍 **Overall market mood**, since stocks and crypto often move together
---
## 📝 Final Thoughts
Strategy's journey from being underwater and pledging a third of its Bitcoin to reporting **$35 billion in net reserves with no collateral** is one of the biggest comeback stories in corporate crypto. 🌟 It shows how a stronger balance sheet can reduce forced-selling risk and calm nervous markets.
But the lesson for traders is balance: **respect the strength, but never ignore the risk.** Stay patient, protect your capital and let the market confirm its direction. 💡
> ⚠️ **
---
### 🏷️ #CFTCStaffInvestigatedTrumpMemeCoinThenBackedOff #HKBillProposesHK$100KFineForUnauthorizedCryptoTitles #BitMineFaces$10.1BUnrealizedETHLoss #MorganStanleyEndsAnthropicStockSupportAfterOneDay
**#Strategy #Bitcoin #BTC #CryptoNews #MSCI**
---
📌 **
🏦 Strategy Reports $35B Net Reserves: Debt-Free Bitcoin Position or Just the Start of a New Test?
#StrategyReports$35BNetReserves
## 🔥 Introduction: From Underwater to Fortress
Few corporate Bitcoin stories are as dramatic as **Strategy's**. 😮 Back in 2022, the company was described as **"underwater"** on its Bitcoin position and had to **pledge about a third of its BTC holdings** as collateral. That period was stressful for investors, and many wondered whether the strategy would survive. 😰
Now the picture looks very different. According to a widely shared market update, Strategy reports **$35 billion in net reserves with zero collateral pledged**. The question being asked everywhere: **can we finally sleep easy?** 😴
---
## 📊 The Big Numbers at a Glance
- 💰 **Net reserves:** about **$35 billion**
- 🔓 **BTC collateral pledged:** **zero**
- 📅 **2022 situation:** about **one-third** of holdings pledged
- 🔄 **Overall story:** a remarkable comeback from a difficult period
Going from pledging a large portion of holdings to having none tied up is a major improvement in the company's financial position. 💪
---
## 🔁 Looking Back: The 2022 Pressure Test
To understand why this matters, remember what happened in 2022. 📚 Bitcoin fell sharply, and the value of Strategy's holdings dropped below what the company had paid. That left it **underwater**, meaning the position was worth less than its cost. 📉
To manage this, the company had to **pledge roughly a third of its Bitcoin** as collateral. This created a real fear: if BTC fell further, could the company face **margin calls** and be forced to sell? ⚠️
That fear is a big reason why this new update is being celebrated. 🎉
---
## 🛡️ What "Zero Collateral" Really Means
This is the most important part of the story. 💡
When a company has **no BTC pledged as collateral**, it is **not exposed to liquidation or margin calls** tied to those holdings. 🔒
| 😰 Pledged Collateral | 😌 Zero Collateral |
|---|---|
| Lenders can demand more assets if price falls | No collateral-based margin call |
| Risk of forced selling | Much lower forced-selling risk |
| Pressure rises quickly in a crash | Flexibility to wait out volatility |
According to the post, even if **BTC retests $50K**, the company could remain calm because there is no collateral that lenders can call on. 🧘
---
## 🧠 Easing the Psychological Pressure
Strong finances matter for **confidence**, not just numbers. 🧩
The post argues that this position helps ease psychological pressure if things get shaky, or even if the company is **dropped from the MSCI index**. 📉 Index removal can trigger selling from funds that track the index, so having a strong balance sheet gives the company more room to absorb that kind of shock. 🛡️
In short, a strong cushion helps investors stay calm when headlines turn negative. ✅
---
## ⚠️ Reality Check: "Can We Sleep Easy?"
The headline asks a fair question, but the honest answer is **not entirely**. 😅
- 🔸 **No collateral risk** does not mean **no price risk**. If Bitcoin falls, the value of the holdings still falls.
- 🔸 **Paper losses** can still hurt sentiment, even without forced selling.
- 🔸 **"Debt-free" and "no collateral" are not always the same thing.** It is worth checking the company's official filings to see exactly what obligations it has.
- 🔸 **Index changes** and market sentiment can still pressure the stock.
So the position looks **much stronger**, but strong is not the same as risk-free. 🧐
---
## 🐋 Don't FOMO Just Because Whales Are Holding
A smart reminder from the post: **don't go all-in just because big holders are strong.** 🐳
A large company with a strong balance sheet can wait years for a recovery. A retail trader usually has less cushion, may use leverage, and faces different risks. ⚠️
- 🔹 A whale's **time horizon** is not yours
- 🔹 A whale's **risk capacity** is not yours
- 🔹 Following a headline without a plan is how traders get hurt 💸
---
## 🧭 What Should Traders Do Now?
1. **🧘 Stay disciplined.** Don't chase the price because of one positive headline.
2. **🛑 Use stop-losses.** Know your exit before you enter.
3. **💰 Take partial profits.** Locking in some gains reduces regret and risk.
4. **🪜 Scale in gradually.** Avoid putting all your capital in at once.
5. **🚫 Be careful with leverage.** Borrowed money turns a normal dip into a danger zone.
---
## 🔭 What to Watch Next
- ₿ **Bitcoin's price action**, especially around key support levels like $50K and $60K
- 📊 **The MSCI index decision** and its possible market impact
- 📄 **Company filings** for exact details on reserves and obligations
- 🌍 **Overall market mood**, since stocks and crypto often move together
---
## 📝 Final Thoughts
Strategy's journey from being underwater and pledging a third of its Bitcoin to reporting **$35 billion in net reserves with no collateral** is one of the biggest comeback stories in corporate crypto. 🌟 It shows how a stronger balance sheet can reduce forced-selling risk and calm nervous markets.
But the lesson for traders is balance: **respect the strength, but never ignore the risk.** Stay patient, protect your capital and let the market confirm its direction. 💡
> ⚠️ **
---
### 🏷️ #CFTCStaffInvestigatedTrumpMemeCoinThenBackedOff #HKBillProposesHK$100KFineForUnauthorizedCryptoTitles #BitMineFaces$10.1BUnrealizedETHLoss #MorganStanleyEndsAnthropicStockSupportAfterOneDay
**#Strategy #Bitcoin #BTC #CryptoNews #MSCI**
---
📌 **
## 🔥 Introduction: From Underwater to Fortress
Few corporate Bitcoin stories are as dramatic as **Strategy's**. 😮 Back in 2022, the company was described as **"underwater"** on its Bitcoin position and had to **pledge about a third of its BTC holdings** as collateral. That period was stressful for investors, and many wondered whether the strategy would survive. 😰
Now the picture looks very different. According to a widely shared market update, Strategy reports **$35 billion in net reserves with zero collateral pledged**. The question being asked everywhere: **can we finally sleep easy?** 😴
---
## 📊 The Big Numbers at a Glance
- 💰 **Net reserves:** about **$35 billion**
- 🔓 **BTC collateral pledged:** **zero**
- 📅 **2022 situation:** about **one-third** of holdings pledged
- 🔄 **Overall story:** a remarkable comeback from a difficult period
Going from pledging a large portion of holdings to having none tied up is a major improvement in the company's financial position. 💪
---
## 🔁 Looking Back: The 2022 Pressure Test
To understand why this matters, remember what happened in 2022. 📚 Bitcoin fell sharply, and the value of Strategy's holdings dropped below what the company had paid. That left it **underwater**, meaning the position was worth less than its cost. 📉
To manage this, the company had to **pledge roughly a third of its Bitcoin** as collateral. This created a real fear: if BTC fell further, could the company face **margin calls** and be forced to sell? ⚠️
That fear is a big reason why this new update is being celebrated. 🎉
---
## 🛡️ What "Zero Collateral" Really Means
This is the most important part of the story. 💡
When a company has **no BTC pledged as collateral**, it is **not exposed to liquidation or margin calls** tied to those holdings. 🔒
| 😰 Pledged Collateral | 😌 Zero Collateral |
|---|---|
| Lenders can demand more assets if price falls | No collateral-based margin call |
| Risk of forced selling | Much lower forced-selling risk |
| Pressure rises quickly in a crash | Flexibility to wait out volatility |
According to the post, even if **BTC retests $50K**, the company could remain calm because there is no collateral that lenders can call on. 🧘
---
## 🧠 Easing the Psychological Pressure
Strong finances matter for **confidence**, not just numbers. 🧩
The post argues that this position helps ease psychological pressure if things get shaky, or even if the company is **dropped from the MSCI index**. 📉 Index removal can trigger selling from funds that track the index, so having a strong balance sheet gives the company more room to absorb that kind of shock. 🛡️
In short, a strong cushion helps investors stay calm when headlines turn negative. ✅
---
## ⚠️ Reality Check: "Can We Sleep Easy?"
The headline asks a fair question, but the honest answer is **not entirely**. 😅
- 🔸 **No collateral risk** does not mean **no price risk**. If Bitcoin falls, the value of the holdings still falls.
- 🔸 **Paper losses** can still hurt sentiment, even without forced selling.
- 🔸 **"Debt-free" and "no collateral" are not always the same thing.** It is worth checking the company's official filings to see exactly what obligations it has.
- 🔸 **Index changes** and market sentiment can still pressure the stock.
So the position looks **much stronger**, but strong is not the same as risk-free. 🧐
---
## 🐋 Don't FOMO Just Because Whales Are Holding
A smart reminder from the post: **don't go all-in just because big holders are strong.** 🐳
A large company with a strong balance sheet can wait years for a recovery. A retail trader usually has less cushion, may use leverage, and faces different risks. ⚠️
- 🔹 A whale's **time horizon** is not yours
- 🔹 A whale's **risk capacity** is not yours
- 🔹 Following a headline without a plan is how traders get hurt 💸
---
## 🧭 What Should Traders Do Now?
1. **🧘 Stay disciplined.** Don't chase the price because of one positive headline.
2. **🛑 Use stop-losses.** Know your exit before you enter.
3. **💰 Take partial profits.** Locking in some gains reduces regret and risk.
4. **🪜 Scale in gradually.** Avoid putting all your capital in at once.
5. **🚫 Be careful with leverage.** Borrowed money turns a normal dip into a danger zone.
---
## 🔭 What to Watch Next
- ₿ **Bitcoin's price action**, especially around key support levels like $50K and $60K
- 📊 **The MSCI index decision** and its possible market impact
- 📄 **Company filings** for exact details on reserves and obligations
- 🌍 **Overall market mood**, since stocks and crypto often move together
---
## 📝 Final Thoughts
Strategy's journey from being underwater and pledging a third of its Bitcoin to reporting **$35 billion in net reserves with no collateral** is one of the biggest comeback stories in corporate crypto. 🌟 It shows how a stronger balance sheet can reduce forced-selling risk and calm nervous markets.
But the lesson for traders is balance: **respect the strength, but never ignore the risk.** Stay patient, protect your capital and let the market confirm its direction. 💡
> ⚠️ **
---
### 🏷️ #CFTCStaffInvestigatedTrumpMemeCoinThenBackedOff #HKBillProposesHK$100KFineForUnauthorizedCryptoTitles #BitMineFaces$10.1BUnrealizedETHLoss #MorganStanleyEndsAnthropicStockSupportAfterOneDay
**#Strategy #Bitcoin #BTC #CryptoNews #MSCI**
---
📌 **
SHERAZ FAHEEM 01:
Institutional Bitcoin exposure continues to attract attention. Strategy’s financial performance remains an important indicator for investors monitoring corporate crypto adoption.
1
1
239
·
--
🚨 MICHAEL SAYLOR JUST DROPPED A $35 BILLION BITCOIN BOMBSHELL! 🐂🔥
STRATEGY IS NOT THE SAME COMPANY IT WAS IN 2022.
$MSTR reports approximately $35 BILLION in net reserves, with its entire Bitcoin treasury reportedly unpledged.
🤯 HERE'S WHY THAT MATTERS:
₿ Around 850,000 BTC under Strategy's control.
🔓 ZERO BTC pledged as collateral, according to the company.
💰 A massive positive net reserve despite Bitcoin's recent weakness.
🔥 REMEMBER 2022?
Strategy had negative net reserves, and roughly one-third of its Bitcoin was pledged as collateral.
Now, its financial structure looks very different.
⚠️ That doesn't make Strategy immune to Bitcoin crashes, debt obligations or shareholder dilution.
BUT IT DOES REDUCE ONE MAJOR SOURCE OF FORCED-SELLING RISK.
👀 IS MICHAEL SAYLOR BUILDING THE STRONGEST CORPORATE BITCOIN TREASURY IN HISTORY?
$BTC $MSTR $ETH
#CanBTCReboundAfterFallingBelow60K? #GlobalStocksFaceLongestLosingStreakSince2023 #AnthropicPlungesTowardIPOPriceonDay2 #StrategyReports$35BNetReserves #BitMineFaces$10.1BUnrealizedETHLoss
🚨 MICHAEL SAYLOR JUST DROPPED A $35 BILLION BITCOIN BOMBSHELL! 🐂🔥
STRATEGY IS NOT THE SAME COMPANY IT WAS IN 2022.
$MSTR reports approximately $35 BILLION in net reserves, with its entire Bitcoin treasury reportedly unpledged.
🤯 HERE'S WHY THAT MATTERS:
₿ Around 850,000 BTC under Strategy's control.
🔓 ZERO BTC pledged as collateral, according to the company.
💰 A massive positive net reserve despite Bitcoin's recent weakness.
🔥 REMEMBER 2022?
Strategy had negative net reserves, and roughly one-third of its Bitcoin was pledged as collateral.
Now, its financial structure looks very different.
⚠️ That doesn't make Strategy immune to Bitcoin crashes, debt obligations or shareholder dilution.
BUT IT DOES REDUCE ONE MAJOR SOURCE OF FORCED-SELLING RISK.
👀 IS MICHAEL SAYLOR BUILDING THE STRONGEST CORPORATE BITCOIN TREASURY IN HISTORY?
$BTC $MSTR $ETH
#CanBTCReboundAfterFallingBelow60K? #GlobalStocksFaceLongestLosingStreakSince2023 #AnthropicPlungesTowardIPOPriceonDay2 #StrategyReports$35BNetReserves #BitMineFaces$10.1BUnrealizedETHLoss
STRATEGY IS NOT THE SAME COMPANY IT WAS IN 2022.
$MSTR reports approximately $35 BILLION in net reserves, with its entire Bitcoin treasury reportedly unpledged.
🤯 HERE'S WHY THAT MATTERS:
₿ Around 850,000 BTC under Strategy's control.
🔓 ZERO BTC pledged as collateral, according to the company.
💰 A massive positive net reserve despite Bitcoin's recent weakness.
🔥 REMEMBER 2022?
Strategy had negative net reserves, and roughly one-third of its Bitcoin was pledged as collateral.
Now, its financial structure looks very different.
⚠️ That doesn't make Strategy immune to Bitcoin crashes, debt obligations or shareholder dilution.
BUT IT DOES REDUCE ONE MAJOR SOURCE OF FORCED-SELLING RISK.
👀 IS MICHAEL SAYLOR BUILDING THE STRONGEST CORPORATE BITCOIN TREASURY IN HISTORY?
$BTC $MSTR $ETH
#CanBTCReboundAfterFallingBelow60K? #GlobalStocksFaceLongestLosingStreakSince2023 #AnthropicPlungesTowardIPOPriceonDay2 #StrategyReports$35BNetReserves #BitMineFaces$10.1BUnrealizedETHLoss
286

·
--
Bearish
Verified
#StrategyReports$35BNetReserves
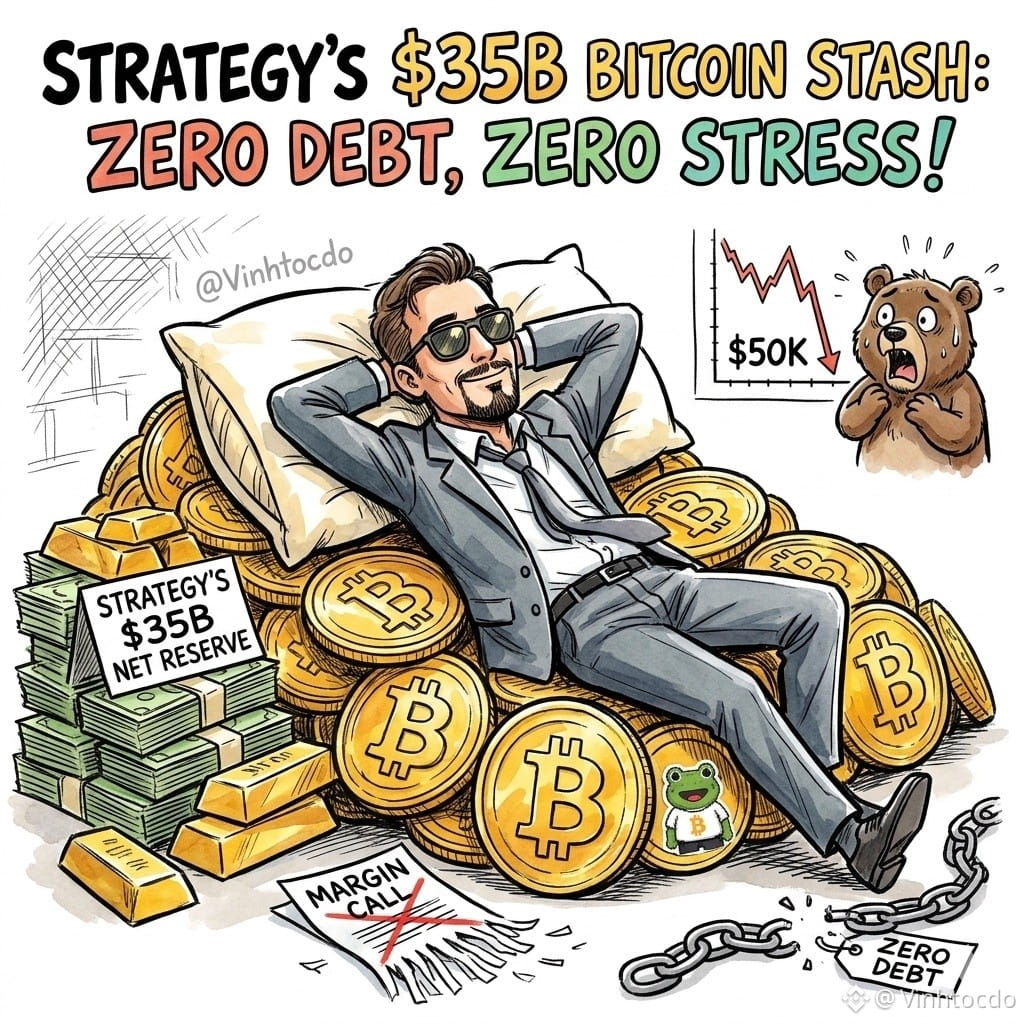
STRATEGY HOLDS $35 BILLION IN DEBT-FREE BITCOIN: CAN WE SLEEP EASY NOW?
After being "underwater" and having to pledge a third of its Bitcoin holdings in 2022, #Strategy has now made a remarkable comeback, with $35 billion in net reserves and zero collateral!
What does that mean?
👉 No BTC collateral = immune to liquidation (margin calls). Even if BTC retests $50K, the company can stay calm!
👉 A very strong financial position helps ease the psychological pressure if things get shaky or the company is dropped from the MSCI index.
What should traders do now? Don’t FOMO all in just because whales are holding strong. Stay disciplined with your capital, set stop-losses, and take partial profits to play it safe!
⚠️ This is not financial advice.
👇 Click below to trade and support me:
$BTC
{future}(BTCUSDT)
$MSTR
{future}(MSTRUSDT)
$EVAA
{future}(EVAAUSDT)
#Bitcoin #CryptoNews #HODL #strategy #TradingTips #VINHTOCDO
#StrategyReports$35BNetReserves
STRATEGY HOLDS $35 BILLION IN DEBT-FREE BITCOIN: CAN WE SLEEP EASY NOW?
After being "underwater" and having to pledge a third of its Bitcoin holdings in 2022, #Strategy has now made a remarkable comeback, with $35 billion in net reserves and zero collateral!
What does that mean?
👉 No BTC collateral = immune to liquidation (margin calls). Even if BTC retests $50K, the company can stay calm!
👉 A very strong financial position helps ease the psychological pressure if things get shaky or the company is dropped from the MSCI index.
What should traders do now? Don’t FOMO all in just because whales are holding strong. Stay disciplined with your capital, set stop-losses, and take partial profits to play it safe!
⚠️ This is not financial advice.
👇 Click below to trade and support me:
$BTC
$MSTR
$EVAA
#Bitcoin #CryptoNews #HODL #strategy #TradingTips #VINHTOCDO
STRATEGY HOLDS $35 BILLION IN DEBT-FREE BITCOIN: CAN WE SLEEP EASY NOW?
After being "underwater" and having to pledge a third of its Bitcoin holdings in 2022, #Strategy has now made a remarkable comeback, with $35 billion in net reserves and zero collateral!
What does that mean?
👉 No BTC collateral = immune to liquidation (margin calls). Even if BTC retests $50K, the company can stay calm!
👉 A very strong financial position helps ease the psychological pressure if things get shaky or the company is dropped from the MSCI index.
What should traders do now? Don’t FOMO all in just because whales are holding strong. Stay disciplined with your capital, set stop-losses, and take partial profits to play it safe!
⚠️ This is not financial advice.
👇 Click below to trade and support me:
$BTC
$MSTR
$EVAA
#Bitcoin #CryptoNews #HODL #strategy #TradingTips #VINHTOCDO
SHERAZ FAHEEM 01:
Institutional Bitcoin exposure continues to attract attention. Strategy’s financial performance remains an important indicator for investors monitoring corporate crypto adoption.
2
7
1.7k


Article
🚨 BlackRock’s IBIT Sees Record $541M Outflow Amid Anthropic IPO Volatility: What’s Next for BitcoinThe crypto market just experienced a major institutional shakeup. On Thursday, November 19, BlackRock’s iShares Bitcoin Trust (IBIT) recorded a massive $541.1 million single-day net outflow—the largest daily withdrawal in the fund's history since launching in January 2024.
Accounting for roughly 93% of the $582.3 million in total outflows across all U.S. spot Bitcoin ETFs that day, this institutional retreat has pushed Bitcoin below the critical $60,000 psychological threshold. Here is a breakdown of what is driving the selloff and what traders should watch next.
1. The ETF Exodus by the Numbers
Historic Single-Day Bleed: IBIT’s $541.1 million exit surpassed its previous daily outflow record of $528.3 million set back in January 2026. Sustained Selling Pressure: Thursday marked the third consecutive day of redemptions for IBIT, bringing its three-day outflow total to nearly $900 million. November Downtrend: Across the entire U.S. spot Bitcoin ETF complex, net outflows for November have climbed to $3.47 billion, with 12 out of the first 14 trading days ending in the red. Despite the bleed, IBIT remains the undisputed category leader with roughly $47.82 billion in net assets.
2. The Anthropic IPO & Tech Sector Contagion
The record ETF outflows coincided directly with AI giant Anthropic’s blockbuster Nasdaq debut (ticker: ANT). While some market observers speculated that retail and institutional investors rotated capital out of crypto to fund IPO allocations, the broader catalyst appears to be macro risk-off contagion:
AI Trade Unraveling: After opening strong, Anthropic shares reversed sharply, dragging down broader AI and semiconductor stocks like Nvidia. High Tech Correlation: Bitcoin continues to trade like a high-beta tech stock rather than an uncorrelated safe haven. With Bitcoin’s 40-day correlation to the Nasdaq 100 sitting near 0.69, heavy selling in tech equities directly spilled over into digital assets. Hawkish Fed Headwinds: Reinforcing the risk-off mood, hawkish signals from Federal Reserve minutes have dampened hopes for near-term rate cuts, keeping liquidity tight across speculative assets.
3. Bitcoin Technical Outlook & Key Levels to Watch
Following the ETF redemptions and Wall Street’s tech selloff, Bitcoin broke down from its summer consolidation range, dipping below $59,000 and erasing its autumn rebound toward $83,000.
Immediate Resistance ($61,300 – $62,000): On-chain data from Glassnode highlights a dense supply cluster between $62,000 and $66,000 where many recent buyers entered. Reclaiming $61,300 is the first step bulls need to halt downward momentum.Critical Support ($57,800 – $60,000): While Glassnode notes strong buyer bids resting near the $60,000 mark, analysts at Bitfinex warn that sustained daily ETF outflows above $300 million alongside price acceptance below $61,300 opens the door to a retest of the $57,803 cycle low.
💡 The Bottom Line
Institutional appetite has temporarily cooled in the face of equity market volatility and tightening macro conditions. For Bitcoin to stage a meaningful recovery, the market will need to see tech equities stabilize post-Anthropic IPO and spot ETF flows flip back to net positive. Until then, expect heightened volatility around the $58,000–$60,000 support zone.
Disclaimer: This analysis is for informational purposes only and does not constitute financial advice. Always Do Your Own Research (DYOR) before making investment decisions.
#CanBTCReboundAfterFallingBelow60K? #GlobalStocksFaceLongestLosingStreakSince2023 #AnthropicPlungesTowardIPOPriceonDay2 #StrategyReports$35BNetReserves #ipo
🚨 BlackRock’s IBIT Sees Record $541M Outflow Amid Anthropic IPO Volatility: What’s Next for Bitcoin
The crypto market just experienced a major institutional shakeup. On Thursday, November 19, BlackRock’s iShares Bitcoin Trust (IBIT) recorded a massive $541.1 million single-day net outflow—the largest daily withdrawal in the fund's history since launching in January 2024.
Accounting for roughly 93% of the $582.3 million in total outflows across all U.S. spot Bitcoin ETFs that day, this institutional retreat has pushed Bitcoin below the critical $60,000 psychological threshold. Here is a breakdown of what is driving the selloff and what traders should watch next.
1. The ETF Exodus by the Numbers
Historic Single-Day Bleed: IBIT’s $541.1 million exit surpassed its previous daily outflow record of $528.3 million set back in January 2026. Sustained Selling Pressure: Thursday marked the third consecutive day of redemptions for IBIT, bringing its three-day outflow total to nearly $900 million. November Downtrend: Across the entire U.S. spot Bitcoin ETF complex, net outflows for November have climbed to $3.47 billion, with 12 out of the first 14 trading days ending in the red. Despite the bleed, IBIT remains the undisputed category leader with roughly $47.82 billion in net assets.
2. The Anthropic IPO & Tech Sector Contagion
The record ETF outflows coincided directly with AI giant Anthropic’s blockbuster Nasdaq debut (ticker: ANT). While some market observers speculated that retail and institutional investors rotated capital out of crypto to fund IPO allocations, the broader catalyst appears to be macro risk-off contagion:
AI Trade Unraveling: After opening strong, Anthropic shares reversed sharply, dragging down broader AI and semiconductor stocks like Nvidia. High Tech Correlation: Bitcoin continues to trade like a high-beta tech stock rather than an uncorrelated safe haven. With Bitcoin’s 40-day correlation to the Nasdaq 100 sitting near 0.69, heavy selling in tech equities directly spilled over into digital assets. Hawkish Fed Headwinds: Reinforcing the risk-off mood, hawkish signals from Federal Reserve minutes have dampened hopes for near-term rate cuts, keeping liquidity tight across speculative assets.
3. Bitcoin Technical Outlook & Key Levels to Watch
Following the ETF redemptions and Wall Street’s tech selloff, Bitcoin broke down from its summer consolidation range, dipping below $59,000 and erasing its autumn rebound toward $83,000.
Immediate Resistance ($61,300 – $62,000): On-chain data from Glassnode highlights a dense supply cluster between $62,000 and $66,000 where many recent buyers entered. Reclaiming $61,300 is the first step bulls need to halt downward momentum.Critical Support ($57,800 – $60,000): While Glassnode notes strong buyer bids resting near the $60,000 mark, analysts at Bitfinex warn that sustained daily ETF outflows above $300 million alongside price acceptance below $61,300 opens the door to a retest of the $57,803 cycle low.
💡 The Bottom Line
Institutional appetite has temporarily cooled in the face of equity market volatility and tightening macro conditions. For Bitcoin to stage a meaningful recovery, the market will need to see tech equities stabilize post-Anthropic IPO and spot ETF flows flip back to net positive. Until then, expect heightened volatility around the $58,000–$60,000 support zone.
Disclaimer: This analysis is for informational purposes only and does not constitute financial advice. Always Do Your Own Research (DYOR) before making investment decisions.
#CanBTCReboundAfterFallingBelow60K? #GlobalStocksFaceLongestLosingStreakSince2023 #AnthropicPlungesTowardIPOPriceonDay2 #StrategyReports$35BNetReserves #ipo
Accounting for roughly 93% of the $582.3 million in total outflows across all U.S. spot Bitcoin ETFs that day, this institutional retreat has pushed Bitcoin below the critical $60,000 psychological threshold. Here is a breakdown of what is driving the selloff and what traders should watch next.
1. The ETF Exodus by the Numbers
Historic Single-Day Bleed: IBIT’s $541.1 million exit surpassed its previous daily outflow record of $528.3 million set back in January 2026. Sustained Selling Pressure: Thursday marked the third consecutive day of redemptions for IBIT, bringing its three-day outflow total to nearly $900 million. November Downtrend: Across the entire U.S. spot Bitcoin ETF complex, net outflows for November have climbed to $3.47 billion, with 12 out of the first 14 trading days ending in the red. Despite the bleed, IBIT remains the undisputed category leader with roughly $47.82 billion in net assets.
2. The Anthropic IPO & Tech Sector Contagion
The record ETF outflows coincided directly with AI giant Anthropic’s blockbuster Nasdaq debut (ticker: ANT). While some market observers speculated that retail and institutional investors rotated capital out of crypto to fund IPO allocations, the broader catalyst appears to be macro risk-off contagion:
AI Trade Unraveling: After opening strong, Anthropic shares reversed sharply, dragging down broader AI and semiconductor stocks like Nvidia. High Tech Correlation: Bitcoin continues to trade like a high-beta tech stock rather than an uncorrelated safe haven. With Bitcoin’s 40-day correlation to the Nasdaq 100 sitting near 0.69, heavy selling in tech equities directly spilled over into digital assets. Hawkish Fed Headwinds: Reinforcing the risk-off mood, hawkish signals from Federal Reserve minutes have dampened hopes for near-term rate cuts, keeping liquidity tight across speculative assets.
3. Bitcoin Technical Outlook & Key Levels to Watch
Following the ETF redemptions and Wall Street’s tech selloff, Bitcoin broke down from its summer consolidation range, dipping below $59,000 and erasing its autumn rebound toward $83,000.
Immediate Resistance ($61,300 – $62,000): On-chain data from Glassnode highlights a dense supply cluster between $62,000 and $66,000 where many recent buyers entered. Reclaiming $61,300 is the first step bulls need to halt downward momentum.Critical Support ($57,800 – $60,000): While Glassnode notes strong buyer bids resting near the $60,000 mark, analysts at Bitfinex warn that sustained daily ETF outflows above $300 million alongside price acceptance below $61,300 opens the door to a retest of the $57,803 cycle low.
💡 The Bottom Line
Institutional appetite has temporarily cooled in the face of equity market volatility and tightening macro conditions. For Bitcoin to stage a meaningful recovery, the market will need to see tech equities stabilize post-Anthropic IPO and spot ETF flows flip back to net positive. Until then, expect heightened volatility around the $58,000–$60,000 support zone.
Disclaimer: This analysis is for informational purposes only and does not constitute financial advice. Always Do Your Own Research (DYOR) before making investment decisions.
#CanBTCReboundAfterFallingBelow60K? #GlobalStocksFaceLongestLosingStreakSince2023 #AnthropicPlungesTowardIPOPriceonDay2 #StrategyReports$35BNetReserves #ipo
595
·
--

Article
🚨 BitMine Faces $10.1B Unrealized ETH Loss: Tom Lee's "Holding Through" Strategy Under Pressure 📉#BitMineFaces$10.1BUnrealizedETHLoss
## 🔥 Introduction: A Paper Loss With Real Psychological Weight
One of the biggest Ethereum stories in the market right now is about **BitMine**, the company led by **Tom Lee**. 😮 According to a widely shared market update, BitMine's **$20.2 billion ETH stash has lost about 49.7% of its value**, which means estimated **unrealized losses of around $10.1 billion**. 💥
That is a huge number, even by crypto standards. The big question on everyone's mind: is BitMine really okay, and what does this mean for ETH traders? 🤔
---
## 📊 The Numbers at a Glance
- 🔻 **ETH holdings:** about **$20.2 billion**
- 🔻 **Decline in value:** roughly **49.7%**
- 🔻 **Estimated unrealized loss:** about **$10.1 billion**
- 🔻 **Strategy:** holding through the drawdown
In simple terms, the value of BitMine's ETH position has fallen by nearly half. Few corporate treasuries have ever held a loss this large on paper. 😳
---
## 📝 "Paper Losses" Explained
The most important phrase here is **"unrealized loss"** (also called a paper loss). 📄
A loss is only locked in when an asset is **actually sold** at a lower price. As long as the company continues to hold its ETH, the loss exists only on the balance sheet, and it can shrink or even disappear if ETH recovers. 🔄
- ✅ Paper losses are **not realized losses**
- ✅ Prices can recover over time
- ⚠️ But there is no guarantee that they will
So the situation is serious, but it is not the same as a company actually selling at a $10 billion loss. 🧠
---
## 🛡️ Why BitMine Is Not Facing Automatic Liquidation
This is where BitMine's position differs from typical leveraged traders. 💡
According to the update, **BitMine uses equity capital**, which means it is **not automatically liquidated at any particular ETH price**. 🏦
Compare that to a leveraged trader:
| 🧑💻 Leveraged Trader | 🏢 Equity-Funded Holder |
|---|---|
| Borrowed money | Own capital |
| Forced liquidation at a set price | No automatic liquidation trigger |
| Can lose everything quickly | Can wait out volatility |
Because there is no margin call hanging over it, BitMine has the **flexibility to hold** through the downturn, which is the core of Tom Lee's strategy. ⏳
---
## 😰 The Psychological Pressure on ETH Bulls
Even if the loss is only on paper, the size of the number matters. 🧠
A headline like **"$10.1 billion in losses"** can change market sentiment, and here is why:
1. **😟 Confidence takes a hit.** Retail traders see the number and start doubting the bullish case.
2. **📰 Media attention grows.** Big-loss stories spread fast and can fuel more fear.
3. **🐻 Bears get a talking point.** Sellers use it to argue that even "smart money" is underwater.
4. **🤔 Questions about conviction.** Traders wonder how long a large holder will stay patient.
That psychological pressure can affect price just as much as technical factors. 📉
---
## 🐋 Don't Blindly Copy the Whales
A key lesson from this story is that **you are not a whale.** 🐳
A large company with equity capital can hold through a 50% drawdown. A retail trader using leverage usually cannot. ⚠️
- 🔸 A corporation may have **years** to wait for a recovery
- 🔸 A leveraged trader may have **minutes** before liquidation
- 🔸 A whale's risk tolerance is not your risk tolerance
Copying a large holder's "just hold" strategy while using borrowed money is one of the fastest ways to blow up an account. 💸
---
## 🧭 What Should Traders Do?
Here is a disciplined approach for a market like this: 🎯
1. **🪜 DCA in smaller amounts.** Spread your buys over time rather than going all-in at once.
2. **📍 Focus on strong support levels.** Build positions near levels where buyers have defended before.
3. **🛑 Set disciplined stop-losses.** Decide your exit before you enter.
4. **🚫 Avoid leverage on losing positions.** Don't hold "infinite losses" with borrowed money.
5. **📏 Size positions carefully.** Only risk what you can afford to lose.
---
## 🔭 What to Watch Next
- 📈 **ETH price action:** does it stabilize or fall further?
- 🏢 **BitMine's behavior:** continued holding or any change in strategy
- 💬 **Market sentiment:** does fear around the loss grow or fade?
- 🌍 **Broader crypto market:** Bitcoin's direction often drags ETH with it
---
## 📝 Final Thoughts
BitMine's situation shows both the power and the pain of **long-term conviction**. 💪 Holding through a drawdown can pay off if the market recovers, but it requires strong capital, patience and nerves of steel. For everyday traders, the better lesson is not "hold forever," but **"manage your risk."** 🛡️
A $10.1 billion paper loss is a heavy headline, yet it is still a paper loss. Whether it turns around or deepens will depend on where Ethereum goes next. ⏳
> ⚠️ *.*
---
### 🏷️
#CFTCStaffInvestigatedTrumpMemeCoinThenBackedOff #StrategyReports$35BNetReserves #HKBillProposesHK$100KFineForUnauthorizedCryptoTitles #CryptoBilisAttackerMoves25000ETHToTornadoCash
**#ETH #Ethereum #BitMine #CryptoNews #TomLee**
---
📌 **
🚨 BitMine Faces $10.1B Unrealized ETH Loss: Tom Lee's "Holding Through" Strategy Under Pressure 📉
#BitMineFaces$10.1BUnrealizedETHLoss
## 🔥 Introduction: A Paper Loss With Real Psychological Weight
One of the biggest Ethereum stories in the market right now is about **BitMine**, the company led by **Tom Lee**. 😮 According to a widely shared market update, BitMine's **$20.2 billion ETH stash has lost about 49.7% of its value**, which means estimated **unrealized losses of around $10.1 billion**. 💥
That is a huge number, even by crypto standards. The big question on everyone's mind: is BitMine really okay, and what does this mean for ETH traders? 🤔
---
## 📊 The Numbers at a Glance
- 🔻 **ETH holdings:** about **$20.2 billion**
- 🔻 **Decline in value:** roughly **49.7%**
- 🔻 **Estimated unrealized loss:** about **$10.1 billion**
- 🔻 **Strategy:** holding through the drawdown
In simple terms, the value of BitMine's ETH position has fallen by nearly half. Few corporate treasuries have ever held a loss this large on paper. 😳
---
## 📝 "Paper Losses" Explained
The most important phrase here is **"unrealized loss"** (also called a paper loss). 📄
A loss is only locked in when an asset is **actually sold** at a lower price. As long as the company continues to hold its ETH, the loss exists only on the balance sheet, and it can shrink or even disappear if ETH recovers. 🔄
- ✅ Paper losses are **not realized losses**
- ✅ Prices can recover over time
- ⚠️ But there is no guarantee that they will
So the situation is serious, but it is not the same as a company actually selling at a $10 billion loss. 🧠
---
## 🛡️ Why BitMine Is Not Facing Automatic Liquidation
This is where BitMine's position differs from typical leveraged traders. 💡
According to the update, **BitMine uses equity capital**, which means it is **not automatically liquidated at any particular ETH price**. 🏦
Compare that to a leveraged trader:
| 🧑💻 Leveraged Trader | 🏢 Equity-Funded Holder |
|---|---|
| Borrowed money | Own capital |
| Forced liquidation at a set price | No automatic liquidation trigger |
| Can lose everything quickly | Can wait out volatility |
Because there is no margin call hanging over it, BitMine has the **flexibility to hold** through the downturn, which is the core of Tom Lee's strategy. ⏳
---
## 😰 The Psychological Pressure on ETH Bulls
Even if the loss is only on paper, the size of the number matters. 🧠
A headline like **"$10.1 billion in losses"** can change market sentiment, and here is why:
1. **😟 Confidence takes a hit.** Retail traders see the number and start doubting the bullish case.
2. **📰 Media attention grows.** Big-loss stories spread fast and can fuel more fear.
3. **🐻 Bears get a talking point.** Sellers use it to argue that even "smart money" is underwater.
4. **🤔 Questions about conviction.** Traders wonder how long a large holder will stay patient.
That psychological pressure can affect price just as much as technical factors. 📉
---
## 🐋 Don't Blindly Copy the Whales
A key lesson from this story is that **you are not a whale.** 🐳
A large company with equity capital can hold through a 50% drawdown. A retail trader using leverage usually cannot. ⚠️
- 🔸 A corporation may have **years** to wait for a recovery
- 🔸 A leveraged trader may have **minutes** before liquidation
- 🔸 A whale's risk tolerance is not your risk tolerance
Copying a large holder's "just hold" strategy while using borrowed money is one of the fastest ways to blow up an account. 💸
---
## 🧭 What Should Traders Do?
Here is a disciplined approach for a market like this: 🎯
1. **🪜 DCA in smaller amounts.** Spread your buys over time rather than going all-in at once.
2. **📍 Focus on strong support levels.** Build positions near levels where buyers have defended before.
3. **🛑 Set disciplined stop-losses.** Decide your exit before you enter.
4. **🚫 Avoid leverage on losing positions.** Don't hold "infinite losses" with borrowed money.
5. **📏 Size positions carefully.** Only risk what you can afford to lose.
---
## 🔭 What to Watch Next
- 📈 **ETH price action:** does it stabilize or fall further?
- 🏢 **BitMine's behavior:** continued holding or any change in strategy
- 💬 **Market sentiment:** does fear around the loss grow or fade?
- 🌍 **Broader crypto market:** Bitcoin's direction often drags ETH with it
---
## 📝 Final Thoughts
BitMine's situation shows both the power and the pain of **long-term conviction**. 💪 Holding through a drawdown can pay off if the market recovers, but it requires strong capital, patience and nerves of steel. For everyday traders, the better lesson is not "hold forever," but **"manage your risk."** 🛡️
A $10.1 billion paper loss is a heavy headline, yet it is still a paper loss. Whether it turns around or deepens will depend on where Ethereum goes next. ⏳
> ⚠️ *.*
---
### 🏷️
#CFTCStaffInvestigatedTrumpMemeCoinThenBackedOff #StrategyReports$35BNetReserves #HKBillProposesHK$100KFineForUnauthorizedCryptoTitles #CryptoBilisAttackerMoves25000ETHToTornadoCash
**#ETH #Ethereum #BitMine #CryptoNews #TomLee**
---
📌 **
## 🔥 Introduction: A Paper Loss With Real Psychological Weight
One of the biggest Ethereum stories in the market right now is about **BitMine**, the company led by **Tom Lee**. 😮 According to a widely shared market update, BitMine's **$20.2 billion ETH stash has lost about 49.7% of its value**, which means estimated **unrealized losses of around $10.1 billion**. 💥
That is a huge number, even by crypto standards. The big question on everyone's mind: is BitMine really okay, and what does this mean for ETH traders? 🤔
---
## 📊 The Numbers at a Glance
- 🔻 **ETH holdings:** about **$20.2 billion**
- 🔻 **Decline in value:** roughly **49.7%**
- 🔻 **Estimated unrealized loss:** about **$10.1 billion**
- 🔻 **Strategy:** holding through the drawdown
In simple terms, the value of BitMine's ETH position has fallen by nearly half. Few corporate treasuries have ever held a loss this large on paper. 😳
---
## 📝 "Paper Losses" Explained
The most important phrase here is **"unrealized loss"** (also called a paper loss). 📄
A loss is only locked in when an asset is **actually sold** at a lower price. As long as the company continues to hold its ETH, the loss exists only on the balance sheet, and it can shrink or even disappear if ETH recovers. 🔄
- ✅ Paper losses are **not realized losses**
- ✅ Prices can recover over time
- ⚠️ But there is no guarantee that they will
So the situation is serious, but it is not the same as a company actually selling at a $10 billion loss. 🧠
---
## 🛡️ Why BitMine Is Not Facing Automatic Liquidation
This is where BitMine's position differs from typical leveraged traders. 💡
According to the update, **BitMine uses equity capital**, which means it is **not automatically liquidated at any particular ETH price**. 🏦
Compare that to a leveraged trader:
| 🧑💻 Leveraged Trader | 🏢 Equity-Funded Holder |
|---|---|
| Borrowed money | Own capital |
| Forced liquidation at a set price | No automatic liquidation trigger |
| Can lose everything quickly | Can wait out volatility |
Because there is no margin call hanging over it, BitMine has the **flexibility to hold** through the downturn, which is the core of Tom Lee's strategy. ⏳
---
## 😰 The Psychological Pressure on ETH Bulls
Even if the loss is only on paper, the size of the number matters. 🧠
A headline like **"$10.1 billion in losses"** can change market sentiment, and here is why:
1. **😟 Confidence takes a hit.** Retail traders see the number and start doubting the bullish case.
2. **📰 Media attention grows.** Big-loss stories spread fast and can fuel more fear.
3. **🐻 Bears get a talking point.** Sellers use it to argue that even "smart money" is underwater.
4. **🤔 Questions about conviction.** Traders wonder how long a large holder will stay patient.
That psychological pressure can affect price just as much as technical factors. 📉
---
## 🐋 Don't Blindly Copy the Whales
A key lesson from this story is that **you are not a whale.** 🐳
A large company with equity capital can hold through a 50% drawdown. A retail trader using leverage usually cannot. ⚠️
- 🔸 A corporation may have **years** to wait for a recovery
- 🔸 A leveraged trader may have **minutes** before liquidation
- 🔸 A whale's risk tolerance is not your risk tolerance
Copying a large holder's "just hold" strategy while using borrowed money is one of the fastest ways to blow up an account. 💸
---
## 🧭 What Should Traders Do?
Here is a disciplined approach for a market like this: 🎯
1. **🪜 DCA in smaller amounts.** Spread your buys over time rather than going all-in at once.
2. **📍 Focus on strong support levels.** Build positions near levels where buyers have defended before.
3. **🛑 Set disciplined stop-losses.** Decide your exit before you enter.
4. **🚫 Avoid leverage on losing positions.** Don't hold "infinite losses" with borrowed money.
5. **📏 Size positions carefully.** Only risk what you can afford to lose.
---
## 🔭 What to Watch Next
- 📈 **ETH price action:** does it stabilize or fall further?
- 🏢 **BitMine's behavior:** continued holding or any change in strategy
- 💬 **Market sentiment:** does fear around the loss grow or fade?
- 🌍 **Broader crypto market:** Bitcoin's direction often drags ETH with it
---
## 📝 Final Thoughts
BitMine's situation shows both the power and the pain of **long-term conviction**. 💪 Holding through a drawdown can pay off if the market recovers, but it requires strong capital, patience and nerves of steel. For everyday traders, the better lesson is not "hold forever," but **"manage your risk."** 🛡️
A $10.1 billion paper loss is a heavy headline, yet it is still a paper loss. Whether it turns around or deepens will depend on where Ethereum goes next. ⏳
> ⚠️ *.*
---
### 🏷️
#CFTCStaffInvestigatedTrumpMemeCoinThenBackedOff #StrategyReports$35BNetReserves #HKBillProposesHK$100KFineForUnauthorizedCryptoTitles #CryptoBilisAttackerMoves25000ETHToTornadoCash
**#ETH #Ethereum #BitMine #CryptoNews #TomLee**
---
📌 **
294

·
--

Article
🚨 BNB Loses the $540 Floor: Sell-Off Intensifies as Bears Target the $500 Demand Zone 📉#BNBDropsBelow540USDTWith8.46%DailyDecline
## 🔥 Introduction: The Sell-Off Just Got Real
The pressure on **BNB** is increasing. The token has **lost the $540 USDT psychological floor**, sliding **8.46% over the last 24 hours** to hover near **$537 to $538**. 😟
For traders who watched BNB hold up better than many altcoins earlier, this is a notable shift. A breakdown of a round-number level like $540 often changes the mood of the market quickly. ⚠️
---
## 📊 How We Got Here: Weeks of Steady Pressure
This move did not come out of nowhere. For weeks, **bears have been chipping away at support**, pushing BNB lower step by step. 🐻
- 🔻 **Late-October high:** near **$759**
- 🔻 **Current price:** around **$537 to $538**
- 🔻 **Total drop from the high:** roughly **29%**
- 🔻 **Moving averages:** price has cut down through every major one
When a token falls through all of its major moving averages, it usually shows that trend strength has shifted firmly to the sellers. 📉 Each failed bounce along the way has added to the downward momentum.
---
## 💥 Why the $540 Break Matters
Round numbers like $540 act as **psychological floors**. Many traders place buy orders, stop-losses and alerts around them. 🎯
Once $540 cracked, two things started to happen:
1. **⚡ Leverage is getting flushed.** Over-leveraged long positions get liquidated, which adds forced selling on top of regular selling.
2. **😰 Panic is creeping into the order books.** As price drops quickly, more traders rush for the exit, which can deepen the move.
This kind of chain reaction is common in crypto: a key level breaks, liquidations trigger, and the price overshoots before it stabilizes. 🌪️
---
## 🧭 The Game Plan: Key Levels to Watch
### 📉 Support: The $500 to $503 Demand Zone
The **$500 to $503 area** is being described as the **final line in the sand**. 🛡️ This is where buyers are expected to step in, since it combines a major round number with a previous demand zone.
If buyers fail to defend it, things could get **messy fast**. A clean break below $500 could open the door to deeper losses and trigger another wave of liquidations. ⚠️
### 📈 Resistance: The $570 Reclaim
On the upside, bulls need a **clean reclaim above $570** just to **pause the bleeding**. 🐂 Note that this is not a bullish signal by itself. It would only slow the downtrend and show that buyers are returning.
---
## 🛡️ Risk Management: Don't Catch a Falling Knife
Sharp drops tempt many traders into trying to buy the bottom. The advice here is clear: **do not try to catch a falling knife with high leverage.** 🔪
A safer approach looks like this:
- ⏳ **Let the liquidation wicks settle.** Wait for the chaos to calm down.
- ✅ **Wait for a confirmed higher low on the 4H chart.** This shows sellers are losing control.
- 🪜 **Keep spot entries staggered.** Scaling in at different levels reduces the risk of a bad single entry.
Using high leverage in a volatile market can wipe out an account in minutes, even if your overall idea turns out to be right. 💸
---
## 🌍 The Bigger Market Picture
BNB's decline is happening alongside broader weakness in crypto, with Bitcoin slipping below $60,000 and US stocks under pressure. 🌐 When the whole market is risk-off, even large, established tokens like BNB find it hard to hold key levels. 📉
That means traders should watch not only BNB's chart but also **Bitcoin's direction and overall market sentiment**. 👀
---
## 🧠 What Should Traders Watch Next?
1. **🎯 The $500 to $503 zone:** the most important support to monitor.
2. **📈 The $570 level:** a reclaim would be the first sign of stabilization.
3. **📊 4H chart structure:** look for a confirmed higher low before considering entries.
4. **₿ Bitcoin's price action:** BNB usually follows the broader market.
5. **🛡️ Position sizing:** keep leverage low and risk small during high volatility.
---
## 📝 Final Thoughts
Volatility shakes out impatient hands, but it also creates some of the cleanest entry opportunities for **disciplined traders**. 💡 For BNB, the next few sessions will show whether the **$500 to $503 zone** can hold or whether bears will push deeper.
The best approach right now is patience: avoid emotional trades, respect key levels and let the market confirm its direction before acting. 🧘
> ⚠️ *Disclaimer: This article is for informational purposes only and is not financial advice. Cryptocurrency markets are highly volatile. Always do your own research before trading or investing.*
---
### 🏷️ #POSCOAndLGCNSCompleteReceivablesTokenizationPilotOnInjective #HKBillProposesHK$100KFineForUnauthorizedCryptoTitles #StrategyReports$35BNetReserves #BitMineFaces$10.1BUnrealizedETHLoss
**#BNB #CryptoNews #Binance #CryptoMarket #TradingStrategy**
---
🚨 BNB Loses the $540 Floor: Sell-Off Intensifies as Bears Target the $500 Demand Zone 📉
#BNBDropsBelow540USDTWith8.46%DailyDecline
## 🔥 Introduction: The Sell-Off Just Got Real
The pressure on **BNB** is increasing. The token has **lost the $540 USDT psychological floor**, sliding **8.46% over the last 24 hours** to hover near **$537 to $538**. 😟
For traders who watched BNB hold up better than many altcoins earlier, this is a notable shift. A breakdown of a round-number level like $540 often changes the mood of the market quickly. ⚠️
---
## 📊 How We Got Here: Weeks of Steady Pressure
This move did not come out of nowhere. For weeks, **bears have been chipping away at support**, pushing BNB lower step by step. 🐻
- 🔻 **Late-October high:** near **$759**
- 🔻 **Current price:** around **$537 to $538**
- 🔻 **Total drop from the high:** roughly **29%**
- 🔻 **Moving averages:** price has cut down through every major one
When a token falls through all of its major moving averages, it usually shows that trend strength has shifted firmly to the sellers. 📉 Each failed bounce along the way has added to the downward momentum.
---
## 💥 Why the $540 Break Matters
Round numbers like $540 act as **psychological floors**. Many traders place buy orders, stop-losses and alerts around them. 🎯
Once $540 cracked, two things started to happen:
1. **⚡ Leverage is getting flushed.** Over-leveraged long positions get liquidated, which adds forced selling on top of regular selling.
2. **😰 Panic is creeping into the order books.** As price drops quickly, more traders rush for the exit, which can deepen the move.
This kind of chain reaction is common in crypto: a key level breaks, liquidations trigger, and the price overshoots before it stabilizes. 🌪️
---
## 🧭 The Game Plan: Key Levels to Watch
### 📉 Support: The $500 to $503 Demand Zone
The **$500 to $503 area** is being described as the **final line in the sand**. 🛡️ This is where buyers are expected to step in, since it combines a major round number with a previous demand zone.
If buyers fail to defend it, things could get **messy fast**. A clean break below $500 could open the door to deeper losses and trigger another wave of liquidations. ⚠️
### 📈 Resistance: The $570 Reclaim
On the upside, bulls need a **clean reclaim above $570** just to **pause the bleeding**. 🐂 Note that this is not a bullish signal by itself. It would only slow the downtrend and show that buyers are returning.
---
## 🛡️ Risk Management: Don't Catch a Falling Knife
Sharp drops tempt many traders into trying to buy the bottom. The advice here is clear: **do not try to catch a falling knife with high leverage.** 🔪
A safer approach looks like this:
- ⏳ **Let the liquidation wicks settle.** Wait for the chaos to calm down.
- ✅ **Wait for a confirmed higher low on the 4H chart.** This shows sellers are losing control.
- 🪜 **Keep spot entries staggered.** Scaling in at different levels reduces the risk of a bad single entry.
Using high leverage in a volatile market can wipe out an account in minutes, even if your overall idea turns out to be right. 💸
---
## 🌍 The Bigger Market Picture
BNB's decline is happening alongside broader weakness in crypto, with Bitcoin slipping below $60,000 and US stocks under pressure. 🌐 When the whole market is risk-off, even large, established tokens like BNB find it hard to hold key levels. 📉
That means traders should watch not only BNB's chart but also **Bitcoin's direction and overall market sentiment**. 👀
---
## 🧠 What Should Traders Watch Next?
1. **🎯 The $500 to $503 zone:** the most important support to monitor.
2. **📈 The $570 level:** a reclaim would be the first sign of stabilization.
3. **📊 4H chart structure:** look for a confirmed higher low before considering entries.
4. **₿ Bitcoin's price action:** BNB usually follows the broader market.
5. **🛡️ Position sizing:** keep leverage low and risk small during high volatility.
---
## 📝 Final Thoughts
Volatility shakes out impatient hands, but it also creates some of the cleanest entry opportunities for **disciplined traders**. 💡 For BNB, the next few sessions will show whether the **$500 to $503 zone** can hold or whether bears will push deeper.
The best approach right now is patience: avoid emotional trades, respect key levels and let the market confirm its direction before acting. 🧘
> ⚠️ *Disclaimer: This article is for informational purposes only and is not financial advice. Cryptocurrency markets are highly volatile. Always do your own research before trading or investing.*
---
### 🏷️ #POSCOAndLGCNSCompleteReceivablesTokenizationPilotOnInjective #HKBillProposesHK$100KFineForUnauthorizedCryptoTitles #StrategyReports$35BNetReserves #BitMineFaces$10.1BUnrealizedETHLoss
**#BNB #CryptoNews #Binance #CryptoMarket #TradingStrategy**
---
## 🔥 Introduction: The Sell-Off Just Got Real
The pressure on **BNB** is increasing. The token has **lost the $540 USDT psychological floor**, sliding **8.46% over the last 24 hours** to hover near **$537 to $538**. 😟
For traders who watched BNB hold up better than many altcoins earlier, this is a notable shift. A breakdown of a round-number level like $540 often changes the mood of the market quickly. ⚠️
---
## 📊 How We Got Here: Weeks of Steady Pressure
This move did not come out of nowhere. For weeks, **bears have been chipping away at support**, pushing BNB lower step by step. 🐻
- 🔻 **Late-October high:** near **$759**
- 🔻 **Current price:** around **$537 to $538**
- 🔻 **Total drop from the high:** roughly **29%**
- 🔻 **Moving averages:** price has cut down through every major one
When a token falls through all of its major moving averages, it usually shows that trend strength has shifted firmly to the sellers. 📉 Each failed bounce along the way has added to the downward momentum.
---
## 💥 Why the $540 Break Matters
Round numbers like $540 act as **psychological floors**. Many traders place buy orders, stop-losses and alerts around them. 🎯
Once $540 cracked, two things started to happen:
1. **⚡ Leverage is getting flushed.** Over-leveraged long positions get liquidated, which adds forced selling on top of regular selling.
2. **😰 Panic is creeping into the order books.** As price drops quickly, more traders rush for the exit, which can deepen the move.
This kind of chain reaction is common in crypto: a key level breaks, liquidations trigger, and the price overshoots before it stabilizes. 🌪️
---
## 🧭 The Game Plan: Key Levels to Watch
### 📉 Support: The $500 to $503 Demand Zone
The **$500 to $503 area** is being described as the **final line in the sand**. 🛡️ This is where buyers are expected to step in, since it combines a major round number with a previous demand zone.
If buyers fail to defend it, things could get **messy fast**. A clean break below $500 could open the door to deeper losses and trigger another wave of liquidations. ⚠️
### 📈 Resistance: The $570 Reclaim
On the upside, bulls need a **clean reclaim above $570** just to **pause the bleeding**. 🐂 Note that this is not a bullish signal by itself. It would only slow the downtrend and show that buyers are returning.
---
## 🛡️ Risk Management: Don't Catch a Falling Knife
Sharp drops tempt many traders into trying to buy the bottom. The advice here is clear: **do not try to catch a falling knife with high leverage.** 🔪
A safer approach looks like this:
- ⏳ **Let the liquidation wicks settle.** Wait for the chaos to calm down.
- ✅ **Wait for a confirmed higher low on the 4H chart.** This shows sellers are losing control.
- 🪜 **Keep spot entries staggered.** Scaling in at different levels reduces the risk of a bad single entry.
Using high leverage in a volatile market can wipe out an account in minutes, even if your overall idea turns out to be right. 💸
---
## 🌍 The Bigger Market Picture
BNB's decline is happening alongside broader weakness in crypto, with Bitcoin slipping below $60,000 and US stocks under pressure. 🌐 When the whole market is risk-off, even large, established tokens like BNB find it hard to hold key levels. 📉
That means traders should watch not only BNB's chart but also **Bitcoin's direction and overall market sentiment**. 👀
---
## 🧠 What Should Traders Watch Next?
1. **🎯 The $500 to $503 zone:** the most important support to monitor.
2. **📈 The $570 level:** a reclaim would be the first sign of stabilization.
3. **📊 4H chart structure:** look for a confirmed higher low before considering entries.
4. **₿ Bitcoin's price action:** BNB usually follows the broader market.
5. **🛡️ Position sizing:** keep leverage low and risk small during high volatility.
---
## 📝 Final Thoughts
Volatility shakes out impatient hands, but it also creates some of the cleanest entry opportunities for **disciplined traders**. 💡 For BNB, the next few sessions will show whether the **$500 to $503 zone** can hold or whether bears will push deeper.
The best approach right now is patience: avoid emotional trades, respect key levels and let the market confirm its direction before acting. 🧘
> ⚠️ *Disclaimer: This article is for informational purposes only and is not financial advice. Cryptocurrency markets are highly volatile. Always do your own research before trading or investing.*
---
### 🏷️ #POSCOAndLGCNSCompleteReceivablesTokenizationPilotOnInjective #HKBillProposesHK$100KFineForUnauthorizedCryptoTitles #StrategyReports$35BNetReserves #BitMineFaces$10.1BUnrealizedETHLoss
**#BNB #CryptoNews #Binance #CryptoMarket #TradingStrategy**
---
1
185

Inverse.
BREAKING: Jim Cramer turns bearish on the stock market
Just a Retest Needed as Structure is Broken. Not Bullish Just Retest.
when the world needed him the most, he returned
#CanBTCReboundAfterFallingBelow60K? #GlobalStocksFaceLongestLosingStreakSince2023 #TwentyOneCapitalAdds172.25BTC #BNBDropsBelow540USDTWith8.46%DailyDecline #StrategyReports$35BNetReserves
Inverse.
BREAKING: Jim Cramer turns bearish on the stock market
Just a Retest Needed as Structure is Broken. Not Bullish Just Retest.
when the world needed him the most, he returned
#CanBTCReboundAfterFallingBelow60K? #GlobalStocksFaceLongestLosingStreakSince2023 #TwentyOneCapitalAdds172.25BTC #BNBDropsBelow540USDTWith8.46%DailyDecline #StrategyReports$35BNetReserves
BREAKING: Jim Cramer turns bearish on the stock market
Just a Retest Needed as Structure is Broken. Not Bullish Just Retest.
when the world needed him the most, he returned
#CanBTCReboundAfterFallingBelow60K? #GlobalStocksFaceLongestLosingStreakSince2023 #TwentyOneCapitalAdds172.25BTC #BNBDropsBelow540USDTWith8.46%DailyDecline #StrategyReports$35BNetReserves

89

·
--
Enso ($ENSO ) is trading around $0.42, seeing a small short-term bounce from oversold levels while remaining in a broader downtrend.
Price & Trend: Down ~35% over the past month, trading below key moving averages with support at $0.38 and resistance at $0.43–$0.47. An oversold RSI (~27) is fueling a minor relief bounce.
Bullish Driver: Continued cross-chain and Real-World Asset (RWA) integrations, including yield-bearing gold on Ether.fi and tokenized stocks on Elysium L2.
Bearish Driver: High supply dilution risk, as roughly 60%+ of tokens remain locked with ongoing vesting unlocks (next major unlock on December 14).#CanBTCReboundAfterFallingBelow60K? #MorganStanleyEndsAnthropicStockSupportAfterOneDay #StrategyReports$35BNetReserves #AnthropicPlungesTowardIPOPriceonDay2
{future}(ENSOUSDT)
{spot}(ENSOUSDT)
Enso ($ENSO ) is trading around $0.42, seeing a small short-term bounce from oversold levels while remaining in a broader downtrend.
Price & Trend: Down ~35% over the past month, trading below key moving averages with support at $0.38 and resistance at $0.43–$0.47. An oversold RSI (~27) is fueling a minor relief bounce.
Bullish Driver: Continued cross-chain and Real-World Asset (RWA) integrations, including yield-bearing gold on Ether.fi and tokenized stocks on Elysium L2.
Bearish Driver: High supply dilution risk, as roughly 60%+ of tokens remain locked with ongoing vesting unlocks (next major unlock on December 14).#CanBTCReboundAfterFallingBelow60K? #MorganStanleyEndsAnthropicStockSupportAfterOneDay #StrategyReports$35BNetReserves #AnthropicPlungesTowardIPOPriceonDay2
Price & Trend: Down ~35% over the past month, trading below key moving averages with support at $0.38 and resistance at $0.43–$0.47. An oversold RSI (~27) is fueling a minor relief bounce.
Bullish Driver: Continued cross-chain and Real-World Asset (RWA) integrations, including yield-bearing gold on Ether.fi and tokenized stocks on Elysium L2.
Bearish Driver: High supply dilution risk, as roughly 60%+ of tokens remain locked with ongoing vesting unlocks (next major unlock on December 14).#CanBTCReboundAfterFallingBelow60K? #MorganStanleyEndsAnthropicStockSupportAfterOneDay #StrategyReports$35BNetReserves #AnthropicPlungesTowardIPOPriceonDay2
67
·
--

Article
🚨 Morgan Stanley Exercises Anthropic's Greenshoe: Is the Safety Net Gone After the Record IPO? 📉#MorganStanleyEndsAnthropicStockSupportAfterOneDay
## 🔥 Introduction: The Largest IPO Meets Its First Real Test
Anthropic's Nasdaq debut under the ticker **ANT** was one of the biggest market events of the year. 🎉 The company priced its IPO at $83 a share, valuing it at about $1.5 trillion, and the offering was set to beat SpaceX's record raise.
But the first days of trading have been bumpy. A widely shared market post says **Morgan Stanley has pulled the safety net after just 24 hours**, and traders are now asking what comes next. 🤔
---
## 📊 The Debut: Volatility From Day One
According to the post, the first trading day looked like this:
- 🟢 **IPO price:** $83
- 🟢 **Opening price:** $111.50
- 🟢 **Day 1 high:** $115.10
- 🔻 **Day 1 close:** $97.17
The stock opened about **34% above its IPO price**, hit a high of **$115.10**, then faded into the close. That kind of spike and fade is common after hyped listings, and the post calls it a **classic volatility trap**. 🎢
---
## 🧰 What Is a Greenshoe Option?
A **greenshoe (over-allotment) option** is a standard IPO tool. 🛠️ Underwriters can sell more shares than the base deal and then use the option to balance things out.
- 📌 The option lets the lead bank oversell the deal by up to 15% and then either take the extra shares from the company or buy them back in the market, depending on where the stock trades.
- 📌 Anthropic granted the underwriters a 30-day option to purchase up to an additional 147,000,000 shares.
- 📌 Morgan Stanley is the **stabilization agent**, meaning it can support the price by buying in the market. The filing says it may end those activities at any time.
If the stock trades **above** the IPO price, the bank usually exercises the option and takes shares from the company. If it trades **below**, the bank can buy shares in the market to support the price. 🔄
---
## 🚨 What the Post Claims Happened
The post says that instead of using its full 30-day stabilization window, Morgan Stanley:
1. **⚡ Exercised the full greenshoe on Friday**, buying **147 million shares at $83**.
2. **🛑 Ended open-market support**, so it stopped buying shares in the market.
The post presents this as the safety net being pulled early. 📉
---
## 📉 The Trader Breakdown
The post lists three takeaways:
- 📉 **Support gone:** shares slid **over 11% to $85-$86**, leaving buyers near the peak down about **27%**.
- 💰 **Cash secured:** Anthropic reportedly banked about **$93.5 billion** in gross proceeds, leaving the stock in **pure price discovery** without bank support.
- 🎯 **Key level:** **$83** is now the critical floor.
At $85-$86, the stock sits only a few dollars above the IPO price, which is why that level matters so much. ⚠️
---
## 🛡️ Why $83 Matters
The **IPO price** is a natural psychological anchor. 🎯
- ✅ **If $83 holds:** buyers are defending the IPO price, and confidence can return.
- ❌ **If $83 breaks:** the stock would trade below its IPO price, which often triggers stop-losses and more selling.
With the bank no longer buying, any support has to come from real demand, not stabilization. 🧠
---
## 🌍 The Broader Market Backdrop
The timing is difficult. 😬 The post notes a **broader tech sell-off**, and US markets have been under pressure, with the S&P 500 on a losing streak and Bitcoin slipping below $60K. When risk assets fall together, even a blockbuster IPO struggles to hold its gains. 📉
---
## 📅 Options Launching Next Week
The post also says **options trading on the stock launches next week**. 🎲
New options listings often bring:
- ⚡ More **volatility**, since traders can speculate and hedge
- 📊 Higher **trading volume**
- 🔄 Sharper moves around key levels like $83
That is why the post expects **fireworks**. 🎆
---
## 🧭 What Should Traders Do?
1. **🎯 Watch the $83 level**, the most important support right now.
2. **📈 Look at volume on bounces**, since strong volume shows real buying.
3. **🛑 Use stop-losses**, because new listings can move fast.
4. **🪜 Scale in gradually** instead of going all-in.
5. **🚫 Avoid heavy leverage** on freshly listed stocks.
---
## 🤖 The Closing Question: Watch $83 or Rotate Into AI Crypto?
The post asks whether traders are **watching $83 or rotating into AI crypto**. 🤖 Some traders compare AI stocks with AI-linked tokens like **$TAO** and **$RENDER**, but these are very different assets, with different risks, regulation and drivers. Don't treat them as interchangeable. ⚠️
---
## 📝 Final Thoughts
A record-breaking IPO, a wild first day and a reported early end to price support make this a fascinating test. 🌪️ The next sessions will show whether **real demand can defend $83** without the bank behind it.
For traders, the lesson is clear: hype can lift a new listing quickly, but **discipline** protects your capital when volatility returns. 💡
> ⚠️ **
---
#CFTCStaffInvestigatedTrumpMemeCoinThenBackedOff #StrategyReports$35BNetReserves #HKBillProposesHK$100KFineForUnauthorizedCryptoTitles #BitMineFaces$10.1BUnrealizedETHLoss
### 🏷️
**#Anthropic #ANT #IPO #MorganStanley #StockMarket**
-
🚨 Morgan Stanley Exercises Anthropic's Greenshoe: Is the Safety Net Gone After the Record IPO? 📉
#MorganStanleyEndsAnthropicStockSupportAfterOneDay
## 🔥 Introduction: The Largest IPO Meets Its First Real Test
Anthropic's Nasdaq debut under the ticker **ANT** was one of the biggest market events of the year. 🎉 The company priced its IPO at $83 a share, valuing it at about $1.5 trillion, and the offering was set to beat SpaceX's record raise.
But the first days of trading have been bumpy. A widely shared market post says **Morgan Stanley has pulled the safety net after just 24 hours**, and traders are now asking what comes next. 🤔
---
## 📊 The Debut: Volatility From Day One
According to the post, the first trading day looked like this:
- 🟢 **IPO price:** $83
- 🟢 **Opening price:** $111.50
- 🟢 **Day 1 high:** $115.10
- 🔻 **Day 1 close:** $97.17
The stock opened about **34% above its IPO price**, hit a high of **$115.10**, then faded into the close. That kind of spike and fade is common after hyped listings, and the post calls it a **classic volatility trap**. 🎢
---
## 🧰 What Is a Greenshoe Option?
A **greenshoe (over-allotment) option** is a standard IPO tool. 🛠️ Underwriters can sell more shares than the base deal and then use the option to balance things out.
- 📌 The option lets the lead bank oversell the deal by up to 15% and then either take the extra shares from the company or buy them back in the market, depending on where the stock trades.
- 📌 Anthropic granted the underwriters a 30-day option to purchase up to an additional 147,000,000 shares.
- 📌 Morgan Stanley is the **stabilization agent**, meaning it can support the price by buying in the market. The filing says it may end those activities at any time.
If the stock trades **above** the IPO price, the bank usually exercises the option and takes shares from the company. If it trades **below**, the bank can buy shares in the market to support the price. 🔄
---
## 🚨 What the Post Claims Happened
The post says that instead of using its full 30-day stabilization window, Morgan Stanley:
1. **⚡ Exercised the full greenshoe on Friday**, buying **147 million shares at $83**.
2. **🛑 Ended open-market support**, so it stopped buying shares in the market.
The post presents this as the safety net being pulled early. 📉
---
## 📉 The Trader Breakdown
The post lists three takeaways:
- 📉 **Support gone:** shares slid **over 11% to $85-$86**, leaving buyers near the peak down about **27%**.
- 💰 **Cash secured:** Anthropic reportedly banked about **$93.5 billion** in gross proceeds, leaving the stock in **pure price discovery** without bank support.
- 🎯 **Key level:** **$83** is now the critical floor.
At $85-$86, the stock sits only a few dollars above the IPO price, which is why that level matters so much. ⚠️
---
## 🛡️ Why $83 Matters
The **IPO price** is a natural psychological anchor. 🎯
- ✅ **If $83 holds:** buyers are defending the IPO price, and confidence can return.
- ❌ **If $83 breaks:** the stock would trade below its IPO price, which often triggers stop-losses and more selling.
With the bank no longer buying, any support has to come from real demand, not stabilization. 🧠
---
## 🌍 The Broader Market Backdrop
The timing is difficult. 😬 The post notes a **broader tech sell-off**, and US markets have been under pressure, with the S&P 500 on a losing streak and Bitcoin slipping below $60K. When risk assets fall together, even a blockbuster IPO struggles to hold its gains. 📉
---
## 📅 Options Launching Next Week
The post also says **options trading on the stock launches next week**. 🎲
New options listings often bring:
- ⚡ More **volatility**, since traders can speculate and hedge
- 📊 Higher **trading volume**
- 🔄 Sharper moves around key levels like $83
That is why the post expects **fireworks**. 🎆
---
## 🧭 What Should Traders Do?
1. **🎯 Watch the $83 level**, the most important support right now.
2. **📈 Look at volume on bounces**, since strong volume shows real buying.
3. **🛑 Use stop-losses**, because new listings can move fast.
4. **🪜 Scale in gradually** instead of going all-in.
5. **🚫 Avoid heavy leverage** on freshly listed stocks.
---
## 🤖 The Closing Question: Watch $83 or Rotate Into AI Crypto?
The post asks whether traders are **watching $83 or rotating into AI crypto**. 🤖 Some traders compare AI stocks with AI-linked tokens like **$TAO** and **$RENDER**, but these are very different assets, with different risks, regulation and drivers. Don't treat them as interchangeable. ⚠️
---
## 📝 Final Thoughts
A record-breaking IPO, a wild first day and a reported early end to price support make this a fascinating test. 🌪️ The next sessions will show whether **real demand can defend $83** without the bank behind it.
For traders, the lesson is clear: hype can lift a new listing quickly, but **discipline** protects your capital when volatility returns. 💡
> ⚠️ **
---
#CFTCStaffInvestigatedTrumpMemeCoinThenBackedOff #StrategyReports$35BNetReserves #HKBillProposesHK$100KFineForUnauthorizedCryptoTitles #BitMineFaces$10.1BUnrealizedETHLoss
### 🏷️
**#Anthropic #ANT #IPO #MorganStanley #StockMarket**
-
## 🔥 Introduction: The Largest IPO Meets Its First Real Test
Anthropic's Nasdaq debut under the ticker **ANT** was one of the biggest market events of the year. 🎉 The company priced its IPO at $83 a share, valuing it at about $1.5 trillion, and the offering was set to beat SpaceX's record raise.
But the first days of trading have been bumpy. A widely shared market post says **Morgan Stanley has pulled the safety net after just 24 hours**, and traders are now asking what comes next. 🤔
---
## 📊 The Debut: Volatility From Day One
According to the post, the first trading day looked like this:
- 🟢 **IPO price:** $83
- 🟢 **Opening price:** $111.50
- 🟢 **Day 1 high:** $115.10
- 🔻 **Day 1 close:** $97.17
The stock opened about **34% above its IPO price**, hit a high of **$115.10**, then faded into the close. That kind of spike and fade is common after hyped listings, and the post calls it a **classic volatility trap**. 🎢
---
## 🧰 What Is a Greenshoe Option?
A **greenshoe (over-allotment) option** is a standard IPO tool. 🛠️ Underwriters can sell more shares than the base deal and then use the option to balance things out.
- 📌 The option lets the lead bank oversell the deal by up to 15% and then either take the extra shares from the company or buy them back in the market, depending on where the stock trades.
- 📌 Anthropic granted the underwriters a 30-day option to purchase up to an additional 147,000,000 shares.
- 📌 Morgan Stanley is the **stabilization agent**, meaning it can support the price by buying in the market. The filing says it may end those activities at any time.
If the stock trades **above** the IPO price, the bank usually exercises the option and takes shares from the company. If it trades **below**, the bank can buy shares in the market to support the price. 🔄
---
## 🚨 What the Post Claims Happened
The post says that instead of using its full 30-day stabilization window, Morgan Stanley:
1. **⚡ Exercised the full greenshoe on Friday**, buying **147 million shares at $83**.
2. **🛑 Ended open-market support**, so it stopped buying shares in the market.
The post presents this as the safety net being pulled early. 📉
---
## 📉 The Trader Breakdown
The post lists three takeaways:
- 📉 **Support gone:** shares slid **over 11% to $85-$86**, leaving buyers near the peak down about **27%**.
- 💰 **Cash secured:** Anthropic reportedly banked about **$93.5 billion** in gross proceeds, leaving the stock in **pure price discovery** without bank support.
- 🎯 **Key level:** **$83** is now the critical floor.
At $85-$86, the stock sits only a few dollars above the IPO price, which is why that level matters so much. ⚠️
---
## 🛡️ Why $83 Matters
The **IPO price** is a natural psychological anchor. 🎯
- ✅ **If $83 holds:** buyers are defending the IPO price, and confidence can return.
- ❌ **If $83 breaks:** the stock would trade below its IPO price, which often triggers stop-losses and more selling.
With the bank no longer buying, any support has to come from real demand, not stabilization. 🧠
---
## 🌍 The Broader Market Backdrop
The timing is difficult. 😬 The post notes a **broader tech sell-off**, and US markets have been under pressure, with the S&P 500 on a losing streak and Bitcoin slipping below $60K. When risk assets fall together, even a blockbuster IPO struggles to hold its gains. 📉
---
## 📅 Options Launching Next Week
The post also says **options trading on the stock launches next week**. 🎲
New options listings often bring:
- ⚡ More **volatility**, since traders can speculate and hedge
- 📊 Higher **trading volume**
- 🔄 Sharper moves around key levels like $83
That is why the post expects **fireworks**. 🎆
---
## 🧭 What Should Traders Do?
1. **🎯 Watch the $83 level**, the most important support right now.
2. **📈 Look at volume on bounces**, since strong volume shows real buying.
3. **🛑 Use stop-losses**, because new listings can move fast.
4. **🪜 Scale in gradually** instead of going all-in.
5. **🚫 Avoid heavy leverage** on freshly listed stocks.
---
## 🤖 The Closing Question: Watch $83 or Rotate Into AI Crypto?
The post asks whether traders are **watching $83 or rotating into AI crypto**. 🤖 Some traders compare AI stocks with AI-linked tokens like **$TAO** and **$RENDER**, but these are very different assets, with different risks, regulation and drivers. Don't treat them as interchangeable. ⚠️
---
## 📝 Final Thoughts
A record-breaking IPO, a wild first day and a reported early end to price support make this a fascinating test. 🌪️ The next sessions will show whether **real demand can defend $83** without the bank behind it.
For traders, the lesson is clear: hype can lift a new listing quickly, but **discipline** protects your capital when volatility returns. 💡
> ⚠️ **
---
#CFTCStaffInvestigatedTrumpMemeCoinThenBackedOff #StrategyReports$35BNetReserves #HKBillProposesHK$100KFineForUnauthorizedCryptoTitles #BitMineFaces$10.1BUnrealizedETHLoss
### 🏷️
**#Anthropic #ANT #IPO #MorganStanley #StockMarket**
-
ANT-4.95%
MSUS-3.94%
1
216
·
--

Article
🚨 Bitcoin Breaks Below $60,000: Tech Selloff Hits Crypto and Altcoins Fall Even Harder 📉#CanBTCReboundAfterFallingBelow60K?
## 🔥 Introduction: A Painful Friday for Crypto
Friday, November 20, delivered a harsh reminder that crypto markets don't move in isolation. **Bitcoin (BTC) fell below the key $60,000 level for the first time since early July**, as a selloff in US tech stocks spread across Asia and pushed digital assets lower. 😟
In early US trading, Bitcoin slid to nearly **$59,000**, down more than **5% in just 24 hours**. For traders who had been hoping for a sustained recovery, this was a sharp wake-up call. ⚠️
---
## 📊 Bitcoin Erases Its Entire Rebound
The most striking part of this move is what it undid. Bitcoin had staged a recovery in **August and September**, climbing toward **$83,000**. That rally gave bulls plenty of confidence, and many believed the worst was behind the market. 🐂
Friday's drop **wiped out all of that rebound**. Prices are now back at levels not seen since early July. In market terms, the entire recovery leg has been given back, and that matters for sentiment. When a rally fully reverses, traders often start questioning whether the earlier move was a genuine trend change or just a temporary bounce. 🤔
---
## 🏦 The ETF Factor: A Record Outflow from BlackRock's IBIT
One of the biggest warning signs came one day before the price drop. On Thursday, **BlackRock's iShares Bitcoin Trust (IBIT)** saw a record **$541.1 million in outflows**, according to **Farside Investors**. 💸
This was the **largest single-day withdrawal since the fund launched**. IBIT is widely watched as a barometer of institutional appetite for Bitcoin, so a record exit suggests that large investors were already reducing exposure before Friday's slide. 🏛️
Why does this matter?
- 🔹 Spot Bitcoin ETFs have become a major channel for institutional money.
- 🔹 Heavy outflows can mean selling pressure on the underlying asset.
- 🔹 A record outflow from the largest fund sends a strong signal about sentiment.
---
## 🌏 From Wall Street to Asia to Crypto
This wasn't a crypto-only story. The trigger was a **selloff in US tech stocks**, which spread to **Asian markets** and then reached digital assets. 🌐
Bitcoin and tech stocks have often moved together during risk-off periods. When investors become nervous about high-growth, high-valuation sectors, they tend to cut exposure to other risk assets too, and crypto is usually among the first to feel it. This move was another example of how closely crypto is tied to global market mood. 📉
---
## 🪙 Altcoins Fall Harder Than Bitcoin
If Bitcoin's drop looked painful, parts of the altcoin market fared worse. 😬
**None of the CoinDesk 20 index's constituents traded higher** on the day. The index fell **1.9% from Thursday's close to 1,644.31**, showing just how broad the weakness was. 🔻
Some of the notable losers:
- 🔸 **Zcash (ZEC)** dropped **11%**
- 🔸 **NEAR Protocol (NEAR)** fell **9.3%**
*(Note: the index and Bitcoin figures are measured over different windows, so they aren't directly comparable.)*
---
## ⚙️ Onchain Trading Tokens Among the Hardest Hit
Tokens tied to **onchain trading platforms**, including those linked to **perpetual futures, options and spot exchanges**, were among the hardest hit. They fell **between 5% and 11% over 24 hours**. 📉
This group tends to be sensitive to trading activity and market sentiment. When volatility rises and confidence drops, trading volumes and risk appetite can shift quickly, which can weigh on these tokens. 🔄
---
## 🧠 What Should Traders Watch Next?
After a move like this, many traders watch a few key areas: 👀
1. **🎯 The $60,000 level**: Now that it has been broken, will Bitcoin reclaim it quickly, or does it turn into resistance?
2. **📉 ETF flows**: Will IBIT's record outflow be a one-off, or the start of a bigger trend?
3. **🏢 US tech stocks**: Since the selloff started there, any stabilization in equities could help crypto.
4. **🪙 Altcoin strength**: Will altcoins keep underperforming, or find support?
5. **🛡️ Risk management**: Volatile days are exactly when stop-losses and position sizing matter most.
---
## 📝 Final Thoughts
Friday's action was a textbook risk-off day: a tech stock selloff, record ETF outflows, a lost psychological level and broad altcoin weakness all landed together. 🌪️ For Bitcoin, falling below $60,000 and erasing its August-September rebound is a major technical and psychological shift.
Whether this is a short-term shakeout or the start of a deeper correction remains to be seen. For now, staying informed, disciplined and cautious is the smartest approach. 💡
> ⚠️ *Disclaimer: This article is for informational purposes only and is not financial advice. Always do your own research before trading or investing.*
---
### 🏷️ #HKBillProposesHK$100KFineForUnauthorizedCryptoTitles #BitMineFaces$10.1BUnrealizedETHLoss #StrategyReports$35BNetReserves #MorganStanleyEndsAnthropicStockSupportAfterOneDay
**#Bitcoin #CryptoNews #BTC #Altcoins #CryptoMarket**
---
🚨 Bitcoin Breaks Below $60,000: Tech Selloff Hits Crypto and Altcoins Fall Even Harder 📉
#CanBTCReboundAfterFallingBelow60K?
## 🔥 Introduction: A Painful Friday for Crypto
Friday, November 20, delivered a harsh reminder that crypto markets don't move in isolation. **Bitcoin (BTC) fell below the key $60,000 level for the first time since early July**, as a selloff in US tech stocks spread across Asia and pushed digital assets lower. 😟
In early US trading, Bitcoin slid to nearly **$59,000**, down more than **5% in just 24 hours**. For traders who had been hoping for a sustained recovery, this was a sharp wake-up call. ⚠️
---
## 📊 Bitcoin Erases Its Entire Rebound
The most striking part of this move is what it undid. Bitcoin had staged a recovery in **August and September**, climbing toward **$83,000**. That rally gave bulls plenty of confidence, and many believed the worst was behind the market. 🐂
Friday's drop **wiped out all of that rebound**. Prices are now back at levels not seen since early July. In market terms, the entire recovery leg has been given back, and that matters for sentiment. When a rally fully reverses, traders often start questioning whether the earlier move was a genuine trend change or just a temporary bounce. 🤔
---
## 🏦 The ETF Factor: A Record Outflow from BlackRock's IBIT
One of the biggest warning signs came one day before the price drop. On Thursday, **BlackRock's iShares Bitcoin Trust (IBIT)** saw a record **$541.1 million in outflows**, according to **Farside Investors**. 💸
This was the **largest single-day withdrawal since the fund launched**. IBIT is widely watched as a barometer of institutional appetite for Bitcoin, so a record exit suggests that large investors were already reducing exposure before Friday's slide. 🏛️
Why does this matter?
- 🔹 Spot Bitcoin ETFs have become a major channel for institutional money.
- 🔹 Heavy outflows can mean selling pressure on the underlying asset.
- 🔹 A record outflow from the largest fund sends a strong signal about sentiment.
---
## 🌏 From Wall Street to Asia to Crypto
This wasn't a crypto-only story. The trigger was a **selloff in US tech stocks**, which spread to **Asian markets** and then reached digital assets. 🌐
Bitcoin and tech stocks have often moved together during risk-off periods. When investors become nervous about high-growth, high-valuation sectors, they tend to cut exposure to other risk assets too, and crypto is usually among the first to feel it. This move was another example of how closely crypto is tied to global market mood. 📉
---
## 🪙 Altcoins Fall Harder Than Bitcoin
If Bitcoin's drop looked painful, parts of the altcoin market fared worse. 😬
**None of the CoinDesk 20 index's constituents traded higher** on the day. The index fell **1.9% from Thursday's close to 1,644.31**, showing just how broad the weakness was. 🔻
Some of the notable losers:
- 🔸 **Zcash (ZEC)** dropped **11%**
- 🔸 **NEAR Protocol (NEAR)** fell **9.3%**
*(Note: the index and Bitcoin figures are measured over different windows, so they aren't directly comparable.)*
---
## ⚙️ Onchain Trading Tokens Among the Hardest Hit
Tokens tied to **onchain trading platforms**, including those linked to **perpetual futures, options and spot exchanges**, were among the hardest hit. They fell **between 5% and 11% over 24 hours**. 📉
This group tends to be sensitive to trading activity and market sentiment. When volatility rises and confidence drops, trading volumes and risk appetite can shift quickly, which can weigh on these tokens. 🔄
---
## 🧠 What Should Traders Watch Next?
After a move like this, many traders watch a few key areas: 👀
1. **🎯 The $60,000 level**: Now that it has been broken, will Bitcoin reclaim it quickly, or does it turn into resistance?
2. **📉 ETF flows**: Will IBIT's record outflow be a one-off, or the start of a bigger trend?
3. **🏢 US tech stocks**: Since the selloff started there, any stabilization in equities could help crypto.
4. **🪙 Altcoin strength**: Will altcoins keep underperforming, or find support?
5. **🛡️ Risk management**: Volatile days are exactly when stop-losses and position sizing matter most.
---
## 📝 Final Thoughts
Friday's action was a textbook risk-off day: a tech stock selloff, record ETF outflows, a lost psychological level and broad altcoin weakness all landed together. 🌪️ For Bitcoin, falling below $60,000 and erasing its August-September rebound is a major technical and psychological shift.
Whether this is a short-term shakeout or the start of a deeper correction remains to be seen. For now, staying informed, disciplined and cautious is the smartest approach. 💡
> ⚠️ *Disclaimer: This article is for informational purposes only and is not financial advice. Always do your own research before trading or investing.*
---
### 🏷️ #HKBillProposesHK$100KFineForUnauthorizedCryptoTitles #BitMineFaces$10.1BUnrealizedETHLoss #StrategyReports$35BNetReserves #MorganStanleyEndsAnthropicStockSupportAfterOneDay
**#Bitcoin #CryptoNews #BTC #Altcoins #CryptoMarket**
---
## 🔥 Introduction: A Painful Friday for Crypto
Friday, November 20, delivered a harsh reminder that crypto markets don't move in isolation. **Bitcoin (BTC) fell below the key $60,000 level for the first time since early July**, as a selloff in US tech stocks spread across Asia and pushed digital assets lower. 😟
In early US trading, Bitcoin slid to nearly **$59,000**, down more than **5% in just 24 hours**. For traders who had been hoping for a sustained recovery, this was a sharp wake-up call. ⚠️
---
## 📊 Bitcoin Erases Its Entire Rebound
The most striking part of this move is what it undid. Bitcoin had staged a recovery in **August and September**, climbing toward **$83,000**. That rally gave bulls plenty of confidence, and many believed the worst was behind the market. 🐂
Friday's drop **wiped out all of that rebound**. Prices are now back at levels not seen since early July. In market terms, the entire recovery leg has been given back, and that matters for sentiment. When a rally fully reverses, traders often start questioning whether the earlier move was a genuine trend change or just a temporary bounce. 🤔
---
## 🏦 The ETF Factor: A Record Outflow from BlackRock's IBIT
One of the biggest warning signs came one day before the price drop. On Thursday, **BlackRock's iShares Bitcoin Trust (IBIT)** saw a record **$541.1 million in outflows**, according to **Farside Investors**. 💸
This was the **largest single-day withdrawal since the fund launched**. IBIT is widely watched as a barometer of institutional appetite for Bitcoin, so a record exit suggests that large investors were already reducing exposure before Friday's slide. 🏛️
Why does this matter?
- 🔹 Spot Bitcoin ETFs have become a major channel for institutional money.
- 🔹 Heavy outflows can mean selling pressure on the underlying asset.
- 🔹 A record outflow from the largest fund sends a strong signal about sentiment.
---
## 🌏 From Wall Street to Asia to Crypto
This wasn't a crypto-only story. The trigger was a **selloff in US tech stocks**, which spread to **Asian markets** and then reached digital assets. 🌐
Bitcoin and tech stocks have often moved together during risk-off periods. When investors become nervous about high-growth, high-valuation sectors, they tend to cut exposure to other risk assets too, and crypto is usually among the first to feel it. This move was another example of how closely crypto is tied to global market mood. 📉
---
## 🪙 Altcoins Fall Harder Than Bitcoin
If Bitcoin's drop looked painful, parts of the altcoin market fared worse. 😬
**None of the CoinDesk 20 index's constituents traded higher** on the day. The index fell **1.9% from Thursday's close to 1,644.31**, showing just how broad the weakness was. 🔻
Some of the notable losers:
- 🔸 **Zcash (ZEC)** dropped **11%**
- 🔸 **NEAR Protocol (NEAR)** fell **9.3%**
*(Note: the index and Bitcoin figures are measured over different windows, so they aren't directly comparable.)*
---
## ⚙️ Onchain Trading Tokens Among the Hardest Hit
Tokens tied to **onchain trading platforms**, including those linked to **perpetual futures, options and spot exchanges**, were among the hardest hit. They fell **between 5% and 11% over 24 hours**. 📉
This group tends to be sensitive to trading activity and market sentiment. When volatility rises and confidence drops, trading volumes and risk appetite can shift quickly, which can weigh on these tokens. 🔄
---
## 🧠 What Should Traders Watch Next?
After a move like this, many traders watch a few key areas: 👀
1. **🎯 The $60,000 level**: Now that it has been broken, will Bitcoin reclaim it quickly, or does it turn into resistance?
2. **📉 ETF flows**: Will IBIT's record outflow be a one-off, or the start of a bigger trend?
3. **🏢 US tech stocks**: Since the selloff started there, any stabilization in equities could help crypto.
4. **🪙 Altcoin strength**: Will altcoins keep underperforming, or find support?
5. **🛡️ Risk management**: Volatile days are exactly when stop-losses and position sizing matter most.
---
## 📝 Final Thoughts
Friday's action was a textbook risk-off day: a tech stock selloff, record ETF outflows, a lost psychological level and broad altcoin weakness all landed together. 🌪️ For Bitcoin, falling below $60,000 and erasing its August-September rebound is a major technical and psychological shift.
Whether this is a short-term shakeout or the start of a deeper correction remains to be seen. For now, staying informed, disciplined and cautious is the smartest approach. 💡
> ⚠️ *Disclaimer: This article is for informational purposes only and is not financial advice. Always do your own research before trading or investing.*
---
### 🏷️ #HKBillProposesHK$100KFineForUnauthorizedCryptoTitles #BitMineFaces$10.1BUnrealizedETHLoss #StrategyReports$35BNetReserves #MorganStanleyEndsAnthropicStockSupportAfterOneDay
**#Bitcoin #CryptoNews #BTC #Altcoins #CryptoMarket**
---
BTC-6.23%
IBITETF-4.95%
132
·
--
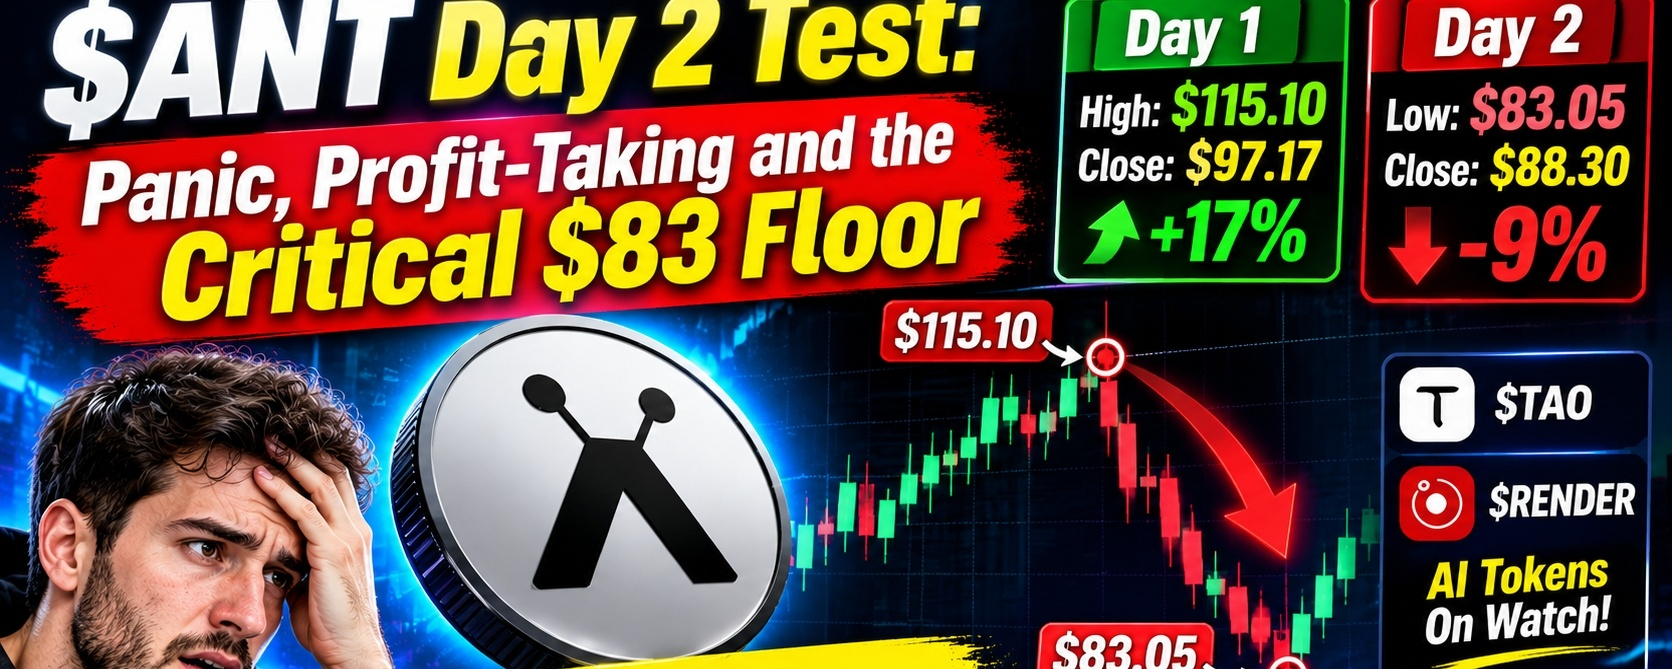
Article
🐜 $ANT Day 2 Test: Panic, Profit-Taking and the Critical $83 Floor 📊#AnthropicPlungesTowardIPOPriceonDay2
## 🔥 Introduction: From Hero to Doubt in 48 Hours
New token listings often follow the same emotional script. Day 1 brings excitement, and Day 2 brings reality. 🎢
**$ANT** just lived through both. On its first day, the token was celebrated like a hero. By the second day, many traders were calling it a crash. But a closer look at the numbers tells a more nuanced story. 👀
---
## 🚀 Day 1: Hype, FOMO and a Wild Ride
Here is how the first trading day unfolded:
- 🟢 **Listing price:** $83
- 🟢 **Opening price:** $111.50
- 🟢 **Day 1 high:** $115.10
- 🟢 **Day 1 close:** $97.17
The token opened **well above its listing price** and pushed to a high of **$115.10**, a gain of nearly **39% over the $83 listing level**. 🔥 Even after pulling back, it closed Day 1 at **$97.17, still about 17% above its listing price**.
Day 1 was driven by **hype, FOMO and flippers**. Fast-moving new listings attract traders looking for quick profits, and the excitement can push prices far above fair value in a short time. ⚡
---
## 📉 Day 2: The Reality Check
Then Day 2 arrived, and the mood changed quickly. 😬
- 🔻 **Day 2 low:** $83.05
- 🔻 **Day 2 close:** around $88.30
- 🔻 **Daily change:** down over **9%**
The token fell hard and touched **$83.05, just five cents above its listing price**. By the close, it had recovered slightly to around **$88.30**, but the day still ended with a drop of more than 9%. Social media reacted the way it usually does after a sharp fall, with many people calling it a crash and doubting the project. 😟
---
## 🧪 Not a Failure, but a Test
The post behind this story makes a clear argument: **$ANT did not fail, it was being tested.** 🧠
According to this view, the move can be understood in three parts:
1. **💰 Early buyers took profit.** After a big Day 1 run, locking in gains is natural.
2. **🏛️ Institutions re-priced the token.** Larger players often reassess valuation once the first wave of hype settles.
3. **😰 Weak hands sold in fear.** Short-term holders with little conviction often exit on the first big dip.
This is a common pattern for new listings. The first day shows how high the price *can* go, while the second day shows where real demand *actually is*. 📚
---
## 🛡️ The $83 Floor: The Line in the Sand
The most important point in this story is the **$83 level**. 🎯
That was the listing price, and on Day 2 the token dipped to **$83.05**, almost exactly touching it, before buyers stepped in. The idea is simple:
- ✅ **If $83 holds:** buyers are defending the level, and confidence could return.
- ❌ **If $83 breaks:** fear could take control, and further downside becomes more likely.
Traders often treat a first major support level like this as a **line in the sand**. A successful defense can build confidence, while a clean break often triggers stop-losses and more selling. ⚠️ That makes the coming sessions critical for $ANT.
---
## 🤖 Other AI Tokens on the Watchlist: $TAO and $RENDER
The post also mentions two other AI-related tokens being watched alongside $ANT: **$TAO** and **$RENDER**. 👁️
Watching related tokens together is a smart habit because sector sentiment often moves as a group. If AI tokens as a whole are under pressure, a new listing can struggle to hold its ground no matter how strong the project is. 🔗
For reference, **TAOUSDT perpetual futures** were trading around **$177.07, down 6.19%**, which suggests that weakness was not limited to $ANT alone. 📉
---
## 🧠 What Should Traders Watch Next?
After a volatile start like this, many traders keep an eye on a few key things: 👀
1. **🎯 The $83 level:** the most important support to watch.
2. **📈 Volume on bounces:** strong volume on a rebound can show real buying interest.
3. **🤖 AI sector sentiment:** movements in $TAO and $RENDER can influence $ANT.
4. **🌍 Broader market mood:** crypto reacts strongly to wider market conditions.
5. **🛡️ Risk management:** new listings are highly volatile, so position sizing and stop-losses matter.
---
## 💬 The Big Question: Did You Hold or Panic Sell?
The post ends with a direct question to its readers: **"Do you still believe, or did you panic sell?"** 🤔
It's a fair question for every trader. Volatile days test your strategy and your emotions at the same time. Those who plan their entries, exits and risk in advance are far less likely to make decisions out of fear. 💪
---
## 📝 Final Thoughts
$ANT's first two days show the classic lifecycle of a new listing: an exciting spike, a sharp reality check and a key support level that now decides the next move. 🌪️ Whether $83 holds will shape the story from here.
It's worth remembering that this narrative comes from a promotional-style social post, so treat it as one opinion and not a guarantee of future performance. Stay patient, do your own research and never invest more than you can afford to lose. 💡
> ⚠️ *Disclaimer: This article is for informational purposes only and is not financial advice. Newly listed tokens are extremely volatile. Always do your own research before trading or investing.*
---
### 🏷️
**#ANT #CryptoNews #AITokens #BinanceSquare #AltcoinWatch**
#POSCOAndLGCNSCompleteReceivablesTokenizationPilotOnInjective #CryptoBilisAttackerMoves25000ETHToTornadoCash #HKBillProposesHK$100KFineForUnauthorizedCryptoTitles #StrategyReports$35BNetReserves
---
🐜 $ANT Day 2 Test: Panic, Profit-Taking and the Critical $83 Floor 📊
#AnthropicPlungesTowardIPOPriceonDay2
## 🔥 Introduction: From Hero to Doubt in 48 Hours
New token listings often follow the same emotional script. Day 1 brings excitement, and Day 2 brings reality. 🎢
**$ANT** just lived through both. On its first day, the token was celebrated like a hero. By the second day, many traders were calling it a crash. But a closer look at the numbers tells a more nuanced story. 👀
---
## 🚀 Day 1: Hype, FOMO and a Wild Ride
Here is how the first trading day unfolded:
- 🟢 **Listing price:** $83
- 🟢 **Opening price:** $111.50
- 🟢 **Day 1 high:** $115.10
- 🟢 **Day 1 close:** $97.17
The token opened **well above its listing price** and pushed to a high of **$115.10**, a gain of nearly **39% over the $83 listing level**. 🔥 Even after pulling back, it closed Day 1 at **$97.17, still about 17% above its listing price**.
Day 1 was driven by **hype, FOMO and flippers**. Fast-moving new listings attract traders looking for quick profits, and the excitement can push prices far above fair value in a short time. ⚡
---
## 📉 Day 2: The Reality Check
Then Day 2 arrived, and the mood changed quickly. 😬
- 🔻 **Day 2 low:** $83.05
- 🔻 **Day 2 close:** around $88.30
- 🔻 **Daily change:** down over **9%**
The token fell hard and touched **$83.05, just five cents above its listing price**. By the close, it had recovered slightly to around **$88.30**, but the day still ended with a drop of more than 9%. Social media reacted the way it usually does after a sharp fall, with many people calling it a crash and doubting the project. 😟
---
## 🧪 Not a Failure, but a Test
The post behind this story makes a clear argument: **$ANT did not fail, it was being tested.** 🧠
According to this view, the move can be understood in three parts:
1. **💰 Early buyers took profit.** After a big Day 1 run, locking in gains is natural.
2. **🏛️ Institutions re-priced the token.** Larger players often reassess valuation once the first wave of hype settles.
3. **😰 Weak hands sold in fear.** Short-term holders with little conviction often exit on the first big dip.
This is a common pattern for new listings. The first day shows how high the price *can* go, while the second day shows where real demand *actually is*. 📚
---
## 🛡️ The $83 Floor: The Line in the Sand
The most important point in this story is the **$83 level**. 🎯
That was the listing price, and on Day 2 the token dipped to **$83.05**, almost exactly touching it, before buyers stepped in. The idea is simple:
- ✅ **If $83 holds:** buyers are defending the level, and confidence could return.
- ❌ **If $83 breaks:** fear could take control, and further downside becomes more likely.
Traders often treat a first major support level like this as a **line in the sand**. A successful defense can build confidence, while a clean break often triggers stop-losses and more selling. ⚠️ That makes the coming sessions critical for $ANT.
---
## 🤖 Other AI Tokens on the Watchlist: $TAO and $RENDER
The post also mentions two other AI-related tokens being watched alongside $ANT: **$TAO** and **$RENDER**. 👁️
Watching related tokens together is a smart habit because sector sentiment often moves as a group. If AI tokens as a whole are under pressure, a new listing can struggle to hold its ground no matter how strong the project is. 🔗
For reference, **TAOUSDT perpetual futures** were trading around **$177.07, down 6.19%**, which suggests that weakness was not limited to $ANT alone. 📉
---
## 🧠 What Should Traders Watch Next?
After a volatile start like this, many traders keep an eye on a few key things: 👀
1. **🎯 The $83 level:** the most important support to watch.
2. **📈 Volume on bounces:** strong volume on a rebound can show real buying interest.
3. **🤖 AI sector sentiment:** movements in $TAO and $RENDER can influence $ANT.
4. **🌍 Broader market mood:** crypto reacts strongly to wider market conditions.
5. **🛡️ Risk management:** new listings are highly volatile, so position sizing and stop-losses matter.
---
## 💬 The Big Question: Did You Hold or Panic Sell?
The post ends with a direct question to its readers: **"Do you still believe, or did you panic sell?"** 🤔
It's a fair question for every trader. Volatile days test your strategy and your emotions at the same time. Those who plan their entries, exits and risk in advance are far less likely to make decisions out of fear. 💪
---
## 📝 Final Thoughts
$ANT's first two days show the classic lifecycle of a new listing: an exciting spike, a sharp reality check and a key support level that now decides the next move. 🌪️ Whether $83 holds will shape the story from here.
It's worth remembering that this narrative comes from a promotional-style social post, so treat it as one opinion and not a guarantee of future performance. Stay patient, do your own research and never invest more than you can afford to lose. 💡
> ⚠️ *Disclaimer: This article is for informational purposes only and is not financial advice. Newly listed tokens are extremely volatile. Always do your own research before trading or investing.*
---
### 🏷️
**#ANT #CryptoNews #AITokens #BinanceSquare #AltcoinWatch**
#POSCOAndLGCNSCompleteReceivablesTokenizationPilotOnInjective #CryptoBilisAttackerMoves25000ETHToTornadoCash #HKBillProposesHK$100KFineForUnauthorizedCryptoTitles #StrategyReports$35BNetReserves
---
## 🔥 Introduction: From Hero to Doubt in 48 Hours
New token listings often follow the same emotional script. Day 1 brings excitement, and Day 2 brings reality. 🎢
**$ANT** just lived through both. On its first day, the token was celebrated like a hero. By the second day, many traders were calling it a crash. But a closer look at the numbers tells a more nuanced story. 👀
---
## 🚀 Day 1: Hype, FOMO and a Wild Ride
Here is how the first trading day unfolded:
- 🟢 **Listing price:** $83
- 🟢 **Opening price:** $111.50
- 🟢 **Day 1 high:** $115.10
- 🟢 **Day 1 close:** $97.17
The token opened **well above its listing price** and pushed to a high of **$115.10**, a gain of nearly **39% over the $83 listing level**. 🔥 Even after pulling back, it closed Day 1 at **$97.17, still about 17% above its listing price**.
Day 1 was driven by **hype, FOMO and flippers**. Fast-moving new listings attract traders looking for quick profits, and the excitement can push prices far above fair value in a short time. ⚡
---
## 📉 Day 2: The Reality Check
Then Day 2 arrived, and the mood changed quickly. 😬
- 🔻 **Day 2 low:** $83.05
- 🔻 **Day 2 close:** around $88.30
- 🔻 **Daily change:** down over **9%**
The token fell hard and touched **$83.05, just five cents above its listing price**. By the close, it had recovered slightly to around **$88.30**, but the day still ended with a drop of more than 9%. Social media reacted the way it usually does after a sharp fall, with many people calling it a crash and doubting the project. 😟
---
## 🧪 Not a Failure, but a Test
The post behind this story makes a clear argument: **$ANT did not fail, it was being tested.** 🧠
According to this view, the move can be understood in three parts:
1. **💰 Early buyers took profit.** After a big Day 1 run, locking in gains is natural.
2. **🏛️ Institutions re-priced the token.** Larger players often reassess valuation once the first wave of hype settles.
3. **😰 Weak hands sold in fear.** Short-term holders with little conviction often exit on the first big dip.
This is a common pattern for new listings. The first day shows how high the price *can* go, while the second day shows where real demand *actually is*. 📚
---
## 🛡️ The $83 Floor: The Line in the Sand
The most important point in this story is the **$83 level**. 🎯
That was the listing price, and on Day 2 the token dipped to **$83.05**, almost exactly touching it, before buyers stepped in. The idea is simple:
- ✅ **If $83 holds:** buyers are defending the level, and confidence could return.
- ❌ **If $83 breaks:** fear could take control, and further downside becomes more likely.
Traders often treat a first major support level like this as a **line in the sand**. A successful defense can build confidence, while a clean break often triggers stop-losses and more selling. ⚠️ That makes the coming sessions critical for $ANT.
---
## 🤖 Other AI Tokens on the Watchlist: $TAO and $RENDER
The post also mentions two other AI-related tokens being watched alongside $ANT: **$TAO** and **$RENDER**. 👁️
Watching related tokens together is a smart habit because sector sentiment often moves as a group. If AI tokens as a whole are under pressure, a new listing can struggle to hold its ground no matter how strong the project is. 🔗
For reference, **TAOUSDT perpetual futures** were trading around **$177.07, down 6.19%**, which suggests that weakness was not limited to $ANT alone. 📉
---
## 🧠 What Should Traders Watch Next?
After a volatile start like this, many traders keep an eye on a few key things: 👀
1. **🎯 The $83 level:** the most important support to watch.
2. **📈 Volume on bounces:** strong volume on a rebound can show real buying interest.
3. **🤖 AI sector sentiment:** movements in $TAO and $RENDER can influence $ANT.
4. **🌍 Broader market mood:** crypto reacts strongly to wider market conditions.
5. **🛡️ Risk management:** new listings are highly volatile, so position sizing and stop-losses matter.
---
## 💬 The Big Question: Did You Hold or Panic Sell?
The post ends with a direct question to its readers: **"Do you still believe, or did you panic sell?"** 🤔
It's a fair question for every trader. Volatile days test your strategy and your emotions at the same time. Those who plan their entries, exits and risk in advance are far less likely to make decisions out of fear. 💪
---
## 📝 Final Thoughts
$ANT's first two days show the classic lifecycle of a new listing: an exciting spike, a sharp reality check and a key support level that now decides the next move. 🌪️ Whether $83 holds will shape the story from here.
It's worth remembering that this narrative comes from a promotional-style social post, so treat it as one opinion and not a guarantee of future performance. Stay patient, do your own research and never invest more than you can afford to lose. 💡
> ⚠️ *Disclaimer: This article is for informational purposes only and is not financial advice. Newly listed tokens are extremely volatile. Always do your own research before trading or investing.*
---
### 🏷️
**#ANT #CryptoNews #AITokens #BinanceSquare #AltcoinWatch**
#POSCOAndLGCNSCompleteReceivablesTokenizationPilotOnInjective #CryptoBilisAttackerMoves25000ETHToTornadoCash #HKBillProposesHK$100KFineForUnauthorizedCryptoTitles #StrategyReports$35BNetReserves
---
260
Log in to explore more content
Join global crypto users on Binance Square
⚡️ Get latest and useful information about crypto.
💬 Trusted by the world’s largest crypto exchange.
👍 Discover real insights from verified creators.
Email / Phone number
Trending Topics
1
#CanBTCReboundAfterFallingBelow60K?
272,929 views
1,292 Discussing
2
#GlobalStocksFaceLongestLosingStreakSince2023
92,503 views
931 Discussing
3
#AnthropicPlungesTowardIPOPriceonDay2
45,433 views
490 Discussing
4
#TwentyOneCapitalAdds172.25BTC
876 views
72 Discussing
5
#HKBillWouldExcludeTokenizedDepositsFromVirtualAssets
232 views
11 Discussing
6
#BNBDropsBelow540USDTWith8.46%DailyDecline
20,454 views
182 Discussing
7
#HKBillProposesHK$100KFineForUnauthorizedCryptoTitles
702 views
12 Discussing
8
#BitMineFaces$10.1BUnrealizedETHLoss
1,554 views
15 Discussing
9
#StrategyReports$35BNetReserves
1,098 views
15 Discussing
10
#MorganStanleyEndsAnthropicStockSupportAfterOneDay
9,319 views
119 Discussing