

#rwusd
rwusd
214,532 views
470 Discussing
Hot
Latest


$RWUSD: RWUSD: Balancing Entry Quality and Chasing Risk
The chart shows hourly direction flat while volume sits above baseline. This combination raises a practical trade‑off: should a trader enter now to capture a potential move, or wait for a clearer price structure?
**The practical trade‑off**
When volume spikes without a decisive price direction, the market may be testing support or resistance. Entering on the first sign of activity can improve entry quality if the move confirms, but it also increases the chance of chasing a false signal. Conversely, waiting for a confirming candle may improve confidence but could sacrifice a tighter entry price.
**What changes when the assumption fails**
Imagine a thought experiment where the price briefly breaks the recent support level 0.9995 but quickly reverts. If a trader entered on the volume surge, the stop might need to be placed farther away to avoid being hit by normal volatility, reducing risk‑reward. If the trader waited for the price to respect 0.9995 and show a sustained bounce, the stop could be tighter, but the entry price would be less favorable.
**A decision checklist**
- Does the price respect a key level such as 0.9995 or 0.9999?
- Is the volume still above baseline after the candle closes?
- Can a stop be set within a reasonable distance, for example using the recent 0.000144534 as a guide?
- Is the risk of a larger stop justified by the potential upside?
If the answer to the first two questions is no, the safer path is to wait for clearer structure before reassessing risk. This approach keeps entry quality high while avoiding the temptation to chase a volatile signal. 🙂
Probabilistic market research, not a recommendation or guaranteed return.
Would you wait for clearer structure or reassess the risk first?
#RWUSD #RiskManagement
$RWUSD : RWUSD: Balancing Entry Quality and Chasing Risk
The chart shows hourly direction flat while volume sits above baseline. This combination raises a practical trade‑off: should a trader enter now to capture a potential move, or wait for a clearer price structure?
**The practical trade‑off**
When volume spikes without a decisive price direction, the market may be testing support or resistance. Entering on the first sign of activity can improve entry quality if the move confirms, but it also increases the chance of chasing a false signal. Conversely, waiting for a confirming candle may improve confidence but could sacrifice a tighter entry price.
**What changes when the assumption fails**
Imagine a thought experiment where the price briefly breaks the recent support level 0.9995 but quickly reverts. If a trader entered on the volume surge, the stop might need to be placed farther away to avoid being hit by normal volatility, reducing risk‑reward. If the trader waited for the price to respect 0.9995 and show a sustained bounce, the stop could be tighter, but the entry price would be less favorable.
**A decision checklist**
- Does the price respect a key level such as 0.9995 or 0.9999?
- Is the volume still above baseline after the candle closes?
- Can a stop be set within a reasonable distance, for example using the recent 0.000144534 as a guide?
- Is the risk of a larger stop justified by the potential upside?
If the answer to the first two questions is no, the safer path is to wait for clearer structure before reassessing risk. This approach keeps entry quality high while avoiding the temptation to chase a volatile signal. 🙂
Probabilistic market research, not a recommendation or guaranteed return.
Would you wait for clearer structure or reassess the risk first?
#RWUSD #RiskManagement
26

·
--
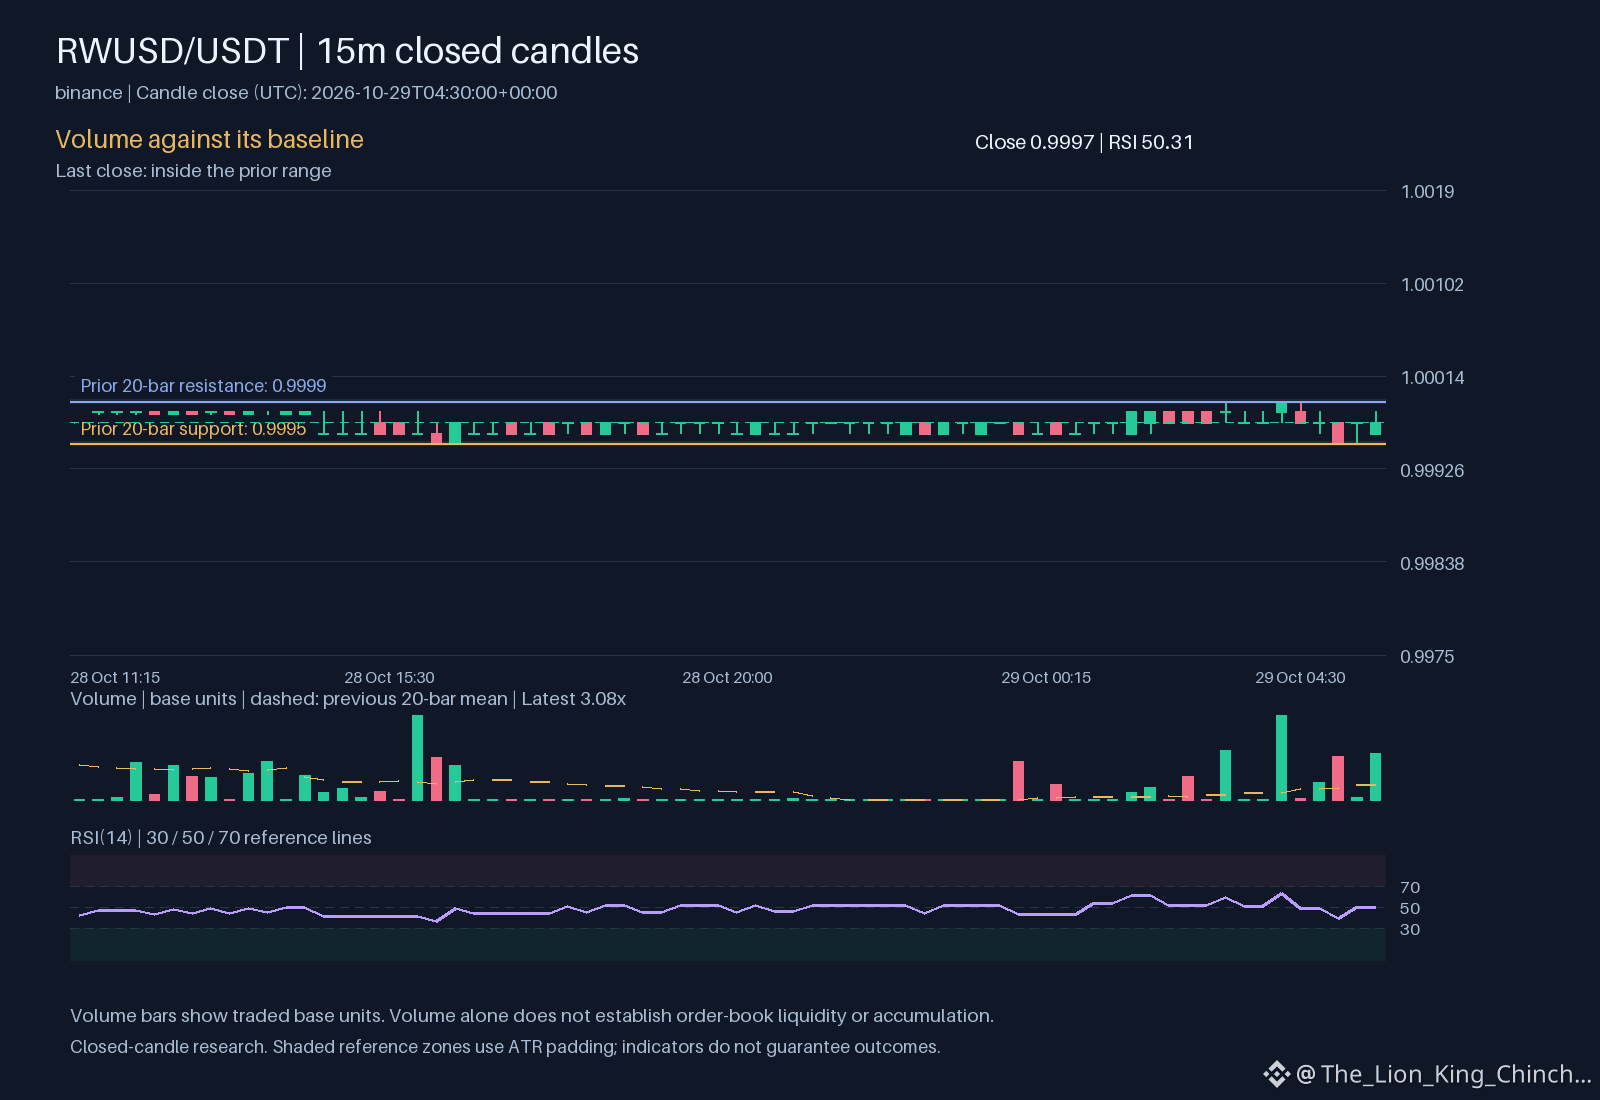
Sub-penny consolidation defines $RWUSD at 0.9997 with a 0.01 percent 24-hour change and 11.77 million dollars in volume.
Price action remains compressed inside the recent 0.9992 to 1.0001 range alongside minimal hourly momentum.
As a conditional watch scenario, a sustained push past the 1.0001 high signals bullish continuation, whereas a dip under the 0.9992 low invalidates the setup.
Will buyers reclaim the upper boundary first, or will a breakdown toward the lower bound trigger invalidation?
Tap $RWUSD for the live chart. #RWUSD #BinanceSquare
20

·
--
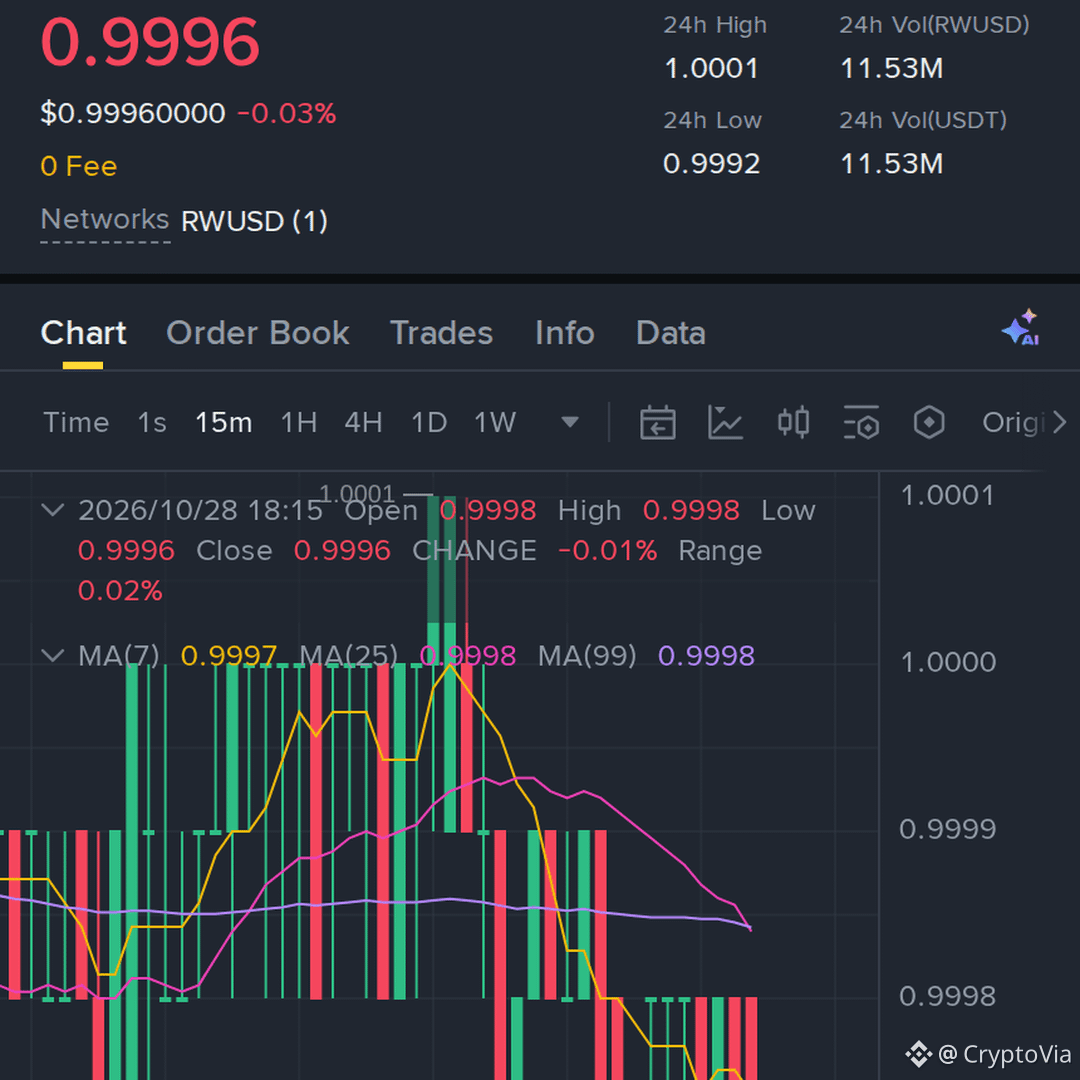
$RWUSD holds at $0.9997 with $11.24M daily volume on quiet trade.
The latest hourly close ticks up to $0.9998, while volume sits at 0.59x of the 23-hour average. This signals ongoing consolidation rather than heavy distribution.
Bullish scenario: A sustained move back above the 23-hour high of $1.0001 could invite renewed buyer interest.
Bearish risk: Slipping under the 23-hour low of $0.9992 increases downside pressure.
Will a reclaim of the upper range boundary confirm continuation, or does dropping below the lower threshold invalidate the current setup on your chart?
Tap $RWUSD for the live chart. #RWUSD #BinanceSquare
1


·
--
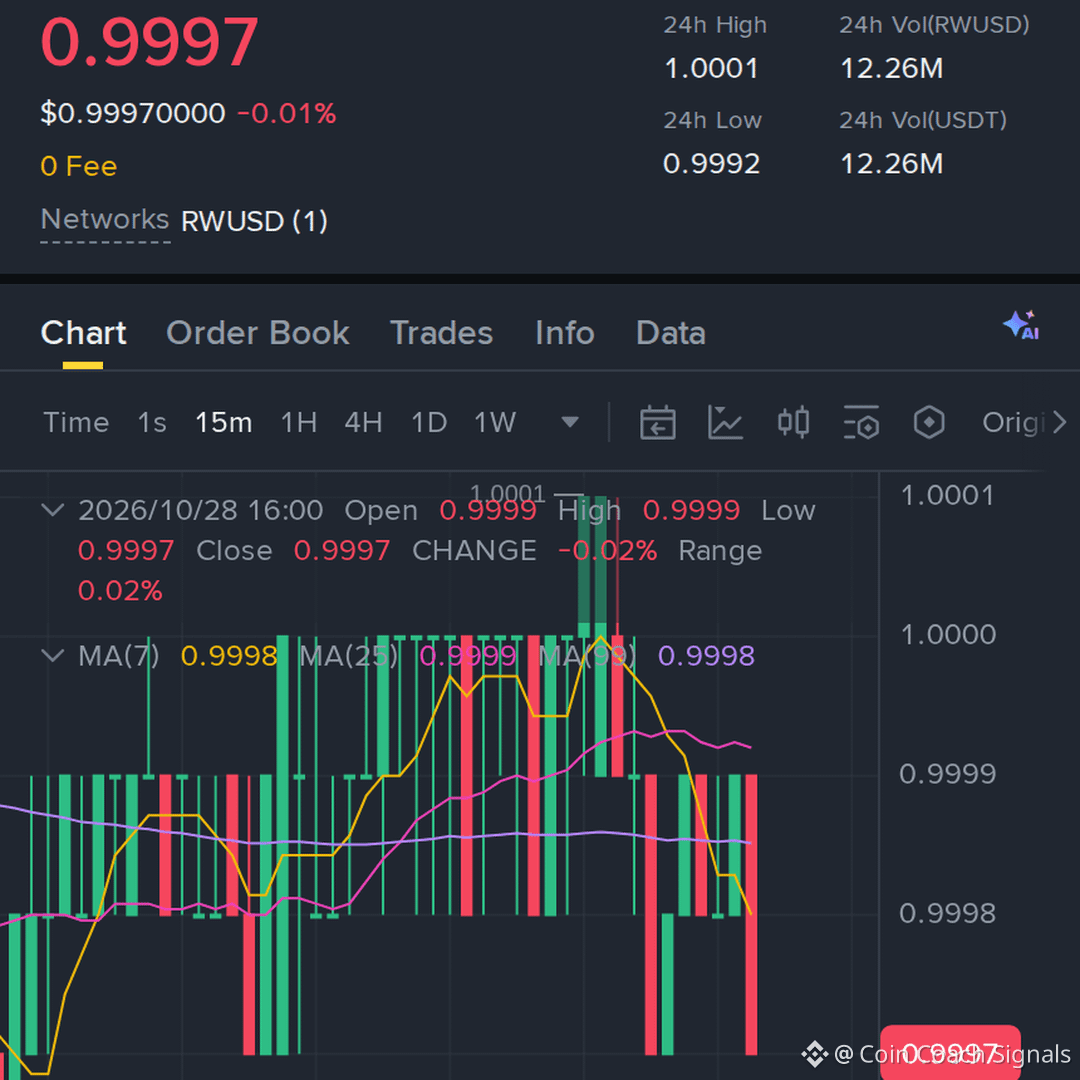
Professional risk review for $RWUSD. Last price: $0.9999, 24h range: $0.9992–$1.0001. Volume sits at $11M.
Defense Floor: $0.9990. Resistance: $1.0005.
Capital preservation dictates process over prediction. Never deploy a full stack at once. Utilize a 3-tranche DCA strategy into support zones rather than chasing minor fluctuations. Define your invalidation point before entering any trade to protect your capital.
$RWUSD #BinanceSquare #CryptoTrading #RiskManagement #RWUSD
Professional risk review for $RWUSD . Last price: $0.9999, 24h range: $0.9992–$1.0001. Volume sits at $11M.
Defense Floor: $0.9990. Resistance: $1.0005.
Capital preservation dictates process over prediction. Never deploy a full stack at once. Utilize a 3-tranche DCA strategy into support zones rather than chasing minor fluctuations. Define your invalidation point before entering any trade to protect your capital.
$RWUSD #BinanceSquare #CryptoTrading #RiskManagement #RWUSD
$RWUSD: Volume Clues and Price Logic
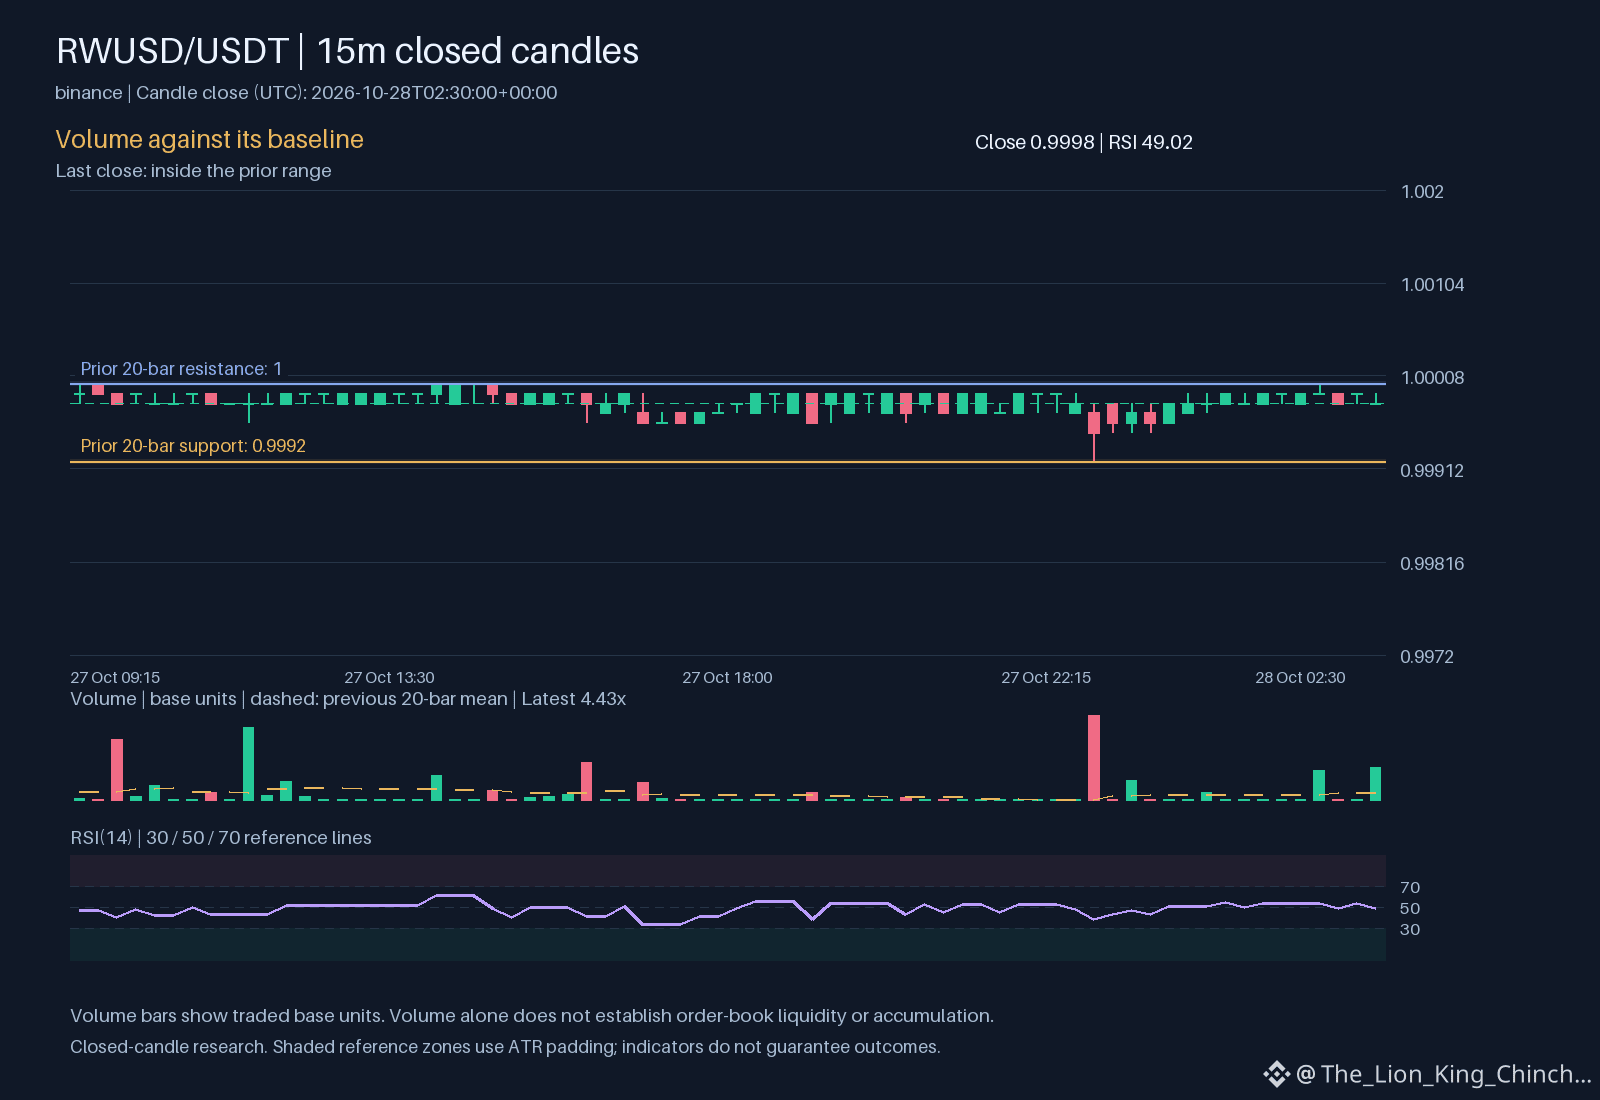
What does it mean when a price drifts lower while trading activity suddenly climbs above its usual baseline? This is the core question facing $RWUSD as it moves within its recorded range while exhibiting an hourly downward direction. Usually, higher activity suggests conviction, but when it pairs with a price decline, the logic becomes more complex.
One potential clue is that the increased volume represents aggressive selling pressure. In this scenario, the market is actively absorbing supply at the current price of 0.9998, yet the sellers are winning the immediate struggle. This interpretation suggests that the downward move has actual weight behind it rather than being a low-liquidity fluctuation. The RSI at 49.016 provides context for this momentum, but the volume itself is the primary evidence of active participation.
Alternatively, this surge could represent a cluster of buy orders hidden beneath the surface. If participants are using this dip to build positions, the high volume could signal a local floor. This thought experiment assumes that for every seller moving the price down, a patient buyer is providing the liquidity to keep the asset inside its range. We see the MACD at 1.52075e-05 and the signal line at 8.4554e-06 reflecting the current trend, but these are lagging results of the trade activity we see now.
To reassess these views, look for a shift in how the price reacts to the resistance at 1. A clean close above that level on high volume would weaken the bearish reading. Conversely, if the price continues to slide toward support at 0.9992 without any deceleration in selling volume, the idea of a hidden floor would be invalidated. Patience is the only way to distinguish a true trend from a temporary spike. 📉
Probabilistic market research, not a recommendation or guaranteed return.
What would convince you: a clean close or a patient retest?
#RWUSD
$RWUSD : Volume Clues and Price Logic
What does it mean when a price drifts lower while trading activity suddenly climbs above its usual baseline? This is the core question facing $RWUSD as it moves within its recorded range while exhibiting an hourly downward direction. Usually, higher activity suggests conviction, but when it pairs with a price decline, the logic becomes more complex.
One potential clue is that the increased volume represents aggressive selling pressure. In this scenario, the market is actively absorbing supply at the current price of 0.9998, yet the sellers are winning the immediate struggle. This interpretation suggests that the downward move has actual weight behind it rather than being a low-liquidity fluctuation. The RSI at 49.016 provides context for this momentum, but the volume itself is the primary evidence of active participation.
Alternatively, this surge could represent a cluster of buy orders hidden beneath the surface. If participants are using this dip to build positions, the high volume could signal a local floor. This thought experiment assumes that for every seller moving the price down, a patient buyer is providing the liquidity to keep the asset inside its range. We see the MACD at 1.52075e-05 and the signal line at 8.4554e-06 reflecting the current trend, but these are lagging results of the trade activity we see now.
To reassess these views, look for a shift in how the price reacts to the resistance at 1. A clean close above that level on high volume would weaken the bearish reading. Conversely, if the price continues to slide toward support at 0.9992 without any deceleration in selling volume, the idea of a hidden floor would be invalidated. Patience is the only way to distinguish a true trend from a temporary spike. 📉
Probabilistic market research, not a recommendation or guaranteed return.
What would convince you: a clean close or a patient retest?
#RWUSD
103

·
--
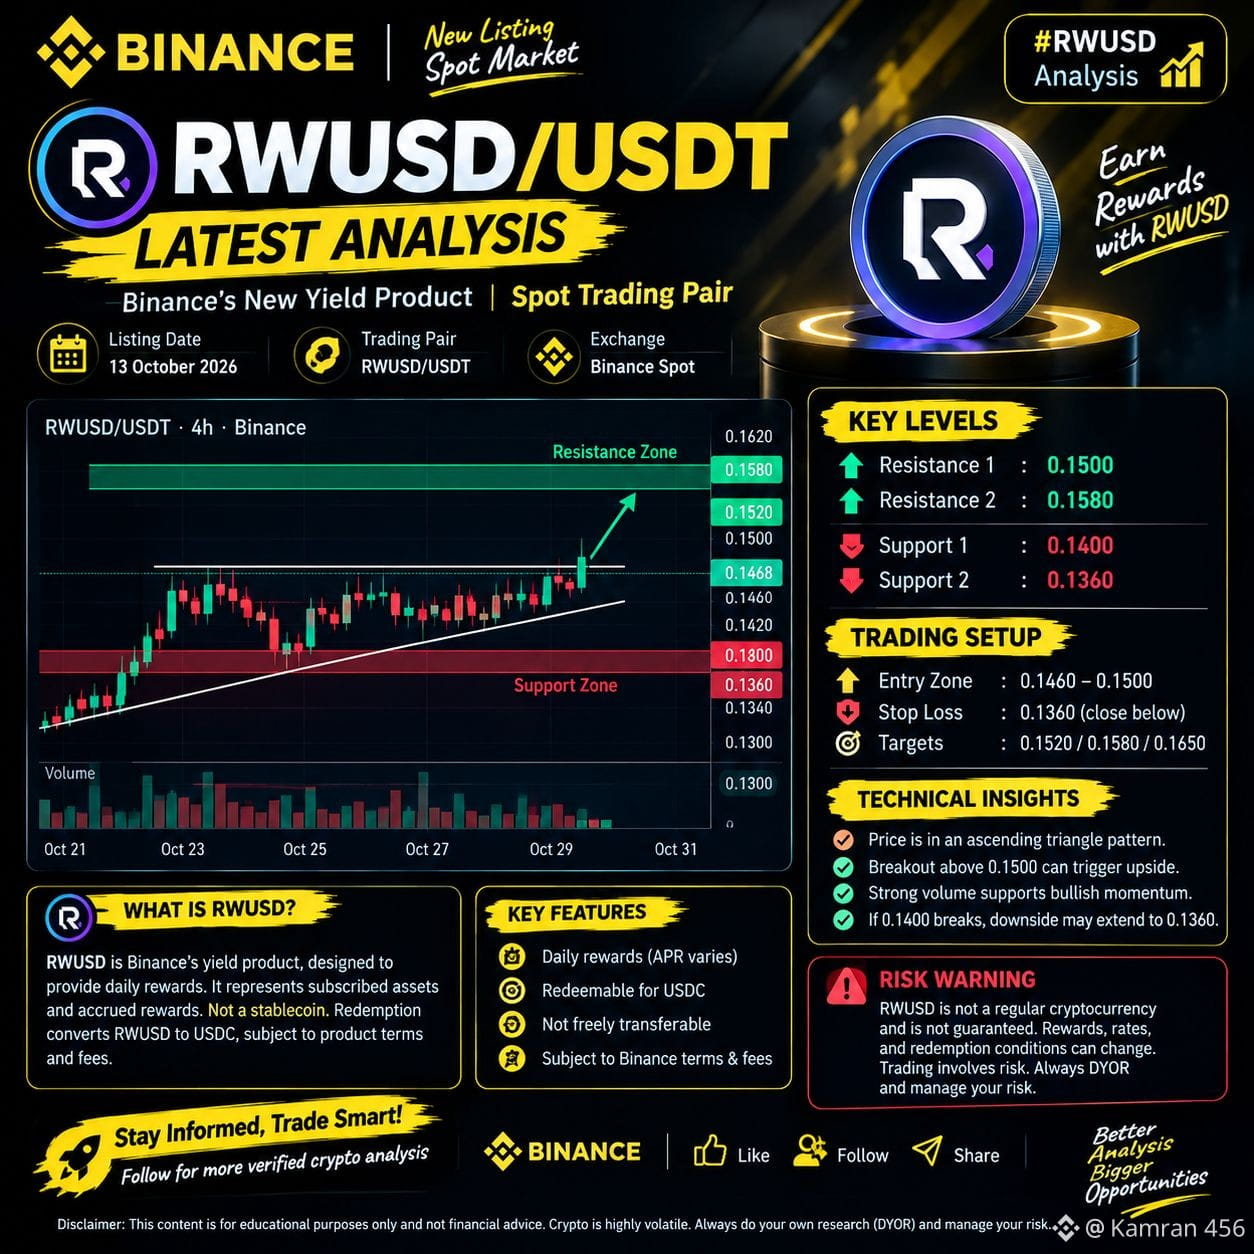
$RWUSD A New Crypto Coin or Binance Yield Product? 🤔
Many crypto users may confuse RWUSD with a regular tradable coin. But before trading, it's important to understand what RWUSD actually is and how its rewards and redemption work.
📊 Would you use a Binance yield product, or do you prefer regular Spot trading?
👇 Share your opinion in the comments!
⚠️ Always verify the latest official Binance product terms before investing. This post is for educational purposes only, not financial advice.
#RWUSD #Binance #CryptoEducation #CryptoCommunity #USDT
{spot}(RWUSDUSDT)
$RWUSD A New Crypto Coin or Binance Yield Product? 🤔
Many crypto users may confuse RWUSD with a regular tradable coin. But before trading, it's important to understand what RWUSD actually is and how its rewards and redemption work.
📊 Would you use a Binance yield product, or do you prefer regular Spot trading?
👇 Share your opinion in the comments!
⚠️ Always verify the latest official Binance product terms before investing. This post is for educational purposes only, not financial advice.
#RWUSD #Binance #CryptoEducation #CryptoCommunity #USDT
86

·
--
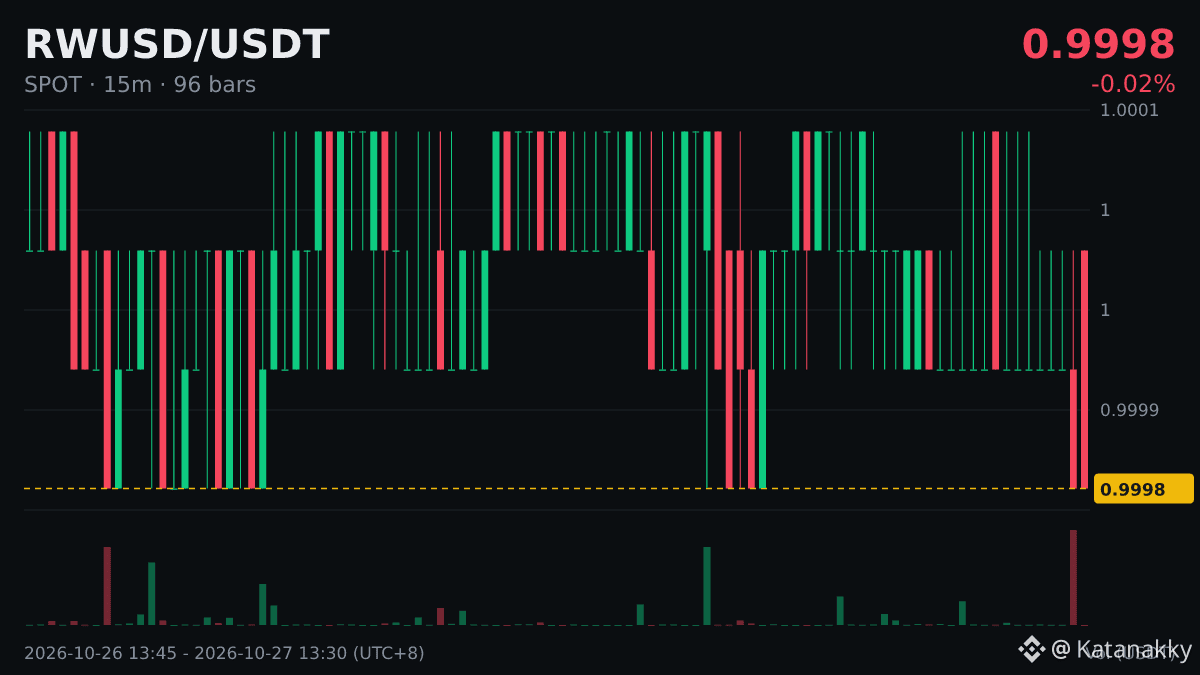
Volume surged 545.3x at $RWUSD 5 minutes, while the price barely moved. The current price is 1.
The moment of a volume spike is often when bulls and bears are most intensely handing off control. Afterward, the price often picks a direction.
I use the range before the unusual move as a reference: it only counts if the price stays outside that range.
#RWUSD
I can be wrong too—don't take this as advice.
20

$RWUSD |5-minute trading volume surged 545.3x|Price remained almost unchanged
Before looking at your positions, first understand trading volume.
When trading volume surges, order-book spreads and slippage often increase too, so chasing the market with a market order may cost you more.
When volume and price move in the same direction, the trend is easier to interpret. When they diverge, pay closer attention—for example, when the price hits a new high but trading volume keeps falling.
Don’t chase an order at the most volatile moment. Wait for the candlestick to close before taking another look.
#RWUSD
Market conditions can change in an instant. Make your own decisions.

·
--
The $RWUSD 5-minute trading volume was approximately $1.14 million, 545.3 times the previous average; the price was almost unchanged over the same period.
Let’s break this number down.
Trading volumes in futures and spot markets often differ considerably. Futures volume includes a lot of high-frequency trading, so a surge in volume doesn’t mean exactly the same thing in both markets.
Learning to read indicators isn’t hard. The hard part is sticking to your plan when the market is at its most volatile.
#RWUSD

·
--
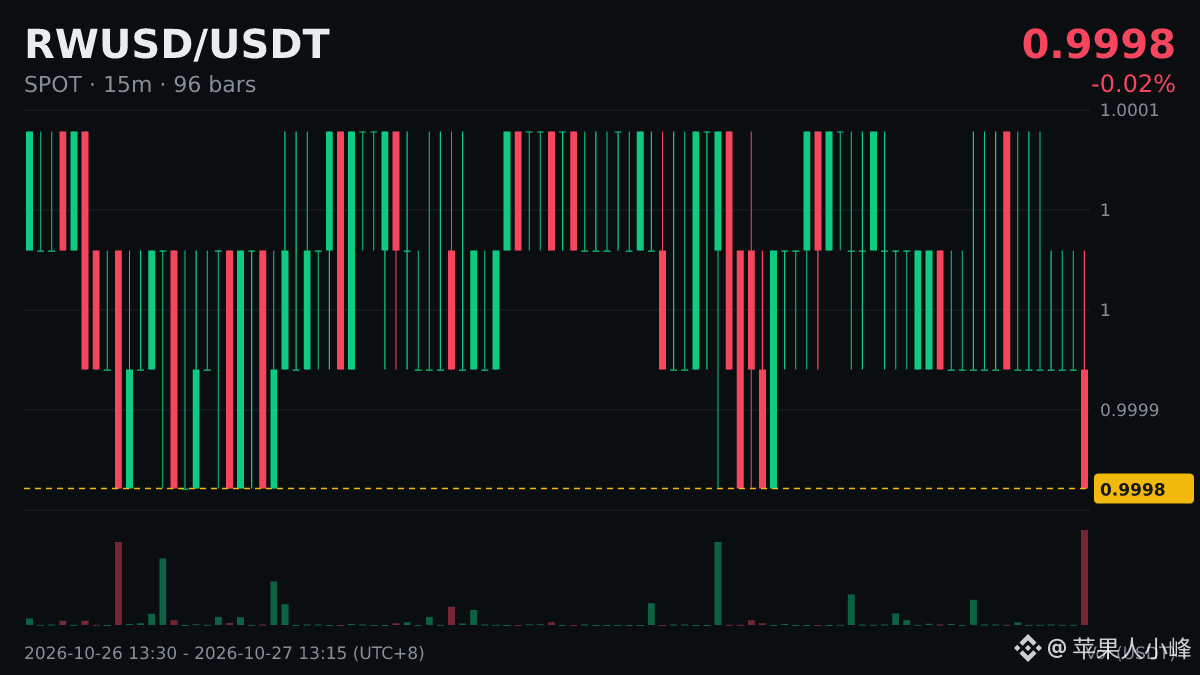
Technical note|$RWUSD |5-minute volume surged 545.3x|Price nearly unchanged
Definition: Volume should be read alongside candlesticks: the closing price and the length of the upper and lower wicks often tell you more than the volume alone.
A common way to read it: After a volume spike, if trading quickly subsides, the spike is often just a brief pulse. Sustained elevated volume is more noteworthy.
The same reading can mean completely different things in different market conditions, so don’t apply a rule of thumb blindly.
#RWUSD
3
·
--
$RWUSD |5-minute trading volume up 545.3x|Price almost unchanged
How should you interpret a surge in trading volume? When volume spikes, the bid-ask spread and slippage often widen, making market orders more costly to enter or exit a position.
A rise on heavy volume is often seen as being supported by buying demand, while a fall on heavy volume is often interpreted as genuine selling pressure—but these are just rules of thumb.
All indicators describe price movements that have already happened; the market can just as easily move in the opposite direction.
#RWUSD
25

·
--
$RWUSD 5-minute volume ratio: 545.3, price basically unchanged
A surge in volume of this magnitude is uncommon; most likely, some news is driving it.
Current price: 0.9998. A surge in volume without a price increase often means turnover is picking up, while the market waits to choose a direction. Which indicators do you usually watch?
#RWUSD
A surge in volume of this magnitude is uncommon; most likely, some news is driving it.
Current price: 0.9998. A surge in volume without a price increase often means turnover is picking up, while the market waits to choose a direction. Which indicators do you usually watch?
#RWUSD
64

·
--
$RWUSD 5-minute volume suddenly picked up: 545.3 times the average, while the price was almost flat.
Rising volume tends to indicate buying pressure, falling volume tends to indicate selling pressure, and flat trading on high volume often signals strong disagreement.
#RWUSD
Just my personal observation; this is not investment advice.
Rising volume tends to indicate buying pressure, falling volume tends to indicate selling pressure, and flat trading on high volume often signals strong disagreement.
#RWUSD
Just my personal observation; this is not investment advice.
7

·
--
🟢 RWUSD/USDT — LONG cautiously
💰 Entry price: 1.0001
🎯 First target: 1.0010 🎯 Second target: 1.0020 🎯 Third target: 1.0030 🛑 Stop loss: 0.9985
📊 Signal: Bullish MACD crossover on the 30-minute timeframe, with the MACD line above the signal line, indicating improving momentum.
⚠️ The price is very close to 1 USDT, and the coin may be pegged to a fixed price. So, don't rely on the crossover alone; check trading liquidity and spreads before entering. Targets are estimates.
❤️ Your support makes a difference to me 🔥 Look for opportunities
$RWUSD #RWUSD #Trading #Crypto
39

·
--
$RWUSD
RWUSD is leading the charge, trading at 1.00, +0.0%. Volume has picked up moderately, the daily candle closed nicely, and the short-term trend is looking positive. Market opportunities come every day, but you only have one pot of capital. #RWUSD #Market Analysis
$RWUSD
RWUSD is leading the charge, trading at 1.00, +0.0%. Volume has picked up moderately, the daily candle closed nicely, and the short-term trend is looking positive. Market opportunities come every day, but you only have one pot of capital. #RWUSD #Market Analysis
RWUSD is leading the charge, trading at 1.00, +0.0%. Volume has picked up moderately, the daily candle closed nicely, and the short-term trend is looking positive. Market opportunities come every day, but you only have one pot of capital. #RWUSD #Market Analysis
4

·
--
=🚀 $RWUSD is turning heads in the stablecoin arena!
After a sharp 12% surge last week, $RWUSD is now trading at $1.02, outpacing its peers like $USDC and $USDT. The spike aligns with a surge in trading volume—over 1.8 B USD on Binance, up 30% month‑over‑month.
📈 Why the jump?
$RWUSD’s backing comes from a diversified Real‑World Asset (RWA) basket: commercial real estate, corporate bonds, and even a slice of high‑yield crypto collateral. The RWA tokenization framework, unveiled in the latest RWA Protocol whitepaper, adds a layer of transparency that traders love. The protocol’s recent partnership with a leading asset manager has already injected $200 M of liquid capital into the pool.
🏢 Institutional buzz
Major institutional players are taking notice. A prominent asset‑management firm announced a $50 M allocation to $RWUSD, citing its robust risk‑management model and the potential for yield enhancement. Binance’s own RWA product suite now supports $RWUSD, making it easier for institutional clients to add exposure without leaving the platform.
💬 Community pulse
Social chatter is electric. The #RWUSD hashtag trended on Twitter for 48 hours, with community members praising its “stable yet yield‑generating” nature. A new community‑run DAO proposal is up for a vote, aiming to add a new RWA category—commercial paper—into the basket. The community’s engagement rate has jumped 25% over the past month.
🔮 Outlook
With the RWA ecosystem expanding and institutional adoption accelerating, $RWUSD looks set to stay above the $1 peg while delivering competitive yields. Keep an eye on the next quarterly audit; a transparent report could solidify trust and push the price higher.
Stay tuned for more updates and let us know what you think in the comments!
=🚀 $RWUSD is turning heads in the stablecoin arena!
After a sharp 12% surge last week, $RWUSD is now trading at $1.02, outpacing its peers like $USDC and $USDT. The spike aligns with a surge in trading volume—over 1.8 B USD on Binance, up 30% month‑over‑month.
📈 Why the jump?
$RWUSD ’s backing comes from a diversified Real‑World Asset (RWA) basket: commercial real estate, corporate bonds, and even a slice of high‑yield crypto collateral. The RWA tokenization framework, unveiled in the latest RWA Protocol whitepaper, adds a layer of transparency that traders love. The protocol’s recent partnership with a leading asset manager has already injected $200 M of liquid capital into the pool.
🏢 Institutional buzz
Major institutional players are taking notice. A prominent asset‑management firm announced a $50 M allocation to $RWUSD , citing its robust risk‑management model and the potential for yield enhancement. Binance’s own RWA product suite now supports $RWUSD , making it easier for institutional clients to add exposure without leaving the platform.
💬 Community pulse
Social chatter is electric. The #RWUSD hashtag trended on Twitter for 48 hours, with community members praising its “stable yet yield‑generating” nature. A new community‑run DAO proposal is up for a vote, aiming to add a new RWA category—commercial paper—into the basket. The community’s engagement rate has jumped 25% over the past month.
🔮 Outlook
With the RWA ecosystem expanding and institutional adoption accelerating, $RWUSD looks set to stay above the $1 peg while delivering competitive yields. Keep an eye on the next quarterly audit; a transparent report could solidify trust and push the price higher.
Stay tuned for more updates and let us know what you think in the comments!
119

·
--
Quiet stability defines $RWUSD at $1 with an $11.53M volume.
The asset is hovering near its 23-hour high of 1 despite a fractional 24h gain of +0.03% and very thin recent volume.
A bullish confirmation scenario requires a sustained hourly close above the 1 high on rising volume. Conversely, a drop below the preceding range low of 0.9994 serves as an invalidation signal highlighting downside risk.
Will a confirmed breakout past the 1 high materialize, or will weak volume push prices back toward the 0.9994 low?
Tap $RWUSD for the live chart. #RWUSD #BinanceSquare
2

·
--
$RWUSD +0.02% | $BFUSD +0.01% | $U +0.00%
#RWUSD holds steady at $1.00, ticking up just +0.02% on $11.5 M of volume.
#BFUSD barely nudged, price at $0.9999 with a +0.01% rise backed by $11.8 M traded.
#U sits flat at $1.00, unchanged (+0.00%) despite the highest flow in the set at $29.6 M.
📌 The modest price moves contrasted with relatively strong volumes suggest liquidity is still probing the peg rather than driving a breakout.
#Write2Earn #Binance
2
Log in to explore more content
Join global crypto users on Binance Square
⚡️ Get latest and useful information about crypto.
💬 Trusted by the world’s largest crypto exchange.
👍 Discover real insights from verified creators.
Email / Phone number
Trending Topics
1
#CanMicrosoftDeliverOnAI
596,927 views
3,887 Discussing
2
#CanGoogleDefindItsCore
366,101 views
2,756 Discussing
3
#FedWatch
16.1M views
37,059 Discussing
4
#BitcoinCore32.1RaisesPeerConnectionLimit
0 views
5 Discussing
5
#EarningsSeason
6.1M views
30,148 Discussing
6
#BitcoinCoreIdentifiesThreeVulnerabilities
9,312 views
190 Discussing
7
#RippleExpects$900MAnnualizedProductRevenueRunRate
349 views
6 Discussing
8
#GoogleToPreviewCryptoCustodySecuritySystem
2,390 views
77 Discussing
9
#FedToBeginShrinkingRateSettingCalendarIn2027
3,487 views
51 Discussing
10
#StrategyShareholdersApproveDailyDividends
3,506 views
69 Discussing