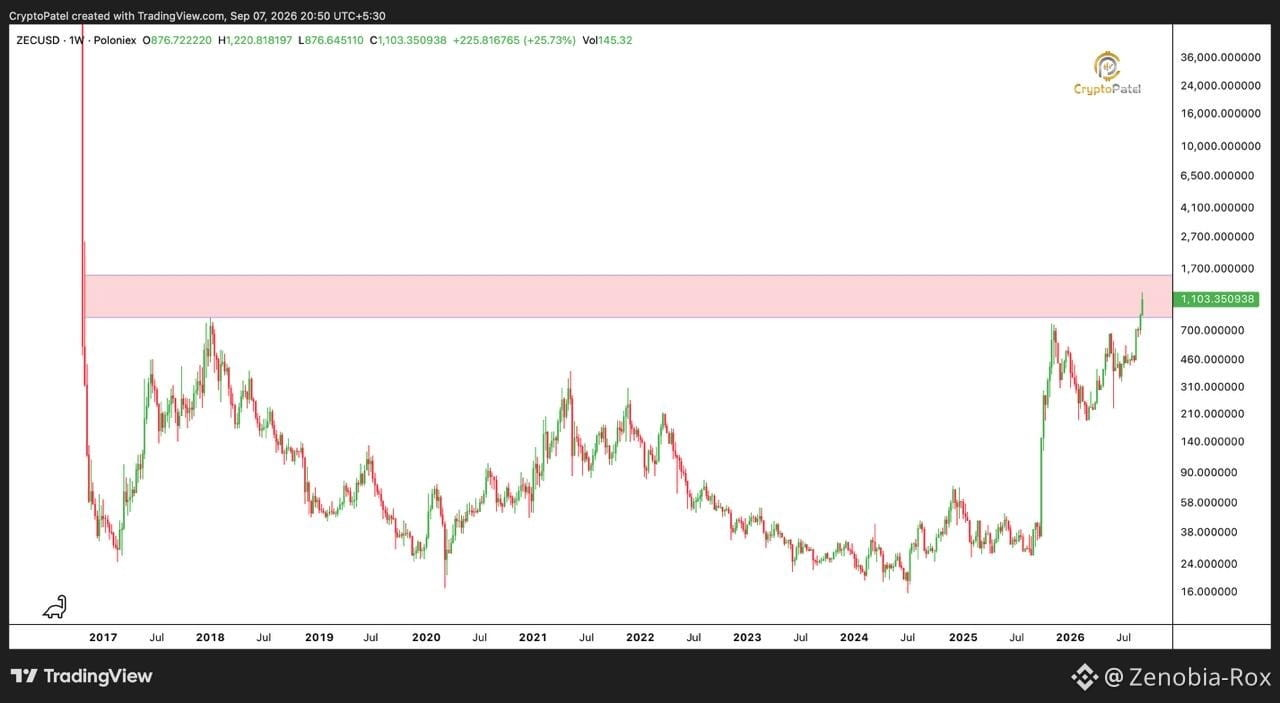

$ZEC WEEKLY: MAJOR RESISTANCE TEST IS HERE
ZEC/USD is showing a powerful weekly breakout, but the most important part of the chart is not the pump — it’s what happens inside the major resistance zone.
The weekly candle is currently around $1,103, with a visible +25.73% move. Price has climbed dramatically from the long accumulation range and is now testing an overhead supply area that has been marked on the chart.
📊 Technical Breakdown
Resistance: 🔴 ~$800–$1,600
ZEC is already trading inside this zone. A strong weekly close above the zone would be the confirmation bulls need. $ZEC
Immediate support: 🟢 ~$700
This is the key breakout region visible below the current price. A successful retest here would make the bullish structure much healthier.
Next visible upside levels:
🎯 TP1: $1,700
🎯 TP2: $2,700
🎯 TP3: $4,100
These are chart-visible price levels, not guaranteed targets.
🧠 Trade Plan
I would not chase ZEC at $1,103 while price is sitting inside resistance.
A more attractive setup would be a pullback toward the $700–$800 area, followed by a confirmed bullish reaction.
Invalidation: A decisive weekly loss of the ~$700 area would weaken the breakout thesis.
Risk/Reward: Not reliably calculable at the current price because there is no confirmed entry or tight invalidation shown on the chart. Waiting for confirmation offers a cleaner setup.
Sentiment: Bullish, but confidence: 7/10. Momentum is strong, yet resistance is significant.
Would you rather wait for a breakout above $1,600, or look for a retest before entering? 👇
$ZEC
#altcoins
#TradingTales #PriceAction #Binance #cryptotrading
ZEC/USD is showing a powerful weekly breakout, but the most important part of the chart is not the pump — it’s what happens inside the major resistance zone.
The weekly candle is currently around $1,103, with a visible +25.73% move. Price has climbed dramatically from the long accumulation range and is now testing an overhead supply area that has been marked on the chart.
📊 Technical Breakdown
Resistance: 🔴 ~$800–$1,600
ZEC is already trading inside this zone. A strong weekly close above the zone would be the confirmation bulls need. $ZEC
Immediate support: 🟢 ~$700
This is the key breakout region visible below the current price. A successful retest here would make the bullish structure much healthier.
Next visible upside levels:
🎯 TP1: $1,700
🎯 TP2: $2,700
🎯 TP3: $4,100
These are chart-visible price levels, not guaranteed targets.
🧠 Trade Plan
I would not chase ZEC at $1,103 while price is sitting inside resistance.
A more attractive setup would be a pullback toward the $700–$800 area, followed by a confirmed bullish reaction.
Invalidation: A decisive weekly loss of the ~$700 area would weaken the breakout thesis.
Risk/Reward: Not reliably calculable at the current price because there is no confirmed entry or tight invalidation shown on the chart. Waiting for confirmation offers a cleaner setup.
Sentiment: Bullish, but confidence: 7/10. Momentum is strong, yet resistance is significant.
Would you rather wait for a breakout above $1,600, or look for a retest before entering? 👇
$ZEC
#altcoins
#TradingTales #PriceAction #Binance #cryptotrading