
#pildorasbinance
pildorasbinance
1,074 views
16 Discussing
Hot
Latest

·
--
#PildorasCrypto10
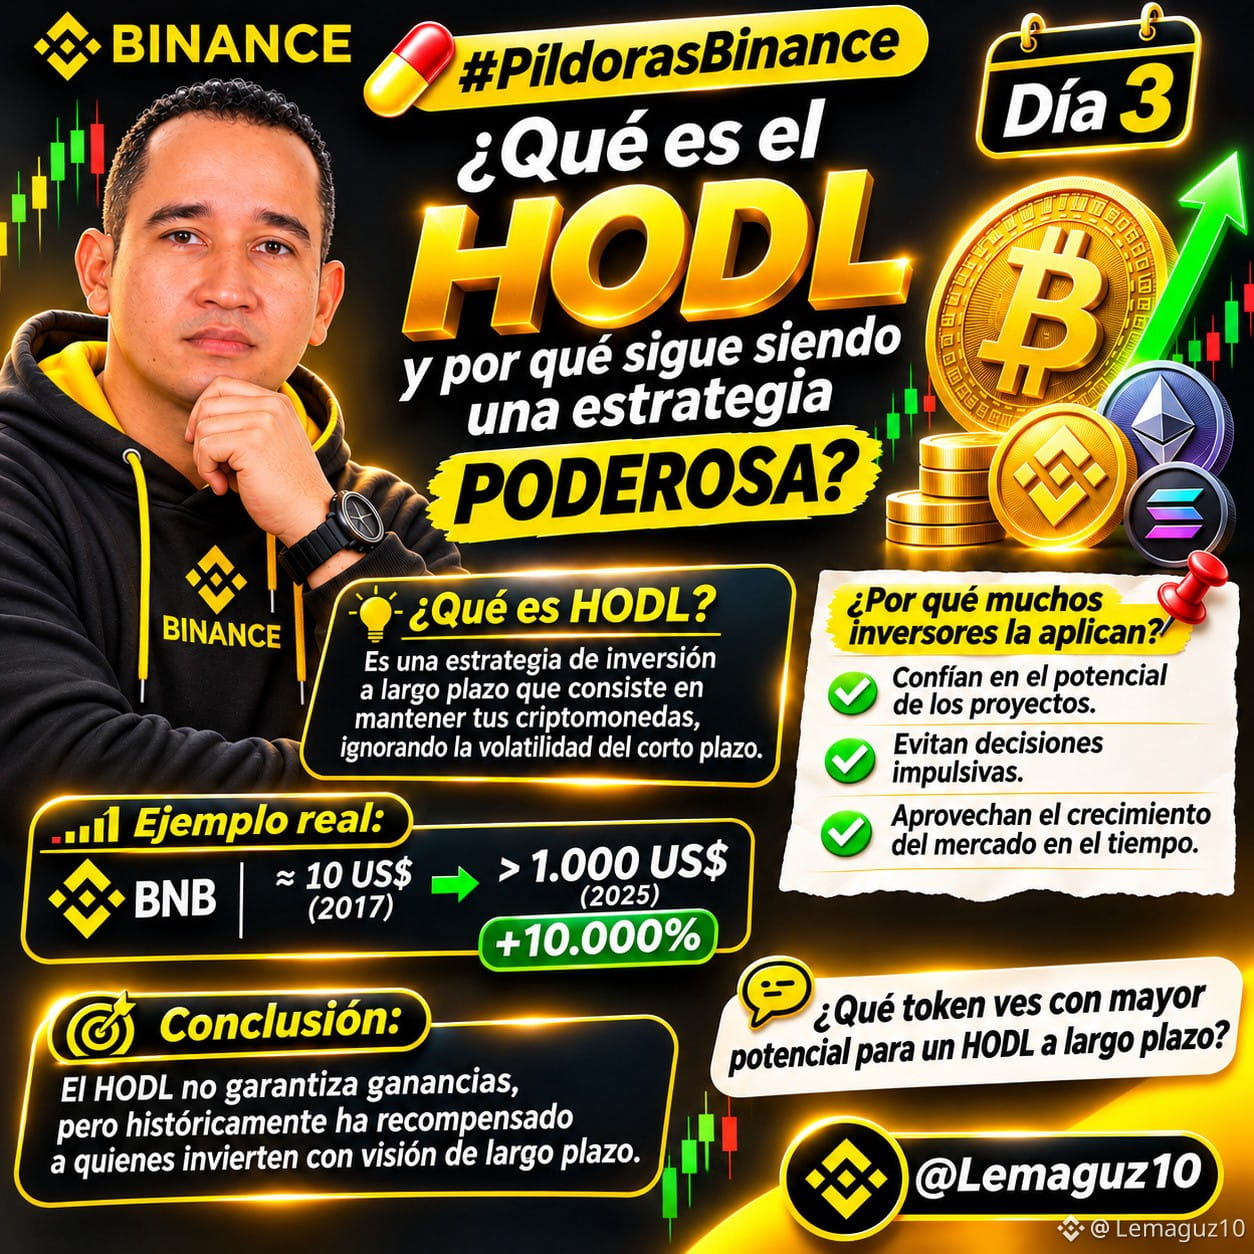
HODL: IS PATIENCE THE SECRET?
Did you know that not all investors want to buy and sell cryptocurrencies every day?
In the crypto world, there’s a strategy known as HODL.
WHAT DOES HODL MEAN?
The term originated from a typo of HOLD in a Bitcoin forum in 2013.
Today, it’s used to describe the decision to hold on to cryptocurrencies for long periods, even when the market experiences major swings.
3 LESSONS YOU SHOULD KNOW
1. Patience matters: not every fluctuation requires an immediate decision.
2. Research is essential: holding an asset for years doesn’t guarantee gains. Its project and risks should be evaluated periodically.
3. Having a strategy is essential: define your goals, understand volatility, and avoid investing money you need for your expenses.
EDUCATIONAL EXAMPLE
Imagine you buy a cryptocurrency for $100.
If it drops to $70, your investment loses 30% of its value.
If it later rises to $130, you would have a 30% gain compared to the purchase price, before fees.
But it could also keep falling and never recover its initial price.
HODL doesn’t mean always making a profit. It means holding a position according to a strategy, while accepting its risks.
“Patience can be valuable, but it should never replace knowledge.
If you had to choose a strategy, which one would you study first?
🅰️ Long-term HODL.
🅱️ Short-term trading.
🅲 A combination of both.
Comment A, B, or C and explain your choice.
Educational content; this does not constitute financial advice.
One daily bite, one new insight.
#PildorasBinance
#BinanceSquare
#HODL
@CriptoMaster007
@Binance_Labs
@usualmoney
#PildorasCrypto10
HODL: IS PATIENCE THE SECRET?
Did you know that not all investors want to buy and sell cryptocurrencies every day?
In the crypto world, there’s a strategy known as HODL.
WHAT DOES HODL MEAN?
The term originated from a typo of HOLD in a Bitcoin forum in 2013.
Today, it’s used to describe the decision to hold on to cryptocurrencies for long periods, even when the market experiences major swings.
3 LESSONS YOU SHOULD KNOW
1. Patience matters: not every fluctuation requires an immediate decision.
2. Research is essential: holding an asset for years doesn’t guarantee gains. Its project and risks should be evaluated periodically.
3. Having a strategy is essential: define your goals, understand volatility, and avoid investing money you need for your expenses.
EDUCATIONAL EXAMPLE
Imagine you buy a cryptocurrency for $100.
If it drops to $70, your investment loses 30% of its value.
If it later rises to $130, you would have a 30% gain compared to the purchase price, before fees.
But it could also keep falling and never recover its initial price.
HODL doesn’t mean always making a profit. It means holding a position according to a strategy, while accepting its risks.
“Patience can be valuable, but it should never replace knowledge.
If you had to choose a strategy, which one would you study first?
🅰️ Long-term HODL.
🅱️ Short-term trading.
🅲 A combination of both.
Comment A, B, or C and explain your choice.
Educational content; this does not constitute financial advice.
One daily bite, one new insight.
#PildorasBinance
#BinanceSquare
#HODL
@CriptoMaster007
@Binance Labs
@Usual Official
HODL: IS PATIENCE THE SECRET?
Did you know that not all investors want to buy and sell cryptocurrencies every day?
In the crypto world, there’s a strategy known as HODL.
WHAT DOES HODL MEAN?
The term originated from a typo of HOLD in a Bitcoin forum in 2013.
Today, it’s used to describe the decision to hold on to cryptocurrencies for long periods, even when the market experiences major swings.
3 LESSONS YOU SHOULD KNOW
1. Patience matters: not every fluctuation requires an immediate decision.
2. Research is essential: holding an asset for years doesn’t guarantee gains. Its project and risks should be evaluated periodically.
3. Having a strategy is essential: define your goals, understand volatility, and avoid investing money you need for your expenses.
EDUCATIONAL EXAMPLE
Imagine you buy a cryptocurrency for $100.
If it drops to $70, your investment loses 30% of its value.
If it later rises to $130, you would have a 30% gain compared to the purchase price, before fees.
But it could also keep falling and never recover its initial price.
HODL doesn’t mean always making a profit. It means holding a position according to a strategy, while accepting its risks.
“Patience can be valuable, but it should never replace knowledge.
If you had to choose a strategy, which one would you study first?
🅰️ Long-term HODL.
🅱️ Short-term trading.
🅲 A combination of both.
Comment A, B, or C and explain your choice.
Educational content; this does not constitute financial advice.
One daily bite, one new insight.
#PildorasBinance
#BinanceSquare
#HODL
@CriptoMaster007
@Binance Labs
@Usual Official
1
102
·
--
#PildorasCrypto10
JAPANESE CANDLESTICKS: DO YOU KNOW WHAT THE MARKET IS TRYING TO TELL YOU?
#pildorasBinance | Crypto Learning
Don’t just look at the price—learn to interpret candlesticks!
Did you know that each Japanese candlestick tells a little story about the behavior of buyers and sellers?
WHAT ARE JAPANESE CANDLESTICKS?
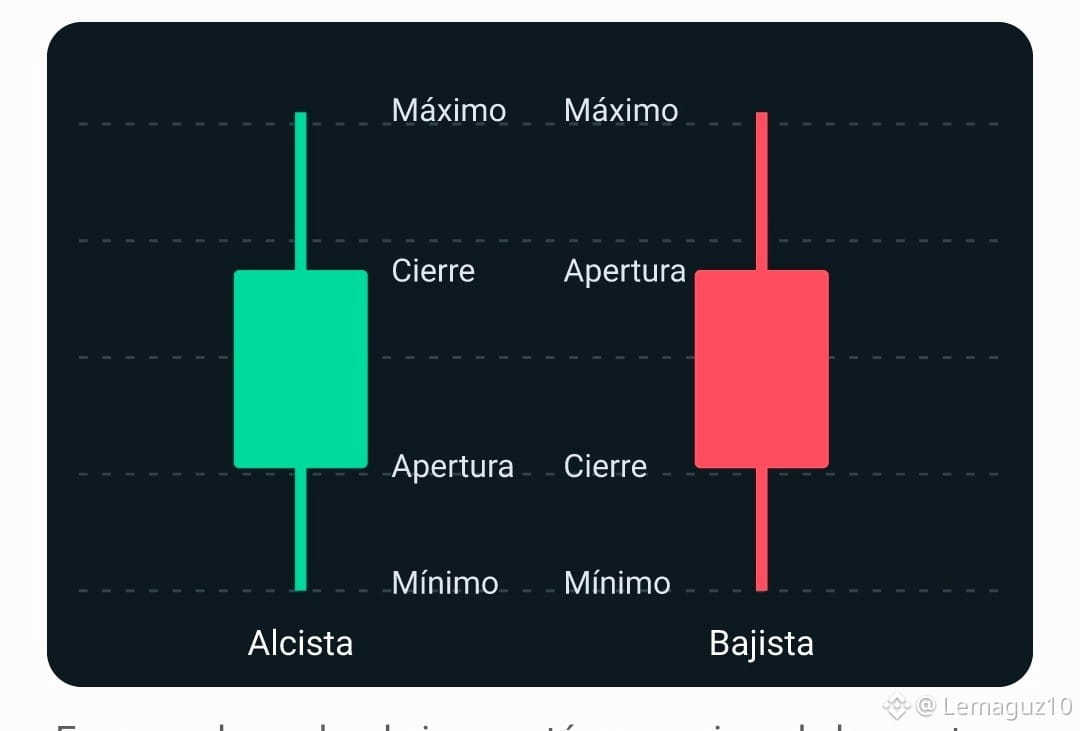
They are chart representations that show four key price points over a given period:
✅ Open: the price at the start of the period.
✅ Close: the price at the end of the period.
✅ High: the highest price reached.
✅ Low: the lowest price recorded.
🟢 GREEN CANDLE: the price closed above its opening price.
🔴 RED CANDLE: the price closed below its opening price.
WHAT DO THEIR SHAPES MEAN?
🟩 Long body: indicates a significant move between the opening and closing prices.
➖ Long wicks: show that the price reached levels it later failed to hold.
✚ Doji: the opening and closing prices are very close, which may reflect indecision.
A green candle doesn’t guarantee that the price will keep rising, and a red one doesn’t mean it will keep falling.
WHY IS IT IMPORTANT TO LEARN HOW TO READ THEM?
Because they help you understand volatility, identify potential areas of interest, and analyze price behavior.
However, they should be interpreted alongside volume, the trend, and other elements of technical analysis.
LET’S TEST YOUR KNOWLEDGE!
If you see a candle with a very long upper wick, what might it indicate?
🅰️ That the price is certain to rise.
🅱️ That higher prices were rejected.
🅲 That the market stopped trading.
👇 Comment A, B, or C! Do you know the answer?
Educational content. Not financial advice.
A daily dose, a new piece of knowledge.
#BinanceSquare
#VelasJaponesas
#CryptoEducation
@CriptoMaster007
@NONOcalde
@99PARAGUAYO
#PildorasCrypto10
JAPANESE CANDLESTICKS: DO YOU KNOW WHAT THE MARKET IS TRYING TO TELL YOU?
#pildorasBinance | Crypto Learning
Don’t just look at the price—learn to interpret candlesticks!
Did you know that each Japanese candlestick tells a little story about the behavior of buyers and sellers?
WHAT ARE JAPANESE CANDLESTICKS?
They are chart representations that show four key price points over a given period:
✅ Open: the price at the start of the period.
✅ Close: the price at the end of the period.
✅ High: the highest price reached.
✅ Low: the lowest price recorded.
🟢 GREEN CANDLE: the price closed above its opening price.
🔴 RED CANDLE: the price closed below its opening price.
WHAT DO THEIR SHAPES MEAN?
🟩 Long body: indicates a significant move between the opening and closing prices.
➖ Long wicks: show that the price reached levels it later failed to hold.
✚ Doji: the opening and closing prices are very close, which may reflect indecision.
A green candle doesn’t guarantee that the price will keep rising, and a red one doesn’t mean it will keep falling.
WHY IS IT IMPORTANT TO LEARN HOW TO READ THEM?
Because they help you understand volatility, identify potential areas of interest, and analyze price behavior.
However, they should be interpreted alongside volume, the trend, and other elements of technical analysis.
LET’S TEST YOUR KNOWLEDGE!
If you see a candle with a very long upper wick, what might it indicate?
🅰️ That the price is certain to rise.
🅱️ That higher prices were rejected.
🅲 That the market stopped trading.
👇 Comment A, B, or C! Do you know the answer?
Educational content. Not financial advice.
A daily dose, a new piece of knowledge.
#BinanceSquare
#VelasJaponesas
#CryptoEducation
@CriptoMaster007
@NONOcalde
@99PARAGUAYO
JAPANESE CANDLESTICKS: DO YOU KNOW WHAT THE MARKET IS TRYING TO TELL YOU?
#pildorasBinance | Crypto Learning
Don’t just look at the price—learn to interpret candlesticks!
Did you know that each Japanese candlestick tells a little story about the behavior of buyers and sellers?
WHAT ARE JAPANESE CANDLESTICKS?
They are chart representations that show four key price points over a given period:
✅ Open: the price at the start of the period.
✅ Close: the price at the end of the period.
✅ High: the highest price reached.
✅ Low: the lowest price recorded.
🟢 GREEN CANDLE: the price closed above its opening price.
🔴 RED CANDLE: the price closed below its opening price.
WHAT DO THEIR SHAPES MEAN?
🟩 Long body: indicates a significant move between the opening and closing prices.
➖ Long wicks: show that the price reached levels it later failed to hold.
✚ Doji: the opening and closing prices are very close, which may reflect indecision.
A green candle doesn’t guarantee that the price will keep rising, and a red one doesn’t mean it will keep falling.
WHY IS IT IMPORTANT TO LEARN HOW TO READ THEM?
Because they help you understand volatility, identify potential areas of interest, and analyze price behavior.
However, they should be interpreted alongside volume, the trend, and other elements of technical analysis.
LET’S TEST YOUR KNOWLEDGE!
If you see a candle with a very long upper wick, what might it indicate?
🅰️ That the price is certain to rise.
🅱️ That higher prices were rejected.
🅲 That the market stopped trading.
👇 Comment A, B, or C! Do you know the answer?
Educational content. Not financial advice.
A daily dose, a new piece of knowledge.
#BinanceSquare
#VelasJaponesas
#CryptoEducation
@CriptoMaster007
@NONOcalde
@99PARAGUAYO
1
31
Log in to explore more content
Join global crypto users on Binance Square
⚡️ Get latest and useful information about crypto.
💬 Trusted by the world’s largest crypto exchange.
👍 Discover real insights from verified creators.
Email / Phone number
Trending Topics
1
#NvidiaInvestigatesAfterHuang’sAffairApology
200,181 views
1,670 Discussing
2
#BitcoinFiveWeeklyLosses
227,859 views
2,138 Discussing
3
#AIChipSlumpNasdaq
124,275 views
1,321 Discussing
4
#CPITestsDecemberRateOutlook
649,926 views
2,776 Discussing
5
#AnthropicRejectsIPODelayValuationinQuestion
36,030 views
392 Discussing
6
#CryptoLiquidationsReach$1.16BIn24Hours
11,700 views
45 Discussing
7
#BrentCrudeDrops3.8%To$94.56
9,345 views
23 Discussing
8
#EUInstitutionsInviteIndustryToSetTokenizedSecuritiesStandards
1,841 views
16 Discussing
9
#ChinaCACListsFiveIssuesAffectingBlockchainFilings
13,678 views
149 Discussing
10
#UKBanksCanNowApplyToConductCryptoAssetBusiness
12,091 views
108 Discussing