

#mon
mon
1M views
4,354 Discussing
Hot
Latest

·
--
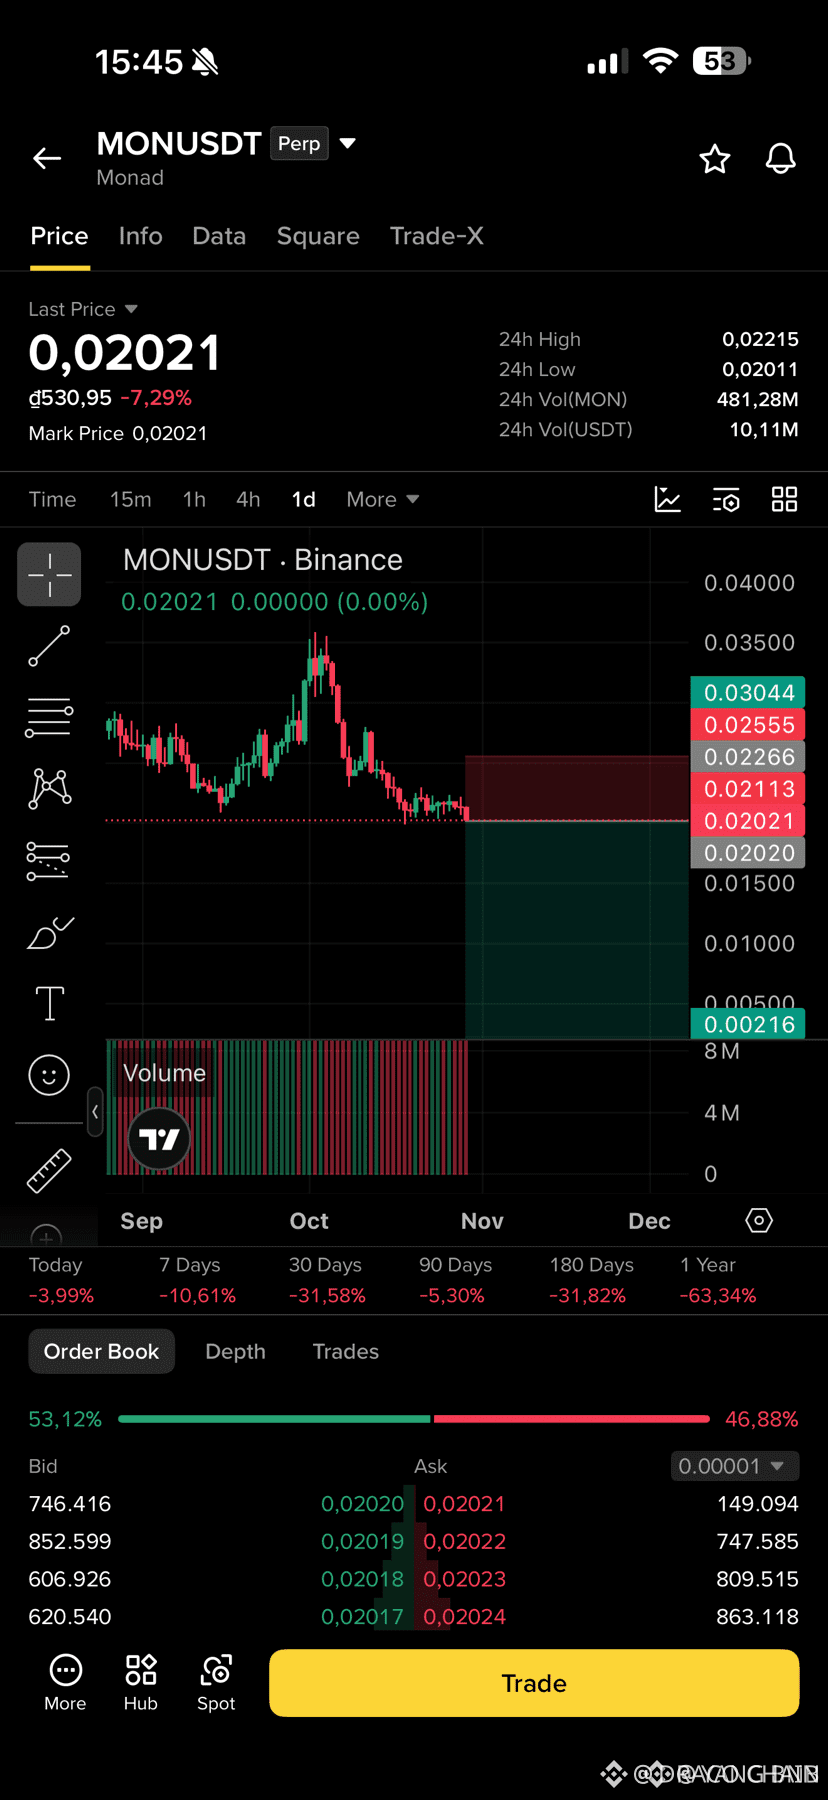
🚨 $MON BEARS ARE SQUEEZING THE LIQUIDITY ZONE! 📉
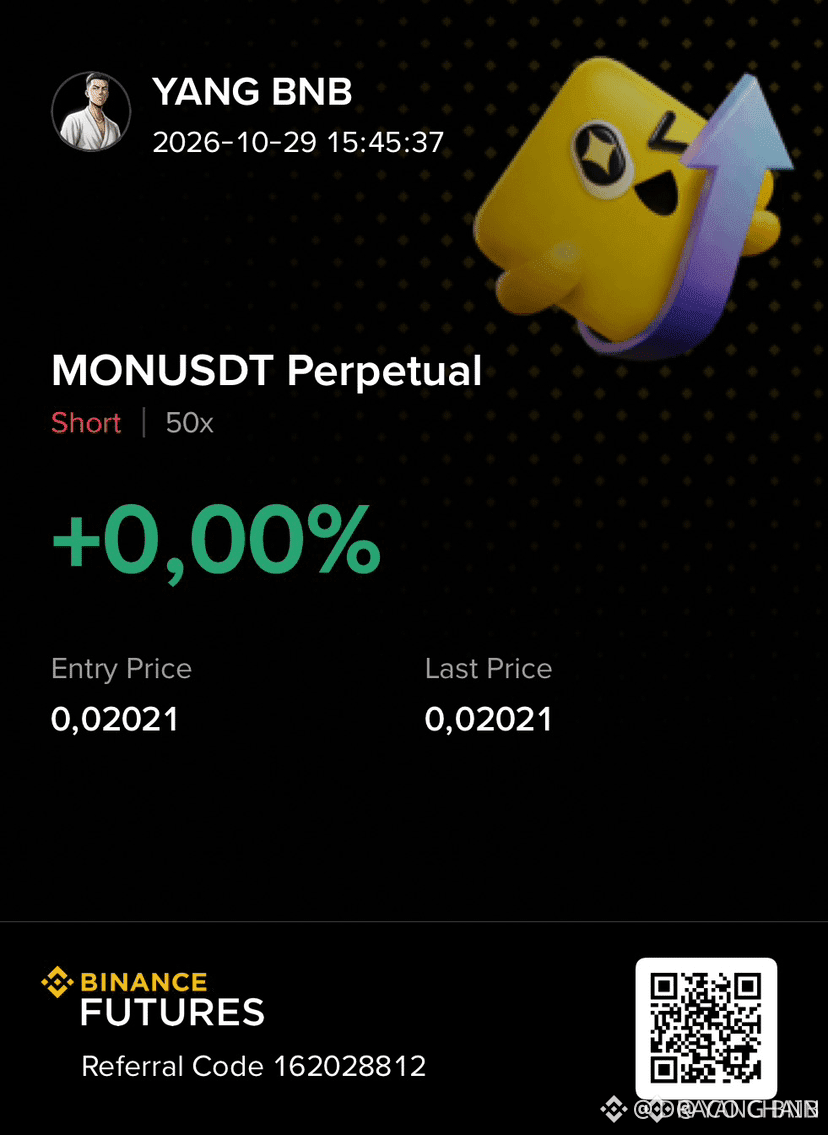
Entry: 0.02020-0.02113 ⚡
Target: 0.01800 🚀
Stop Loss: 0.02266 ⚠️
The market shattered the 0.03500 ceiling, stamping a clean lower‑high/lower‑low pattern. Sellers now dominate the 0.02021 node, a classic liquidity pool where smart money unloads residual longs 📊. Volume bursts on the 1‑hour chart show aggressive absorption, while RSI remains deep in bearish territory, confirming the downtrend bias 📌. A break below 0.02020 eyes the 0.01800 swing low, a historic supply zone ready to trigger the next liquidity sweep 🌊.
💬 Are you positioning short now or waiting for the next liquidity sweep? 👇
⚠️ Not financial advice. Always manage your risk. 🛡️
🏷️ #MON #ShortSetup #Bearish #Crypto
🔥 🦈
5

·
--
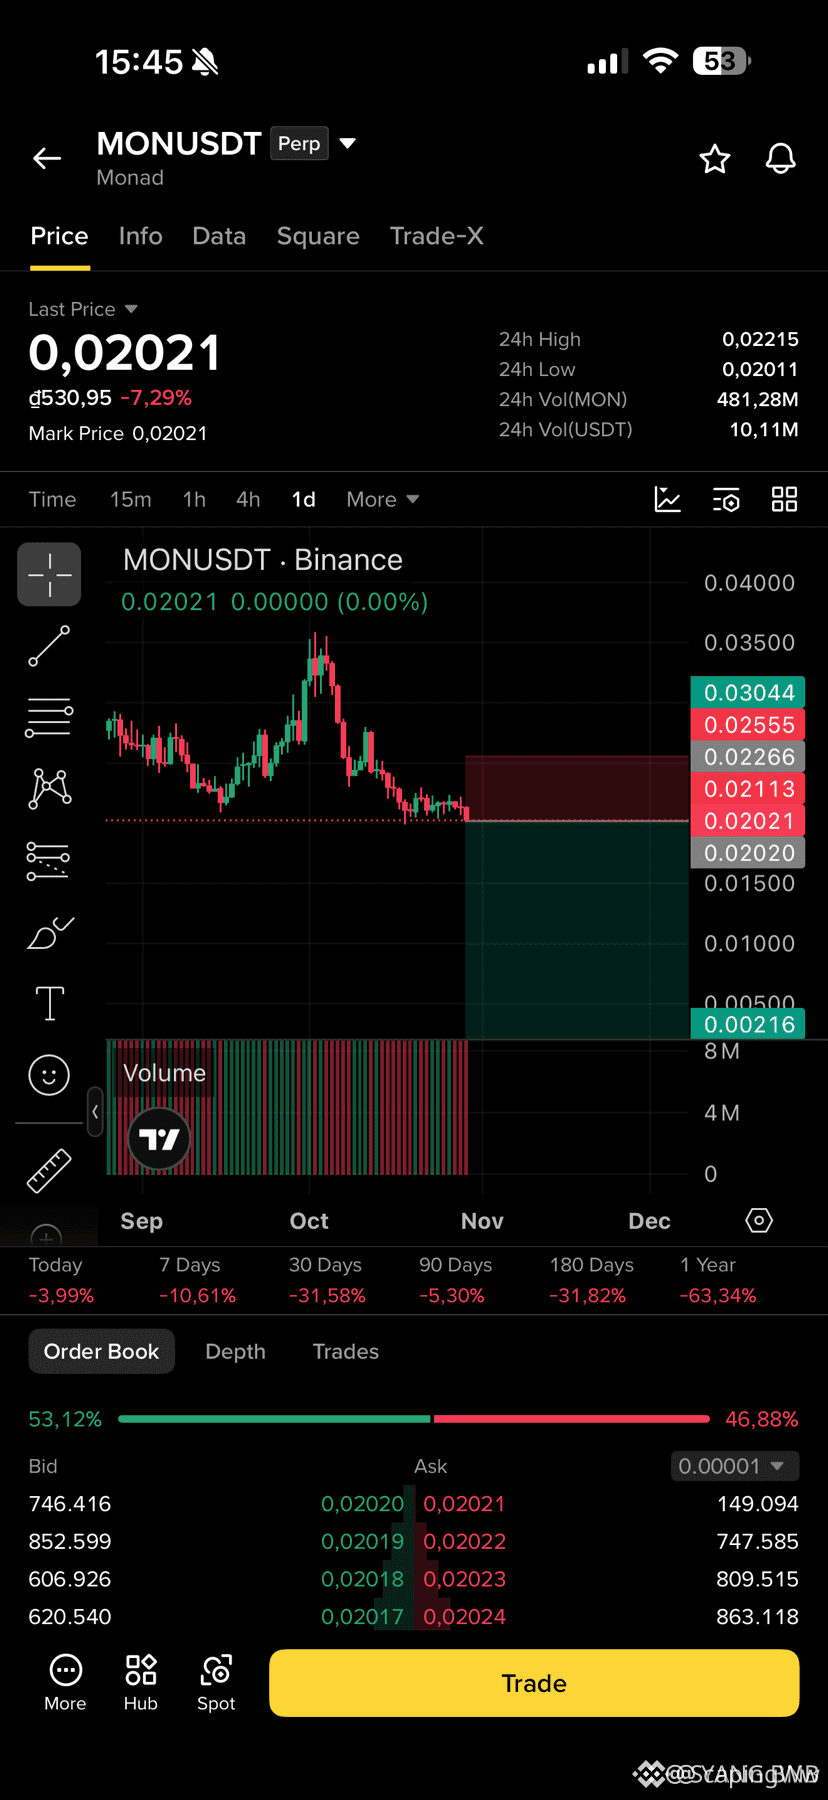
🚨 $MON BEARS SWEEP THE BOARD AFTER REJECTION! 📉
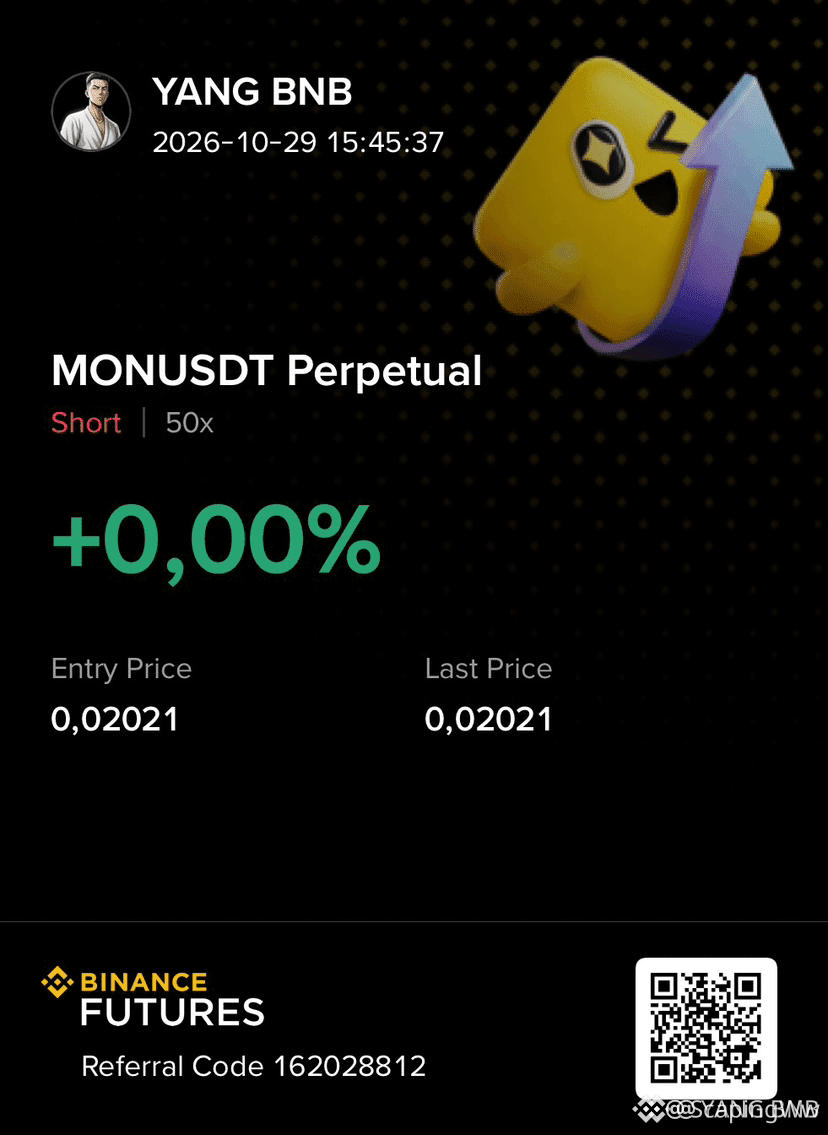
Entry: 0.02020 ⚡
Target: 0.01800 🚀
Stop Loss: 0.02266 ⚠️
The market has ripped $MON off the 0.03500 ceiling, etching a textbook lower‑high, lower‑low descent. Sellers are sweeping liquidity with every dip, keeping the pressure relentless. 📊
Volume on the 4H spikes confirms bear dominance while RSI sits deep in oversold, suggesting the downside could keep grinding. ⚡
💬 Are you set to ride the bear wave or waiting for a reversal cue? 👇
⚠️ Not financial advice. Always manage your risk. 🛡️
🏷️ #MON #ShortSetup #Bearish #Crypto
🔥 💎
8

🚨 $MON BEARISH CONTINUATION RELOADING FOR A LIQUIDITY FLUSH BELOW SUPPORT! 🐻
Entry: 0.02563 ⚡
Target: 0.0250173 🚀
Stop Loss: 0.0261202 ⚠️
Sellers are firmly in control as $MON prints a textbook pullback continuation pattern on the short-term timeframe. 📊 Moving averages across the 20, 50, and 200 EMAs are cleanly stacked to the downside while an ADX reading of 27.4 confirms trend strength is building momentum.
📌 Price is drifting back up toward the 0.02563 supply node on weak volume, painting a classic low-conviction retest before the next sell-off. ⚡ MACD momentum remains pinned in negative territory, setting up a razor-sharp short opportunity with defined invalidation. 💬 Are you taking the short bid at resistance or waiting for the sweep? 👇
⚠️ Not financial advice. Always manage your risk. 🛡️
🏷️ #MON #ShortSetup #Bearish #Altcoins #Crypto
🎯 🐻
8

·
--
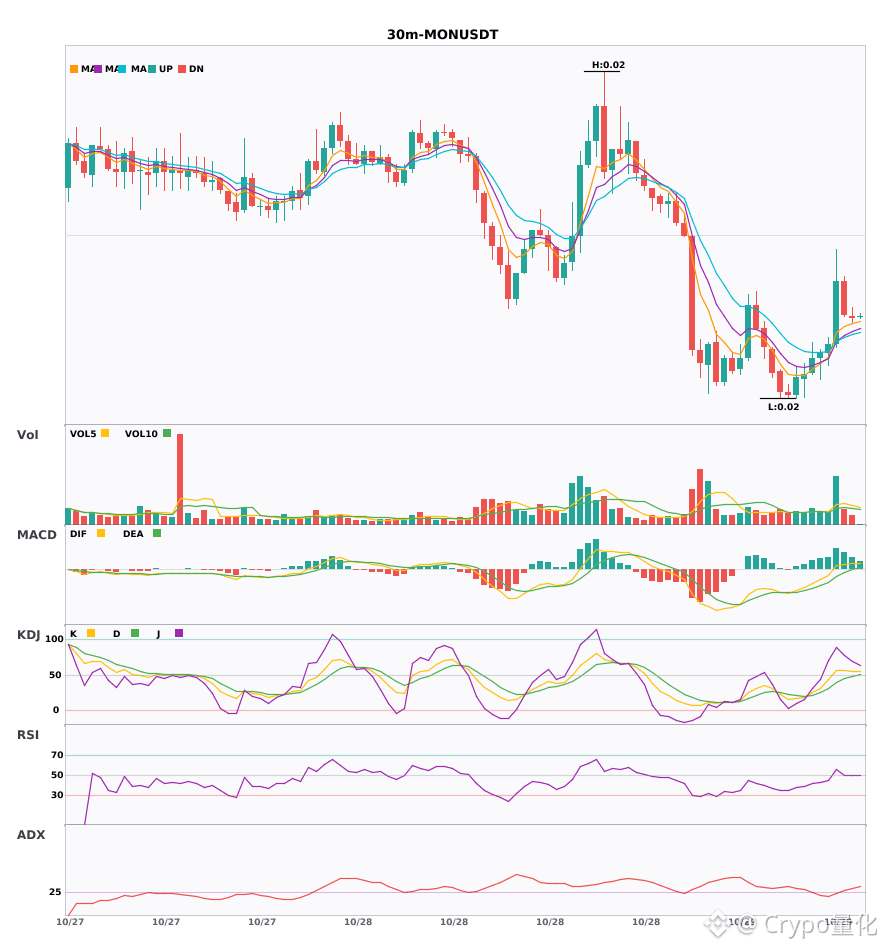
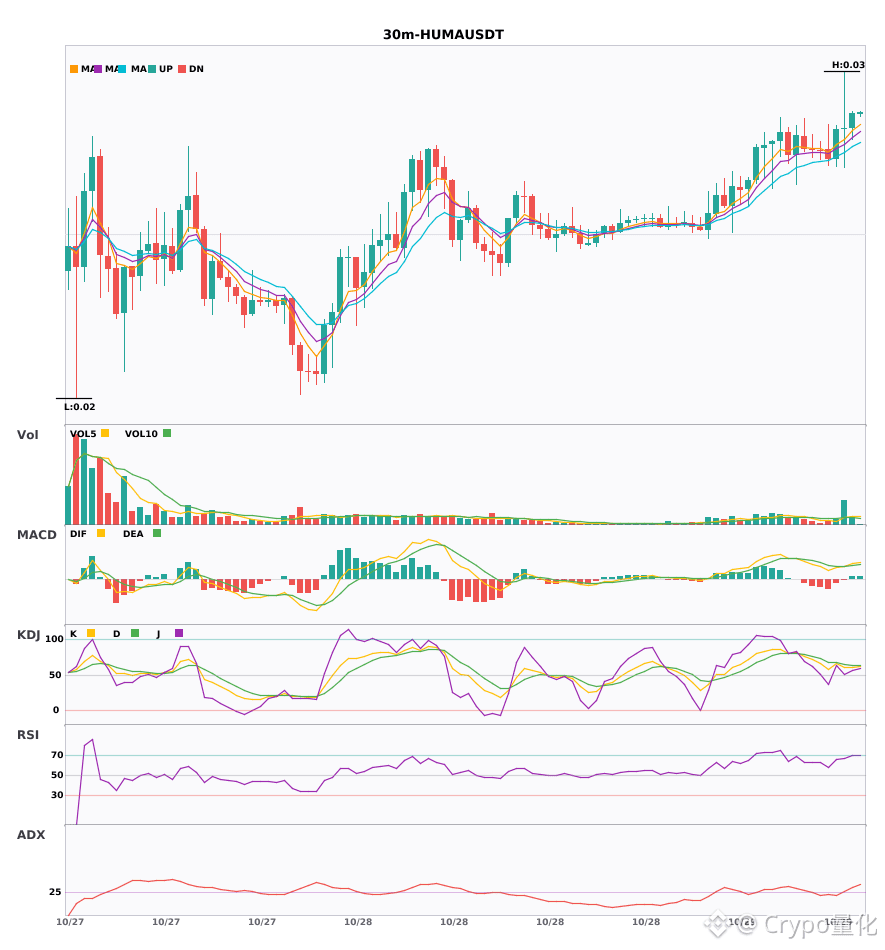
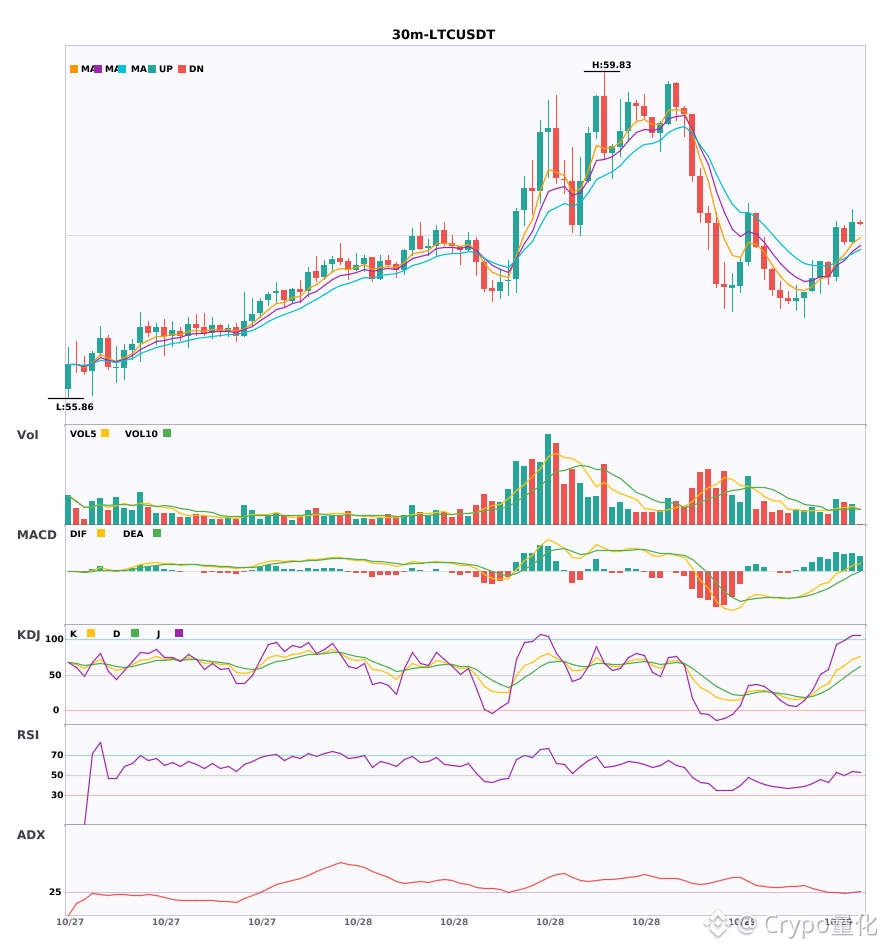
$MON / $HUMA / $LTC 30-minute confluence turns bullish, with bullish signals appearing simultaneously🔥
════════════════════
🔴 $MON 30-minute bullish signal
⚠️Technical analysis: ADX(30) Trend is forming; opportunity to participate | MACD is bullish, trend is strong but momentum is weakening | EMA5 > EMA8 > EMA13, bullish alignment | Volume surge (3.0x)
════════════════════
🔴 $HUMA 30-minute bullish signal
⚠️Technical analysis: ADX(31) Clear trending market | MACD golden cross above zero, bullish momentum released | EMA5 > EMA8 > EMA13, bullish alignment | KDJ is strong, bulls have the upper hand (K is 60.8, D is 63.3) | Volume surge (3.1x)
════════════════════
🔴 $LTC 30-minute bullish signal
⚠️Technical analysis: ADX(25) Trend is forming; opportunity to participate | MACD DIF breaks above the zero line, trend turns bullish | Moving averages are converging and building momentum, direction to be chosen soon | Volume increase (1.6x)
════════════════════
🔔 Follow to get first-hand market updates 🔔
#技术分析 #MON #HUMA #LTC
📌 When trading, pay attention to whether the candlestick pattern confirms
════════════════════
🔴 $MON 30-minute bullish signal
⚠️Technical analysis: ADX(30) Trend is forming; opportunity to participate | MACD is bullish, trend is strong but momentum is weakening | EMA5 > EMA8 > EMA13, bullish alignment | Volume surge (3.0x)
════════════════════
🔴 $HUMA 30-minute bullish signal
⚠️Technical analysis: ADX(31) Clear trending market | MACD golden cross above zero, bullish momentum released | EMA5 > EMA8 > EMA13, bullish alignment | KDJ is strong, bulls have the upper hand (K is 60.8, D is 63.3) | Volume surge (3.1x)
════════════════════
🔴 $LTC 30-minute bullish signal
⚠️Technical analysis: ADX(25) Trend is forming; opportunity to participate | MACD DIF breaks above the zero line, trend turns bullish | Moving averages are converging and building momentum, direction to be chosen soon | Volume increase (1.6x)
════════════════════
🔔 Follow to get first-hand market updates 🔔
#技术分析 #MON #HUMA #LTC
📌 When trading, pay attention to whether the candlestick pattern confirms
8


·
--
🩸 $MON hit a 24-hour low of 0.02097, breaking below the previous low of 0.02111.
The bears are having a field day. Once support is broken, it usually turns into resistance. Is it time to buy the dip, or should we wait a little longer?
#MON
🩸 $MON hit a 24-hour low of 0.02097, breaking below the previous low of 0.02111.
The bears are having a field day. Once support is broken, it usually turns into resistance. Is it time to buy the dip, or should we wait a little longer?
#MON
The bears are having a field day. Once support is broken, it usually turns into resistance. Is it time to buy the dip, or should we wait a little longer?
#MON
97

·
--
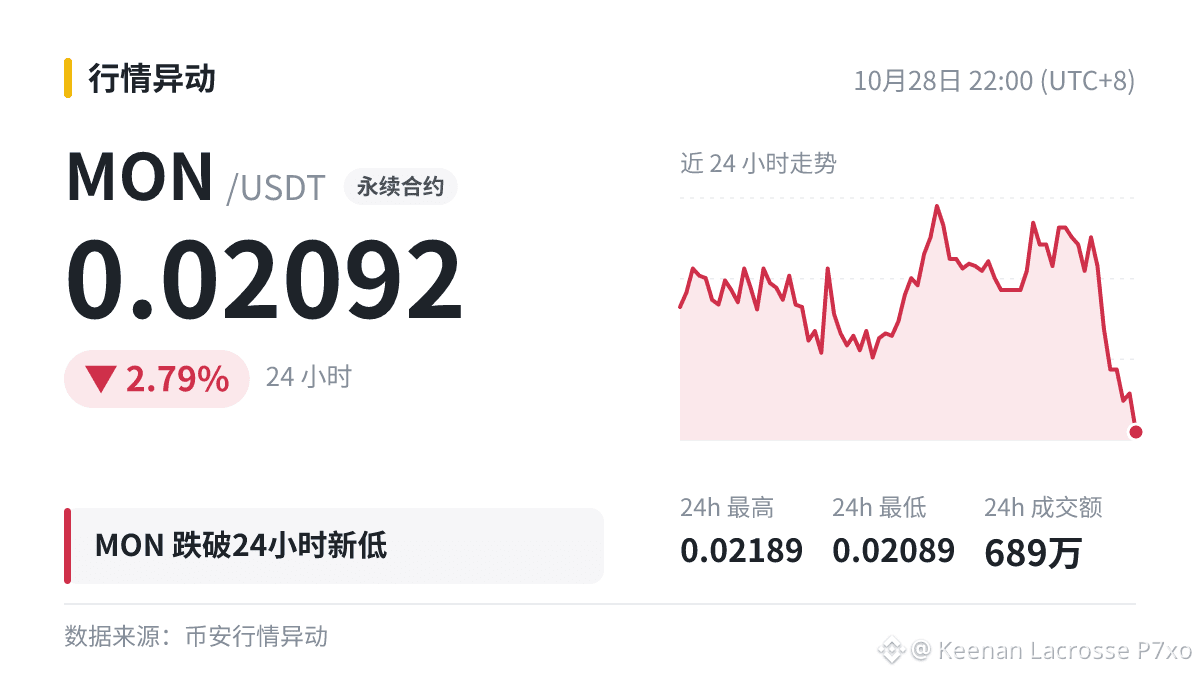
$MON 24-hour low confirmed.
24h: -3.66%, current price: 0.02078, previous low: 0.02111.
Structurally, a new low means the bulls’ defensive line has been breached. On a rebound, the first thing to watch is whether the price can reclaim the previous low; if it can’t, the weakness will continue. Reclaiming it could indicate a false breakdown. What will you do if the price moves the other way later?
#MON
This data is for reference only; don’t take it as definitive.

Everyone!!
$MON has broken down ⬇️ The 24-hour low has been breached!
Current price: 0.02092; the previous low of 0.02111 didn’t hold…
The sharper the drop, the more likely panic is to overshoot. How do you usually handle a flash crash?
#MON
Everyone!!
$MON has broken down ⬇️ The 24-hour low has been breached!
Current price: 0.02092; the previous low of 0.02111 didn’t hold…
The sharper the drop, the more likely panic is to overshoot. How do you usually handle a flash crash?
#MON
$MON has broken down ⬇️ The 24-hour low has been breached!
Current price: 0.02092; the previous low of 0.02111 didn’t hold…
The sharper the drop, the more likely panic is to overshoot. How do you usually handle a flash crash?
#MON
6

·
--
The market is at it again: a new $MON 24-hour low. The current price is 0.02092, compared with the previous low of 0.02111.
Whenever a new low hits, someone in the comments always says, “This is the bottom,” and then the market politely digs another level lower.
Until there are signs of a rebound, waiting on the sidelines is the safer move.
#MON
Whenever a new low hits, someone in the comments always says, “This is the bottom,” and then the market politely digs another level lower.
Until there are signs of a rebound, waiting on the sidelines is the safer move.
#MON
147

⬇️ $MON hit a new 24-hour low of 0.02098, breaking below the previous low of 0.02111.
Buying pressure isn't keeping up, and support is weak. Once support is broken, it usually turns into resistance.
#MON
⬇️ $MON hit a new 24-hour low of 0.02098, breaking below the previous low of 0.02111.
Buying pressure isn't keeping up, and support is weak. Once support is broken, it usually turns into resistance.
#MON
Buying pressure isn't keeping up, and support is weak. Once support is broken, it usually turns into resistance.
#MON
10

·
--
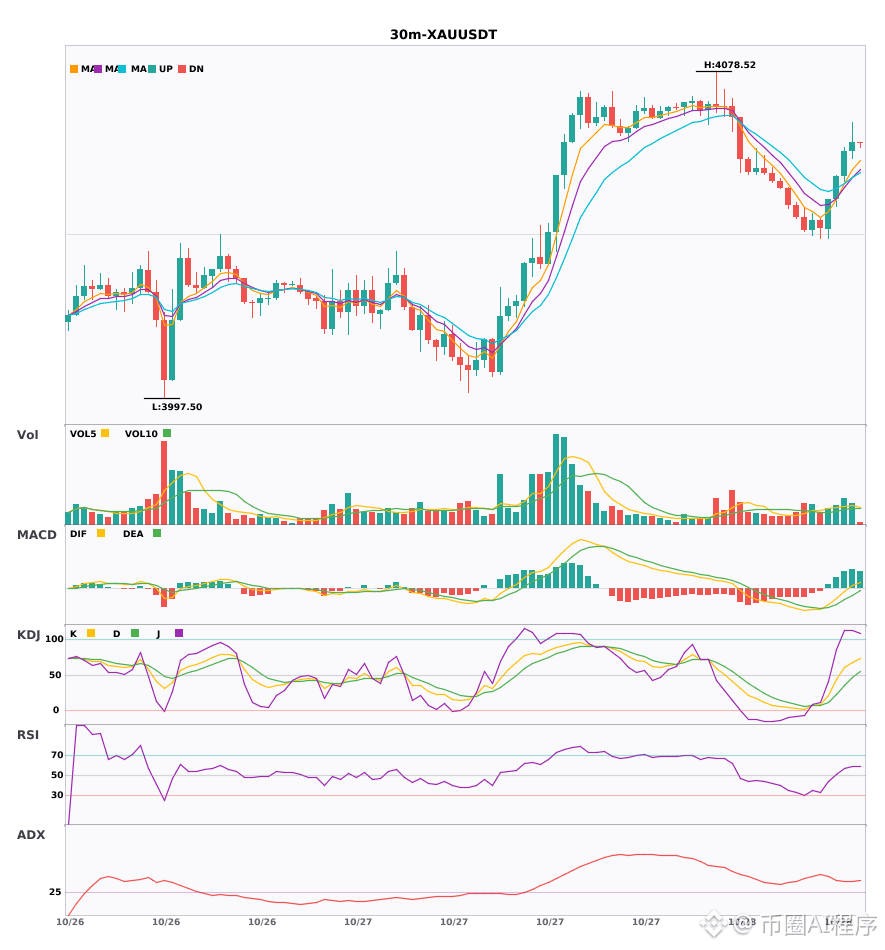
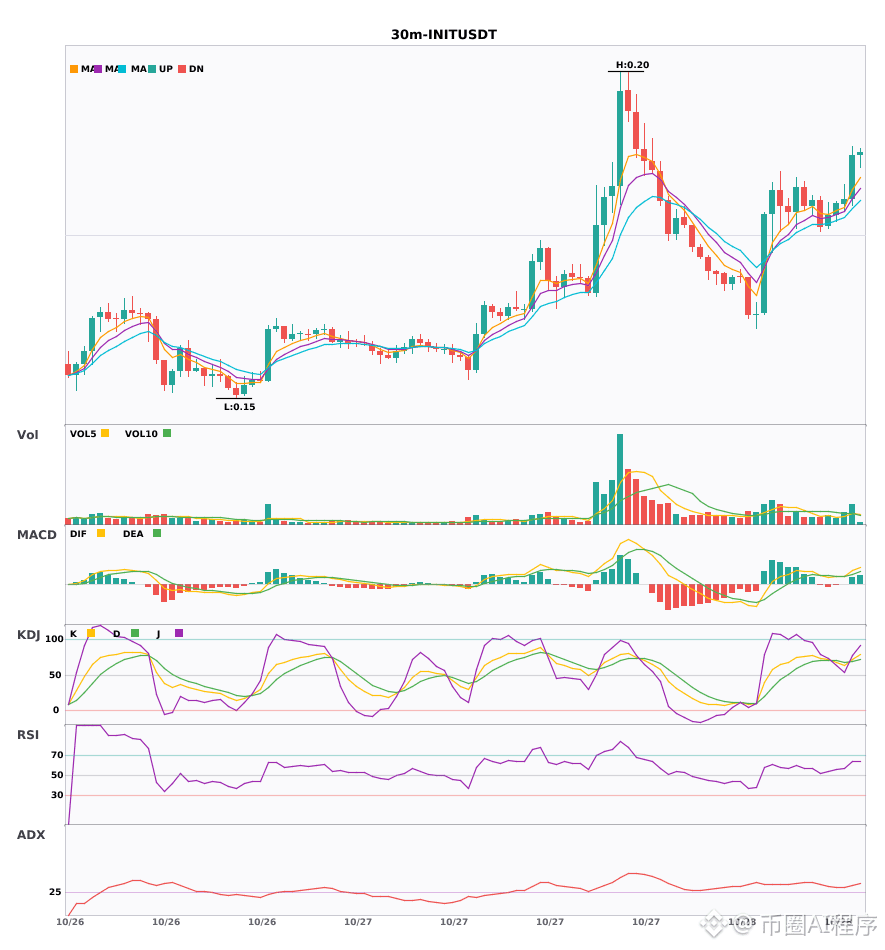
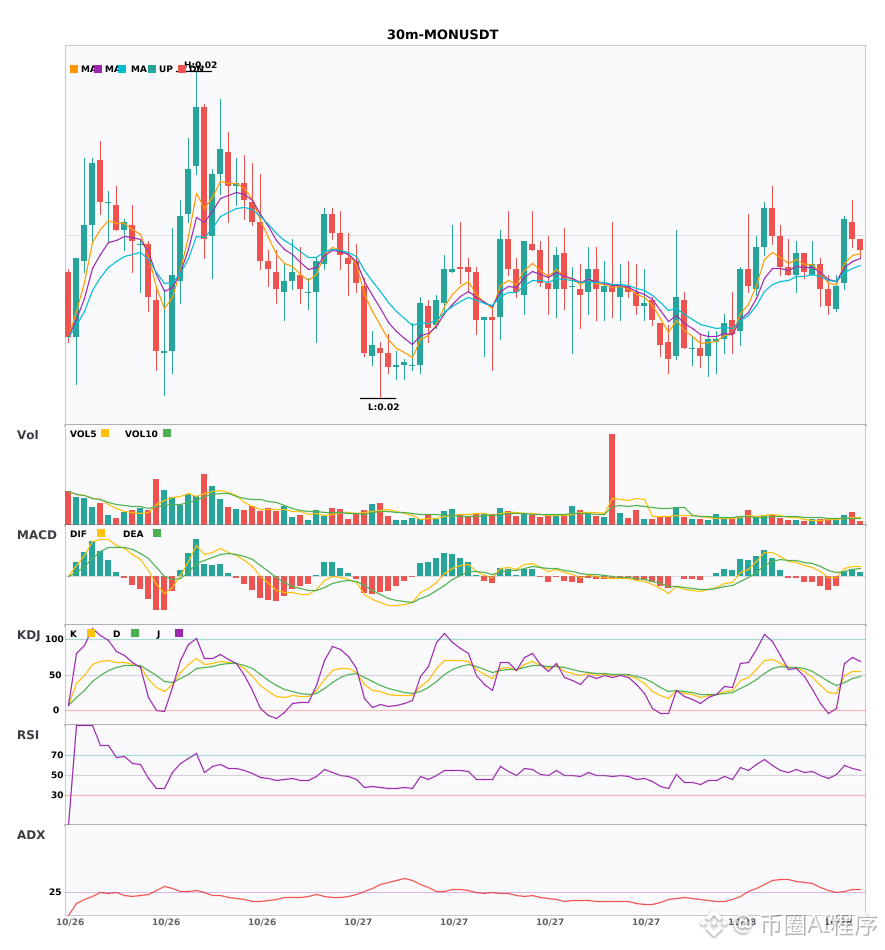
$XAU / $INIT / $MON 30-minute bullish signals, with the 4-hour bullish trend confirmed 🔥
════════════════════
🔴 $XAU 30-minute bullish signal
⚠️Technical analysis: 4-hour bullish confluence confirmed | 30-minute entry: MACD DIF breaks above zero, trend turns bullish | EMA5 > EMA8 > EMA13, bullish alignment | Increased volume (1.7x)
════════════════════
🔴 $INIT 30-minute bullish signal
⚠️Technical analysis: 4-hour bullish confluence confirmed | 30-minute entry: MACD golden cross above zero, bullish momentum released | EMA5 > EMA8 > EMA13, bullish alignment | KDJ golden cross, short-term bullish outlook (K: 71.9, D: 69.1) | Increased volume (1.8x)
════════════════════
🔴 $MON 30-minute bullish signal
⚠️Technical analysis: 4-hour bullish confluence confirmed | 30-minute entry: MACD golden cross above zero, bullish momentum released | EMA5 crosses above EMA8, short-term trend turns bullish | KDJ golden cross, short-term bullish outlook (K: 48.7, D: 39.8) | Increased volume (1.5x)
════════════════════
🔔 Follow for first-hand market alerts 🔔
#多周期共振 #XAU #INIT #MON
📌 When trading, pay attention to whether the candlestick pattern confirms the signal
════════════════════
🔴 $XAU 30-minute bullish signal
⚠️Technical analysis: 4-hour bullish confluence confirmed | 30-minute entry: MACD DIF breaks above zero, trend turns bullish | EMA5 > EMA8 > EMA13, bullish alignment | Increased volume (1.7x)
════════════════════
🔴 $INIT 30-minute bullish signal
⚠️Technical analysis: 4-hour bullish confluence confirmed | 30-minute entry: MACD golden cross above zero, bullish momentum released | EMA5 > EMA8 > EMA13, bullish alignment | KDJ golden cross, short-term bullish outlook (K: 71.9, D: 69.1) | Increased volume (1.8x)
════════════════════
🔴 $MON 30-minute bullish signal
⚠️Technical analysis: 4-hour bullish confluence confirmed | 30-minute entry: MACD golden cross above zero, bullish momentum released | EMA5 crosses above EMA8, short-term trend turns bullish | KDJ golden cross, short-term bullish outlook (K: 48.7, D: 39.8) | Increased volume (1.5x)
════════════════════
🔔 Follow for first-hand market alerts 🔔
#多周期共振 #XAU #INIT #MON
📌 When trading, pay attention to whether the candlestick pattern confirms the signal
22
·
--
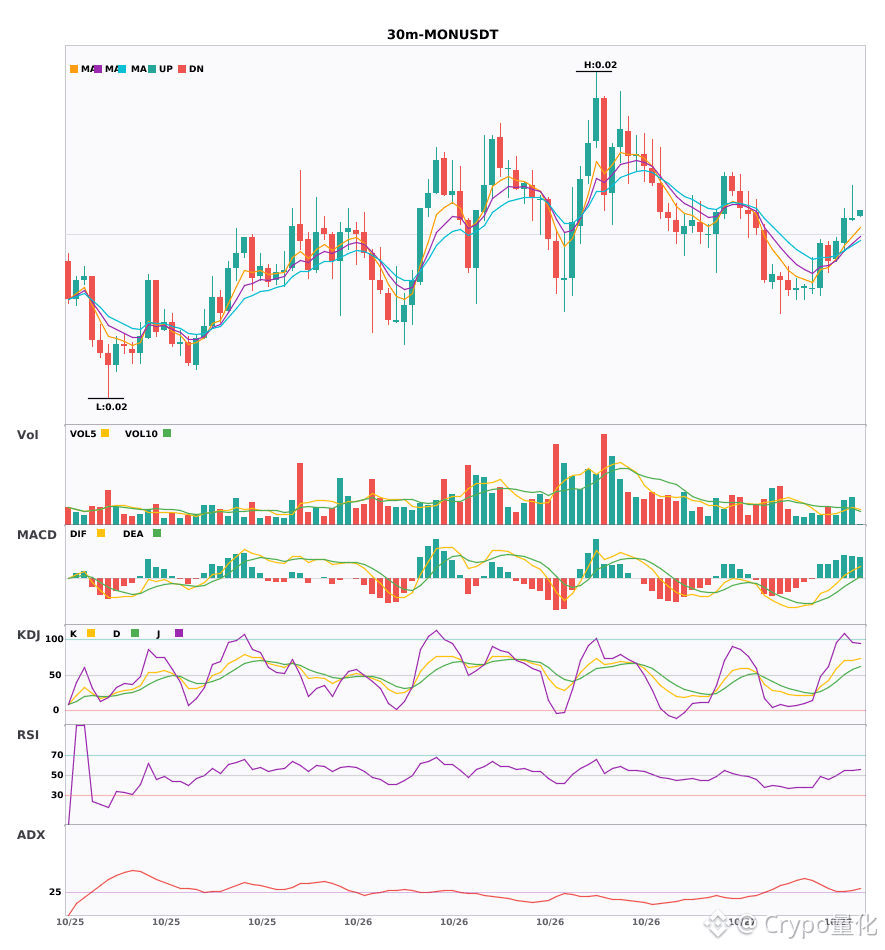
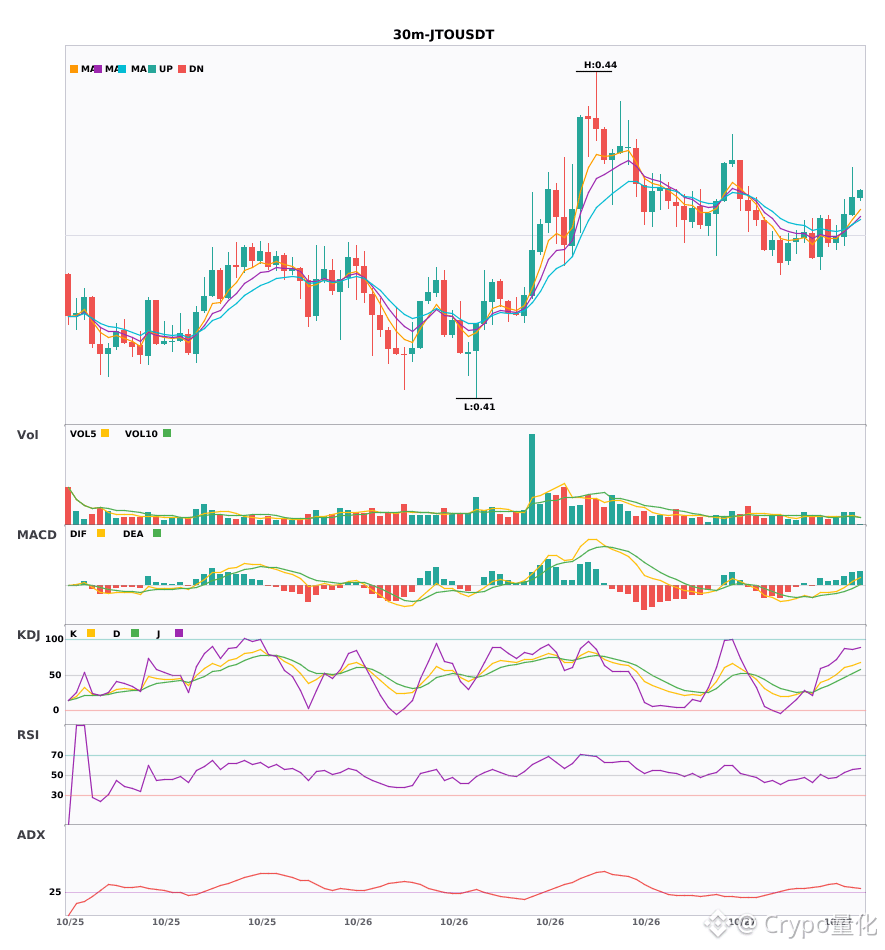
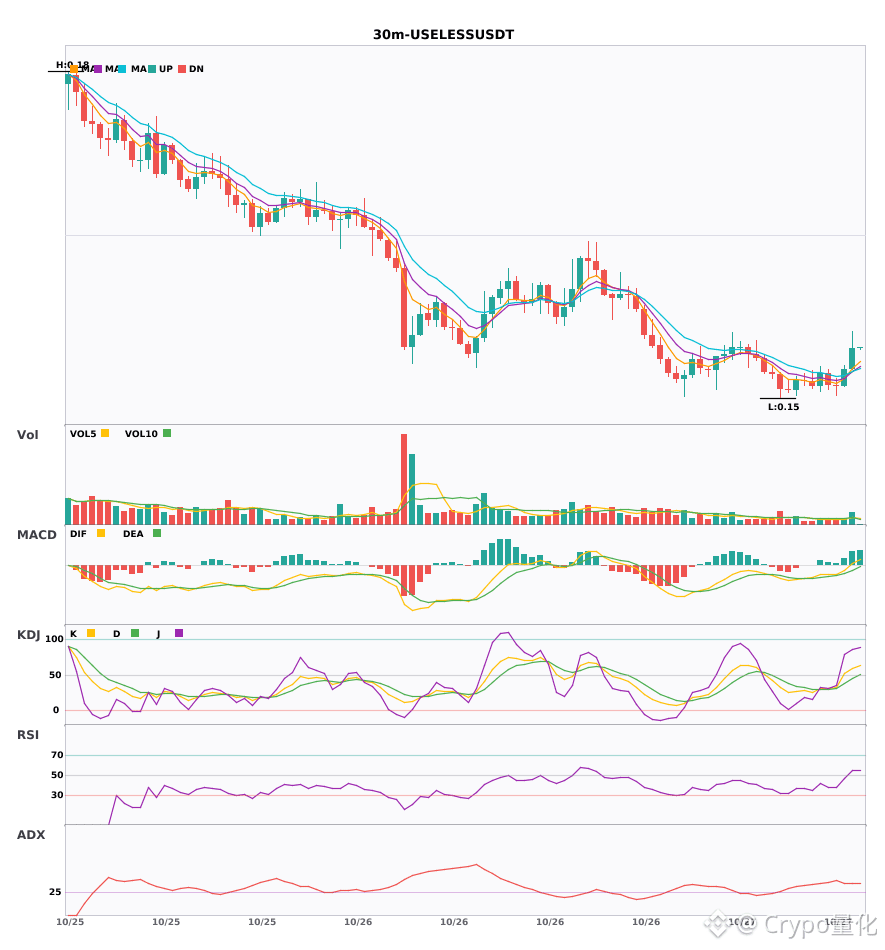
$MON / $JTO / $USELESS 30-minute technical indicators are strengthening in sync—which has the greatest breakout potential? 🔥
════════════════════
🔴 $MON 30-minute bullish signals
⚠️Technical analysis: ADX(30) Trend is forming; potential entry | MACD is bullish, trend is strong, but momentum is weakening | EMA5 > EMA8 > EMA13, bullish alignment | KDJ is strong, bulls in control (K: 70.2, D: 57.4) | Volume increased (1.6x)
════════════════════
🔴 $JTO 30-minute bullish signals
⚠️Technical analysis: ADX(33) Clear trending market | MACD DIF crossed above the zero line; trend turns bullish | EMA5 > EMA8 > EMA13, bullish alignment | KDJ is strong, bulls in control (K: 63.9, D: 52.7) | Volume increased (1.5x)
════════════════════
🔴 $USELESS 30-minute bullish signals
⚠️Technical analysis: ADX(37) Clear trending market | MACD DIF crossed above the zero line; trend turns bullish | EMA5 crossed above EMA8, turning bullish in the short term | Volume increased (1.8x)
════════════════════
🔔 Follow us for first-hand updates on unusual market moves 🔔
#技术分析 #MON #JTO #USELESS
📌 When trading, pay attention to whether the candlestick pattern confirms the setup.
════════════════════
🔴 $MON 30-minute bullish signals
⚠️Technical analysis: ADX(30) Trend is forming; potential entry | MACD is bullish, trend is strong, but momentum is weakening | EMA5 > EMA8 > EMA13, bullish alignment | KDJ is strong, bulls in control (K: 70.2, D: 57.4) | Volume increased (1.6x)
════════════════════
🔴 $JTO 30-minute bullish signals
⚠️Technical analysis: ADX(33) Clear trending market | MACD DIF crossed above the zero line; trend turns bullish | EMA5 > EMA8 > EMA13, bullish alignment | KDJ is strong, bulls in control (K: 63.9, D: 52.7) | Volume increased (1.5x)
════════════════════
🔴 $USELESS 30-minute bullish signals
⚠️Technical analysis: ADX(37) Clear trending market | MACD DIF crossed above the zero line; trend turns bullish | EMA5 crossed above EMA8, turning bullish in the short term | Volume increased (1.8x)
════════════════════
🔔 Follow us for first-hand updates on unusual market moves 🔔
#技术分析 #MON #JTO #USELESS
📌 When trading, pay attention to whether the candlestick pattern confirms the setup.
21

$MON CRACKS VISA RADAR AS AUGUST STABLECOIN VOLUME SMASHES RECORD HIGH! ⚡ 🦈
Traditional finance is officially watching. Visa just integrated $MON into its institutional analytics dashboard after August stablecoin activity surged to nearly one million transactions—an all-time record for the network. 🔍
While total settlement numbers are still early compared to legacy giants, this data tracking validates real liquidity footprint and institutional mindshare. 📊 Smart capital tracks infrastructure velocity before retail catches the scent. 💡
💬 Will Visa's institutional seal of approval accelerate $MON liquidity flow into Q4? 👇
⚠️ Not financial advice. Always manage your risk. 🛡️
🏷️ #MON #Layer1 #Stablecoins #Crypto
🔥 💎
7

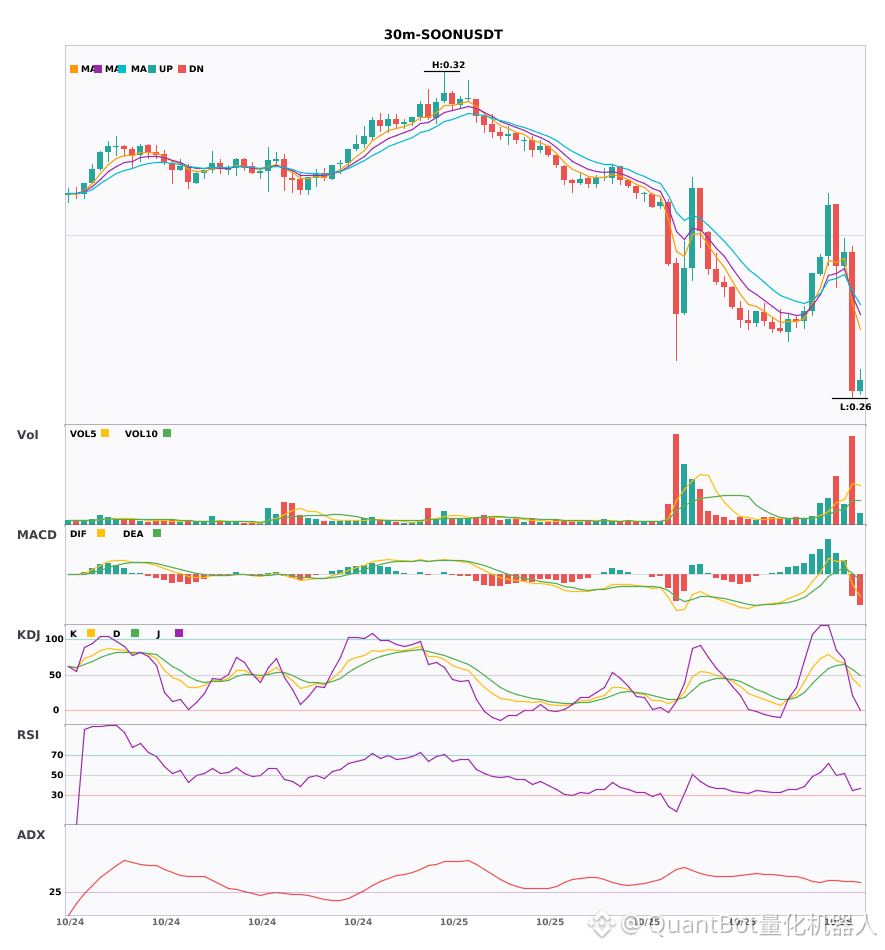
3 30-minute bearish alerts: $MON / $SOON / $牛来
📉 $MON | 30-minute bearish signal
━━━━━━━━━━━━━━━━━━
Technical analysis: ADX(26) Trend is forming; opportunity to participate | MACD DIF fell below the zero line, signaling a bearish trend | EMA5 < EMA8 < EMA13, bearish alignment | KDJ moving weakly, bears have the upper hand (K: 40.4, D: 45.1) | Volume increased (1.7x)
Price change: -0.2300%
📉 $SOON | 30-minute bearish signal
━━━━━━━━━━━━━━━━━━
Technical analysis: ADX(39) Clear trending market | MACD bearish crossover below zero, bearish momentum accelerating | EMA5 crossed below EMA8, short-term outlook turns bearish | KDJ bearish crossover, short-term outlook bearish (K: 45.7, D: 58.0) | Volume surged (3.7x)
Price change: -8.5900%
📉 $牛来 | 30-minute bearish signal
━━━━━━━━━━━━━━━━━━
Technical analysis: ADX(25) Trend is forming; opportunity to participate | MACD DIF fell below the zero line, signaling a bearish trend | EMA5 crossed below EMA8, short-term outlook turns bearish | KDJ bearish crossover, short-term outlook bearish (K: 51.2, D: 54.9) | Volume increased (2.0x)
Price change: -0.4200%
━━━━━━━━━━━━━━━━━━
#技术分析 #MON #SOON #牛来
📌 The above is for reference only and does not constitute investment advice
36
·
--
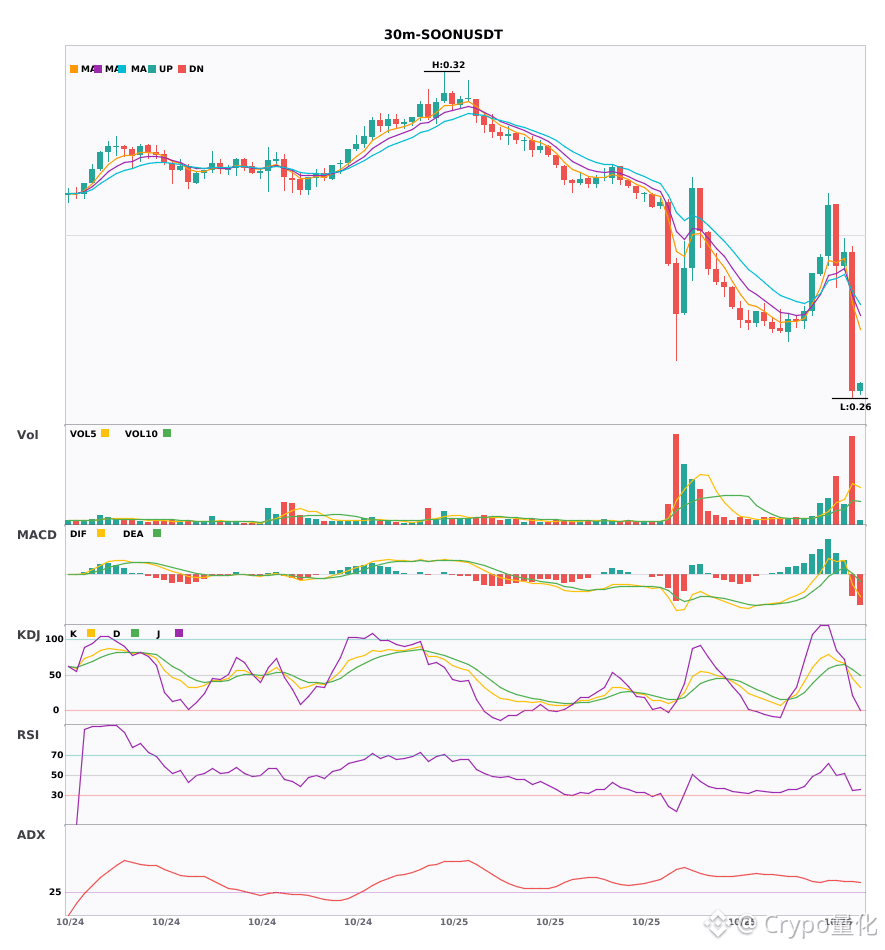
$MON / $SOON / $Bull Arrives: 30-minute technical indicators are weakening simultaneously. Watch out for risk 🔥
════════════════════
🟢 $MON — 30-minute bearish signal
⚠️Technical analysis: ADX(26): A trend is forming; entry may be considered | MACD DIF falls below the zero line, signaling a bearish trend | EMA5 < EMA8 < EMA13, bearish alignment | KDJ is weak, with bears in control (K: 40.4, D: 45.1) | Trading volume increases (1.7x)
════════════════════
🟢 $SOON — 30-minute bearish signal
⚠️Technical analysis: ADX(39): A clear trending market | MACD forms a bearish crossover below zero, accelerating bearish momentum | EMA5 crosses below EMA8, turning bearish in the short term | KDJ bearish crossover, short-term outlook is bearish (K: 45.7, D: 58.0) | Trading volume surges (3.7x)
════════════════════
🟢 $Bull Arrives — 30-minute bearish signal
⚠️Technical analysis: ADX(25): A trend is forming; entry may be considered | MACD DIF falls below the zero line, signaling a bearish trend | EMA5 crosses below EMA8, turning bearish in the short term | KDJ bearish crossover, short-term outlook is bearish (K: 51.2, D: 54.9) | Trading volume increases (2.0x)
════════════════════
🔔 Follow for the latest market alerts 🔔
#技术分析 #MON #SOON #牛来
📌 When trading, pay attention to whether the candlestick pattern confirms the signal
════════════════════
🟢 $MON — 30-minute bearish signal
⚠️Technical analysis: ADX(26): A trend is forming; entry may be considered | MACD DIF falls below the zero line, signaling a bearish trend | EMA5 < EMA8 < EMA13, bearish alignment | KDJ is weak, with bears in control (K: 40.4, D: 45.1) | Trading volume increases (1.7x)
════════════════════
🟢 $SOON — 30-minute bearish signal
⚠️Technical analysis: ADX(39): A clear trending market | MACD forms a bearish crossover below zero, accelerating bearish momentum | EMA5 crosses below EMA8, turning bearish in the short term | KDJ bearish crossover, short-term outlook is bearish (K: 45.7, D: 58.0) | Trading volume surges (3.7x)
════════════════════
🟢 $Bull Arrives — 30-minute bearish signal
⚠️Technical analysis: ADX(25): A trend is forming; entry may be considered | MACD DIF falls below the zero line, signaling a bearish trend | EMA5 crosses below EMA8, turning bearish in the short term | KDJ bearish crossover, short-term outlook is bearish (K: 51.2, D: 54.9) | Trading volume increases (2.0x)
════════════════════
🔔 Follow for the latest market alerts 🔔
#技术分析 #MON #SOON #牛来
📌 When trading, pay attention to whether the candlestick pattern confirms the signal
26

·
--
Article
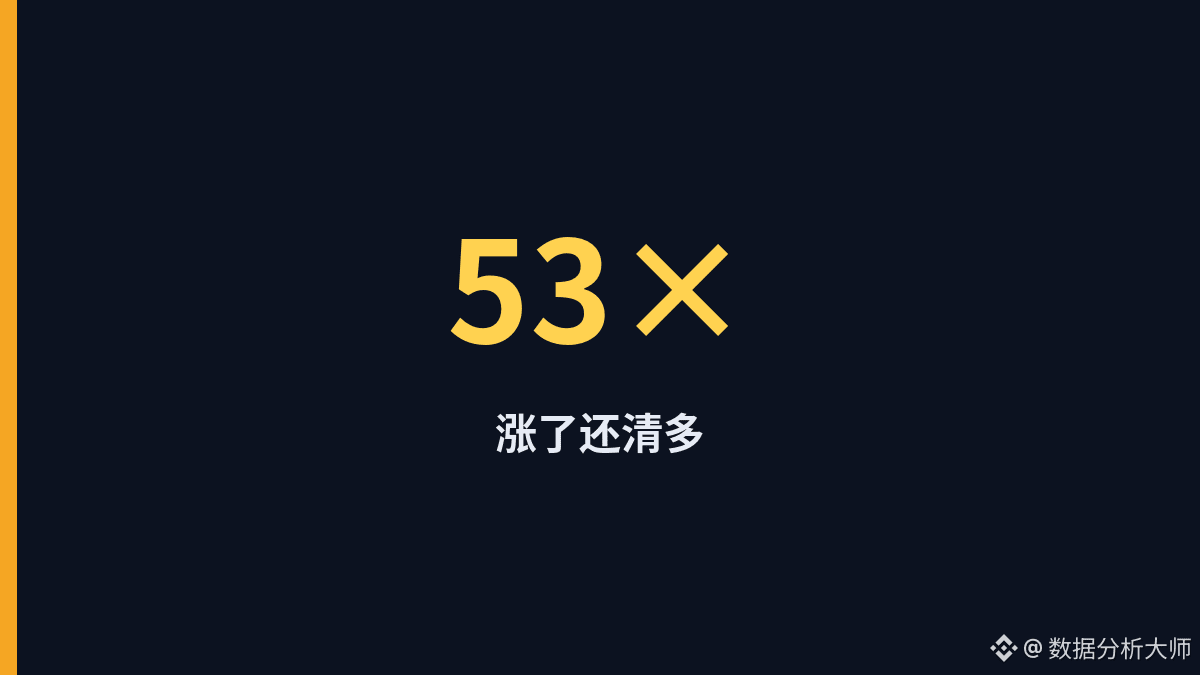
MON up nearly 3%, but long liquidations are over 50 times higher—why?The price is up nearly 3%, yet MON's liquidations over the past day have almost entirely hit longs—about $25,246 in longs versus roughly $473 in shorts, a gap of around 53.4x.
Binance: about $0.02105000 (+2.9340%); OKX: about $0.02105000 (+3.1357%). Long liquidations over 24 hours totaled about $25,246, versus about $473 for shorts, for roughly $25,719 across 18 liquidations. Open interest was about 22.09 million on Binance and 3.64 million on OKX; the long/short account ratio was about 59.4%/40.6%.
A modest rise coupled with one-sided long liquidations looks more like overheated longs being flushed out during an uptrend than a two-sided sell-off amid a deep decline.
#MON #价仓背离 #爆仓 #PerpetualFuturesMarket
MON up nearly 3%, but long liquidations are over 50 times higher—why?
The price is up nearly 3%, yet MON's liquidations over the past day have almost entirely hit longs—about $25,246 in longs versus roughly $473 in shorts, a gap of around 53.4x.
Binance: about $0.02105000 (+2.9340%); OKX: about $0.02105000 (+3.1357%). Long liquidations over 24 hours totaled about $25,246, versus about $473 for shorts, for roughly $25,719 across 18 liquidations. Open interest was about 22.09 million on Binance and 3.64 million on OKX; the long/short account ratio was about 59.4%/40.6%.
A modest rise coupled with one-sided long liquidations looks more like overheated longs being flushed out during an uptrend than a two-sided sell-off amid a deep decline.
#MON #价仓背离 #爆仓 #PerpetualFuturesMarket
·
--
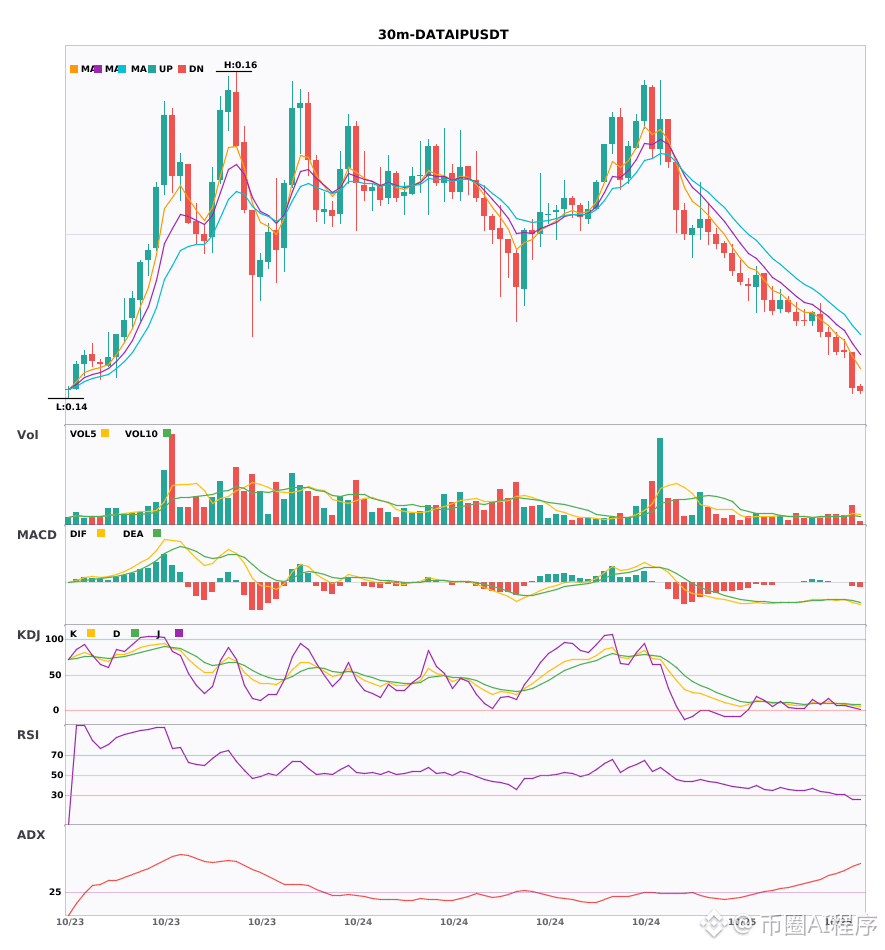
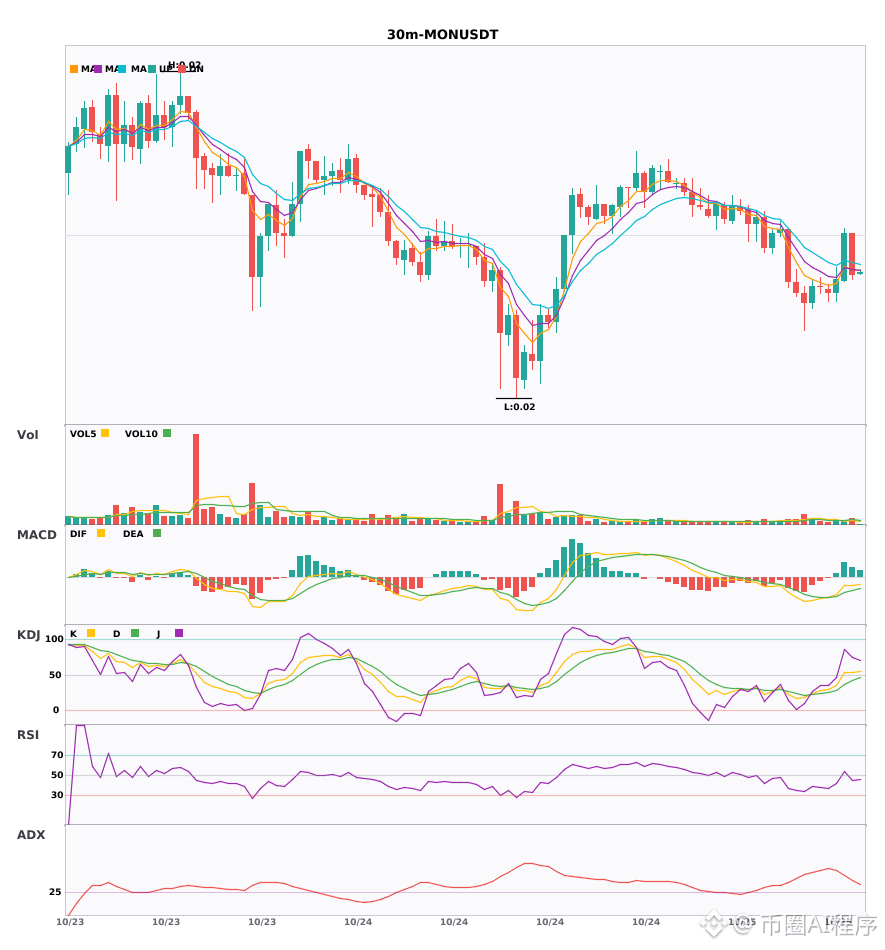
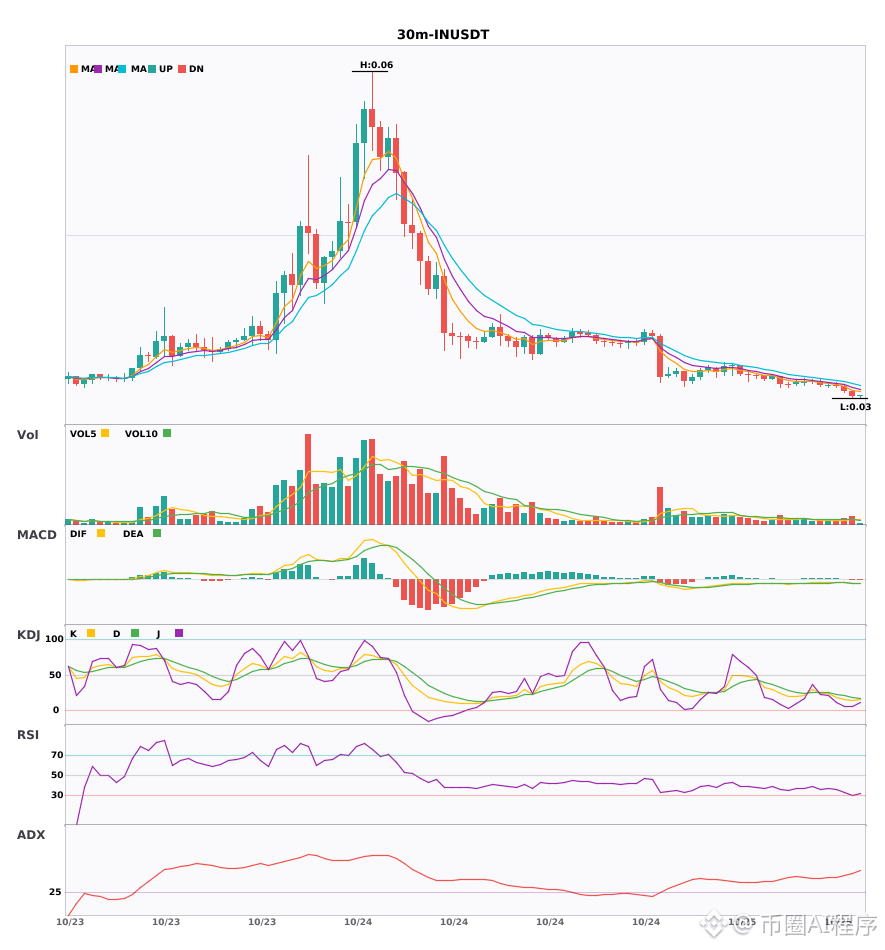
$DATAIP / $MON / $IN 30-minute bearish signals, 4-hour bearish trend confirmed 🔥
════════════════════
🟢 $DATAIP 30-minute bearish signal
⚠️Technical analysis: 4-hour bearish confluence confirmed | 30-minute entry: MACD death cross below zero, bearish momentum accelerating | EMA5 < EMA8 < EMA13, bearish alignment | KDJ in oversold territory; watch for a potential rebound (K=7.8, D=9.2) | Volume increased (2.0x)
════════════════════
🟢 $MON 30-minute bearish signal
⚠️Technical analysis: 4-hour bearish confluence confirmed | 30-minute entry: EMA5 crossed below EMA8, short-term outlook turns bearish | Volume normal (1.3x)
════════════════════
🟢 $IN 30-minute bearish signal
⚠️Technical analysis: 4-hour bearish confluence confirmed | 30-minute entry: MACD death cross below zero, bearish momentum accelerating | EMA5 < EMA8 < EMA13, bearish alignment | KDJ showing weakness, bears in control (K=16.0, D=20.7) | Volume normal (1.3x)
════════════════════
🔔 Follow for first-hand market alerts 🔔
#多周期共振 #DATAIP #MON #IN
📌 When trading, pay attention to whether the candlestick pattern matches.
════════════════════
🟢 $DATAIP 30-minute bearish signal
⚠️Technical analysis: 4-hour bearish confluence confirmed | 30-minute entry: MACD death cross below zero, bearish momentum accelerating | EMA5 < EMA8 < EMA13, bearish alignment | KDJ in oversold territory; watch for a potential rebound (K=7.8, D=9.2) | Volume increased (2.0x)
════════════════════
🟢 $MON 30-minute bearish signal
⚠️Technical analysis: 4-hour bearish confluence confirmed | 30-minute entry: EMA5 crossed below EMA8, short-term outlook turns bearish | Volume normal (1.3x)
════════════════════
🟢 $IN 30-minute bearish signal
⚠️Technical analysis: 4-hour bearish confluence confirmed | 30-minute entry: MACD death cross below zero, bearish momentum accelerating | EMA5 < EMA8 < EMA13, bearish alignment | KDJ showing weakness, bears in control (K=16.0, D=20.7) | Volume normal (1.3x)
════════════════════
🔔 Follow for first-hand market alerts 🔔
#多周期共振 #DATAIP #MON #IN
📌 When trading, pay attention to whether the candlestick pattern matches.
34
·
--

Article
MON Barely Moved—So Why Were Long Liquidations Nearly 215 Times Higher?MON fell less than 0.2% on both platforms, yet over the past day about $102,000 in longs were liquidated, compared with just about $474 in shorts—a roughly 215-to-1 disparity. The price stayed nearly flat, but liquidations overwhelmingly hit longs.
Binance: about $0.02117000 (-0.1420%); OKX: about $0.02117000 (-0.0944%). Over 24 hours, about $102,000 in longs and $474 in shorts were liquidated, for a total of about $102,400 across 49 liquidations. Open interest was about 22.27 million on Binance and 3.7 million on OKX. Binance's funding rate was slightly negative, near zero. The long/short account ratio was about 57.8%/42.2%.
The price barely moved, yet long liquidations were nearly 215 times short liquidations—a pattern more consistent with highly leveraged longs getting singled out and swept away in a narrow trading range than with bulls and bears trading against each other in a trending market.
MON Barely Moved—So Why Were Long Liquidations Nearly 215 Times Higher?
MON fell less than 0.2% on both platforms, yet over the past day about $102,000 in longs were liquidated, compared with just about $474 in shorts—a roughly 215-to-1 disparity. The price stayed nearly flat, but liquidations overwhelmingly hit longs.
Binance: about $0.02117000 (-0.1420%); OKX: about $0.02117000 (-0.0944%). Over 24 hours, about $102,000 in longs and $474 in shorts were liquidated, for a total of about $102,400 across 49 liquidations. Open interest was about 22.27 million on Binance and 3.7 million on OKX. Binance's funding rate was slightly negative, near zero. The long/short account ratio was about 57.8%/42.2%.
The price barely moved, yet long liquidations were nearly 215 times short liquidations—a pattern more consistent with highly leveraged longs getting singled out and swept away in a narrow trading range than with bulls and bears trading against each other in a trending market.
10

·
--
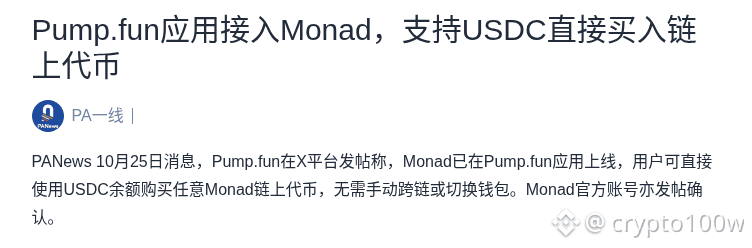
Pump.fun integrates Monad, enabling direct purchases of on-chain tokens with USDC.
Pump.fun posted on X that Monad is now live in the Pump.fun app. Users can use their USDC balance to buy any token on Monad directly, without manually bridging assets or switching wallets. Monad’s official account also confirmed the news. Source: PANews, October 25.
For Monad, this adds liquidity and a new user entry point: Pump.fun’s existing funds and trading habits can flow in directly, eliminating cross-chain friction. In the short term, this could bring a wave of attention and trading volume to newly launched tokens in the Monad ecosystem, making the overall development positive for the ecosystem. But Pump.fun is itself a highly volatile, speculative trading arena. Buying directly with USDC lowers the barrier to entry, but could also make FOMO buying and sell-offs more intense in the early stages of new token launches.
Watchpoint 1: If liquidity and holder concentration for newly launched tokens do not improve, higher short-term trading volume could come with sharper pullbacks. Watchpoint 2: The depth of demand for new tokens is worth tracking only if funds brought in through this entry point remain in the Monad ecosystem. Which matters more to you: the trading volume generated by this entry point, or the depth of demand for new tokens?
Assets: MON and newly launched tokens in the Monad ecosystem. Source: PANews.
#MON
Image 1: Pump.fun integrates Monad, enabling direct purchases of on-chain tokens with USDC · Screenshot of the source page
Image source: https://www.panewslab.com/zh/articles/01a16ed7-b646-760b-87e7-e432baacef98
5

·
--
Bullish
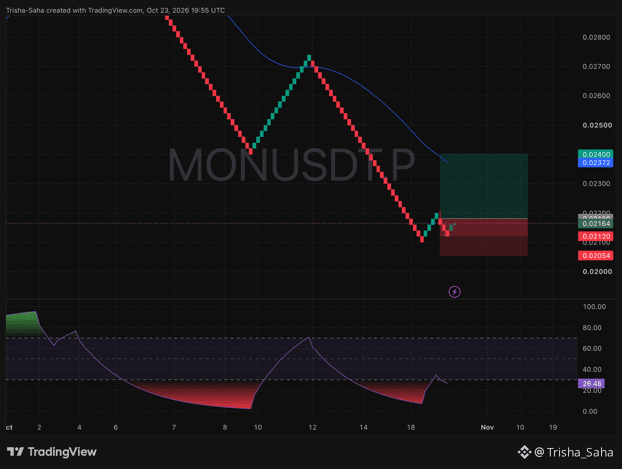
👑 $MON Higher Low Confirmed — Bulls Are Ready To Send This Vertical! 💸
📍 Trade Setup:
• Entry Zone: $0.02120 – $0.02180
• Stop Loss: $0.02054
• Target: $0.02400
• Sellers tried to break the floor and failed, leaving a clean higher low at $0.02120 with fresh green candles stepping right back in.
• Our bottom momentum line already bounced out of the red danger zone and is holding steady at 26.46, proving the sell-off has lost its teeth.
• There is a wide-open pocket of air straight up to the blue trend line at $0.02372 and our final $0.02400 take-profit zone.
🛡️ Move your Stop Loss straight to Break-Even the moment you see +3% to +4% profit so you can ride this pump with zero stress.
I'm already loaded up at $0.02164 and waiting for the explosion. Are you jumping in on $MON with me or watching from the sidelines? Drop a comment below! 👇
#MON #MONUSDT #CryptoSignals #BinanceSquare
{future}(MONUSDT)
👑 $MON Higher Low Confirmed — Bulls Are Ready To Send This Vertical! 💸
📍 Trade Setup:
• Entry Zone: $0.02120 – $0.02180
• Stop Loss: $0.02054
• Target: $0.02400
• Sellers tried to break the floor and failed, leaving a clean higher low at $0.02120 with fresh green candles stepping right back in.
• Our bottom momentum line already bounced out of the red danger zone and is holding steady at 26.46, proving the sell-off has lost its teeth.
• There is a wide-open pocket of air straight up to the blue trend line at $0.02372 and our final $0.02400 take-profit zone.
🛡️ Move your Stop Loss straight to Break-Even the moment you see +3% to +4% profit so you can ride this pump with zero stress.
I'm already loaded up at $0.02164 and waiting for the explosion. Are you jumping in on $MON with me or watching from the sidelines? Drop a comment below! 👇
#MON #MONUSDT #CryptoSignals #BinanceSquare
500
·
--
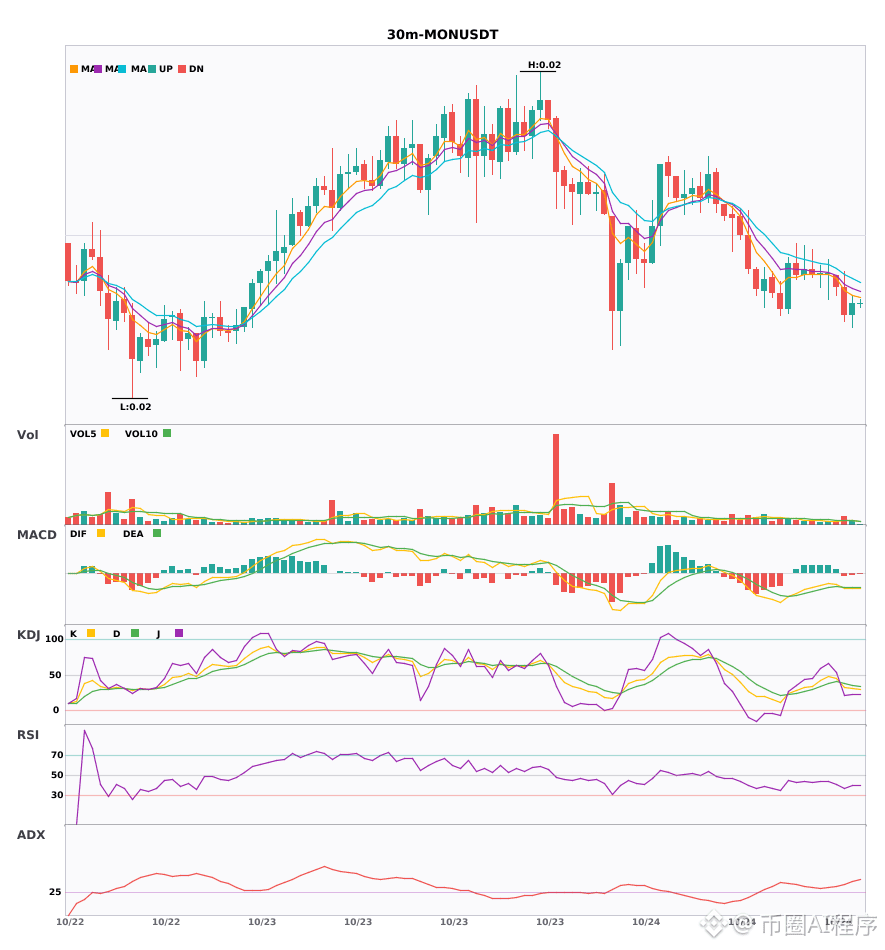
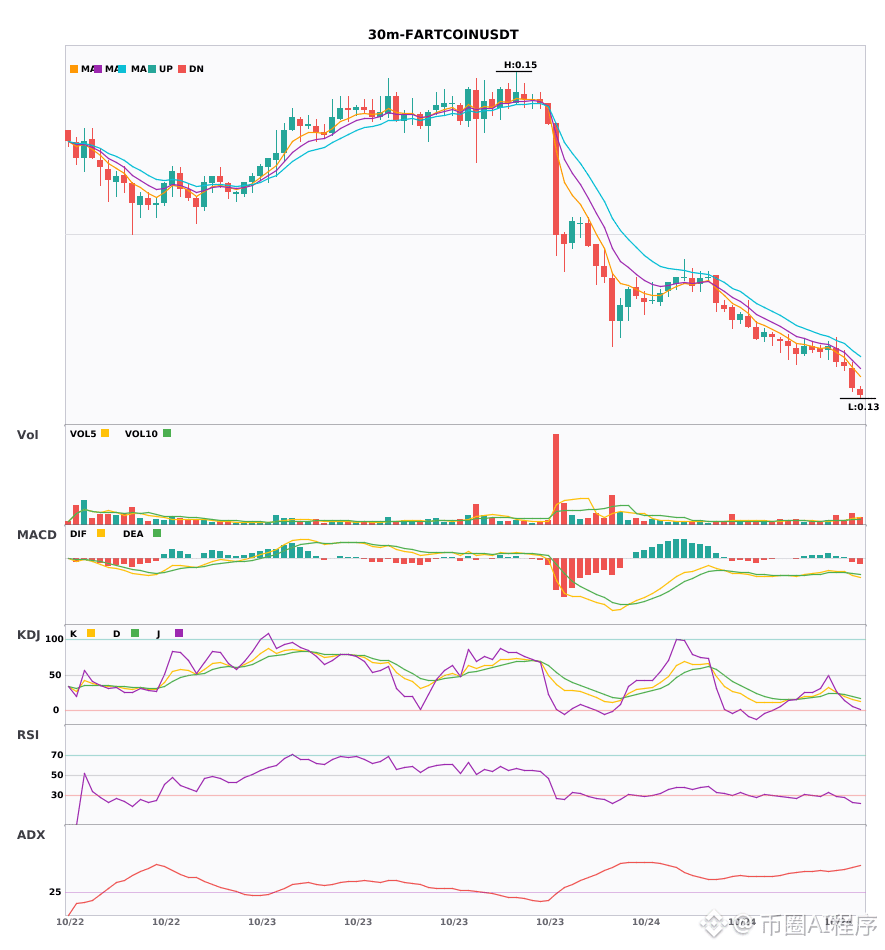
Multi-timeframe confluence: $MON / $FARTCOIN / $S weakening on the 30-minute chart; 4-hour bearish trend confirmed 🔥
════════════════════
🟢 $MON — 30-minute bearish signal
⚠️Technical analysis: 4-hour bearish confluence confirmed | 30-minute entry: MACD bearish cross below zero, bearish momentum accelerating | EMA5 < EMA8 < EMA13, bearish alignment | KDJ bearish cross, short-term outlook bearish (K=32.4, D=37.8) | Volume increased (1.9x)
════════════════════
🟢 $FARTCOIN — 30-minute bearish signal
⚠️Technical analysis: 4-hour bearish confluence confirmed | 30-minute entry: MACD bearish cross below zero, bearish momentum accelerating | EMA5 < EMA8 < EMA13, bearish alignment | KDJ trending weakly, bears in control (K=15.4, D=20.4) | Volume increased (2.1x)
════════════════════
🟢 $S — 30-minute bearish signal
⚠️Technical analysis: 4-hour bearish confluence confirmed | 30-minute entry: MACD bearish cross below zero, bearish momentum accelerating | EMA5 < EMA8 < EMA13, bearish alignment | KDJ trending weakly, bears in control (K=25.4, D=32.9) | Volume increased (2.1x)
════════════════════
🔔 Follow for first-hand market alerts 🔔
#多周期共振 #MON #FARTCOIN #S
📌 When trading, pay attention to whether the candlestick pattern meets the criteria.
════════════════════
🟢 $MON — 30-minute bearish signal
⚠️Technical analysis: 4-hour bearish confluence confirmed | 30-minute entry: MACD bearish cross below zero, bearish momentum accelerating | EMA5 < EMA8 < EMA13, bearish alignment | KDJ bearish cross, short-term outlook bearish (K=32.4, D=37.8) | Volume increased (1.9x)
════════════════════
🟢 $FARTCOIN — 30-minute bearish signal
⚠️Technical analysis: 4-hour bearish confluence confirmed | 30-minute entry: MACD bearish cross below zero, bearish momentum accelerating | EMA5 < EMA8 < EMA13, bearish alignment | KDJ trending weakly, bears in control (K=15.4, D=20.4) | Volume increased (2.1x)
════════════════════
🟢 $S — 30-minute bearish signal
⚠️Technical analysis: 4-hour bearish confluence confirmed | 30-minute entry: MACD bearish cross below zero, bearish momentum accelerating | EMA5 < EMA8 < EMA13, bearish alignment | KDJ trending weakly, bears in control (K=25.4, D=32.9) | Volume increased (2.1x)
════════════════════
🔔 Follow for first-hand market alerts 🔔
#多周期共振 #MON #FARTCOIN #S
📌 When trading, pay attention to whether the candlestick pattern meets the criteria.
10
Log in to explore more content
Join global crypto users on Binance Square
⚡️ Get latest and useful information about crypto.
💬 Trusted by the world’s largest crypto exchange.
👍 Discover real insights from verified creators.
Email / Phone number
Trending Topics
1
#UniswapA16zSeekDeFiExemptionFromIllinoisCryptoTax
2,541 views
233 Discussing
2
#HKDollarStablecoinHKDAPToLaunchOnSolana
776 views
100 Discussing
3
#$1.5BInLeveragedCryptoBetsLiquidated
13,355 views
172 Discussing
4
#TrezorSaysCryptoBilisSoldWalletMayContainMaliciousComponents
288 views
21 Discussing
5
#KOSPIFalls3.53%BackBelow6000
36,212 views
786 Discussing
6
#AmazonSharesFallAbout7%InPremarketTrading
13,620 views
385 Discussing
7
#USMidtermElections
173,775 views
2,038 Discussing
8
#StrategySTRCReaches$99.95ForFirstTimeIn165Days
6,657 views
88 Discussing
9
#BinanceWillListPredictPREDICT
57,303 views
1,125 Discussing
10
#SwitzerlandFirstSpotBitcoinETFExpectedToTradeInNovember
1,863 views
94 Discussing