
#janction
janction
53,646 views
303 Discussing
Hot
Latest

·
--
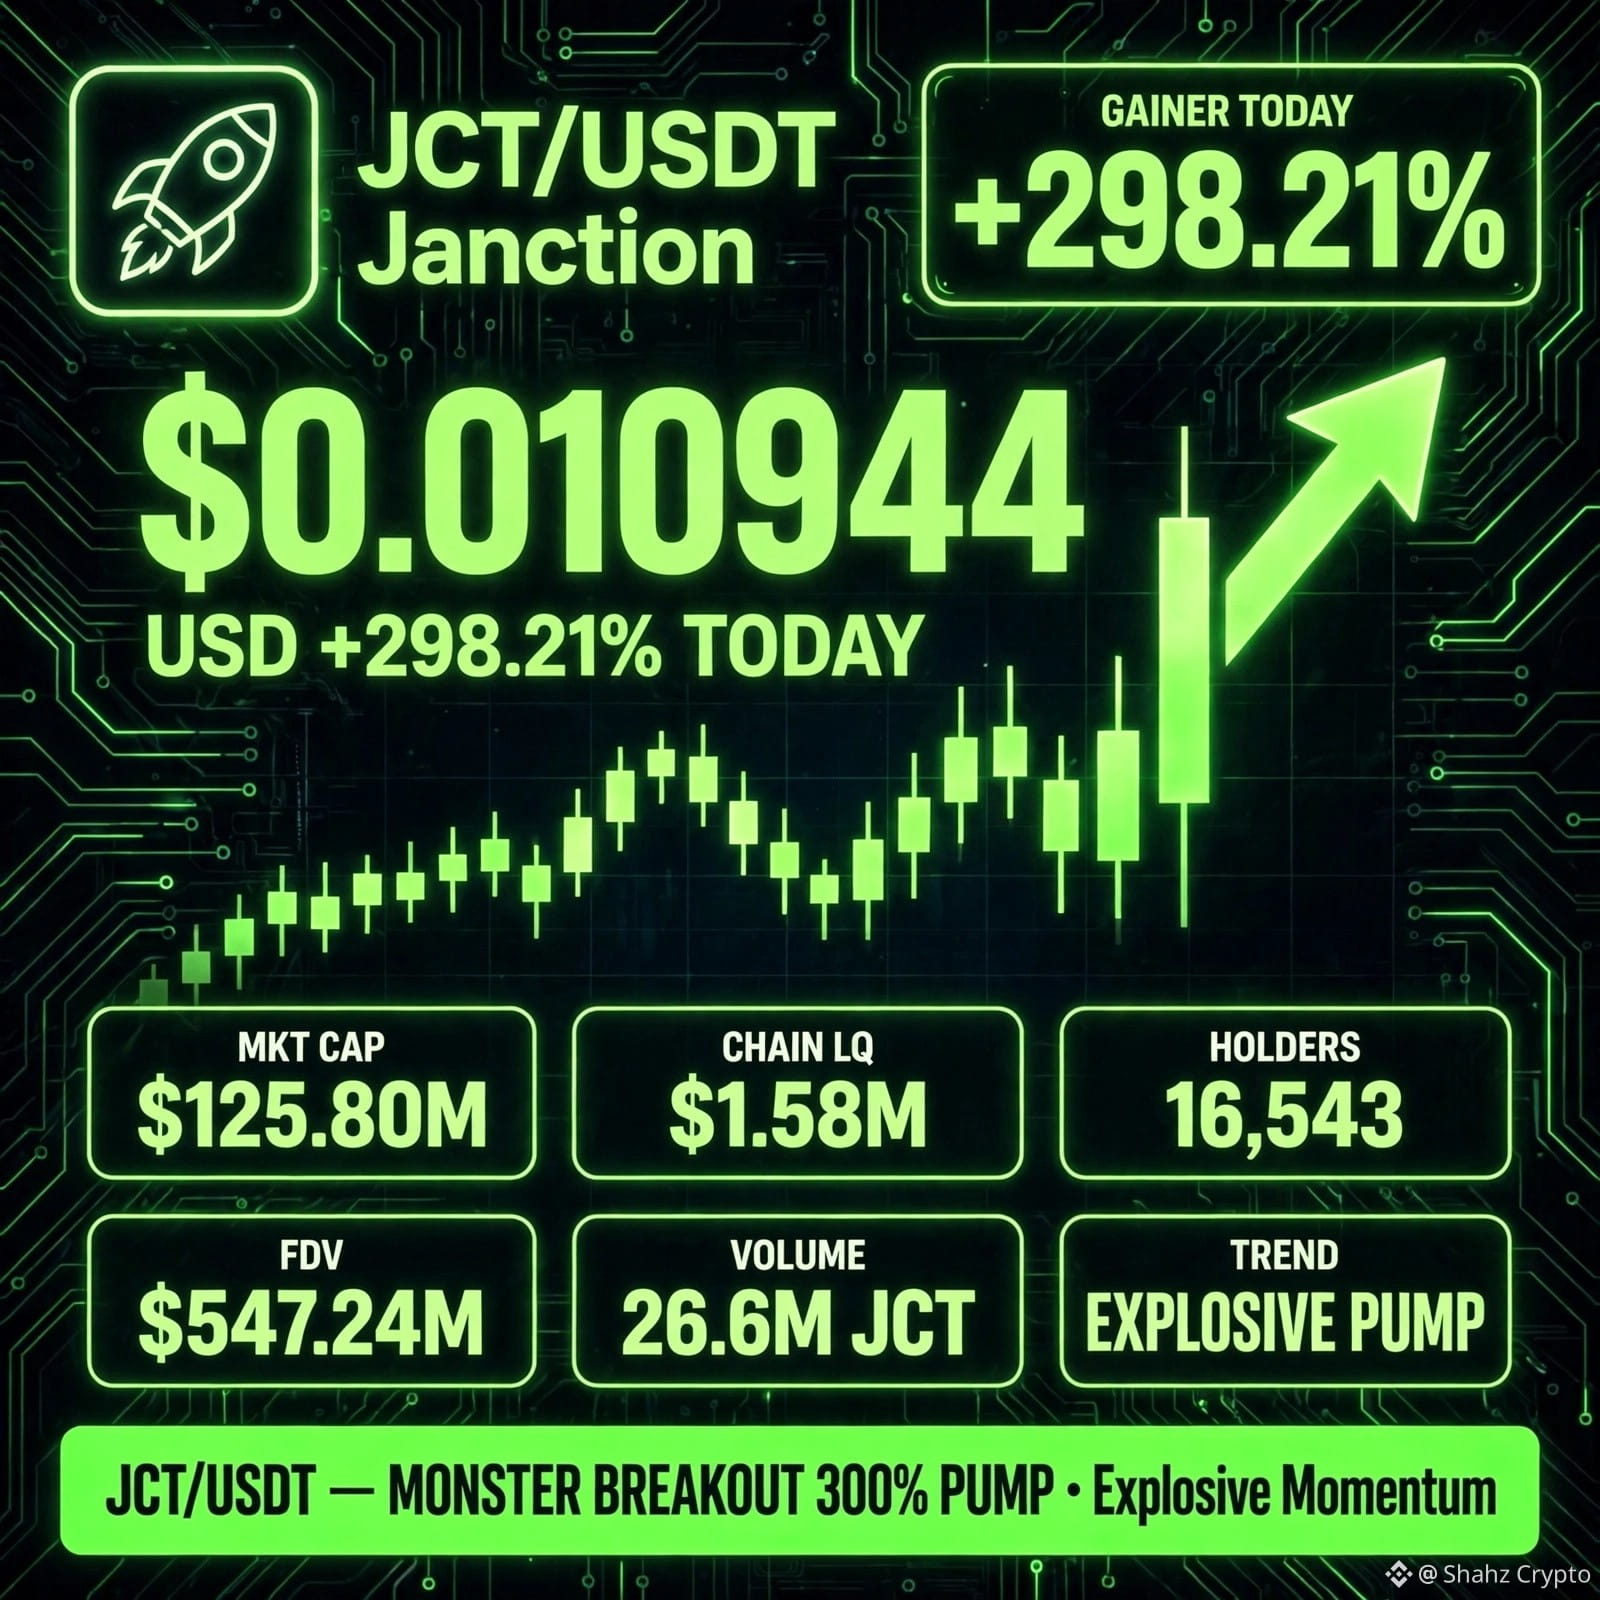
JCT EXPLODES 🔥 +298% in 1 Candle — Janction Goes Parabolic!
🚀 $JCT — MONSTER PUMP 🚀
💰 $0.010944 (+298.21%)
📈 Mkt Cap: $125.80M | FDV: $547.24M
👥 Holders: 16,543 | Vol: 26.6M JCT
🔥 One Candle 300% Explosion!
$JCT
{future}(JCTUSDT)
Janction waking up — parabolic move!
@Square-Creator-b8a928ffbb89
#JCTUSDT #Janction #CryptoPump #100xGem
JCT EXPLODES 🔥 +298% in 1 Candle — Janction Goes Parabolic!
🚀 $JCT — MONSTER PUMP 🚀
💰 $0.010944 (+298.21%)
📈 Mkt Cap: $125.80M | FDV: $547.24M
👥 Holders: 16,543 | Vol: 26.6M JCT
🔥 One Candle 300% Explosion!
$JCT
Janction waking up — parabolic move!
@JCT
#JCTUSDT #Janction #CryptoPump #100xGem
🚀 $JCT — MONSTER PUMP 🚀
💰 $0.010944 (+298.21%)
📈 Mkt Cap: $125.80M | FDV: $547.24M
👥 Holders: 16,543 | Vol: 26.6M JCT
🔥 One Candle 300% Explosion!
$JCT
Janction waking up — parabolic move!
@JCT
#JCTUSDT #Janction #CryptoPump #100xGem
746


·
--
$JCT short — Rejection after parabolic pump, targeting lower support 🩸
JCT exploded +186% today and is now showing exhaustion near the highs. Price is being heavily rejected around the $0.0030-$0.0035 zone after the massive rally. A clean 4H close below the $0.0028 support will confirm the breakdown and open the path toward lower levels.
Entry: 4H close below $0.0028
SL: Above $0.0035 (recent rejection zone)
Target 1: $0.0025
Target 2: $0.0022
If price reclaims and holds above $0.0035, the setup is invalid — cut your losses.
$JCT
{future}(JCTUSDT)
DYOR. NFA. Extremely high volatility, use strict risk management.
#JCT #Janction #TradeIdea
$JCT short — Rejection after parabolic pump, targeting lower support 🩸
JCT exploded +186% today and is now showing exhaustion near the highs. Price is being heavily rejected around the $0.0030-$0.0035 zone after the massive rally. A clean 4H close below the $0.0028 support will confirm the breakdown and open the path toward lower levels.
Entry: 4H close below $0.0028
SL: Above $0.0035 (recent rejection zone)
Target 1: $0.0025
Target 2: $0.0022
If price reclaims and holds above $0.0035, the setup is invalid — cut your losses.
$JCT
DYOR. NFA. Extremely high volatility, use strict risk management.
#JCT #Janction #TradeIdea
JCT exploded +186% today and is now showing exhaustion near the highs. Price is being heavily rejected around the $0.0030-$0.0035 zone after the massive rally. A clean 4H close below the $0.0028 support will confirm the breakdown and open the path toward lower levels.
Entry: 4H close below $0.0028
SL: Above $0.0035 (recent rejection zone)
Target 1: $0.0025
Target 2: $0.0022
If price reclaims and holds above $0.0035, the setup is invalid — cut your losses.
$JCT
DYOR. NFA. Extremely high volatility, use strict risk management.
#JCT #Janction #TradeIdea
1
474

·
--
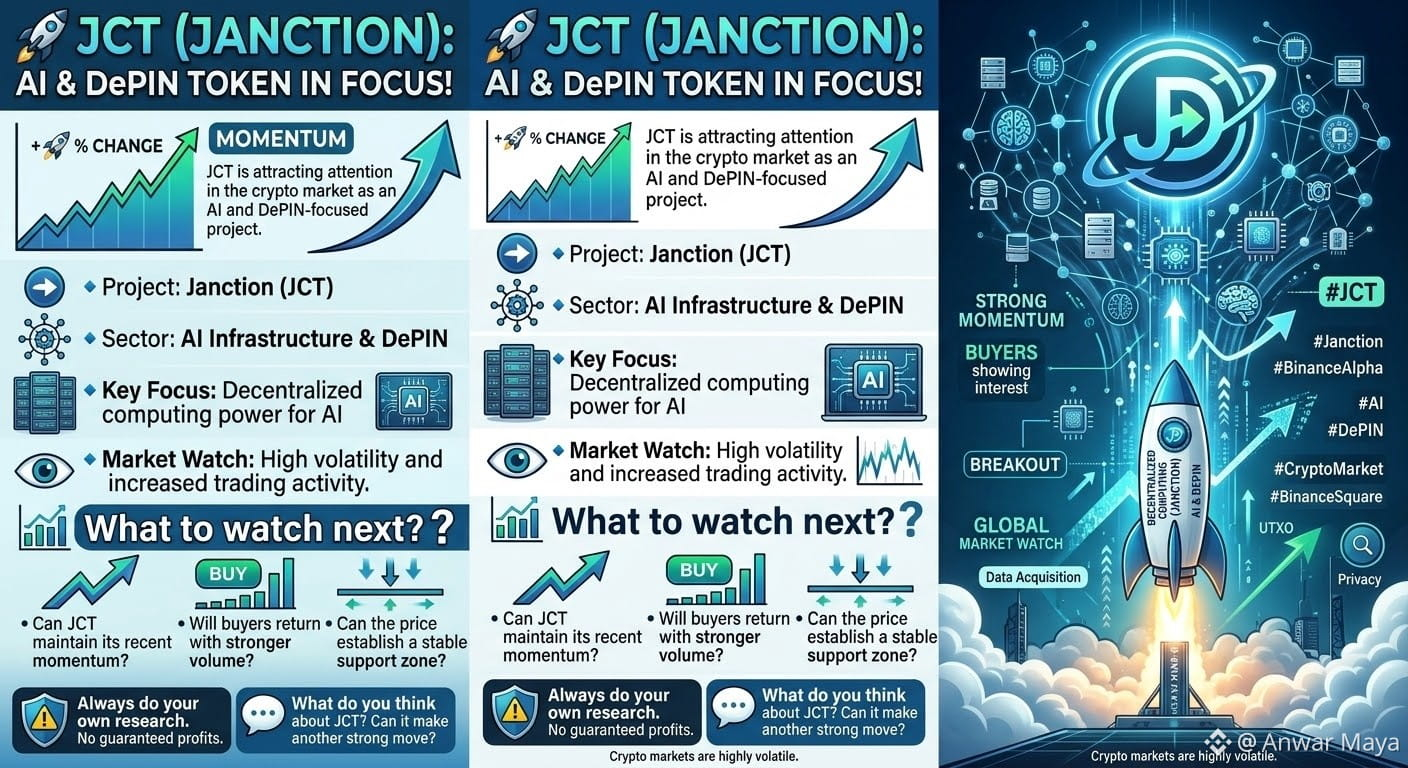
🚀 JCT (JANCTION): AI & DePIN TOKEN IN FOCUS!
$JCT is attracting attention in the crypto market as an AI and DePIN-focused project.
🔹 Project: Janction (JCT)
🔹 Sector: AI Infrastructure & DePIN
🔹 Key Focus: Decentralized computing power for AI
🔹 Market Watch: High volatility and increased trading activity.
📊 What to watch next?
• Can JCT maintain its recent momentum?
• Will buyers return with stronger volume?
• Can the price establish a stable support zone?
$JCT is an interesting project to keep on the market watchlist, but volatility remains high.
⚠️ Always do your own research. No guaranteed profits.
💬 What do you think about JCT? Can it make another strong move?
#JCT #Janction
{future}(JCTUSDT)
#BinanceAlpha #AI #DePIN #CryptoMarket #BinanceSquare
🚀 JCT (JANCTION): AI & DePIN TOKEN IN FOCUS!
$JCT is attracting attention in the crypto market as an AI and DePIN-focused project.
🔹 Project: Janction (JCT)
🔹 Sector: AI Infrastructure & DePIN
🔹 Key Focus: Decentralized computing power for AI
🔹 Market Watch: High volatility and increased trading activity.
📊 What to watch next?
• Can JCT maintain its recent momentum?
• Will buyers return with stronger volume?
• Can the price establish a stable support zone?
$JCT is an interesting project to keep on the market watchlist, but volatility remains high.
⚠️ Always do your own research. No guaranteed profits.
💬 What do you think about JCT? Can it make another strong move?
#JCT #Janction
#BinanceAlpha #AI #DePIN #CryptoMarket #BinanceSquare
$JCT is attracting attention in the crypto market as an AI and DePIN-focused project.
🔹 Project: Janction (JCT)
🔹 Sector: AI Infrastructure & DePIN
🔹 Key Focus: Decentralized computing power for AI
🔹 Market Watch: High volatility and increased trading activity.
📊 What to watch next?
• Can JCT maintain its recent momentum?
• Will buyers return with stronger volume?
• Can the price establish a stable support zone?
$JCT is an interesting project to keep on the market watchlist, but volatility remains high.
⚠️ Always do your own research. No guaranteed profits.
💬 What do you think about JCT? Can it make another strong move?
#JCT #Janction
#BinanceAlpha #AI #DePIN #CryptoMarket #BinanceSquare
452

·
--
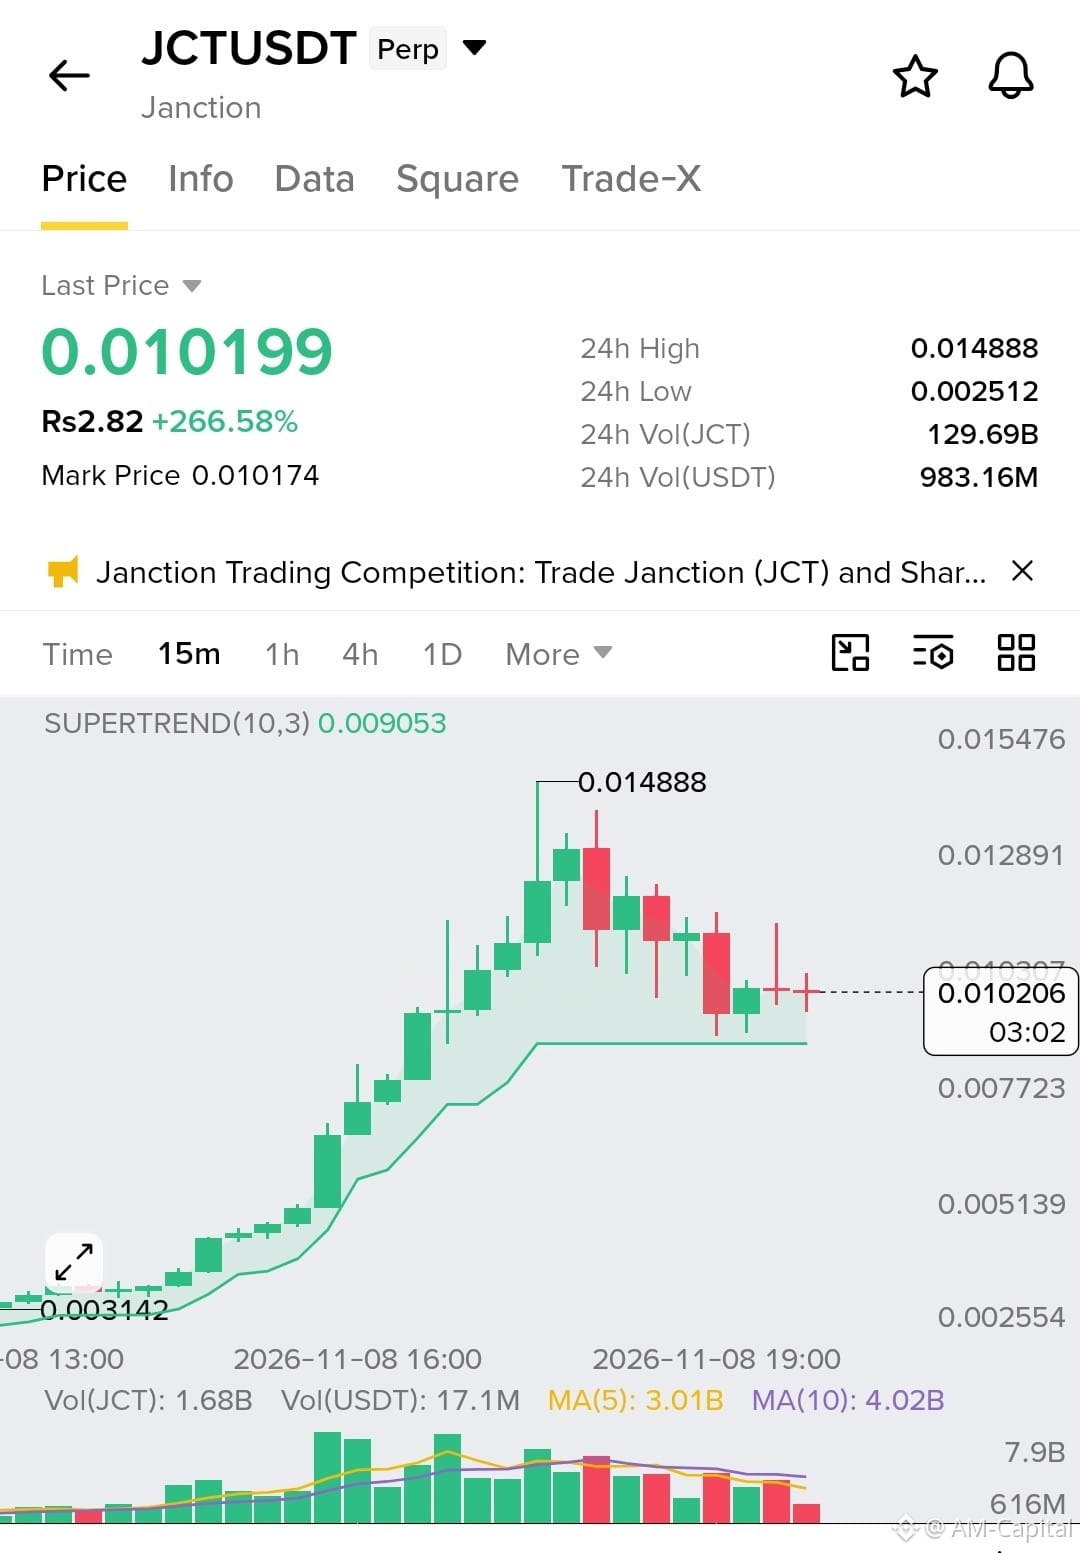
I’m watching $JCT USDT closely after Janction surged 273.74%, reaching $0.010334 (Rs2.85). This explosive move signals strong buying interest, but I’m cautious about chasing an extended rally. My strategy is to wait for a healthy pullback and confirmation before entering.
Trade Setup (Speculative):
Entry: $0.00980–$0.01010
Stop-Loss: $0.00920
TP1: $0.01080
TP2: $0.01150
TP3: $0.01220
I’ll monitor volume, support, and candle closes. I’ll avoid excessive leverage and secure partial profits along the way.
#JCTUSDT #Janction #Binance
I’m watching $JCT USDT closely after Janction surged 273.74%, reaching $0.010334 (Rs2.85). This explosive move signals strong buying interest, but I’m cautious about chasing an extended rally. My strategy is to wait for a healthy pullback and confirmation before entering.
Trade Setup (Speculative):
Entry: $0.00980–$0.01010
Stop-Loss: $0.00920
TP1: $0.01080
TP2: $0.01150
TP3: $0.01220
I’ll monitor volume, support, and candle closes. I’ll avoid excessive leverage and secure partial profits along the way.
#JCTUSDT #Janction #Binance
Trade Setup (Speculative):
Entry: $0.00980–$0.01010
Stop-Loss: $0.00920
TP1: $0.01080
TP2: $0.01150
TP3: $0.01220
I’ll monitor volume, support, and candle closes. I’ll avoid excessive leverage and secure partial profits along the way.
#JCTUSDT #Janction #Binance
1.1k

·
--
$JCT went vertical — up about 340% near $0.012 on $219M volume, one of the day's most-searched names, with no headline behind it. $BTC is flat near $75,990. Hold $0.01 and the squeeze keeps going; lose it and it gives back fast. Chasing it or watching? #Janction #CryptoMarket #Write2Earn
$JCT went vertical — up about 340% near $0.012 on $219M volume, one of the day's most-searched names, with no headline behind it. $BTC is flat near $75,990. Hold $0.01 and the squeeze keeps going; lose it and it gives back fast. Chasing it or watching? #Janction #CryptoMarket #Write2Earn
4

·
--
Bearish
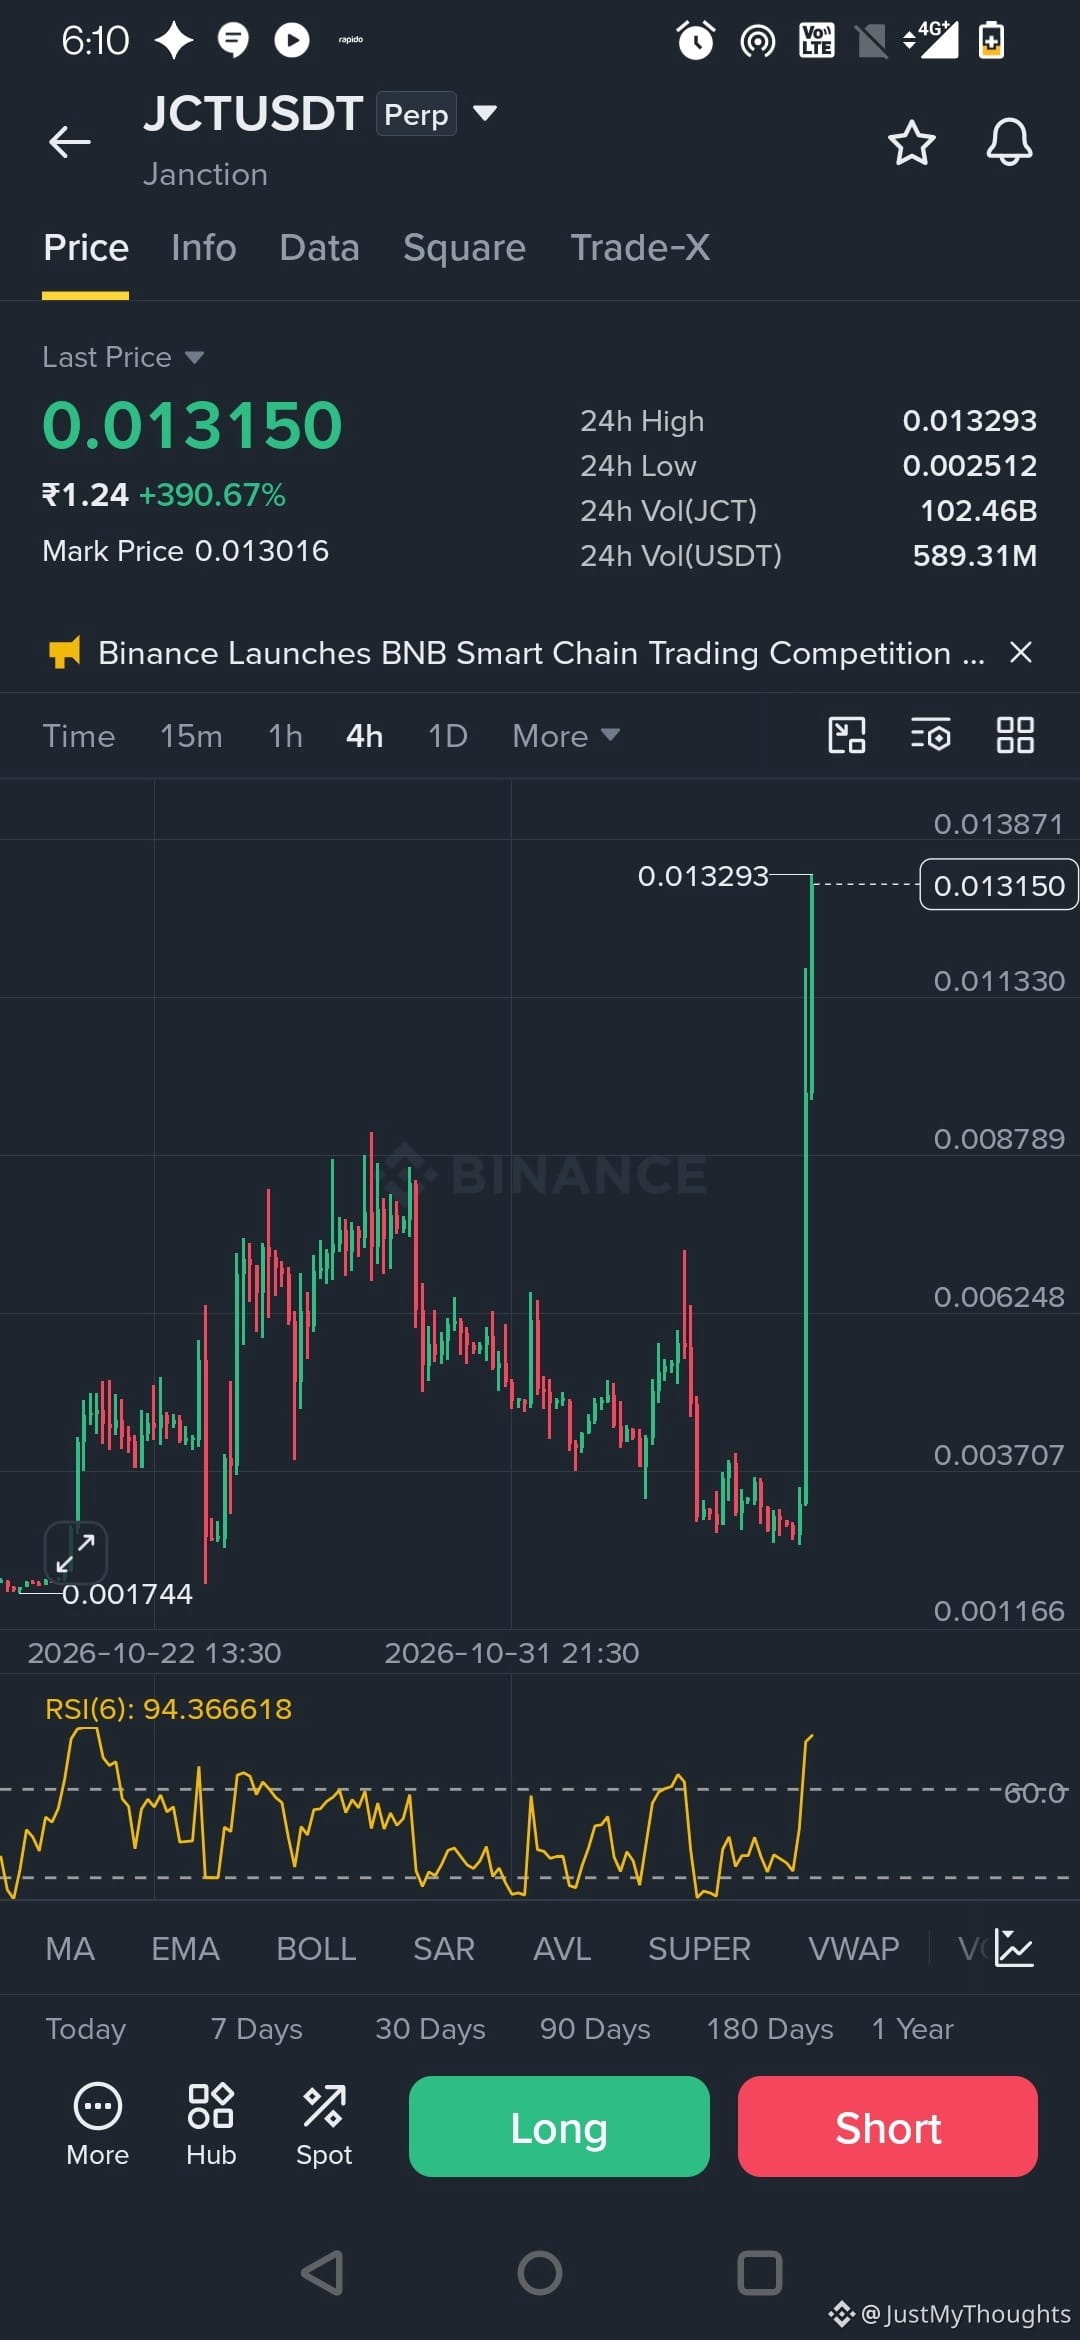
$JCT trades near 0.013150 after a massive vertical breakout off the 0.00251 base. Daily RSI(6) reaches an extreme overbought 94.36, signaling heavily over-extended market conditions.
Due to high pullback risks and potential bull-trap rejections, chasing long entries at current highs carries elevated risk. Watch for a structural pullback retest toward lower support targets at 0.01133 and 0.00878 to assess stability before considering new positions.
Are you taking profits or waiting on the sidelines?
#JCT #Janction #pumpNdump
$JCT trades near 0.013150 after a massive vertical breakout off the 0.00251 base. Daily RSI(6) reaches an extreme overbought 94.36, signaling heavily over-extended market conditions.
Due to high pullback risks and potential bull-trap rejections, chasing long entries at current highs carries elevated risk. Watch for a structural pullback retest toward lower support targets at 0.01133 and 0.00878 to assess stability before considering new positions.
Are you taking profits or waiting on the sidelines?
#JCT #Janction #pumpNdump
Due to high pullback risks and potential bull-trap rejections, chasing long entries at current highs carries elevated risk. Watch for a structural pullback retest toward lower support targets at 0.01133 and 0.00878 to assess stability before considering new positions.
Are you taking profits or waiting on the sidelines?
#JCT #Janction #pumpNdump
442

·
--
Bullish
🚨 $JCT Explodes +80%! Massive Breakout or Bull Trap?
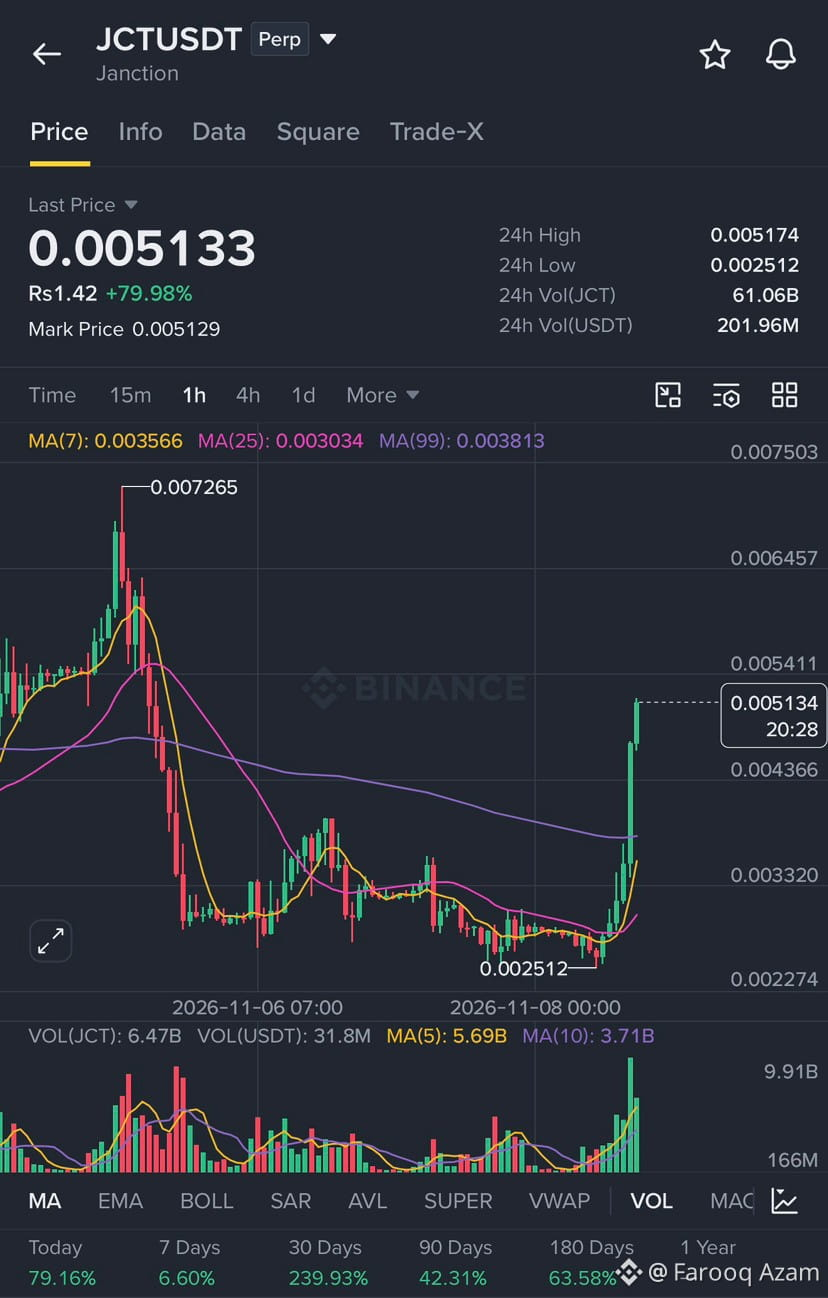
$JCT (Janction) is making serious waves on the 1H timeframe today, currently sitting at 0.005133 USDT with a massive +79.98% surge in the last 24 hours.
If you look at the chart, we just witnessed a textbook vertical breakout. Let’s break down the technicals:
- Technical Setup:
The V-Shaped Recovery: After a brutal drop from the previous high of 0.007265, the price consolidated heavily at the bottom around 0.002512.
Shattering Resistance: The price has completely obliterated the short-term moving averages. It blasted through MA(7), MA(25), and most importantly, the MA(99) at 0.003813.
Volume is King: Look at the volume bars at the bottom. That single massive green volume spike confirms heavy whale accumulation and real buying pressure.
- Key Levels to Watch:
Immediate Resistance: 0.005174 (the 24h high). A clean 1H close above this could send it into price discovery toward the previous peak at 0.007265.
Support on a Pullback: If we see profit-taking, watch the 0.0038 level (the MA99) and 0.0030 (the MA25) for a bounce.
⚠️ CRITICAL TRADING WARNING:
Trading a Perpetual contract after an 80% daily pump is incredibly risky.
1. Extreme Overbought: Buying the top of a vertical green candle is a classic FOMO trap. A violent pullback is highly likely.
2. Leverage: Shorts are getting liquidated hard right now, but don't be the late Long who gets squeezed on the pullback.
3. Use Stop-Losses: If you are trading this, tight stops are mandatory.
What’s your play on $JCT right now? Are you long, waiting for a pullback, or staying far away? 👇
#JCT #JANCTION #BinanceSquare
🚨 $JCT Explodes +80%! Massive Breakout or Bull Trap?
$JCT (Janction) is making serious waves on the 1H timeframe today, currently sitting at 0.005133 USDT with a massive +79.98% surge in the last 24 hours.
If you look at the chart, we just witnessed a textbook vertical breakout. Let’s break down the technicals:
- Technical Setup:
The V-Shaped Recovery: After a brutal drop from the previous high of 0.007265, the price consolidated heavily at the bottom around 0.002512.
Shattering Resistance: The price has completely obliterated the short-term moving averages. It blasted through MA(7), MA(25), and most importantly, the MA(99) at 0.003813.
Volume is King: Look at the volume bars at the bottom. That single massive green volume spike confirms heavy whale accumulation and real buying pressure.
- Key Levels to Watch:
Immediate Resistance: 0.005174 (the 24h high). A clean 1H close above this could send it into price discovery toward the previous peak at 0.007265.
Support on a Pullback: If we see profit-taking, watch the 0.0038 level (the MA99) and 0.0030 (the MA25) for a bounce.
⚠️ CRITICAL TRADING WARNING:
Trading a Perpetual contract after an 80% daily pump is incredibly risky.
1. Extreme Overbought: Buying the top of a vertical green candle is a classic FOMO trap. A violent pullback is highly likely.
2. Leverage: Shorts are getting liquidated hard right now, but don't be the late Long who gets squeezed on the pullback.
3. Use Stop-Losses: If you are trading this, tight stops are mandatory.
What’s your play on $JCT right now? Are you long, waiting for a pullback, or staying far away? 👇
#JCT #JANCTION #BinanceSquare
$JCT (Janction) is making serious waves on the 1H timeframe today, currently sitting at 0.005133 USDT with a massive +79.98% surge in the last 24 hours.
If you look at the chart, we just witnessed a textbook vertical breakout. Let’s break down the technicals:
- Technical Setup:
The V-Shaped Recovery: After a brutal drop from the previous high of 0.007265, the price consolidated heavily at the bottom around 0.002512.
Shattering Resistance: The price has completely obliterated the short-term moving averages. It blasted through MA(7), MA(25), and most importantly, the MA(99) at 0.003813.
Volume is King: Look at the volume bars at the bottom. That single massive green volume spike confirms heavy whale accumulation and real buying pressure.
- Key Levels to Watch:
Immediate Resistance: 0.005174 (the 24h high). A clean 1H close above this could send it into price discovery toward the previous peak at 0.007265.
Support on a Pullback: If we see profit-taking, watch the 0.0038 level (the MA99) and 0.0030 (the MA25) for a bounce.
⚠️ CRITICAL TRADING WARNING:
Trading a Perpetual contract after an 80% daily pump is incredibly risky.
1. Extreme Overbought: Buying the top of a vertical green candle is a classic FOMO trap. A violent pullback is highly likely.
2. Leverage: Shorts are getting liquidated hard right now, but don't be the late Long who gets squeezed on the pullback.
3. Use Stop-Losses: If you are trading this, tight stops are mandatory.
What’s your play on $JCT right now? Are you long, waiting for a pullback, or staying far away? 👇
#JCT #JANCTION #BinanceSquare
313

·
--
Partly True
JCT faces a massive unlock of 1.18 billion tokens the day after tomorrow, 11/10! Janction ($JCT) skyrockets 282% on $830 million in volume—here’s why!
Janction (JCT) staged an extremely explosive rally today, surging 282.45% in a single day to $0.010005 (briefly touching an intraday high of $0.0140). Its 24-hour trading volume astonishingly topped $830 million, ranking first across the board!
Here’s the truth behind the extreme imbalance in derivatives markets and the token unlock:
1. Extreme funding rates and liquidations: Funding rates soared to around +0.48% per interval (longs are paying extremely high holding costs). Short liquidations totaled as much as $6.9 million over 24 hours, compared with $2.1 million for longs; large traders’ long positions accounted for 56%;
2. Major unlock countdown: On-chain data and calendars show that approximately 1.18 billion tokens are set to unlock on November 10 (the day after tomorrow)—about 2.35% of the total supply, worth approximately $13 million. Although there’s related news about Binance Alpha, the contract has already been trading.
Conclusion: Longs are paying sky-high interest to force their positions higher, while a major unlock and potential selling pressure are just around the corner. $0.00500 is the key support zone and line in the sand from the past few days. With funding rates at extreme levels, absolutely do not hold positions overnight. Beware of a sell-off cascade on unlock day!
#JCT #Janction
$JCT
{future}(JCTUSDT)
JCT faces a massive unlock of 1.18 billion tokens the day after tomorrow, 11/10! Janction ($JCT ) skyrockets 282% on $830 million in volume—here’s why!
Janction (JCT) staged an extremely explosive rally today, surging 282.45% in a single day to $0.010005 (briefly touching an intraday high of $0.0140). Its 24-hour trading volume astonishingly topped $830 million, ranking first across the board!
Here’s the truth behind the extreme imbalance in derivatives markets and the token unlock:
1. Extreme funding rates and liquidations: Funding rates soared to around +0.48% per interval (longs are paying extremely high holding costs). Short liquidations totaled as much as $6.9 million over 24 hours, compared with $2.1 million for longs; large traders’ long positions accounted for 56%;
2. Major unlock countdown: On-chain data and calendars show that approximately 1.18 billion tokens are set to unlock on November 10 (the day after tomorrow)—about 2.35% of the total supply, worth approximately $13 million. Although there’s related news about Binance Alpha, the contract has already been trading.
Conclusion: Longs are paying sky-high interest to force their positions higher, while a major unlock and potential selling pressure are just around the corner. $0.00500 is the key support zone and line in the sand from the past few days. With funding rates at extreme levels, absolutely do not hold positions overnight. Beware of a sell-off cascade on unlock day!
#JCT #Janction
$JCT
Janction (JCT) staged an extremely explosive rally today, surging 282.45% in a single day to $0.010005 (briefly touching an intraday high of $0.0140). Its 24-hour trading volume astonishingly topped $830 million, ranking first across the board!
Here’s the truth behind the extreme imbalance in derivatives markets and the token unlock:
1. Extreme funding rates and liquidations: Funding rates soared to around +0.48% per interval (longs are paying extremely high holding costs). Short liquidations totaled as much as $6.9 million over 24 hours, compared with $2.1 million for longs; large traders’ long positions accounted for 56%;
2. Major unlock countdown: On-chain data and calendars show that approximately 1.18 billion tokens are set to unlock on November 10 (the day after tomorrow)—about 2.35% of the total supply, worth approximately $13 million. Although there’s related news about Binance Alpha, the contract has already been trading.
Conclusion: Longs are paying sky-high interest to force their positions higher, while a major unlock and potential selling pressure are just around the corner. $0.00500 is the key support zone and line in the sand from the past few days. With funding rates at extreme levels, absolutely do not hold positions overnight. Beware of a sell-off cascade on unlock day!
#JCT #Janction
$JCT
AudreyGM:
JCT 这过山车连安全带都要收高额利息😂 不过解锁不等于立刻砸盘,重点还得看代币流向,别把日历直接当卖单。
1
2
2k

·
--
That scene from November 5 is back today.
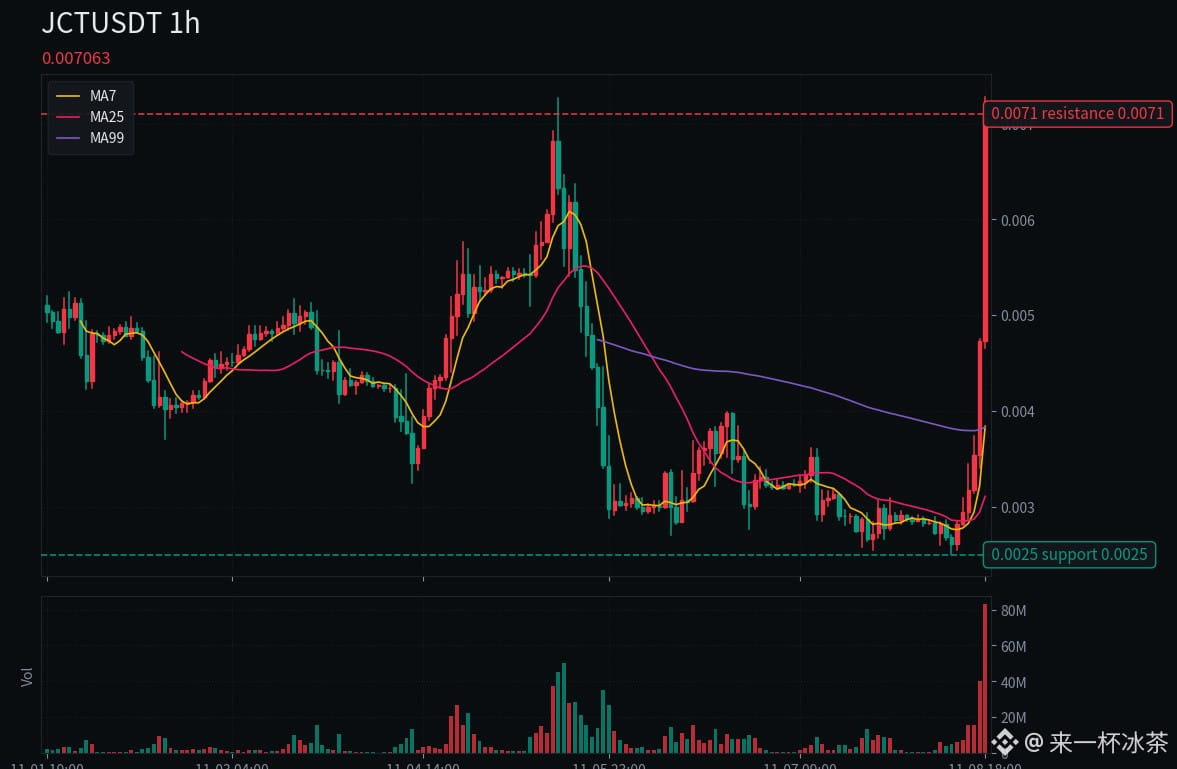
$JCT surged to 0.007265 during the day, then got slammed back to 0.003 that night. Three days later, it’s back with a vengeance: the perpetual contract is up 135.57% in 24 hours, currently at 0.00685, with $248 million in 24-hour trading volume and a 0.13% funding rate. Longs are paying a premium to get in. That huge green candle on the chart makes the November 5 spike look tame by comparison.
I looked all over and couldn’t find any new news today. JCT is an AI-computing project incubated by Jasmy, and Smart Render, which launched in mid-September, doesn’t use the token either. This rally is purely driven by sentiment—the fundamentals haven’t even come into play yet.
But November 10 is a hard date to watch: the first unlock cliff, with about 1.18 billion tokens hitting the market—roughly one-tenth of the current circulating supply. And the part that really stings comes after that: of the 50 billion total tokens, 77% are still locked in five multisig wallets, with no on-chain vesting contracts. About 1.2 billion more tokens are also due to be released each month.
Support: 0.0025
Resistance: 0.0071
Hold above 0.0028 → sentiment keeps running hot; first watch 0.0073, then the 0.0106 level from last year’s high comes into play
Break below 0.0025 → today’s green candle is invalidated, and price goes straight back to square one on November 7
Break above 0.0071 and hold → the November 5 high is officially taken out; short stop-losses could give it another push
My stance: sitting on the sidelines, leaning bearish. Not chasing. I’ll admit I’m wrong if it closes and holds above 0.0071, and the price doesn’t get dumped after the November 10 unlock.
Which would you choose: get out before the unlock, or bet it hits 0.01 first?
⚠️Just my personal rambling; this is not investment advice.
#janction #JCT #AltcoinRotation
That scene from November 5 is back today.
$JCT surged to 0.007265 during the day, then got slammed back to 0.003 that night. Three days later, it’s back with a vengeance: the perpetual contract is up 135.57% in 24 hours, currently at 0.00685, with $248 million in 24-hour trading volume and a 0.13% funding rate. Longs are paying a premium to get in. That huge green candle on the chart makes the November 5 spike look tame by comparison.
I looked all over and couldn’t find any new news today. JCT is an AI-computing project incubated by Jasmy, and Smart Render, which launched in mid-September, doesn’t use the token either. This rally is purely driven by sentiment—the fundamentals haven’t even come into play yet.
But November 10 is a hard date to watch: the first unlock cliff, with about 1.18 billion tokens hitting the market—roughly one-tenth of the current circulating supply. And the part that really stings comes after that: of the 50 billion total tokens, 77% are still locked in five multisig wallets, with no on-chain vesting contracts. About 1.2 billion more tokens are also due to be released each month.
Support: 0.0025
Resistance: 0.0071
Hold above 0.0028 → sentiment keeps running hot; first watch 0.0073, then the 0.0106 level from last year’s high comes into play
Break below 0.0025 → today’s green candle is invalidated, and price goes straight back to square one on November 7
Break above 0.0071 and hold → the November 5 high is officially taken out; short stop-losses could give it another push
My stance: sitting on the sidelines, leaning bearish. Not chasing. I’ll admit I’m wrong if it closes and holds above 0.0071, and the price doesn’t get dumped after the November 10 unlock.
Which would you choose: get out before the unlock, or bet it hits 0.01 first?
⚠️Just my personal rambling; this is not investment advice.
#janction #JCT #AltcoinRotation
$JCT surged to 0.007265 during the day, then got slammed back to 0.003 that night. Three days later, it’s back with a vengeance: the perpetual contract is up 135.57% in 24 hours, currently at 0.00685, with $248 million in 24-hour trading volume and a 0.13% funding rate. Longs are paying a premium to get in. That huge green candle on the chart makes the November 5 spike look tame by comparison.
I looked all over and couldn’t find any new news today. JCT is an AI-computing project incubated by Jasmy, and Smart Render, which launched in mid-September, doesn’t use the token either. This rally is purely driven by sentiment—the fundamentals haven’t even come into play yet.
But November 10 is a hard date to watch: the first unlock cliff, with about 1.18 billion tokens hitting the market—roughly one-tenth of the current circulating supply. And the part that really stings comes after that: of the 50 billion total tokens, 77% are still locked in five multisig wallets, with no on-chain vesting contracts. About 1.2 billion more tokens are also due to be released each month.
Support: 0.0025
Resistance: 0.0071
Hold above 0.0028 → sentiment keeps running hot; first watch 0.0073, then the 0.0106 level from last year’s high comes into play
Break below 0.0025 → today’s green candle is invalidated, and price goes straight back to square one on November 7
Break above 0.0071 and hold → the November 5 high is officially taken out; short stop-losses could give it another push
My stance: sitting on the sidelines, leaning bearish. Not chasing. I’ll admit I’m wrong if it closes and holds above 0.0071, and the price doesn’t get dumped after the November 10 unlock.
Which would you choose: get out before the unlock, or bet it hits 0.01 first?
⚠️Just my personal rambling; this is not investment advice.
#janction #JCT #AltcoinRotation
563

·
--
Verified
$JCT at 0.00291, and the double event on November 10 explains the decline, not the chart. The unlock of 1.18 billion tokens equals 2.4% of the total supply, but represents more than 10% of the current circulating supply. The difference between those two figures is what matters to me, because the market absorbs supply relative to what is actually being traded, not the total supply.
On the other hand, being listed on Binance Alpha and Futures on the same day could bring in new liquidity. But a listing is a one-time event, while an unlock adds permanent supply.
Support: 0.0026–0.0029; resistance: 0.0032, then 0.0038.
I think the listing won’t absorb all this supply in a single day, because new liquidity takes time to arrive, while the unlock creates immediate pressure. If the price closes above 0.0032 on November 10 itself, I’ll consider that the market has absorbed the pressure.
This is analysis, not financial advice.
If you found this post helpful, I’d appreciate your support with a like 👍
{future}(JCTUSDT)
#JCT #Janction #BinanceSquare
$JCT at 0.00291, and the double event on November 10 explains the decline, not the chart. The unlock of 1.18 billion tokens equals 2.4% of the total supply, but represents more than 10% of the current circulating supply. The difference between those two figures is what matters to me, because the market absorbs supply relative to what is actually being traded, not the total supply.
On the other hand, being listed on Binance Alpha and Futures on the same day could bring in new liquidity. But a listing is a one-time event, while an unlock adds permanent supply.
Support: 0.0026–0.0029; resistance: 0.0032, then 0.0038.
I think the listing won’t absorb all this supply in a single day, because new liquidity takes time to arrive, while the unlock creates immediate pressure. If the price closes above 0.0032 on November 10 itself, I’ll consider that the market has absorbed the pressure.
This is analysis, not financial advice.
If you found this post helpful, I’d appreciate your support with a like 👍
#JCT #Janction #BinanceSquare
On the other hand, being listed on Binance Alpha and Futures on the same day could bring in new liquidity. But a listing is a one-time event, while an unlock adds permanent supply.
Support: 0.0026–0.0029; resistance: 0.0032, then 0.0038.
I think the listing won’t absorb all this supply in a single day, because new liquidity takes time to arrive, while the unlock creates immediate pressure. If the price closes above 0.0032 on November 10 itself, I’ll consider that the market has absorbed the pressure.
This is analysis, not financial advice.
If you found this post helpful, I’d appreciate your support with a like 👍
#JCT #Janction #BinanceSquare

1
869

·
--
Golden Pig’s take: $JCT I’m leaning bullish on this move today, but don’t take the online rumor that it’s “listing on Binance Futures on November 10” as fact—Binance JCT futures went live on November 10, 2025. That was a year ago.
So this move isn’t driven by listing expectations; it’s purely being pushed by capital:
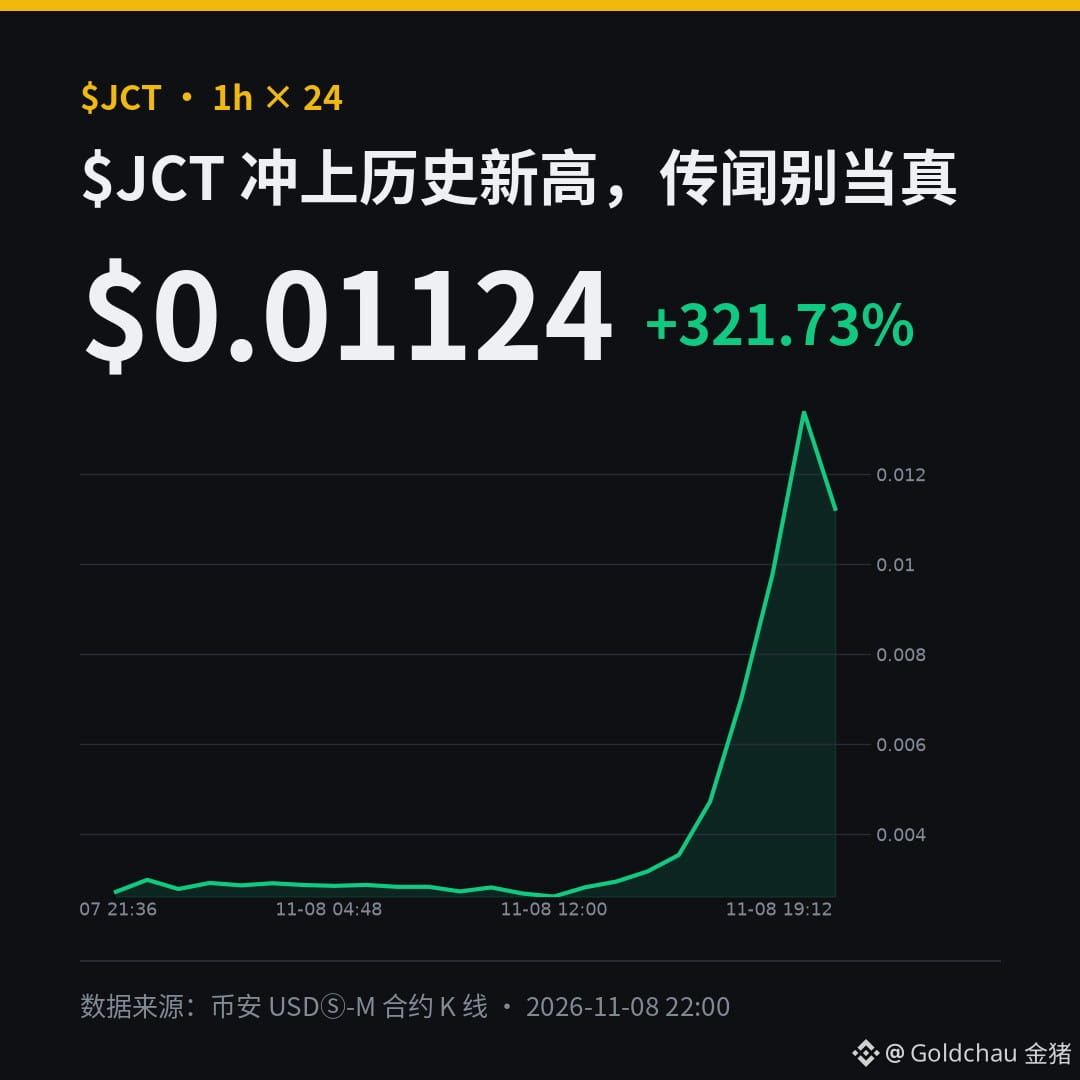
The last 24 hourly candlesticks are up about +321%, with the price surging intraday to an all-time high of around 0.0149
24-hour futures trading volume is about 850 million U
Futures open interest rose in a single day from about 11.5 million U to about 64.8 million U
My approach: I won’t chase the all-time high. If it pulls back to around 0.010 and holds, I’ll try a small long position; if it falls below around 0.0095, I’m out. Until there’s new information, I’ll treat this as a short-term trade only.
How would you manage your position in a rally fueled by old rumors like this?
#JCT #Janction #合约 $JCT $BTC
Data source: Binance futures market and open-interest data. DYOR; this is not investment advice.
Golden Pig’s take: $JCT I’m leaning bullish on this move today, but don’t take the online rumor that it’s “listing on Binance Futures on November 10” as fact—Binance JCT futures went live on November 10, 2025. That was a year ago.
So this move isn’t driven by listing expectations; it’s purely being pushed by capital:
The last 24 hourly candlesticks are up about +321%, with the price surging intraday to an all-time high of around 0.0149
24-hour futures trading volume is about 850 million U
Futures open interest rose in a single day from about 11.5 million U to about 64.8 million U
My approach: I won’t chase the all-time high. If it pulls back to around 0.010 and holds, I’ll try a small long position; if it falls below around 0.0095, I’m out. Until there’s new information, I’ll treat this as a short-term trade only.
How would you manage your position in a rally fueled by old rumors like this?
#JCT #Janction #合约 $JCT $BTC
Data source: Binance futures market and open-interest data. DYOR; this is not investment advice.
So this move isn’t driven by listing expectations; it’s purely being pushed by capital:
The last 24 hourly candlesticks are up about +321%, with the price surging intraday to an all-time high of around 0.0149
24-hour futures trading volume is about 850 million U
Futures open interest rose in a single day from about 11.5 million U to about 64.8 million U
My approach: I won’t chase the all-time high. If it pulls back to around 0.010 and holds, I’ll try a small long position; if it falls below around 0.0095, I’m out. Until there’s new information, I’ll treat this as a short-term trade only.
How would you manage your position in a rally fueled by old rumors like this?
#JCT #Janction #合约 $JCT $BTC
Data source: Binance futures market and open-interest data. DYOR; this is not investment advice.
528

·
--
Partly True
$JCT
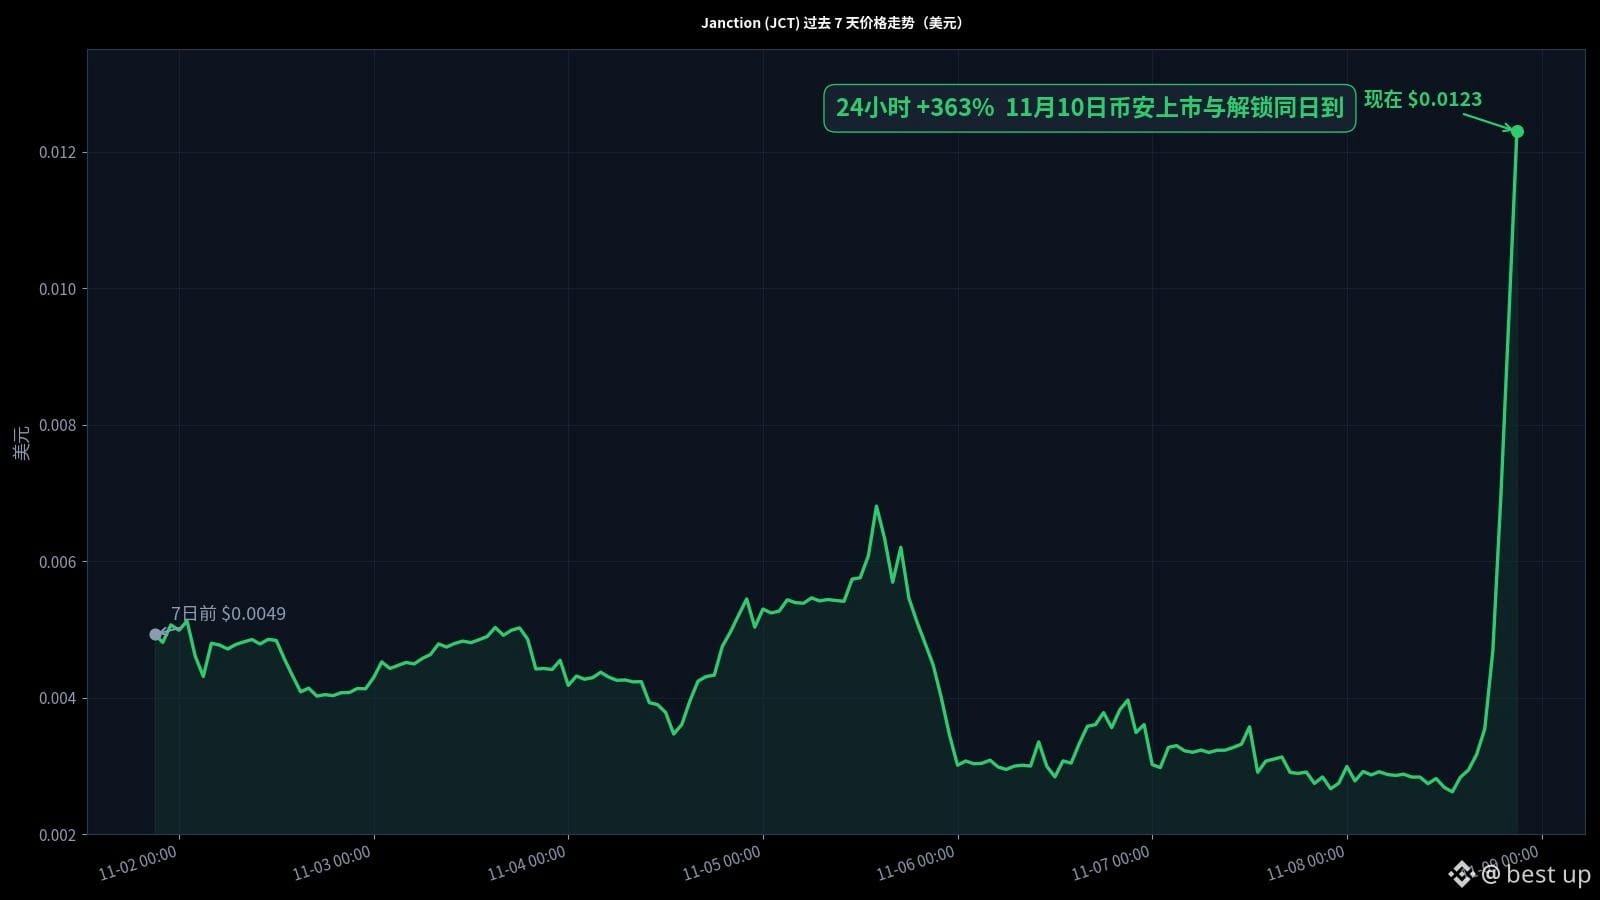
Surged 363% in one day, with $220 million in trading volume
Listing on Binance Alpha and Futures on November 10
1.18 billion tokens unlock the same day
Chase the listing rally, or wait for the unlock sell-off?
#Janction #Binance
$JCT
Surged 363% in one day, with $220 million in trading volume
Listing on Binance Alpha and Futures on November 10
1.18 billion tokens unlock the same day
Chase the listing rally, or wait for the unlock sell-off?
#Janction #Binance
Surged 363% in one day, with $220 million in trading volume
Listing on Binance Alpha and Futures on November 10
1.18 billion tokens unlock the same day
Chase the listing rally, or wait for the unlock sell-off?
#Janction #Binance
645

·
--
Who remembers when the 24-hour low was still at 0.00251?
JCT perpetuals are now around 0.0046, up about 59% in a day 😂
It touched a high of 0.00475, with about 168 million U in trading volume,
and the price range nearly doubled.
The surprising thing is that the number of open contracts hasn't gone crazy,
shrinking from about 4.00 billion to 3.73 billion,
while their value rose from about 11.6 million to 13.3 million U.
It looks more like the price has pushed up the value of existing positions,
rather than fresh money pouring in to open more positions.
Long accounts are at about 58%, and large traders are around the same.
Funding rates were mostly just 0.005% during the day,
but the next period's forecast has already reached about 0.077%—longs are starting to pay.
JCT isn't listed on Binance spot. Any new updates from the project team today? Couldn't find any.
These sharp rallies driven purely by perpetuals can reverse just as fast 🤡
$JCT #Janction #ContractMarketMoves
Personal opinion only; not investment advice
Who remembers when the 24-hour low was still at 0.00251?
JCT perpetuals are now around 0.0046, up about 59% in a day 😂
It touched a high of 0.00475, with about 168 million U in trading volume,
and the price range nearly doubled.
The surprising thing is that the number of open contracts hasn't gone crazy,
shrinking from about 4.00 billion to 3.73 billion,
while their value rose from about 11.6 million to 13.3 million U.
It looks more like the price has pushed up the value of existing positions,
rather than fresh money pouring in to open more positions.
Long accounts are at about 58%, and large traders are around the same.
Funding rates were mostly just 0.005% during the day,
but the next period's forecast has already reached about 0.077%—longs are starting to pay.
JCT isn't listed on Binance spot. Any new updates from the project team today? Couldn't find any.
These sharp rallies driven purely by perpetuals can reverse just as fast 🤡
$JCT #Janction #ContractMarketMoves
Personal opinion only; not investment advice
JCT perpetuals are now around 0.0046, up about 59% in a day 😂
It touched a high of 0.00475, with about 168 million U in trading volume,
and the price range nearly doubled.
The surprising thing is that the number of open contracts hasn't gone crazy,
shrinking from about 4.00 billion to 3.73 billion,
while their value rose from about 11.6 million to 13.3 million U.
It looks more like the price has pushed up the value of existing positions,
rather than fresh money pouring in to open more positions.
Long accounts are at about 58%, and large traders are around the same.
Funding rates were mostly just 0.005% during the day,
but the next period's forecast has already reached about 0.077%—longs are starting to pay.
JCT isn't listed on Binance spot. Any new updates from the project team today? Couldn't find any.
These sharp rallies driven purely by perpetuals can reverse just as fast 🤡
$JCT #Janction #ContractMarketMoves
Personal opinion only; not investment advice
339

·
--
While watching the market today, I noticed a lesser-known token, $JCT (Janction), with some figures worth thinking about.
Its current price is around $0.0031, with a market cap of about $32.1 million. Meanwhile, its trading volume over the past 24 hours reached roughly $29.44 million—almost matching its entire market cap in a single day. That’s an astonishing turnover rate.
For a small-cap token with “volume approaching market cap,” it suggests that tokens are changing hands very quickly and the market is seeing intense capital battles. Short-term liquidity looks decent, but it often also means volatility is amplified, with bigger swings in both directions.
The project itself hasn’t been getting much attention lately, so it’s relatively under the radar. Combined with high turnover, that could mean investors are quietly building positions—or it could simply be a short-lived surge driven by rotating speculative money. It’s hard to draw a conclusion from just one set of figures.
I’ll add it to my watchlist and keep an eye on three things:
1. Whether the high trading volume can continue, or quickly dries up after a one-day spike
2. Whether the price can hold above the $0.003 level
3. Whether any project developments or new narratives emerge to provide further momentum
With small-cap tokens, position sizing always comes first. If you don’t understand it, stay on the sidelines—and be especially cautious about chasing a rally.
#Janction #JCT #CryptoWatch
While watching the market today, I noticed a lesser-known token, $JCT (Janction), with some figures worth thinking about.
Its current price is around $0.0031, with a market cap of about $32.1 million. Meanwhile, its trading volume over the past 24 hours reached roughly $29.44 million—almost matching its entire market cap in a single day. That’s an astonishing turnover rate.
For a small-cap token with “volume approaching market cap,” it suggests that tokens are changing hands very quickly and the market is seeing intense capital battles. Short-term liquidity looks decent, but it often also means volatility is amplified, with bigger swings in both directions.
The project itself hasn’t been getting much attention lately, so it’s relatively under the radar. Combined with high turnover, that could mean investors are quietly building positions—or it could simply be a short-lived surge driven by rotating speculative money. It’s hard to draw a conclusion from just one set of figures.
I’ll add it to my watchlist and keep an eye on three things:
1. Whether the high trading volume can continue, or quickly dries up after a one-day spike
2. Whether the price can hold above the $0.003 level
3. Whether any project developments or new narratives emerge to provide further momentum
With small-cap tokens, position sizing always comes first. If you don’t understand it, stay on the sidelines—and be especially cautious about chasing a rally.
#Janction #JCT #CryptoWatch
Its current price is around $0.0031, with a market cap of about $32.1 million. Meanwhile, its trading volume over the past 24 hours reached roughly $29.44 million—almost matching its entire market cap in a single day. That’s an astonishing turnover rate.
For a small-cap token with “volume approaching market cap,” it suggests that tokens are changing hands very quickly and the market is seeing intense capital battles. Short-term liquidity looks decent, but it often also means volatility is amplified, with bigger swings in both directions.
The project itself hasn’t been getting much attention lately, so it’s relatively under the radar. Combined with high turnover, that could mean investors are quietly building positions—or it could simply be a short-lived surge driven by rotating speculative money. It’s hard to draw a conclusion from just one set of figures.
I’ll add it to my watchlist and keep an eye on three things:
1. Whether the high trading volume can continue, or quickly dries up after a one-day spike
2. Whether the price can hold above the $0.003 level
3. Whether any project developments or new narratives emerge to provide further momentum
With small-cap tokens, position sizing always comes first. If you don’t understand it, stay on the sidelines—and be especially cautious about chasing a rally.
#Janction #JCT #CryptoWatch
2

Observing an under-the-radar project: Janction ($JCT) is currently a typical asset where “trading activity far exceeds discussion.”
First, the data: The current price is about $0.0031, with a market cap of only around $32.1 million, while 24-hour trading volume reached roughly $29.44 million—almost equal to its market cap, with turnover exceeding 90%. In other words, nearly the entire circulating supply changed hands in a single day. That is an extremely high level for a small-cap coin.
On the other hand, there is almost no recent discussion of it on social media, and the project’s narrative is nearly nonexistent. A lively market but a quiet public conversation usually points to one of two things: either capital is moving in before a narrative takes off, or wash trading and short-term speculation in a low-market-cap asset are creating a false sense of prosperity. Such high turnover amplifies volatility: if it rises, it can do so sharply, and if it falls, it will be just as unforgiving.
The io_flow sector is still at an early stage. Whether $JCT can turn trading volume into genuine attention and ecosystem progress remains to be verified by future data. Until the picture is clearer, treating it as something to watch may be wiser than rushing in.
#Janction #DePIN #CryptoMarket
Observing an under-the-radar project: Janction ($JCT ) is currently a typical asset where “trading activity far exceeds discussion.”
First, the data: The current price is about $0.0031, with a market cap of only around $32.1 million, while 24-hour trading volume reached roughly $29.44 million—almost equal to its market cap, with turnover exceeding 90%. In other words, nearly the entire circulating supply changed hands in a single day. That is an extremely high level for a small-cap coin.
On the other hand, there is almost no recent discussion of it on social media, and the project’s narrative is nearly nonexistent. A lively market but a quiet public conversation usually points to one of two things: either capital is moving in before a narrative takes off, or wash trading and short-term speculation in a low-market-cap asset are creating a false sense of prosperity. Such high turnover amplifies volatility: if it rises, it can do so sharply, and if it falls, it will be just as unforgiving.
The io_flow sector is still at an early stage. Whether $JCT can turn trading volume into genuine attention and ecosystem progress remains to be verified by future data. Until the picture is clearer, treating it as something to watch may be wiser than rushing in.
#Janction #DePIN #CryptoMarket
First, the data: The current price is about $0.0031, with a market cap of only around $32.1 million, while 24-hour trading volume reached roughly $29.44 million—almost equal to its market cap, with turnover exceeding 90%. In other words, nearly the entire circulating supply changed hands in a single day. That is an extremely high level for a small-cap coin.
On the other hand, there is almost no recent discussion of it on social media, and the project’s narrative is nearly nonexistent. A lively market but a quiet public conversation usually points to one of two things: either capital is moving in before a narrative takes off, or wash trading and short-term speculation in a low-market-cap asset are creating a false sense of prosperity. Such high turnover amplifies volatility: if it rises, it can do so sharply, and if it falls, it will be just as unforgiving.
The io_flow sector is still at an early stage. Whether $JCT can turn trading volume into genuine attention and ecosystem progress remains to be verified by future data. Until the picture is clearer, treating it as something to watch may be wiser than rushing in.
#Janction #DePIN #CryptoMarket
5
A look at an under-the-radar asset: Janction ($JCT) has seen almost no community discussion recently, and there are no new project updates to report—but the market is anything but quiet.
The current price is around $0.0031, with a market cap of about $32.1 million. Yet its 24-hour trading volume reached roughly $29.44 million, nearly matching its total market cap. Turnover is close to 90%, suggesting tokens are changing hands rapidly among short-term traders and that speculation is running high.
This combination of “low buzz and high turnover” warrants caution. Without support from strong narrative momentum or fundamental interest, the price is more likely to be driven by trading activity, raising the risk of sharp swings in either direction. High trading volume reflects market activity; it does not necessarily indicate the project’s value.
If you’re interested in JCT, first find out what Janction actually does and what practical uses the token has. Then consider testing the waters with a small position—don’t blindly chase a price surge based solely on rising volume.
#Janction #JCT #CryptoWatch
A look at an under-the-radar asset: Janction ($JCT ) has seen almost no community discussion recently, and there are no new project updates to report—but the market is anything but quiet.
The current price is around $0.0031, with a market cap of about $32.1 million. Yet its 24-hour trading volume reached roughly $29.44 million, nearly matching its total market cap. Turnover is close to 90%, suggesting tokens are changing hands rapidly among short-term traders and that speculation is running high.
This combination of “low buzz and high turnover” warrants caution. Without support from strong narrative momentum or fundamental interest, the price is more likely to be driven by trading activity, raising the risk of sharp swings in either direction. High trading volume reflects market activity; it does not necessarily indicate the project’s value.
If you’re interested in JCT, first find out what Janction actually does and what practical uses the token has. Then consider testing the waters with a small position—don’t blindly chase a price surge based solely on rising volume.
#Janction #JCT #CryptoWatch
The current price is around $0.0031, with a market cap of about $32.1 million. Yet its 24-hour trading volume reached roughly $29.44 million, nearly matching its total market cap. Turnover is close to 90%, suggesting tokens are changing hands rapidly among short-term traders and that speculation is running high.
This combination of “low buzz and high turnover” warrants caution. Without support from strong narrative momentum or fundamental interest, the price is more likely to be driven by trading activity, raising the risk of sharp swings in either direction. High trading volume reflects market activity; it does not necessarily indicate the project’s value.
If you’re interested in JCT, first find out what Janction actually does and what practical uses the token has. Then consider testing the waters with a small position—don’t blindly chase a price surge based solely on rising volume.
#Janction #JCT #CryptoWatch
3

·
--
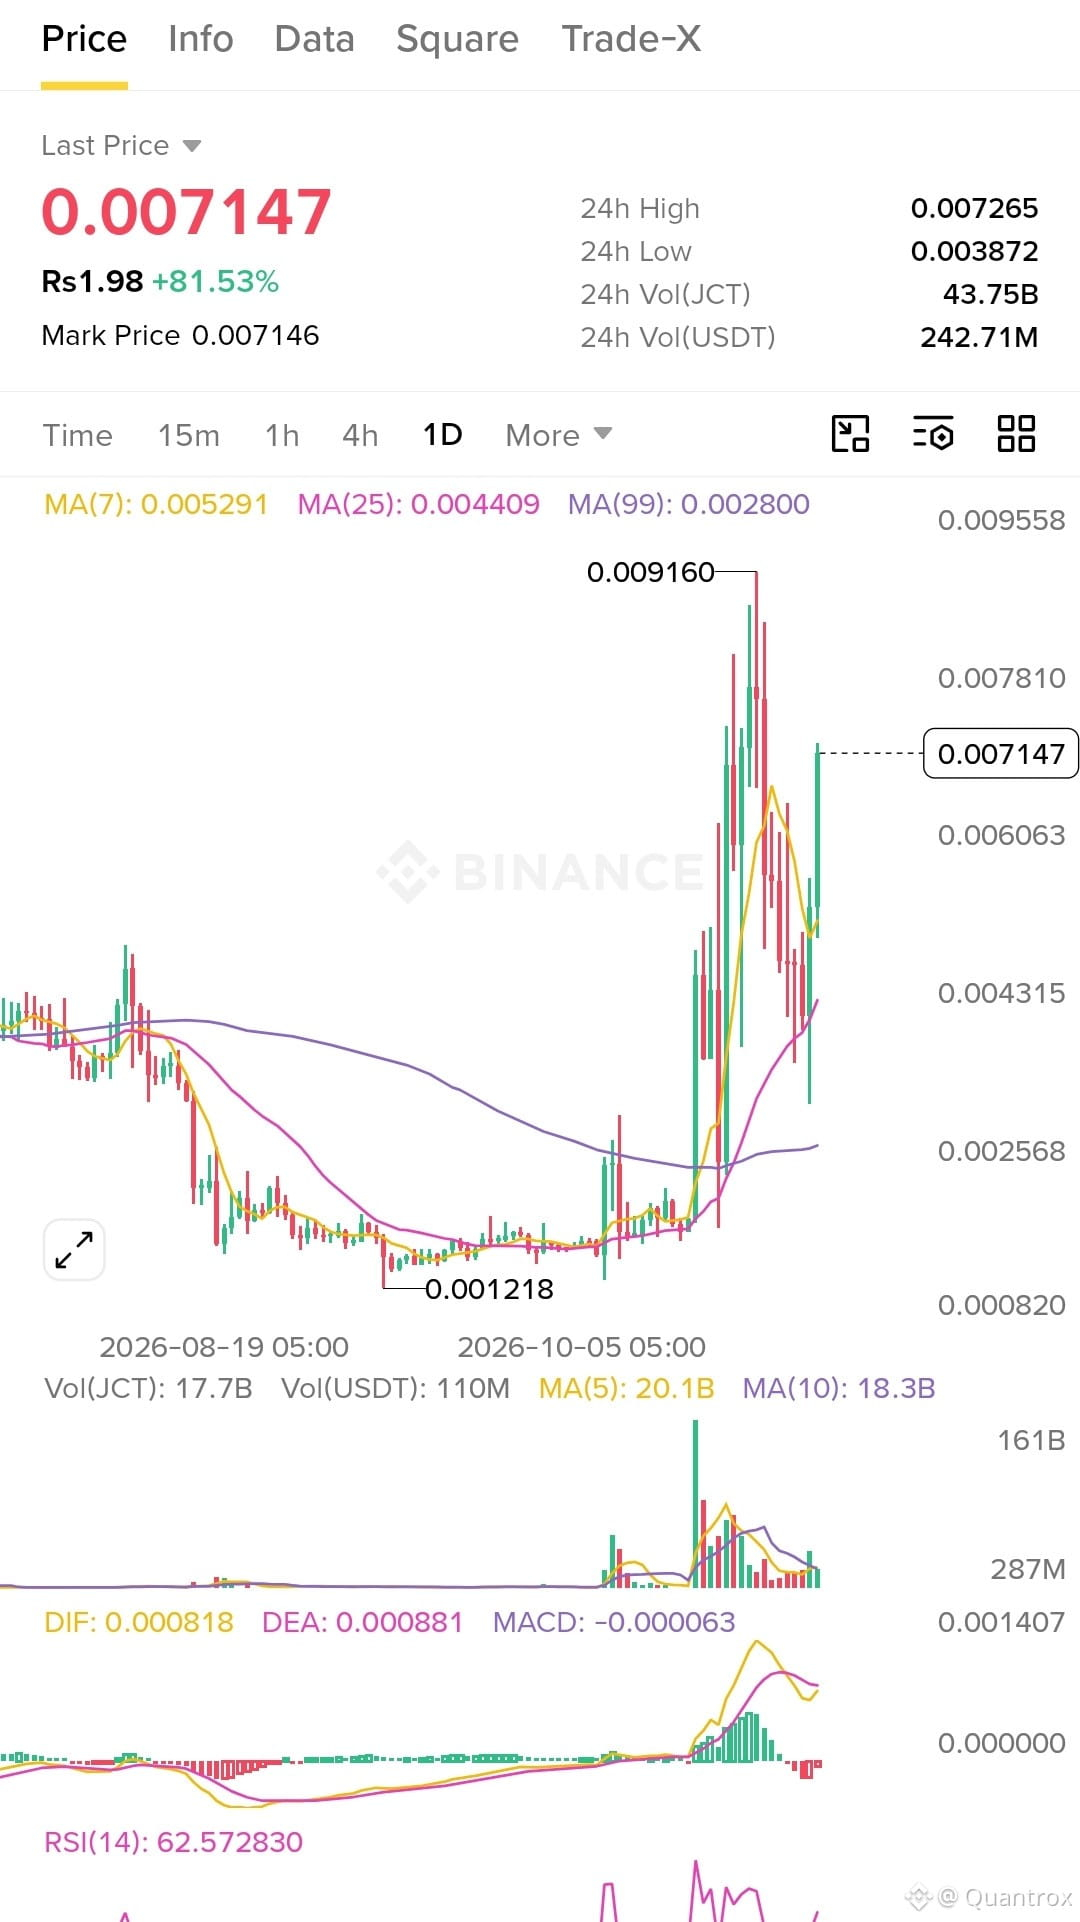
🚨 $JCT JUST JUMPED 81% — AND A TOKEN UNLOCK IS FIVE DAYS AWAY.
242M USDT in 24h volume, but price is already testing a major resistance zone.
Nov 10 is the date I'm watching.
My plan: No chasing. Entry only at $0.0058–$0.0062.
🎯 Targets: $0.0072 / $0.0091
🛑 Stop: $0.0050
Is this the start of another rally or exit liquidity before the unlock?
#JCT #Janction #CryptoTrading
DYOR | NFA
🚨 $JCT JUST JUMPED 81% — AND A TOKEN UNLOCK IS FIVE DAYS AWAY.
242M USDT in 24h volume, but price is already testing a major resistance zone.
Nov 10 is the date I'm watching.
My plan: No chasing. Entry only at $0.0058–$0.0062.
🎯 Targets: $0.0072 / $0.0091
🛑 Stop: $0.0050
Is this the start of another rally or exit liquidity before the unlock?
#JCT #Janction #CryptoTrading
DYOR | NFA
242M USDT in 24h volume, but price is already testing a major resistance zone.
Nov 10 is the date I'm watching.
My plan: No chasing. Entry only at $0.0058–$0.0062.
🎯 Targets: $0.0072 / $0.0091
🛑 Stop: $0.0050
Is this the start of another rally or exit liquidity before the unlock?
#JCT #Janction #CryptoTrading
DYOR | NFA
97

·
--
Bullish
🚀 $JCT Is Making a Strong Move!
Janction $JCT is gaining attention with a nearly 29% price increase in the last 24 hours.
The project focuses on AI computing and decentralized GPU technology.
⚠️ Important: A token unlock is expected on November 10, which traders should watch.
Will $JCT continue its upward momentum or face a correction?
What do you think?
#JCT #JANCTION #Crypto #Airdrops_free #BinanceSquare
{alpha}(560xea37a8de1de2d9d10772eeb569e28bfa5cb17707)
{spot}(BTCUSDT)
{spot}(BNBUSDT)
🚀 $JCT Is Making a Strong Move!
Janction $JCT is gaining attention with a nearly 29% price increase in the last 24 hours.
The project focuses on AI computing and decentralized GPU technology.
⚠️ Important: A token unlock is expected on November 10, which traders should watch.
Will $JCT continue its upward momentum or face a correction?
What do you think?
#JCT #JANCTION #Crypto #Airdrops_free #BinanceSquare
Janction $JCT is gaining attention with a nearly 29% price increase in the last 24 hours.
The project focuses on AI computing and decentralized GPU technology.
⚠️ Important: A token unlock is expected on November 10, which traders should watch.
Will $JCT continue its upward momentum or face a correction?
What do you think?
#JCT #JANCTION #Crypto #Airdrops_free #BinanceSquare
1
413
·
--
$JCT The recent market can only be described in one word: "dull."
The price is hovering around $0.00513, with 24-hour trading volume of about $30.13 million and a market cap of roughly $53.07 million. The figures themselves aren't bad; the real problem is that attention is fading fast. Community discussions have shifted to other new tokens, leaving Janction almost sidelined: no fresh capital is flowing in, and there are no new narratives to sustain sentiment.
The combination of "no buzz + no narrative" often keeps prices under pressure. When buying interest is thin, it doesn't take much selling pressure to push the market lower. In the short term, if trading volume continues to shrink and the project team announces no ecosystem developments or partnerships, $JCT will likely remain weak and range-bound, with any rebound likely to lack staying power.
On the other hand, being overlooked also means the token hasn't been excessively hyped, so there's limited speculative froth in its valuation. Keep an eye on two signals: first, whether trading volume picks up again, confirming a return of capital; and second, whether the team introduces a fresh narrative. Until there's a clear signal, patience and careful position sizing are far wiser than rushing to buy the dip.
#Janction #JCT #Cryptocurrency
$JCT The recent market can only be described in one word: "dull."
The price is hovering around $0.00513, with 24-hour trading volume of about $30.13 million and a market cap of roughly $53.07 million. The figures themselves aren't bad; the real problem is that attention is fading fast. Community discussions have shifted to other new tokens, leaving Janction almost sidelined: no fresh capital is flowing in, and there are no new narratives to sustain sentiment.
The combination of "no buzz + no narrative" often keeps prices under pressure. When buying interest is thin, it doesn't take much selling pressure to push the market lower. In the short term, if trading volume continues to shrink and the project team announces no ecosystem developments or partnerships, $JCT will likely remain weak and range-bound, with any rebound likely to lack staying power.
On the other hand, being overlooked also means the token hasn't been excessively hyped, so there's limited speculative froth in its valuation. Keep an eye on two signals: first, whether trading volume picks up again, confirming a return of capital; and second, whether the team introduces a fresh narrative. Until there's a clear signal, patience and careful position sizing are far wiser than rushing to buy the dip.
#Janction #JCT #Cryptocurrency
The price is hovering around $0.00513, with 24-hour trading volume of about $30.13 million and a market cap of roughly $53.07 million. The figures themselves aren't bad; the real problem is that attention is fading fast. Community discussions have shifted to other new tokens, leaving Janction almost sidelined: no fresh capital is flowing in, and there are no new narratives to sustain sentiment.
The combination of "no buzz + no narrative" often keeps prices under pressure. When buying interest is thin, it doesn't take much selling pressure to push the market lower. In the short term, if trading volume continues to shrink and the project team announces no ecosystem developments or partnerships, $JCT will likely remain weak and range-bound, with any rebound likely to lack staying power.
On the other hand, being overlooked also means the token hasn't been excessively hyped, so there's limited speculative froth in its valuation. Keep an eye on two signals: first, whether trading volume picks up again, confirming a return of capital; and second, whether the team introduces a fresh narrative. Until there's a clear signal, patience and careful position sizing are far wiser than rushing to buy the dip.
#Janction #JCT #Cryptocurrency
15

·
--
$JCT The market has been noticeably quiet lately, and that quiet itself is a warning sign worth paying attention to.
Community interest is being diverted to other new tokens, and discussion of Janction has dropped sharply. Both capital inflows and narrative support are lacking. In a market where investors are competing for existing capital, tokens that lose attention often face sustained downward pressure. That is simply how capital flows work.
Here are some figures: the current price is around 0.00513, 24-hour trading volume is about $30.13 million, and market cap is approximately $53.07 million. Trading volume has not dried up, suggesting that capital is still changing hands. But when the spotlight is elsewhere, higher volume is more likely to signal distribution than accumulation. The key issue is the lack of buying interest.
There are two things to watch next: first, whether community discussion can refocus on the project's own progress; and second, whether a new narrative catalyst emerges. Until attention returns, it is wise to stay cautious in the short term and avoid rushing to catch a falling knife. For medium-term investors, a period of neglect may instead be a good time to follow the project patiently and wait for a turning point in interest before making a decision.
#Janction #加密货币 #Market Watch
$JCT The market has been noticeably quiet lately, and that quiet itself is a warning sign worth paying attention to.
Community interest is being diverted to other new tokens, and discussion of Janction has dropped sharply. Both capital inflows and narrative support are lacking. In a market where investors are competing for existing capital, tokens that lose attention often face sustained downward pressure. That is simply how capital flows work.
Here are some figures: the current price is around 0.00513, 24-hour trading volume is about $30.13 million, and market cap is approximately $53.07 million. Trading volume has not dried up, suggesting that capital is still changing hands. But when the spotlight is elsewhere, higher volume is more likely to signal distribution than accumulation. The key issue is the lack of buying interest.
There are two things to watch next: first, whether community discussion can refocus on the project's own progress; and second, whether a new narrative catalyst emerges. Until attention returns, it is wise to stay cautious in the short term and avoid rushing to catch a falling knife. For medium-term investors, a period of neglect may instead be a good time to follow the project patiently and wait for a turning point in interest before making a decision.
#Janction #加密货币 #Market Watch
Community interest is being diverted to other new tokens, and discussion of Janction has dropped sharply. Both capital inflows and narrative support are lacking. In a market where investors are competing for existing capital, tokens that lose attention often face sustained downward pressure. That is simply how capital flows work.
Here are some figures: the current price is around 0.00513, 24-hour trading volume is about $30.13 million, and market cap is approximately $53.07 million. Trading volume has not dried up, suggesting that capital is still changing hands. But when the spotlight is elsewhere, higher volume is more likely to signal distribution than accumulation. The key issue is the lack of buying interest.
There are two things to watch next: first, whether community discussion can refocus on the project's own progress; and second, whether a new narrative catalyst emerges. Until attention returns, it is wise to stay cautious in the short term and avoid rushing to catch a falling knife. For medium-term investors, a period of neglect may instead be a good time to follow the project patiently and wait for a turning point in interest before making a decision.
#Janction #加密货币 #Market Watch
Log in to explore more content
Join global crypto users on Binance Square
⚡️ Get latest and useful information about crypto.
💬 Trusted by the world’s largest crypto exchange.
👍 Discover real insights from verified creators.
Email / Phone number
Trending Topics
1
#BinanceReopensWithdrawalsForHYPE&APT
67,329 views
867 Discussing
2
#SouthKoreaDraftLawTargets15To20%ShareholderCap
68,288 views
573 Discussing
3
#TradFiForBeginners
169,594 views
1,769 Discussing
4
#KeplrAdvisesSocialLoginUsersToTransferAssets
39,328 views
467 Discussing
5
#TetherPlans€28.8MForJuventusCapitalIncrease
25,806 views
363 Discussing
6
#JobsReportRaisesHikeOdds
826,570 views
4,386 Discussing
7
#CPITestsDecemberRateOutlook
329,629 views
1,851 Discussing
8
#US Data Center Rules May Constrain AI Expansion
123,926 views
258 Discussing
9
#ARKPlans14ThematicETFsCoveringAIAndTokenizedMarkets
8,755 views
88 Discussing
10
#WillAnthropicListOnTime
262,670 views
1,865 Discussing