
#init
init
5.2M views
11,752 Discussing
Hot
Latest

·
--
Bullish
⚡ $INIT /USDT — LONG
INIT is approaching a promising opportunity! Buyers could push for a strong breakout — don't miss the momentum. 📈
Entry Zone: $0.1430 – $0.1440
TP1: $0.1512
TP2: $0.1588
TP3: $0.1675
SL: $0.1370
{future}(INITUSDT)
#INIT
⚡ $INIT /USDT — LONG
INIT is approaching a promising opportunity! Buyers could push for a strong breakout — don't miss the momentum. 📈
Entry Zone: $0.1430 – $0.1440
TP1: $0.1512
TP2: $0.1588
TP3: $0.1675
SL: $0.1370
#INIT
INIT is approaching a promising opportunity! Buyers could push for a strong breakout — don't miss the momentum. 📈
Entry Zone: $0.1430 – $0.1440
TP1: $0.1512
TP2: $0.1588
TP3: $0.1675
SL: $0.1370
#INIT
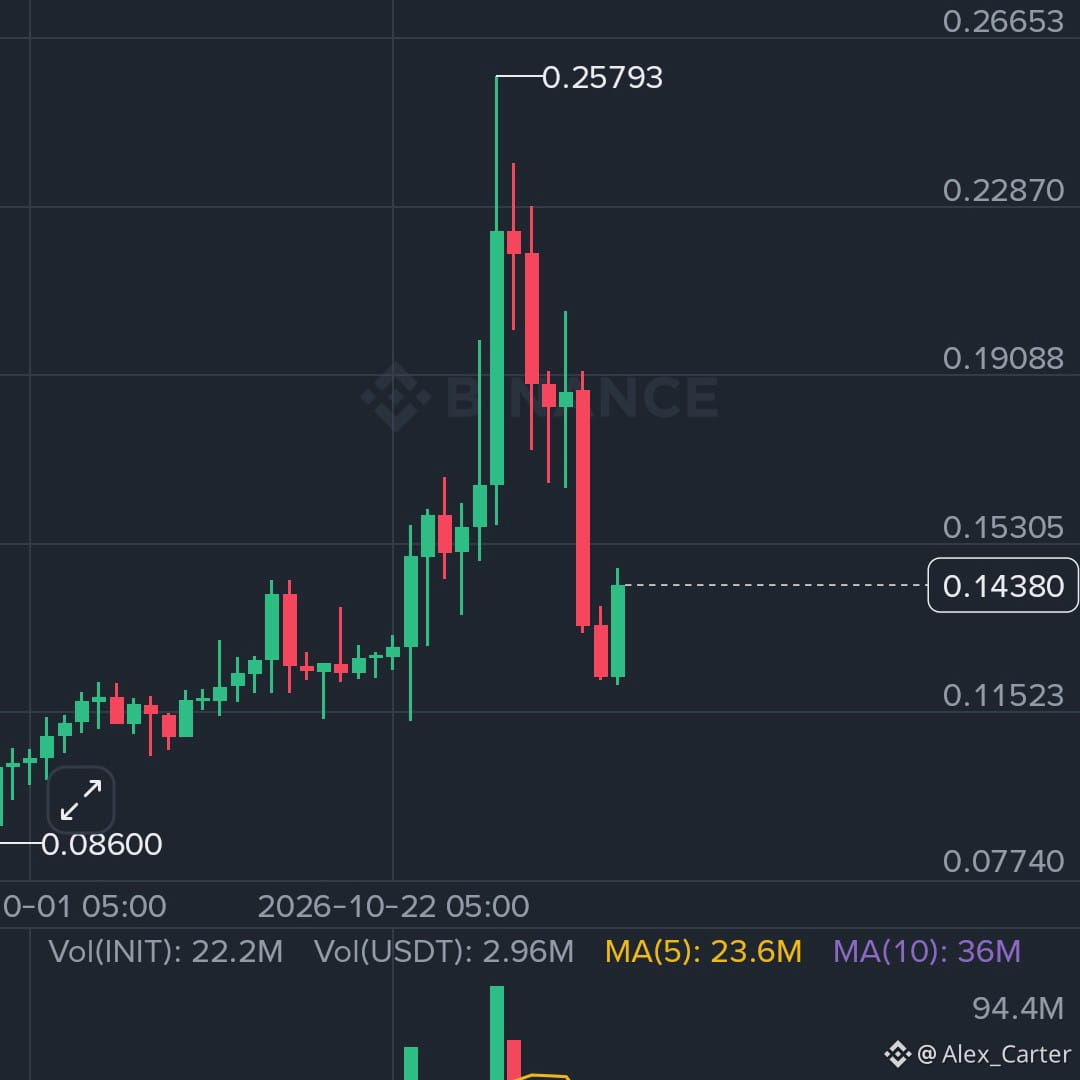
Taha Poslu:
0.1133 gelmeden cıkmaması lazım sahte cıkış bana göre
4
249

·
--
Bullish
Initia $INIT is currently attempting a short-term price recovery after experiencing significant volatility. The token experienced a sharp dip following an October 23, 2026 security incident that prompted a 9-day network halt. Operations successfully resumed on November 2, 2026, after an audited patch was deployed and the Initia Foundation fully backed the affected collateral assets.
Key Resistance Level: Bulls face immediate selling pressure near $0.15 to $0.236. A sustained breakout above these zones could establish true bullish momentum.
Support Level: Strong baseline support rests around $0.1226. A breach below this floor could reopen downside risks toward the multi-week lows.
#INIT #BTCRebounds80K #INITtothemoon
{spot}(INITUSDT)
Initia $INIT is currently attempting a short-term price recovery after experiencing significant volatility. The token experienced a sharp dip following an October 23, 2026 security incident that prompted a 9-day network halt. Operations successfully resumed on November 2, 2026, after an audited patch was deployed and the Initia Foundation fully backed the affected collateral assets.
Key Resistance Level: Bulls face immediate selling pressure near $0.15 to $0.236. A sustained breakout above these zones could establish true bullish momentum.
Support Level: Strong baseline support rests around $0.1226. A breach below this floor could reopen downside risks toward the multi-week lows.
#INIT #BTCRebounds80K #INITtothemoon
Key Resistance Level: Bulls face immediate selling pressure near $0.15 to $0.236. A sustained breakout above these zones could establish true bullish momentum.
Support Level: Strong baseline support rests around $0.1226. A breach below this floor could reopen downside risks toward the multi-week lows.
#INIT #BTCRebounds80K #INITtothemoon
19

$INIT is still flying after its restart — up 13% and still a top-5 gainer today. 🔄
$INIT is around $0.1402, up about 13.4% in 24 hours.
24h trading volume is about $3.99 million.
It traded between $0.1226 and $0.1490 in the last day — just under the $0.15 mark.
It still ranks among today's top gainers on Binance, hours after the morning's jump.
The honest context: no single fresh announcement explains today's move. The backdrop is real, though — Initia's network restarted on November 2 after a nine-day halt following an October 23 exploit, with its foundation committing funds to restore backing for affected assets. And this token has spiked and pulled back sharply before, so fast gains have reversed fast.
Does a restart story make you more interested — or more cautious?
#INIT #Initia #Altcoins
Not financial advice.
$INIT is still flying after its restart — up 13% and still a top-5 gainer today. 🔄
$INIT is around $0.1402, up about 13.4% in 24 hours.
24h trading volume is about $3.99 million.
It traded between $0.1226 and $0.1490 in the last day — just under the $0.15 mark.
It still ranks among today's top gainers on Binance, hours after the morning's jump.
The honest context: no single fresh announcement explains today's move. The backdrop is real, though — Initia's network restarted on November 2 after a nine-day halt following an October 23 exploit, with its foundation committing funds to restore backing for affected assets. And this token has spiked and pulled back sharply before, so fast gains have reversed fast.
Does a restart story make you more interested — or more cautious?
#INIT #Initia #Altcoins
Not financial advice.
$INIT is around $0.1402, up about 13.4% in 24 hours.
24h trading volume is about $3.99 million.
It traded between $0.1226 and $0.1490 in the last day — just under the $0.15 mark.
It still ranks among today's top gainers on Binance, hours after the morning's jump.
The honest context: no single fresh announcement explains today's move. The backdrop is real, though — Initia's network restarted on November 2 after a nine-day halt following an October 23 exploit, with its foundation committing funds to restore backing for affected assets. And this token has spiked and pulled back sharply before, so fast gains have reversed fast.
Does a restart story make you more interested — or more cautious?
#INIT #Initia #Altcoins
Not financial advice.
190

·
--
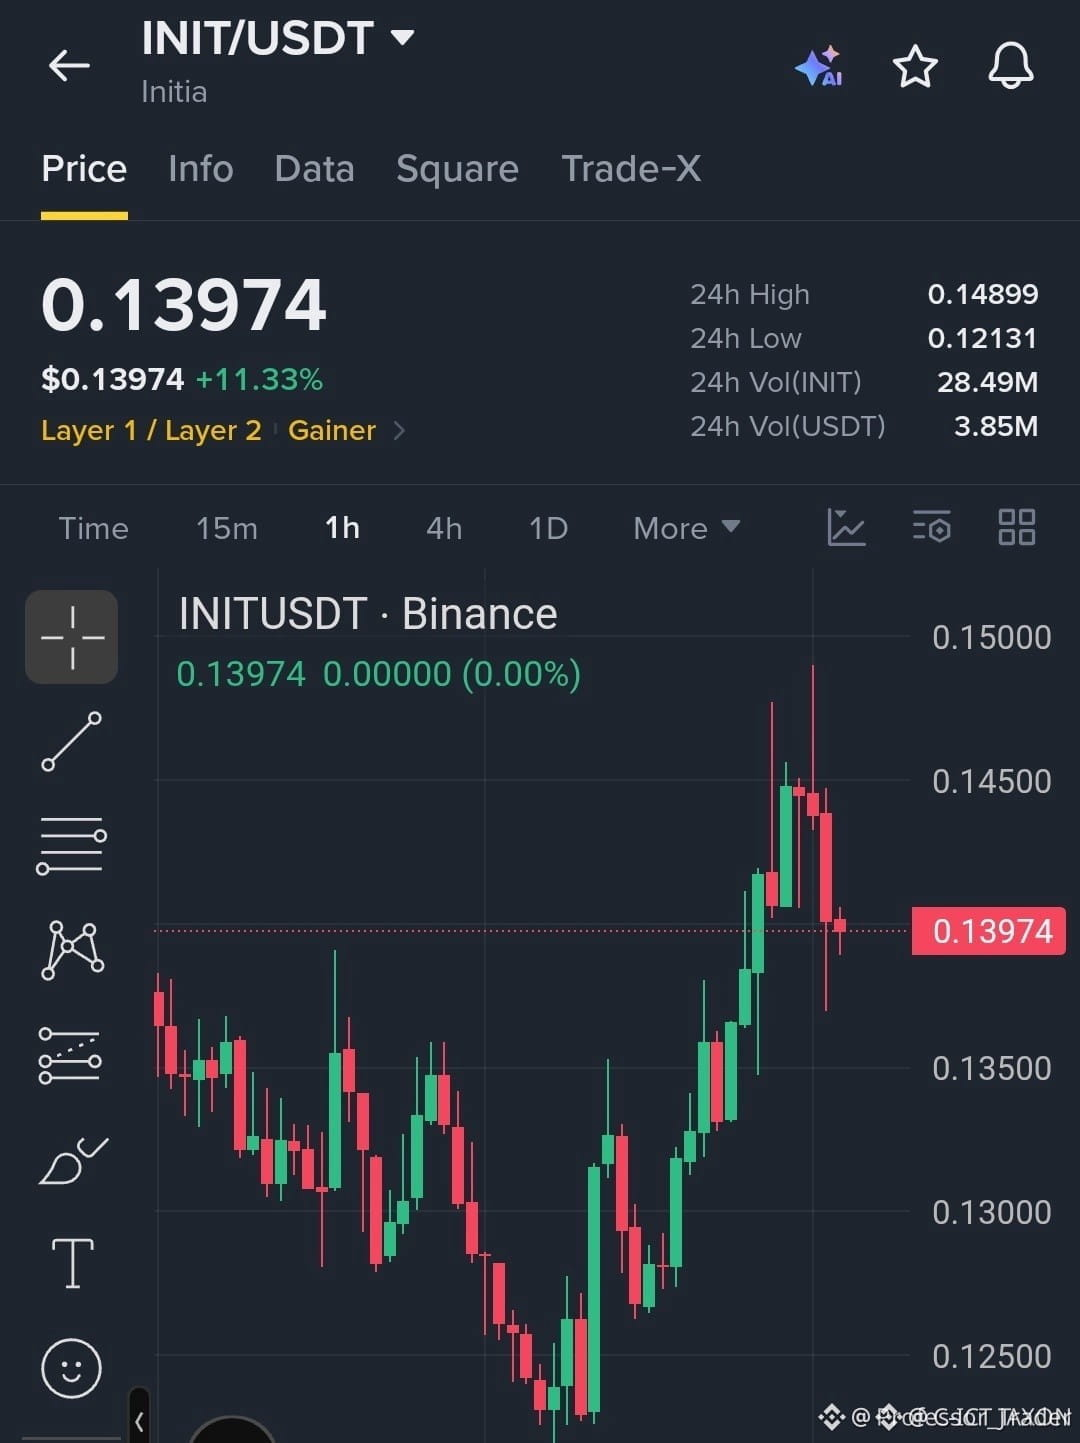
🔴 $INIT SLIDES INTO BEARISH ZONE AS SELLERS TAKE REINS 🚨
Entry: 0.1400 ⚡
Target: 0.1360 🎯
Target: 0.1320 🎯
Target: 0.1280 🎯
Stop Loss: 0.1450 ⚠️
📊 After a sharp rejection at 0.1490, smart money swept liquidity and forced the market back into the 0.1400 corridor. 🔍 The failure to retake 0.1420 confirms a bearish bias, with each lower target feeding the next wave of selling pressure. 🌊 Volume spikes on the 4H chart underscore the institutional push, while the order block around 0.1390 remains intact.
💡 The risk‑to‑reward profile stretches beyond 1:3, making this a disciplined short play for traders eyeing the next support cluster. 🤔 Are you positioning for the full cascade or targeting the first profit bucket? 👇
⚠️ Not financial advice. Always manage your risk. 🛡️
🏷️ #INIT #ShortSetup #Liquidity #Crypto #Trade
🔥 💎
🔴 $INIT SLIDES INTO BEARISH ZONE AS SELLERS TAKE REINS 🚨
Entry: 0.1400 ⚡
Target: 0.1360 🎯
Target: 0.1320 🎯
Target: 0.1280 🎯
Stop Loss: 0.1450 ⚠️
📊 After a sharp rejection at 0.1490, smart money swept liquidity and forced the market back into the 0.1400 corridor. 🔍 The failure to retake 0.1420 confirms a bearish bias, with each lower target feeding the next wave of selling pressure. 🌊 Volume spikes on the 4H chart underscore the institutional push, while the order block around 0.1390 remains intact.
💡 The risk‑to‑reward profile stretches beyond 1:3, making this a disciplined short play for traders eyeing the next support cluster. 🤔 Are you positioning for the full cascade or targeting the first profit bucket? 👇
⚠️ Not financial advice. Always manage your risk. 🛡️
🏷️ #INIT #ShortSetup #Liquidity #Crypto #Trade
🔥 💎
Entry: 0.1400 ⚡
Target: 0.1360 🎯
Target: 0.1320 🎯
Target: 0.1280 🎯
Stop Loss: 0.1450 ⚠️
📊 After a sharp rejection at 0.1490, smart money swept liquidity and forced the market back into the 0.1400 corridor. 🔍 The failure to retake 0.1420 confirms a bearish bias, with each lower target feeding the next wave of selling pressure. 🌊 Volume spikes on the 4H chart underscore the institutional push, while the order block around 0.1390 remains intact.
💡 The risk‑to‑reward profile stretches beyond 1:3, making this a disciplined short play for traders eyeing the next support cluster. 🤔 Are you positioning for the full cascade or targeting the first profit bucket? 👇
⚠️ Not financial advice. Always manage your risk. 🛡️
🏷️ #INIT #ShortSetup #Liquidity #Crypto #Trade
🔥 💎
7


·
--
Bullish
🚀 $INIT
{spot}(INITUSDT)
CLIMBS 15.69% — INITIA TOKEN ENTERS THE SPOTLIGHT!
Initia (INIT) is attracting market attention after recording a 15.69% gain in the last 24 hours on Binance Spot.
📊 Market Snapshot
Price: $0.14392
24H Change: +15.69%
24H Trading Volume: $3.91M
🔍 What is Initia?
Initia is a blockchain ecosystem built around interconnected Layer 1 and application-specific Layer 2 networks, known as Interwoven Rollups.
Its goal is to make it easier for developers to build and operate interconnected blockchain applications.
📈 What to watch:
The latest price increase places INIT among today's leading gainers. Sustained volume and market demand will be important indicators to monitor.
Will INIT maintain its upward momentum?
#INIT #Initia #blockchain #Layer2 #CryptoMarket
🚀 $INIT
CLIMBS 15.69% — INITIA TOKEN ENTERS THE SPOTLIGHT!
Initia (INIT) is attracting market attention after recording a 15.69% gain in the last 24 hours on Binance Spot.
📊 Market Snapshot
Price: $0.14392
24H Change: +15.69%
24H Trading Volume: $3.91M
🔍 What is Initia?
Initia is a blockchain ecosystem built around interconnected Layer 1 and application-specific Layer 2 networks, known as Interwoven Rollups.
Its goal is to make it easier for developers to build and operate interconnected blockchain applications.
📈 What to watch:
The latest price increase places INIT among today's leading gainers. Sustained volume and market demand will be important indicators to monitor.
Will INIT maintain its upward momentum?
#INIT #Initia #blockchain #Layer2 #CryptoMarket
CLIMBS 15.69% — INITIA TOKEN ENTERS THE SPOTLIGHT!
Initia (INIT) is attracting market attention after recording a 15.69% gain in the last 24 hours on Binance Spot.
📊 Market Snapshot
Price: $0.14392
24H Change: +15.69%
24H Trading Volume: $3.91M
🔍 What is Initia?
Initia is a blockchain ecosystem built around interconnected Layer 1 and application-specific Layer 2 networks, known as Interwoven Rollups.
Its goal is to make it easier for developers to build and operate interconnected blockchain applications.
📈 What to watch:
The latest price increase places INIT among today's leading gainers. Sustained volume and market demand will be important indicators to monitor.
Will INIT maintain its upward momentum?
#INIT #Initia #blockchain #Layer2 #CryptoMarket
1
42

·
--
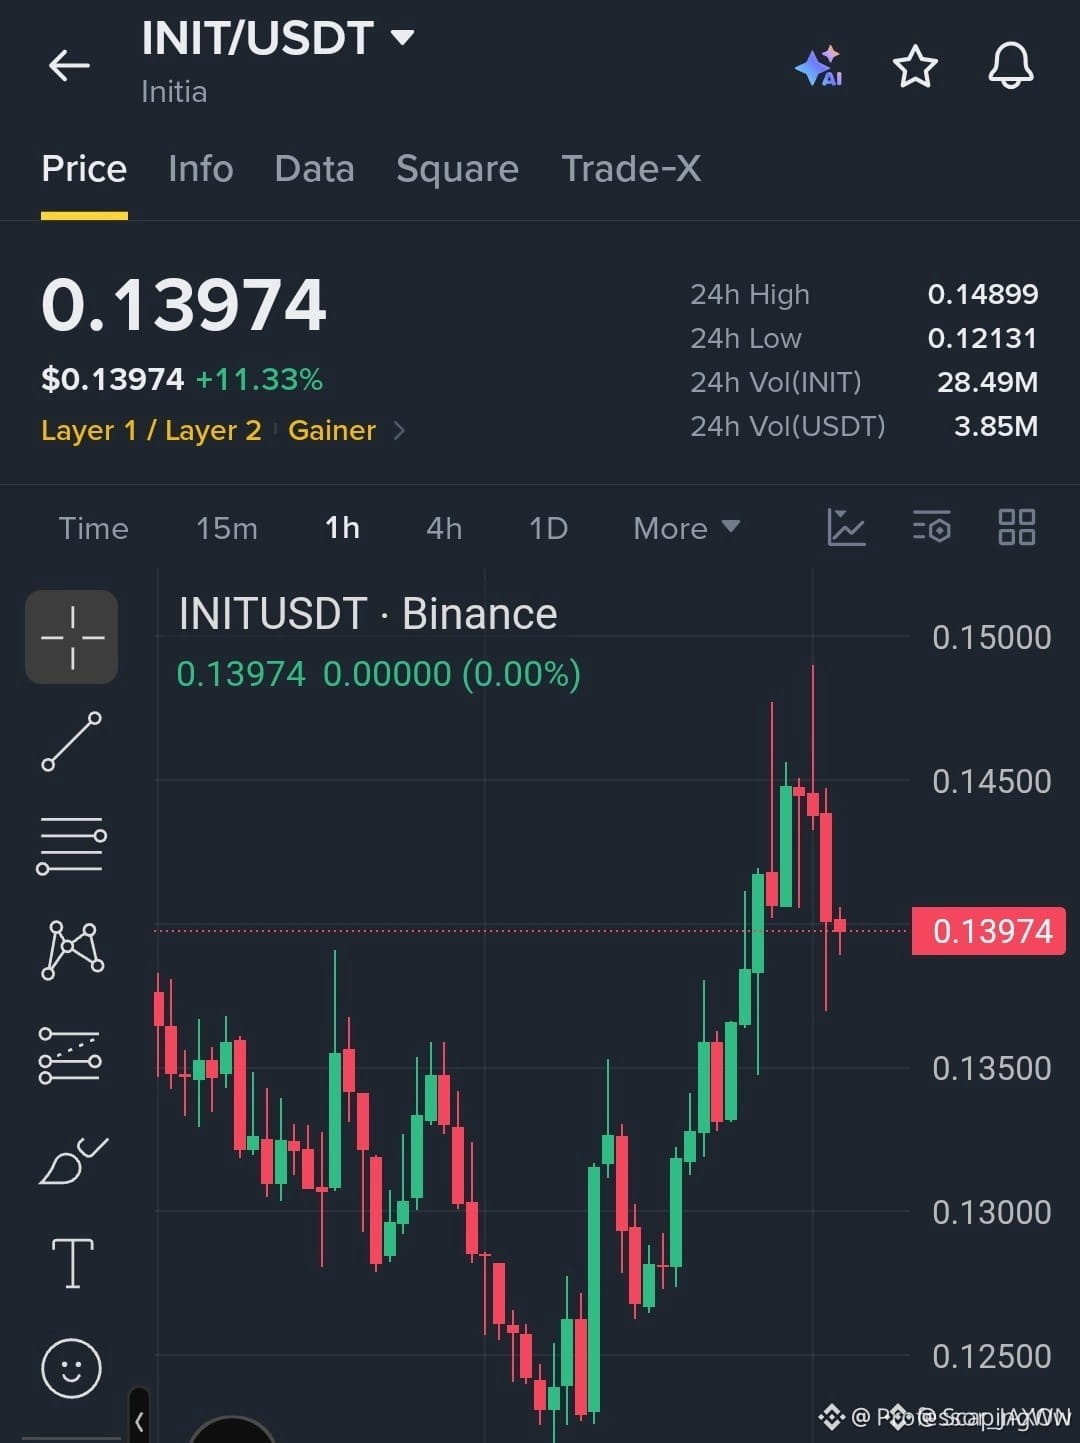
🔴 $INIT SLIDES INTO BEARISH ZONE AS SELLERS TAKE THE REINS! 📉
Entry: 0.1390-0.1410 ⚡
Target: 0.1360 🚀
Stop Loss: 0.1450 ⚠️
The market just punched a hard rejection at 0.1490, flipping the order flow to the downside. Sellers are now sweeping the 0.1420 bucket, and every attempt to claw back stalls on the 4‑hour chart. 🦈📊
With price nesting in the 0.1390‑0.1410 corridor, the next liquidity bucket sits at 0.1360, then cascades to 0.1320 and 0.1280. Volume spikes and a bearish RSI divergence signal the pressure is real. ⚡💡
💬 Are you ready to ride the short wave or waiting for a reversal trap?
⚠️ Not financial advice. Always manage your risk. 🛡️
🏷️ #INIT #ShortSetup #Bearish #Crypto
🔥 💎
🔴 $INIT SLIDES INTO BEARISH ZONE AS SELLERS TAKE THE REINS! 📉
Entry: 0.1390-0.1410 ⚡
Target: 0.1360 🚀
Stop Loss: 0.1450 ⚠️
The market just punched a hard rejection at 0.1490, flipping the order flow to the downside. Sellers are now sweeping the 0.1420 bucket, and every attempt to claw back stalls on the 4‑hour chart. 🦈📊
With price nesting in the 0.1390‑0.1410 corridor, the next liquidity bucket sits at 0.1360, then cascades to 0.1320 and 0.1280. Volume spikes and a bearish RSI divergence signal the pressure is real. ⚡💡
💬 Are you ready to ride the short wave or waiting for a reversal trap?
⚠️ Not financial advice. Always manage your risk. 🛡️
🏷️ #INIT #ShortSetup #Bearish #Crypto
🔥 💎
Entry: 0.1390-0.1410 ⚡
Target: 0.1360 🚀
Stop Loss: 0.1450 ⚠️
The market just punched a hard rejection at 0.1490, flipping the order flow to the downside. Sellers are now sweeping the 0.1420 bucket, and every attempt to claw back stalls on the 4‑hour chart. 🦈📊
With price nesting in the 0.1390‑0.1410 corridor, the next liquidity bucket sits at 0.1360, then cascades to 0.1320 and 0.1280. Volume spikes and a bearish RSI divergence signal the pressure is real. ⚡💡
💬 Are you ready to ride the short wave or waiting for a reversal trap?
⚠️ Not financial advice. Always manage your risk. 🛡️
🏷️ #INIT #ShortSetup #Bearish #Crypto
🔥 💎
8

·
--
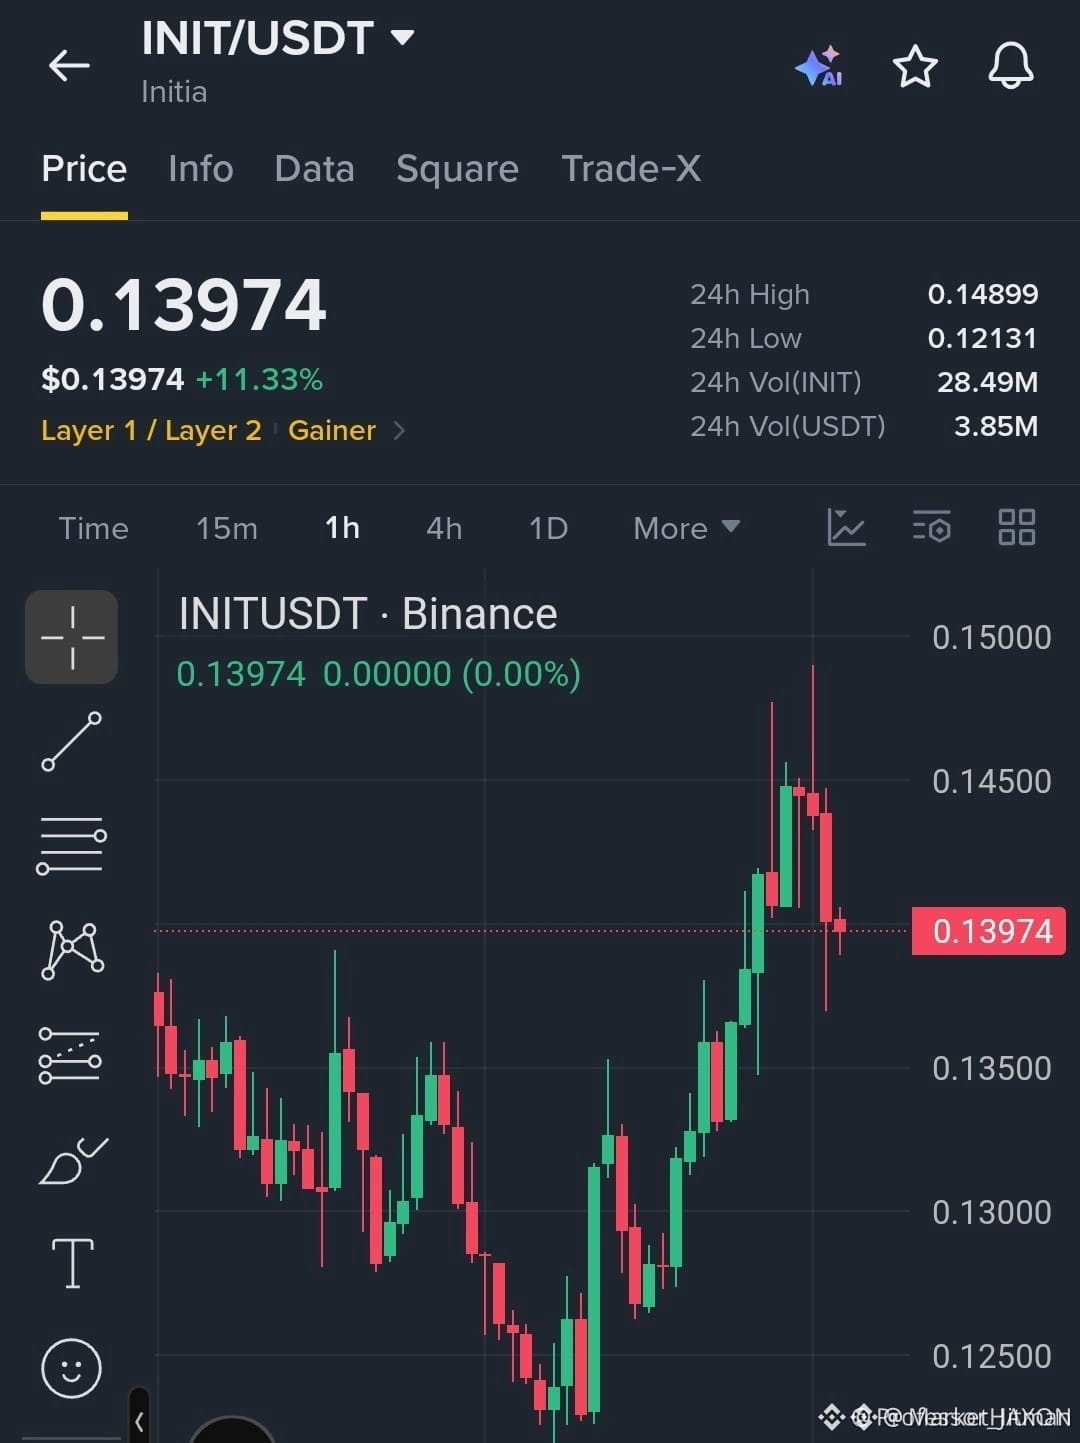
🚨 $INIT SLIDES INTO BEARISH ZONE – SELLERS TAKE REINS 🐻
Entry: 0.1390–0.1410 ⚡
Target: 0.1360, 0.1320, 0.1280 🚀
Stop Loss: 0.1450 ⚠️
📊 After a crisp rejection at 0.1490, smart‑money sharks have been dumping into the 0.1400 corridor, erasing buying pressure. 🦈 The 0.1420 level failed to hold, signaling the next wave of liquidity hunts toward the 0.1360‑0.1280 cluster. ⚡ Volume spikes on the 4‑hour chart confirm sellers are in control, and any bounce above 0.1450 will flip the script. 💡
💬 Are you shorting the dip or waiting for the next liquidity sweep? 👇
⚠️ Not financial advice. Always manage your risk. 🛡️
🏷️ #INIT #ShortSetup #Bearish #Crypto
🔥 💎
🚨 $INIT SLIDES INTO BEARISH ZONE – SELLERS TAKE REINS 🐻
Entry: 0.1390–0.1410 ⚡
Target: 0.1360, 0.1320, 0.1280 🚀
Stop Loss: 0.1450 ⚠️
📊 After a crisp rejection at 0.1490, smart‑money sharks have been dumping into the 0.1400 corridor, erasing buying pressure. 🦈 The 0.1420 level failed to hold, signaling the next wave of liquidity hunts toward the 0.1360‑0.1280 cluster. ⚡ Volume spikes on the 4‑hour chart confirm sellers are in control, and any bounce above 0.1450 will flip the script. 💡
💬 Are you shorting the dip or waiting for the next liquidity sweep? 👇
⚠️ Not financial advice. Always manage your risk. 🛡️
🏷️ #INIT #ShortSetup #Bearish #Crypto
🔥 💎
Entry: 0.1390–0.1410 ⚡
Target: 0.1360, 0.1320, 0.1280 🚀
Stop Loss: 0.1450 ⚠️
📊 After a crisp rejection at 0.1490, smart‑money sharks have been dumping into the 0.1400 corridor, erasing buying pressure. 🦈 The 0.1420 level failed to hold, signaling the next wave of liquidity hunts toward the 0.1360‑0.1280 cluster. ⚡ Volume spikes on the 4‑hour chart confirm sellers are in control, and any bounce above 0.1450 will flip the script. 💡
💬 Are you shorting the dip or waiting for the next liquidity sweep? 👇
⚠️ Not financial advice. Always manage your risk. 🛡️
🏷️ #INIT #ShortSetup #Bearish #Crypto
🔥 💎
8

·
--
Bullish
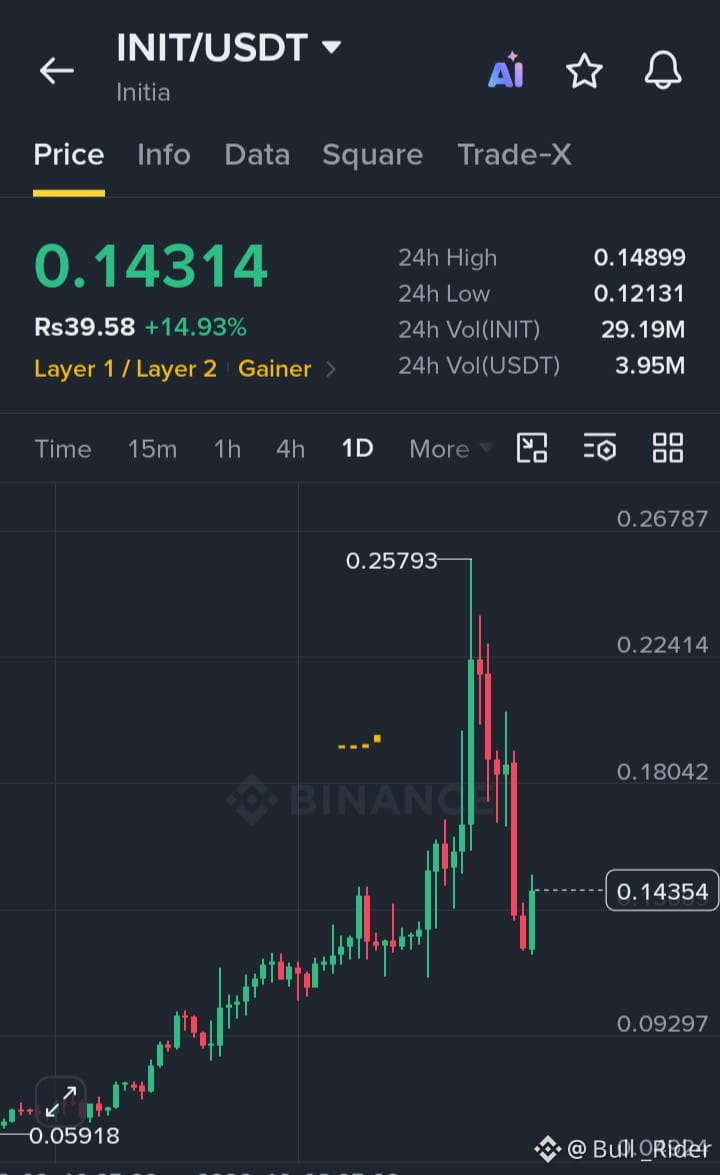
$INIT is showing strength from support, with buyers gradually taking control and momentum building for a potential continuation move.
Entry: 0.14000–0.14300
TP1: 0.14899
TP2: 0.18042
TP3: 0.22414
SL: 0.12800
Buy and Trade $ICP
{future}(ICPUSDT)
#INIT $INJ
{future}(INJUSDT)
{future}(INITUSDT)
$INIT is showing strength from support, with buyers gradually taking control and momentum building for a potential continuation move.
Entry: 0.14000–0.14300
TP1: 0.14899
TP2: 0.18042
TP3: 0.22414
SL: 0.12800
Buy and Trade $ICP
#INIT $INJ
Entry: 0.14000–0.14300
TP1: 0.14899
TP2: 0.18042
TP3: 0.22414
SL: 0.12800
Buy and Trade $ICP
#INIT $INJ
1
31

·
--
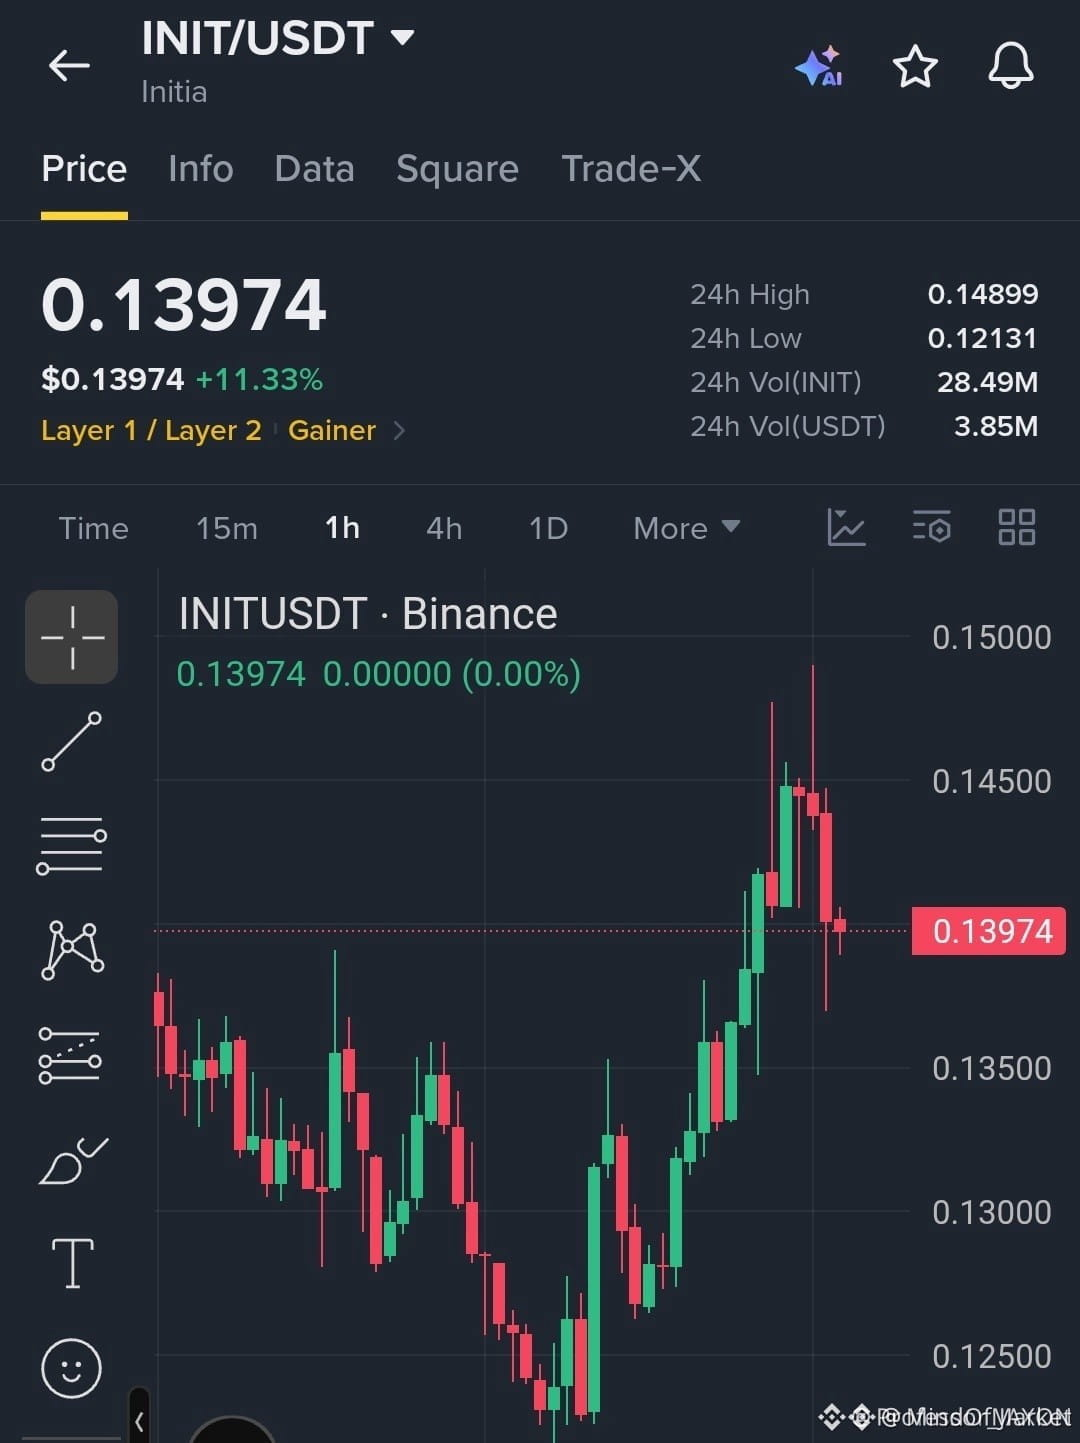
🔴 $INIT PLUNGES BELOW 0.14 AS SELLERS SEIZE CONTROL! 📉
Entry: 0.1390-0.1410 ⚡
Target: 0.1360 🚀
Target: 0.1320 🎯
Target: 0.1280 💥
Stop Loss: 0.1450 ⚠️
📊 After a sharp rejection at 0.1490, smart‑money 🦈 liquidity pools were ripped, forcing price back into the 0.1400 corridor. The failure to retake 0.1420 signals a structural break, and every tick below reinforces the bearish order block. 🔍 Volume spikes on the 4H confirm aggressive selling, while the 0.1450 barrier holds the last defensive line for longs.
💬 Are you positioning for the next leg down or waiting for a surprise bounce? 👇
⚠️ Not financial advice. Always manage your risk. 🛡️
🏷️ #INIT #ShortSetup #LiquiditySweep #Crypto
🔥 💎
🔴 $INIT PLUNGES BELOW 0.14 AS SELLERS SEIZE CONTROL! 📉
Entry: 0.1390-0.1410 ⚡
Target: 0.1360 🚀
Target: 0.1320 🎯
Target: 0.1280 💥
Stop Loss: 0.1450 ⚠️
📊 After a sharp rejection at 0.1490, smart‑money 🦈 liquidity pools were ripped, forcing price back into the 0.1400 corridor. The failure to retake 0.1420 signals a structural break, and every tick below reinforces the bearish order block. 🔍 Volume spikes on the 4H confirm aggressive selling, while the 0.1450 barrier holds the last defensive line for longs.
💬 Are you positioning for the next leg down or waiting for a surprise bounce? 👇
⚠️ Not financial advice. Always manage your risk. 🛡️
🏷️ #INIT #ShortSetup #LiquiditySweep #Crypto
🔥 💎
Entry: 0.1390-0.1410 ⚡
Target: 0.1360 🚀
Target: 0.1320 🎯
Target: 0.1280 💥
Stop Loss: 0.1450 ⚠️
📊 After a sharp rejection at 0.1490, smart‑money 🦈 liquidity pools were ripped, forcing price back into the 0.1400 corridor. The failure to retake 0.1420 signals a structural break, and every tick below reinforces the bearish order block. 🔍 Volume spikes on the 4H confirm aggressive selling, while the 0.1450 barrier holds the last defensive line for longs.
💬 Are you positioning for the next leg down or waiting for a surprise bounce? 👇
⚠️ Not financial advice. Always manage your risk. 🛡️
🏷️ #INIT #ShortSetup #LiquiditySweep #Crypto
🔥 💎
10


·
--
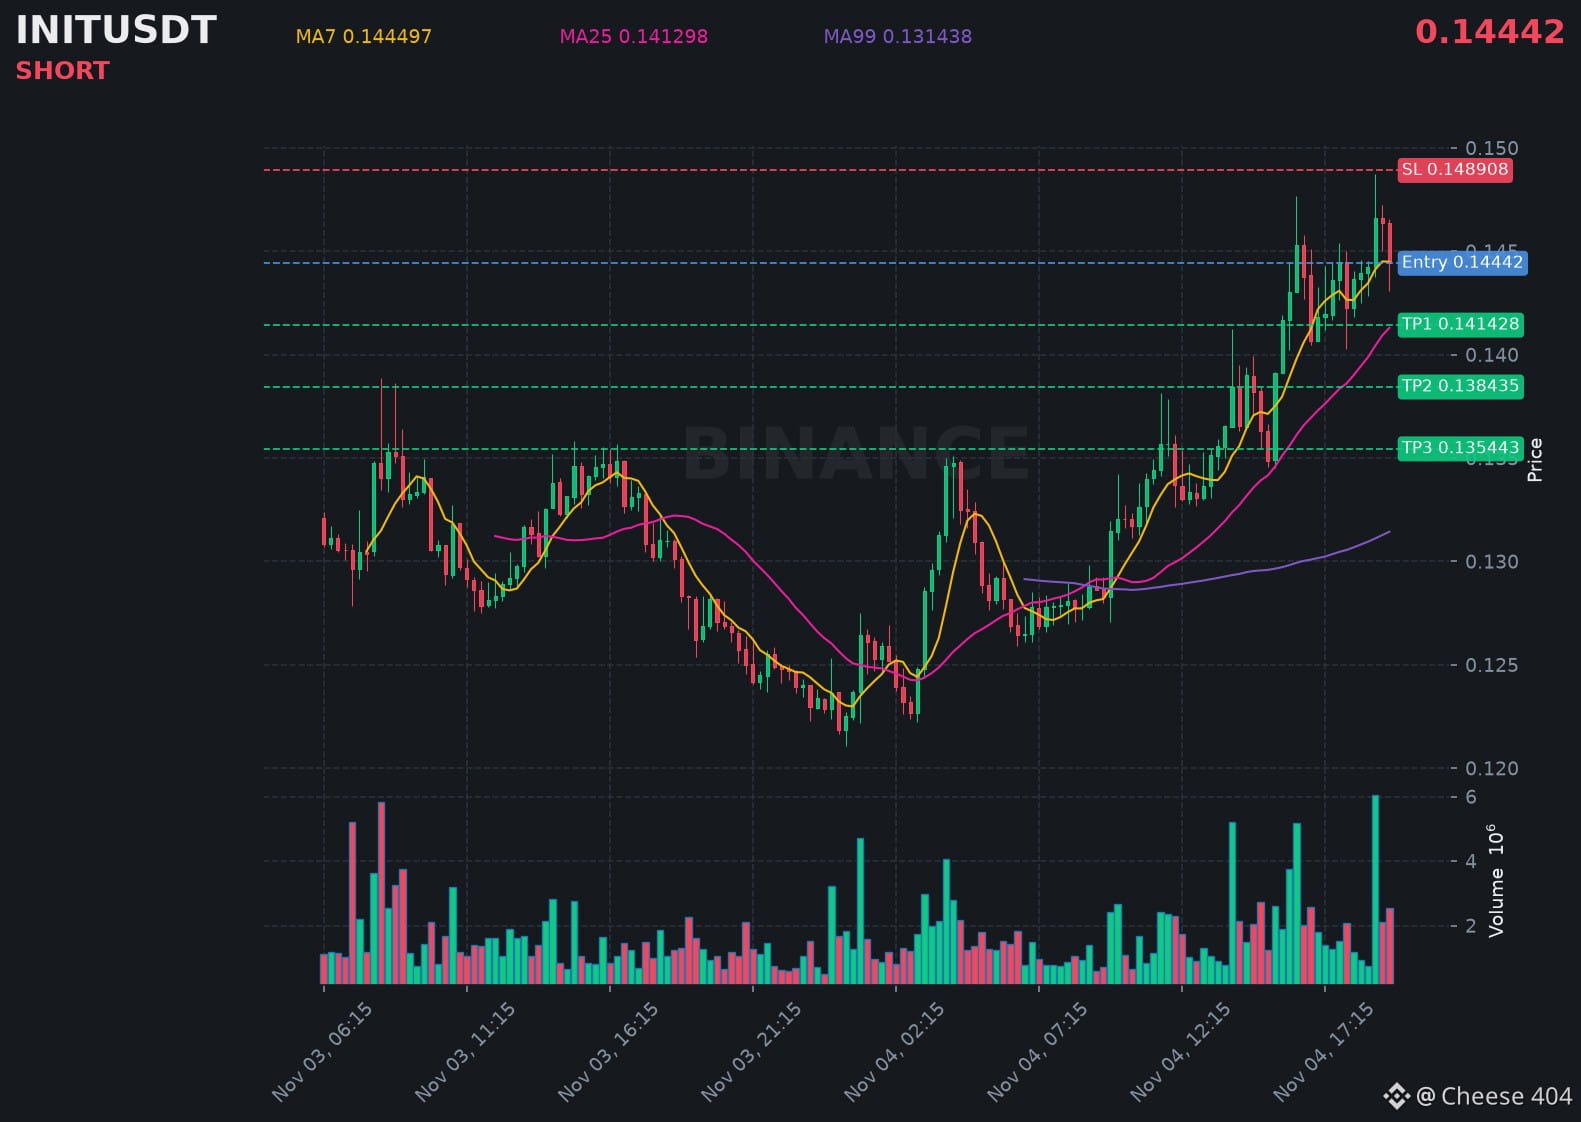
$INIT just printed a strong bearish candle, signaling more downside pressure building right now.
📍 @ 0.14442 | Volume: 0.37M USD
RSI 60 | EMA20: 0.142297 USD
📈 Trade Plan:
📈 Entry: 0.143522 – 0.145318
🛑 Stop Loss: 0.148908
🎯 TP1: 0.141428
🎯 TP2: 0.138435
🎯 TP3: 0.135443
Waiting for confirmation, then riding the downtrend.
👉 $INIT 👈 Catch it
#INIT
$INIT just printed a strong bearish candle, signaling more downside pressure building right now.
📍 @ 0.14442 | Volume: 0.37M USD
RSI 60 | EMA20: 0.142297 USD
📈 Trade Plan:
📈 Entry: 0.143522 – 0.145318
🛑 Stop Loss: 0.148908
🎯 TP1: 0.141428
🎯 TP2: 0.138435
🎯 TP3: 0.135443
Waiting for confirmation, then riding the downtrend.
👉 $INIT 👈 Catch it
#INIT
📍 @ 0.14442 | Volume: 0.37M USD
RSI 60 | EMA20: 0.142297 USD
📈 Trade Plan:
📈 Entry: 0.143522 – 0.145318
🛑 Stop Loss: 0.148908
🎯 TP1: 0.141428
🎯 TP2: 0.138435
🎯 TP3: 0.135443
Waiting for confirmation, then riding the downtrend.
👉 $INIT 👈 Catch it
#INIT
64

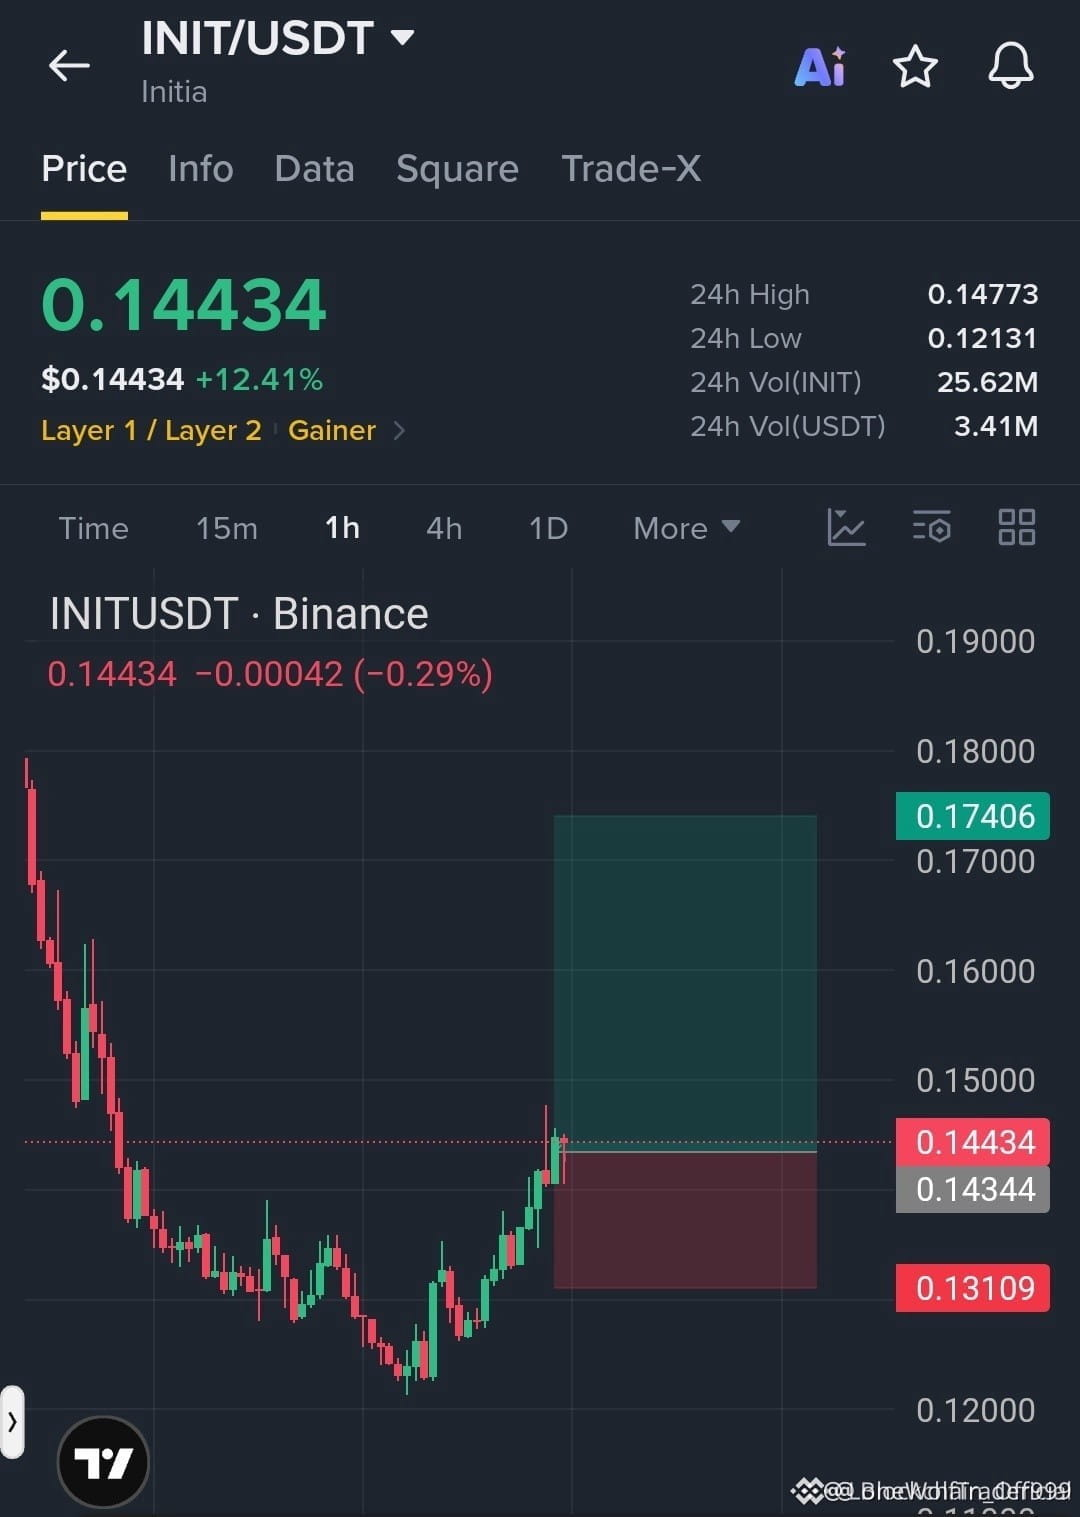
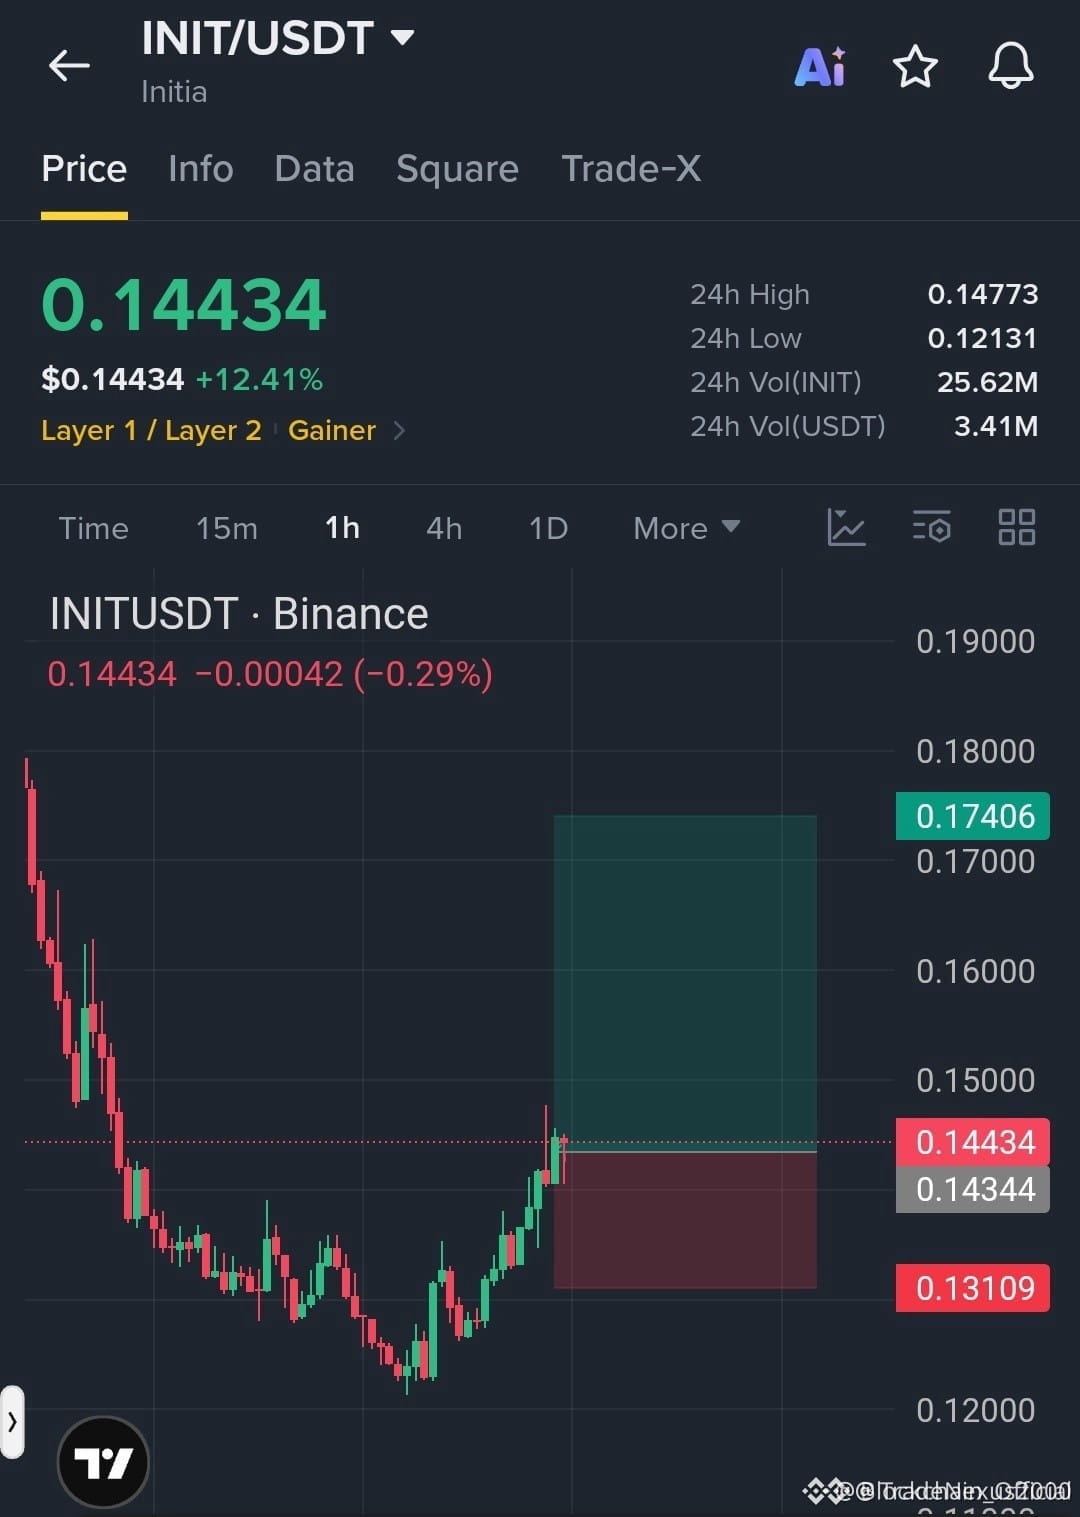
🚀📈 $INIT ON THE CUSP OF A BULLISH REBOUND – EYES ON $0.174
Entry: 0.1434-0.1443 ⚡
Target: 0.1520 / 0.1630 / 0.1740 🚀
Stop Loss: 0.1310 ⚠️
📊 Buyers have seized the $0.121 floor and are now stacking orders above $0.143, carving a clean demand zone. ⚡ Momentum is ticking up on the 4H, with volume swelling as smart money nudges the price higher. 🌊 If the swing holds, each target layers a fresh liquidity grab, turning the run into a multi‑stage ascent.
💬 Who’s ready to ride this wave and lock in the first profit band? 👇
⚠️ Not financial advice. Always manage your risk. 🛡️
🏷️ #INIT #LongSetup #BullishRecovery #Crypto
🔥 💎
🚀📈 $INIT ON THE CUSP OF A BULLISH REBOUND – EYES ON $0.174
Entry: 0.1434-0.1443 ⚡
Target: 0.1520 / 0.1630 / 0.1740 🚀
Stop Loss: 0.1310 ⚠️
📊 Buyers have seized the $0.121 floor and are now stacking orders above $0.143, carving a clean demand zone. ⚡ Momentum is ticking up on the 4H, with volume swelling as smart money nudges the price higher. 🌊 If the swing holds, each target layers a fresh liquidity grab, turning the run into a multi‑stage ascent.
💬 Who’s ready to ride this wave and lock in the first profit band? 👇
⚠️ Not financial advice. Always manage your risk. 🛡️
🏷️ #INIT #LongSetup #BullishRecovery #Crypto
🔥 💎
Entry: 0.1434-0.1443 ⚡
Target: 0.1520 / 0.1630 / 0.1740 🚀
Stop Loss: 0.1310 ⚠️
📊 Buyers have seized the $0.121 floor and are now stacking orders above $0.143, carving a clean demand zone. ⚡ Momentum is ticking up on the 4H, with volume swelling as smart money nudges the price higher. 🌊 If the swing holds, each target layers a fresh liquidity grab, turning the run into a multi‑stage ascent.
💬 Who’s ready to ride this wave and lock in the first profit band? 👇
⚠️ Not financial advice. Always manage your risk. 🛡️
🏷️ #INIT #LongSetup #BullishRecovery #Crypto
🔥 💎
1

🚀 🟢 $INIT SETTING UP FOR A POWERFUL BULLISH RECOVERY TO $0.174
Entry: 0.1434-0.1443 ⚡
Target: 0.1520 / 0.1630 / 0.1740 🚀
Stop Loss: 0.1310 ⚠️
📊 The bounce off the $0.121 support zone has cleared the last seller liquidity, and buyers are now anchoring a fresh order block near $0.143. 📌 Holding above this zone keeps the smart‑money flow intact, while volume on the 4H chart is expanding with each higher close. 🌊 If the bullish pressure sustains, the price ladder climbs toward the next strategic targets, delivering a clean risk‑reward profile.
💬 How will you position for the next institutional push to $0.174? 👇
⚠️ Not financial advice. Always manage your risk. 🛡️
🏷️ #INIT #LongSetup #Bullish #Crypto
🚀 ⚡
🚀 🟢 $INIT SETTING UP FOR A POWERFUL BULLISH RECOVERY TO $0.174
Entry: 0.1434-0.1443 ⚡
Target: 0.1520 / 0.1630 / 0.1740 🚀
Stop Loss: 0.1310 ⚠️
📊 The bounce off the $0.121 support zone has cleared the last seller liquidity, and buyers are now anchoring a fresh order block near $0.143. 📌 Holding above this zone keeps the smart‑money flow intact, while volume on the 4H chart is expanding with each higher close. 🌊 If the bullish pressure sustains, the price ladder climbs toward the next strategic targets, delivering a clean risk‑reward profile.
💬 How will you position for the next institutional push to $0.174? 👇
⚠️ Not financial advice. Always manage your risk. 🛡️
🏷️ #INIT #LongSetup #Bullish #Crypto
🚀 ⚡
Entry: 0.1434-0.1443 ⚡
Target: 0.1520 / 0.1630 / 0.1740 🚀
Stop Loss: 0.1310 ⚠️
📊 The bounce off the $0.121 support zone has cleared the last seller liquidity, and buyers are now anchoring a fresh order block near $0.143. 📌 Holding above this zone keeps the smart‑money flow intact, while volume on the 4H chart is expanding with each higher close. 🌊 If the bullish pressure sustains, the price ladder climbs toward the next strategic targets, delivering a clean risk‑reward profile.
💬 How will you position for the next institutional push to $0.174? 👇
⚠️ Not financial advice. Always manage your risk. 🛡️
🏷️ #INIT #LongSetup #Bullish #Crypto
🚀 ⚡
3

INIT Shows Strong Bullish Momentum!
INIT is gaining attention after recording a 15.90% increase over the last 24 hours on Binance Spot.
The latest price movement has brought fresh interest to this token. Traders will be watching whether buying momentum can continue or profit-taking begins.
Can INIT maintain its upward momentum?
#INIT #CryptoPump #Altcoins #BinanceSquare
INIT Shows Strong Bullish Momentum!
INIT is gaining attention after recording a 15.90% increase over the last 24 hours on Binance Spot.
The latest price movement has brought fresh interest to this token. Traders will be watching whether buying momentum can continue or profit-taking begins.
Can INIT maintain its upward momentum?
#INIT #CryptoPump #Altcoins #BinanceSquare
INIT is gaining attention after recording a 15.90% increase over the last 24 hours on Binance Spot.
The latest price movement has brought fresh interest to this token. Traders will be watching whether buying momentum can continue or profit-taking begins.
Can INIT maintain its upward momentum?
#INIT #CryptoPump #Altcoins #BinanceSquare
87

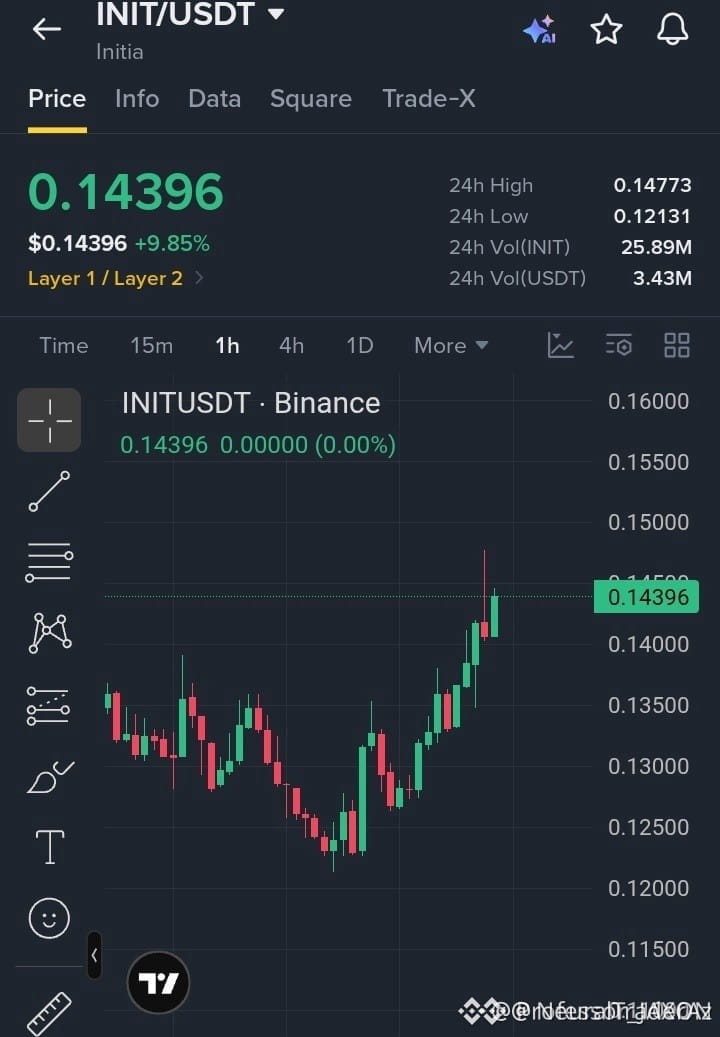
🚀 $INIT CHASES HIGHER HIGHS ON 1H 📈
Entry: 0.14100‑0.14400 ⚡
Target: 0.14750 🚀
Target: 0.15100 🚀
Target: 0.15500 🚀
Stop Loss: 0.13750 ⚠️
📊 The 1H chart is stamping a clean series of higher highs and higher lows, a textbook bullish structure that signals institutional accumulation. ⚡ Momentum is accelerating as price eyes the 0.14770 ceiling; a decisive break could unleash a wave toward the next resistance cluster. 📌 Entry should be timed on a healthy pullback into the 0.14100‑0.14400 zone, where the order block has already absorbed sellers twice. 🌊 Liquidity pools sit just below the stop, offering a tight risk profile.
💬 Are you positioning for the next upside thrust or waiting for a deeper retracement? 👇
⚠️ Not financial advice. Always manage your risk. 🛡️
🏷️ #INIT #LongSetup #Bullish #Crypto
🔥 💎
🚀 $INIT CHASES HIGHER HIGHS ON 1H 📈
Entry: 0.14100‑0.14400 ⚡
Target: 0.14750 🚀
Target: 0.15100 🚀
Target: 0.15500 🚀
Stop Loss: 0.13750 ⚠️
📊 The 1H chart is stamping a clean series of higher highs and higher lows, a textbook bullish structure that signals institutional accumulation. ⚡ Momentum is accelerating as price eyes the 0.14770 ceiling; a decisive break could unleash a wave toward the next resistance cluster. 📌 Entry should be timed on a healthy pullback into the 0.14100‑0.14400 zone, where the order block has already absorbed sellers twice. 🌊 Liquidity pools sit just below the stop, offering a tight risk profile.
💬 Are you positioning for the next upside thrust or waiting for a deeper retracement? 👇
⚠️ Not financial advice. Always manage your risk. 🛡️
🏷️ #INIT #LongSetup #Bullish #Crypto
🔥 💎
Entry: 0.14100‑0.14400 ⚡
Target: 0.14750 🚀
Target: 0.15100 🚀
Target: 0.15500 🚀
Stop Loss: 0.13750 ⚠️
📊 The 1H chart is stamping a clean series of higher highs and higher lows, a textbook bullish structure that signals institutional accumulation. ⚡ Momentum is accelerating as price eyes the 0.14770 ceiling; a decisive break could unleash a wave toward the next resistance cluster. 📌 Entry should be timed on a healthy pullback into the 0.14100‑0.14400 zone, where the order block has already absorbed sellers twice. 🌊 Liquidity pools sit just below the stop, offering a tight risk profile.
💬 Are you positioning for the next upside thrust or waiting for a deeper retracement? 👇
⚠️ Not financial advice. Always manage your risk. 🛡️
🏷️ #INIT #LongSetup #Bullish #Crypto
🔥 💎
3
·
--
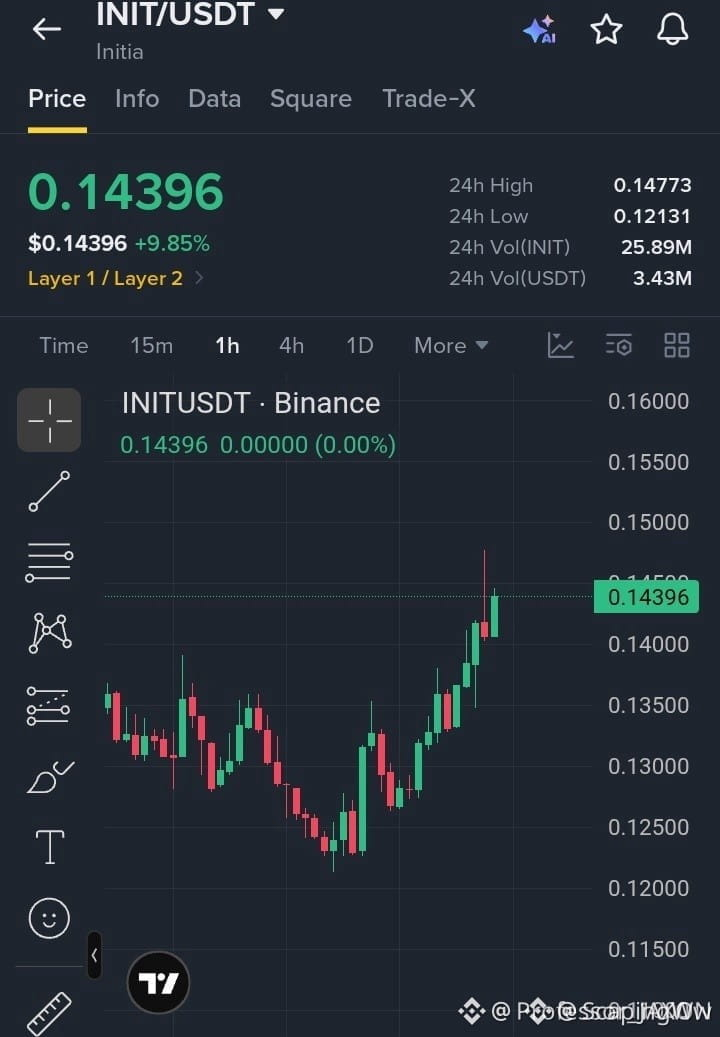
🚀 $INIT GEARING UP FOR BULLISH SURGE AS WHALES RECLAIM CONTROL 🟢
Entry: 0.14100-0.14400 ⚡
Target: 0.14750 🚀
Target: 0.15100 🚀
Target: 0.15500 🚀
Stop Loss: 0.13750 ⚠️
📊 The 1H chart is stacking higher highs and higher lows, a classic signature of smart‑money accumulation. 🦈 Buyers are anchoring around the 0.14770 pivot; once they break clean, the order flow flips and fuels the next resistance wave. ⚡ Expect a tidy pullback into the entry band before the upside cannon fires. 📌 Keep an eye on volume spikes as the liquidity pool thins out.
💬 Who’s ready to ride the next wave of $INIT power? 👇
⚠️ Not financial advice. Always manage your risk. 🛡️
🏷️ #INIT #LongSetup #BullishMomentum #Crypto
🔥 💎
🚀 $INIT GEARING UP FOR BULLISH SURGE AS WHALES RECLAIM CONTROL 🟢
Entry: 0.14100-0.14400 ⚡
Target: 0.14750 🚀
Target: 0.15100 🚀
Target: 0.15500 🚀
Stop Loss: 0.13750 ⚠️
📊 The 1H chart is stacking higher highs and higher lows, a classic signature of smart‑money accumulation. 🦈 Buyers are anchoring around the 0.14770 pivot; once they break clean, the order flow flips and fuels the next resistance wave. ⚡ Expect a tidy pullback into the entry band before the upside cannon fires. 📌 Keep an eye on volume spikes as the liquidity pool thins out.
💬 Who’s ready to ride the next wave of $INIT power? 👇
⚠️ Not financial advice. Always manage your risk. 🛡️
🏷️ #INIT #LongSetup #BullishMomentum #Crypto
🔥 💎
Entry: 0.14100-0.14400 ⚡
Target: 0.14750 🚀
Target: 0.15100 🚀
Target: 0.15500 🚀
Stop Loss: 0.13750 ⚠️
📊 The 1H chart is stacking higher highs and higher lows, a classic signature of smart‑money accumulation. 🦈 Buyers are anchoring around the 0.14770 pivot; once they break clean, the order flow flips and fuels the next resistance wave. ⚡ Expect a tidy pullback into the entry band before the upside cannon fires. 📌 Keep an eye on volume spikes as the liquidity pool thins out.
💬 Who’s ready to ride the next wave of $INIT power? 👇
⚠️ Not financial advice. Always manage your risk. 🛡️
🏷️ #INIT #LongSetup #BullishMomentum #Crypto
🔥 💎
2

·
--
$INIT
{future}(INITUSDT)
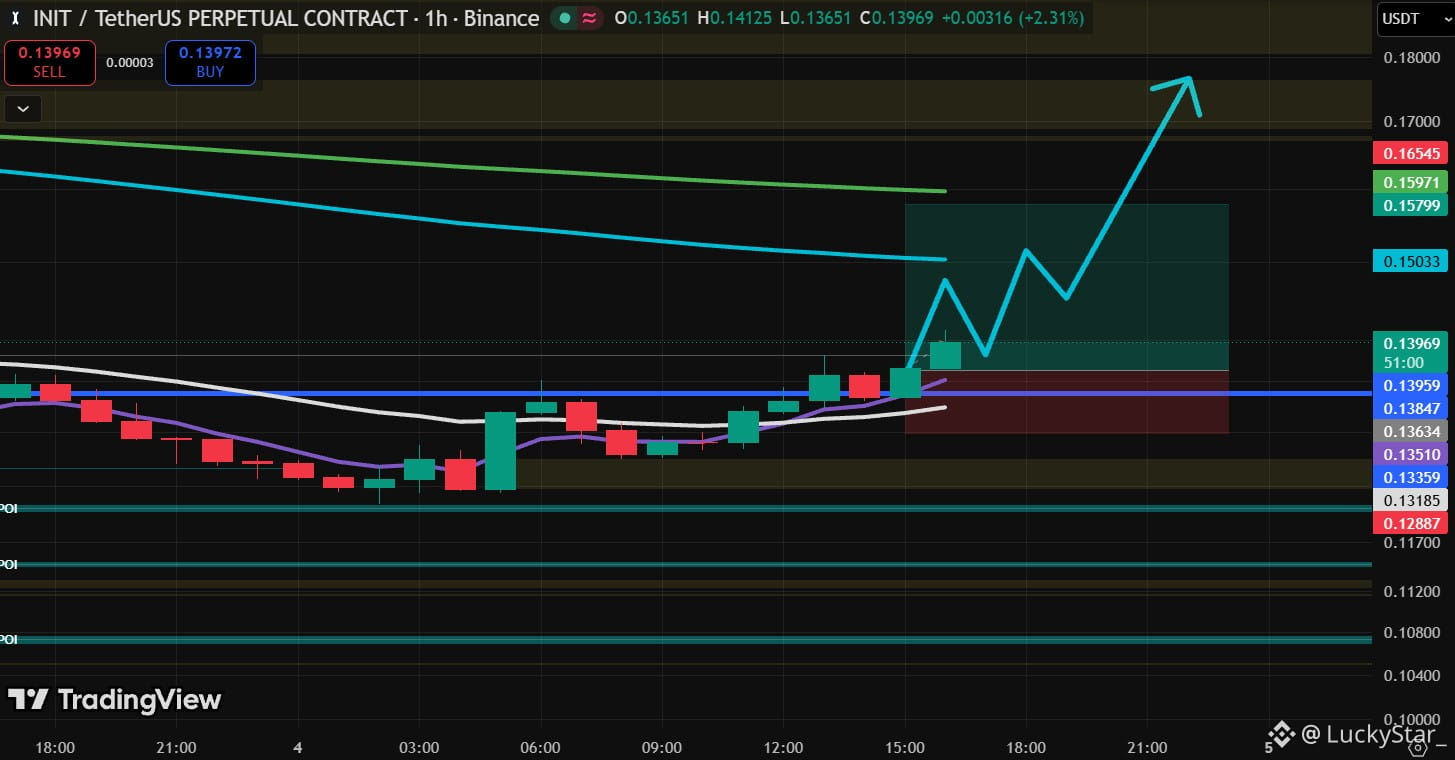
📈 IS A NEW LONG SETUP ALREADY FORMING?
The price is returning to a key support zone.
🔍 THIS IS WHERE BUYERS' INTEREST MAY APPEAR.
🕯️ A bullish candle or Engulfing can give an additional signal.
🎯 TP1: 0.1450
🎯 TP2: 0.1503
🎯 TP3: 0.1580
🎯 TP4: 0.1654
🎯 TP5: 0.1760
📍 Entry: 0.1385 – 0.1400
🛑 Stop: 0.1320
#INIT #trading #TradingSignals
$INIT
📈 IS A NEW LONG SETUP ALREADY FORMING?
The price is returning to a key support zone.
🔍 THIS IS WHERE BUYERS' INTEREST MAY APPEAR.
🕯️ A bullish candle or Engulfing can give an additional signal.
🎯 TP1: 0.1450
🎯 TP2: 0.1503
🎯 TP3: 0.1580
🎯 TP4: 0.1654
🎯 TP5: 0.1760
📍 Entry: 0.1385 – 0.1400
🛑 Stop: 0.1320
#INIT #trading #TradingSignals
📈 IS A NEW LONG SETUP ALREADY FORMING?
The price is returning to a key support zone.
🔍 THIS IS WHERE BUYERS' INTEREST MAY APPEAR.
🕯️ A bullish candle or Engulfing can give an additional signal.
🎯 TP1: 0.1450
🎯 TP2: 0.1503
🎯 TP3: 0.1580
🎯 TP4: 0.1654
🎯 TP5: 0.1760
📍 Entry: 0.1385 – 0.1400
🛑 Stop: 0.1320
#INIT #trading #TradingSignals
16

Direction versus Confirmation in $INIT
Current Data
$INIT is moving up hourly with volume above its baseline. The price 0.13591 sits near the daily average volume 2.88307e+06. This indicates active participation during the current session.
Peer Context
Verified observations show different patterns. $AMDB is down hourly with volume above its baseline. $ZAMA is up hourly but volume is not above its baseline. These comparisons highlight that shared direction does not imply correlation. They are separate assets trading on the same venue.
Limits of Comparison
Watching these three together tells us about current activity, not causes. A rise in $AMDB while $ZAMA falls does not prove capital rotation. It only shows independent price action. We cannot use this to predict sector moves or common drivers.
How to Reassess
Focus on how the move holds rather than just direction. If $INIT stays above 0.12648 while volume remains elevated, the move has conviction. If it breaks below 0.12648 with declining volume, the move may fail. Check if the hourly gain persists over the next few hours. A sustained rise with high volume is stronger than a quick spike that fades. Use this method to evaluate quality, not just speed.
Probabilistic market research, not a recommendation or guaranteed return.
The comparison to keep in mind: $AMDB has hourly direction down and volume above its baseline; $ZAMA has hourly direction up and volume not above its baseline. This alone does not establish correlation.
Which matters more in this comparison: direction or how the move holds?
#INIT #AMDB #ZAMA
Direction versus Confirmation in $INIT
Current Data
$INIT is moving up hourly with volume above its baseline. The price 0.13591 sits near the daily average volume 2.88307e+06. This indicates active participation during the current session.
Peer Context
Verified observations show different patterns. $AMDB is down hourly with volume above its baseline. $ZAMA is up hourly but volume is not above its baseline. These comparisons highlight that shared direction does not imply correlation. They are separate assets trading on the same venue.
Limits of Comparison
Watching these three together tells us about current activity, not causes. A rise in $AMDB while $ZAMA falls does not prove capital rotation. It only shows independent price action. We cannot use this to predict sector moves or common drivers.
How to Reassess
Focus on how the move holds rather than just direction. If $INIT stays above 0.12648 while volume remains elevated, the move has conviction. If it breaks below 0.12648 with declining volume, the move may fail. Check if the hourly gain persists over the next few hours. A sustained rise with high volume is stronger than a quick spike that fades. Use this method to evaluate quality, not just speed.
Probabilistic market research, not a recommendation or guaranteed return.
The comparison to keep in mind: $AMDB has hourly direction down and volume above its baseline; $ZAMA has hourly direction up and volume not above its baseline. This alone does not establish correlation.
Which matters more in this comparison: direction or how the move holds?
#INIT #AMDB #ZAMA
Current Data
$INIT is moving up hourly with volume above its baseline. The price 0.13591 sits near the daily average volume 2.88307e+06. This indicates active participation during the current session.
Peer Context
Verified observations show different patterns. $AMDB is down hourly with volume above its baseline. $ZAMA is up hourly but volume is not above its baseline. These comparisons highlight that shared direction does not imply correlation. They are separate assets trading on the same venue.
Limits of Comparison
Watching these three together tells us about current activity, not causes. A rise in $AMDB while $ZAMA falls does not prove capital rotation. It only shows independent price action. We cannot use this to predict sector moves or common drivers.
How to Reassess
Focus on how the move holds rather than just direction. If $INIT stays above 0.12648 while volume remains elevated, the move has conviction. If it breaks below 0.12648 with declining volume, the move may fail. Check if the hourly gain persists over the next few hours. A sustained rise with high volume is stronger than a quick spike that fades. Use this method to evaluate quality, not just speed.
Probabilistic market research, not a recommendation or guaranteed return.
The comparison to keep in mind: $AMDB has hourly direction down and volume above its baseline; $ZAMA has hourly direction up and volume not above its baseline. This alone does not establish correlation.
Which matters more in this comparison: direction or how the move holds?
#INIT #AMDB #ZAMA
46

·
--
Bullish
INIT shorts just got caught at $0.13797.
Buyers are pushing through the liquidation zone.
$INIT
{future}(INITUSDT)
$CLANKER
{future}(CLANKERUSDT)
$BMT
{future}(BMTUSDT)
🟢 LIQUIDITY ZONE HIT 🟢
Short liquidation spotted 🧨
$5.846K cleared at $0.13797
Upside liquidity swept — watch reaction 👀
🎯 TP Targets:
TP1: ~$0.1390
TP2: ~$0.1400
TP3: ~$0.1410
#INIT
INIT shorts just got caught at $0.13797.
Buyers are pushing through the liquidation zone.
$INIT
$CLANKER
$BMT
🟢 LIQUIDITY ZONE HIT 🟢
Short liquidation spotted 🧨
$5.846K cleared at $0.13797
Upside liquidity swept — watch reaction 👀
🎯 TP Targets:
TP1: ~$0.1390
TP2: ~$0.1400
TP3: ~$0.1410
#INIT
Buyers are pushing through the liquidation zone.
$INIT
$CLANKER
$BMT
🟢 LIQUIDITY ZONE HIT 🟢
Short liquidation spotted 🧨
$5.846K cleared at $0.13797
Upside liquidity swept — watch reaction 👀
🎯 TP Targets:
TP1: ~$0.1390
TP2: ~$0.1400
TP3: ~$0.1410
#INIT
16
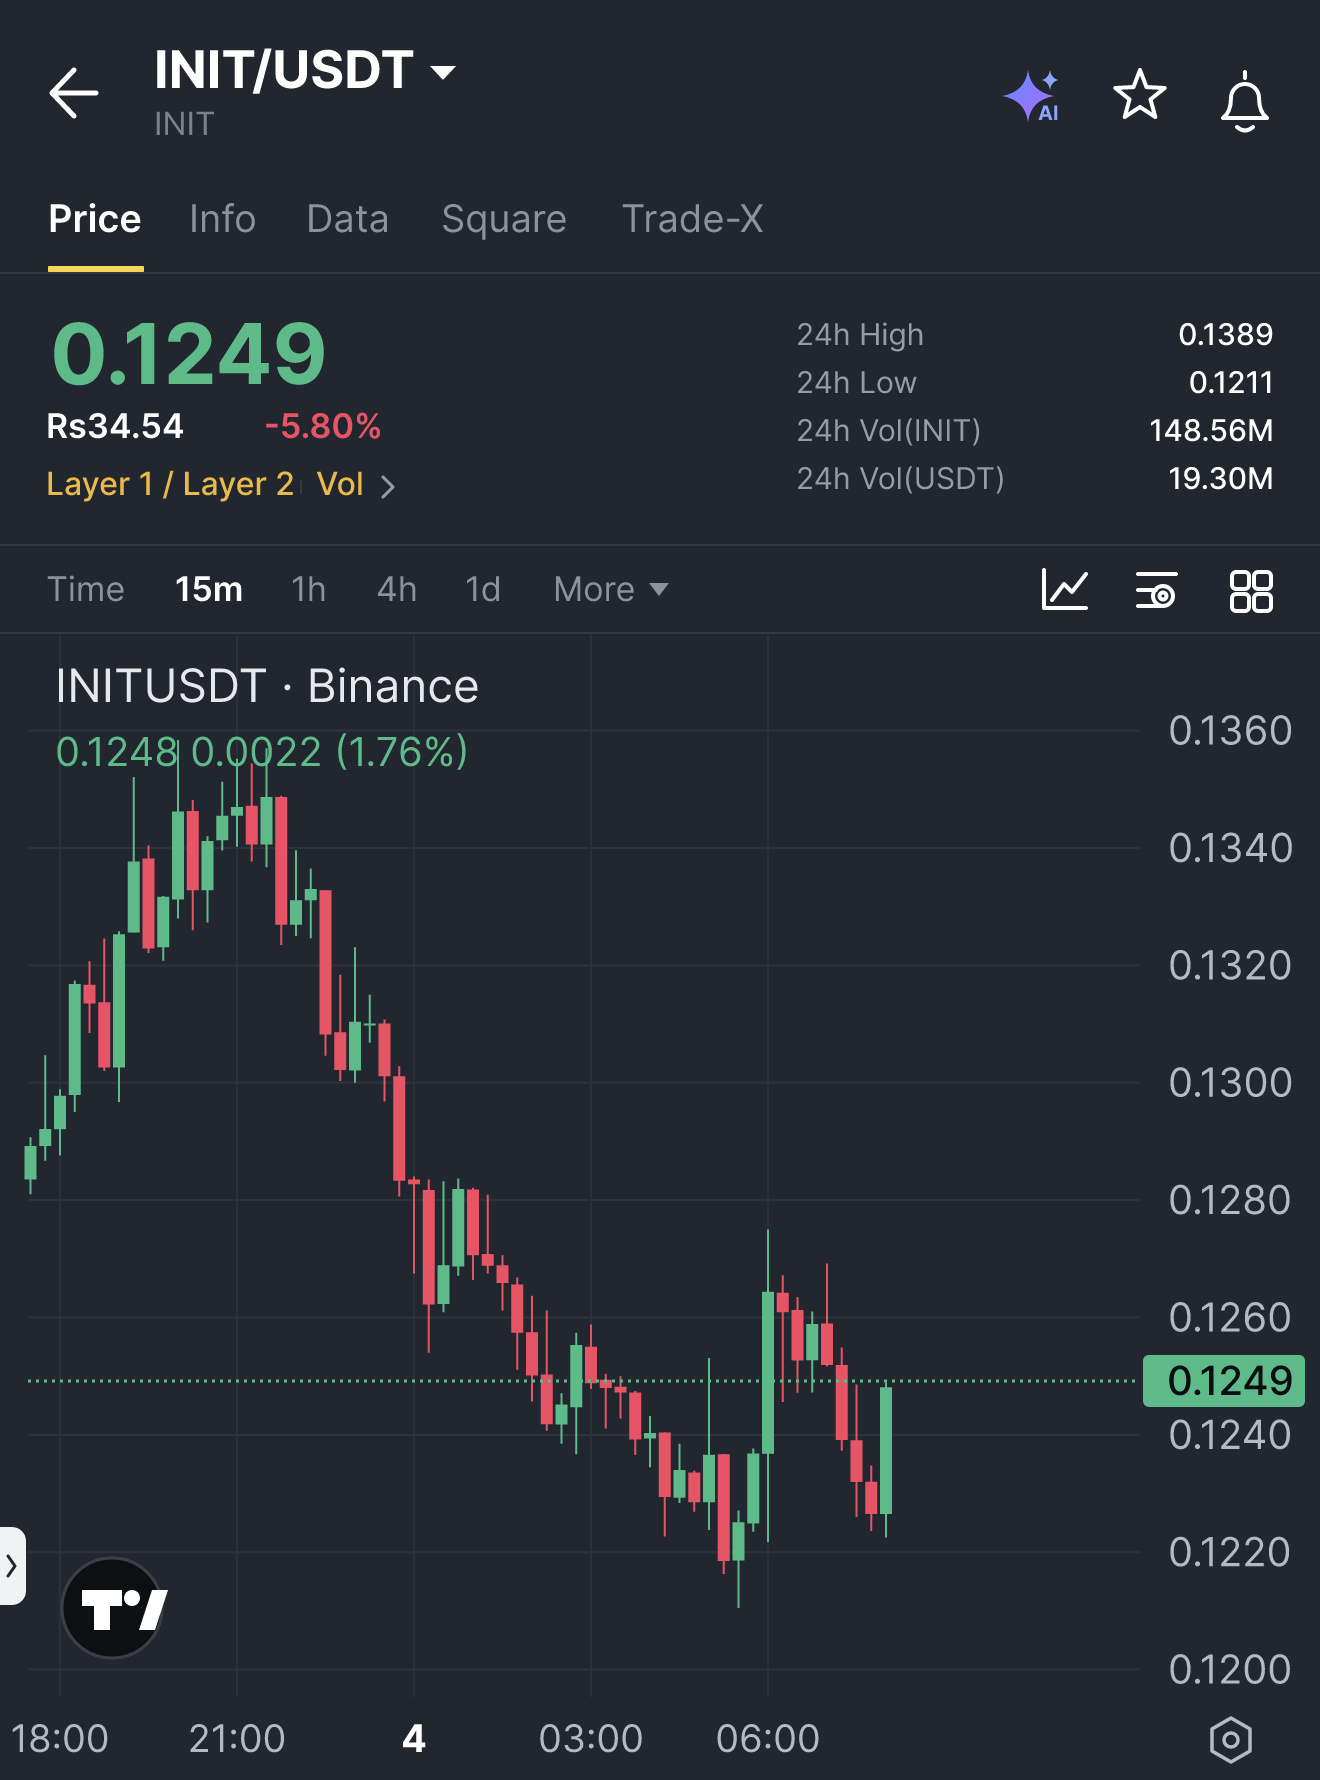
🚀 $INIT BREAKS THE PREVIOUS HIGH ON A SWEEPING BUYER RUSH! 🟢
Entry: 0.12497 ⚡
Target: 0.12937 🚀
Stop Loss: 0.12204 ⚠️
📊 Buyers ripped through the last candle’s high after a sustained decline, flipping the momentum into a clean recovery. 🦈 The order block at 0.12497 acted like a magnet, pulling in smart‑money liquidity and fueling a rapid price climb. ⚡ Volume spikes on the 4‑hour chart confirm the push, and each target line is a fresh liquidity pool ready to be claimed.
💬 Are you loading up now or waiting for the next dip to catch the swing? 👇
⚠️ Not financial advice. Always manage your risk. 🛡️
🏷️ #INIT #LongSetup #Breakout #Crypto
🔥 💎
🚀 $INIT BREAKS THE PREVIOUS HIGH ON A SWEEPING BUYER RUSH! 🟢
Entry: 0.12497 ⚡
Target: 0.12937 🚀
Stop Loss: 0.12204 ⚠️
📊 Buyers ripped through the last candle’s high after a sustained decline, flipping the momentum into a clean recovery. 🦈 The order block at 0.12497 acted like a magnet, pulling in smart‑money liquidity and fueling a rapid price climb. ⚡ Volume spikes on the 4‑hour chart confirm the push, and each target line is a fresh liquidity pool ready to be claimed.
💬 Are you loading up now or waiting for the next dip to catch the swing? 👇
⚠️ Not financial advice. Always manage your risk. 🛡️
🏷️ #INIT #LongSetup #Breakout #Crypto
🔥 💎
Entry: 0.12497 ⚡
Target: 0.12937 🚀
Stop Loss: 0.12204 ⚠️
📊 Buyers ripped through the last candle’s high after a sustained decline, flipping the momentum into a clean recovery. 🦈 The order block at 0.12497 acted like a magnet, pulling in smart‑money liquidity and fueling a rapid price climb. ⚡ Volume spikes on the 4‑hour chart confirm the push, and each target line is a fresh liquidity pool ready to be claimed.
💬 Are you loading up now or waiting for the next dip to catch the swing? 👇
⚠️ Not financial advice. Always manage your risk. 🛡️
🏷️ #INIT #LongSetup #Breakout #Crypto
🔥 💎
13
Log in to explore more content
Join global crypto users on Binance Square
⚡️ Get latest and useful information about crypto.
💬 Trusted by the world’s largest crypto exchange.
👍 Discover real insights from verified creators.
Email / Phone number
Trending Topics
1
#BinanceReopensWithdrawalsForMoreAssets
574,917 views
2,629 Discussing
2
#BTCRebounds80K
100,374 views
1,011 Discussing
3
#Binance98PercentReplenished
54,721 views
738 Discussing
4
#USMidterms-WhatAreMarketsExpecting?
395,697 views
2,242 Discussing
5
#USOctoberNFP-AreRateCutsStillPossible
421,413 views
2,964 Discussing
6
#TRUMPFalls18.1%In24HoursToRecordLow
695 views
33 Discussing
7
#USClearsSingleStockPerpetualFutures
3,518 views
92 Discussing
8
#StrategySTRCHits$100ForFirstTimeSinceMay
68 views
3 Discussing
9
#TrumpFamilyBackedBitcoinMinerReportsQ3Profit
2,229 views
61 Discussing
10
#SouthKoreaPlansImmediateCryptoSecurityIncidentReportingRules
140 views
6 Discussing