

#indicadorvwap
indicadorvwap
43 views
2 Discussing
Hot
Latest

·
--
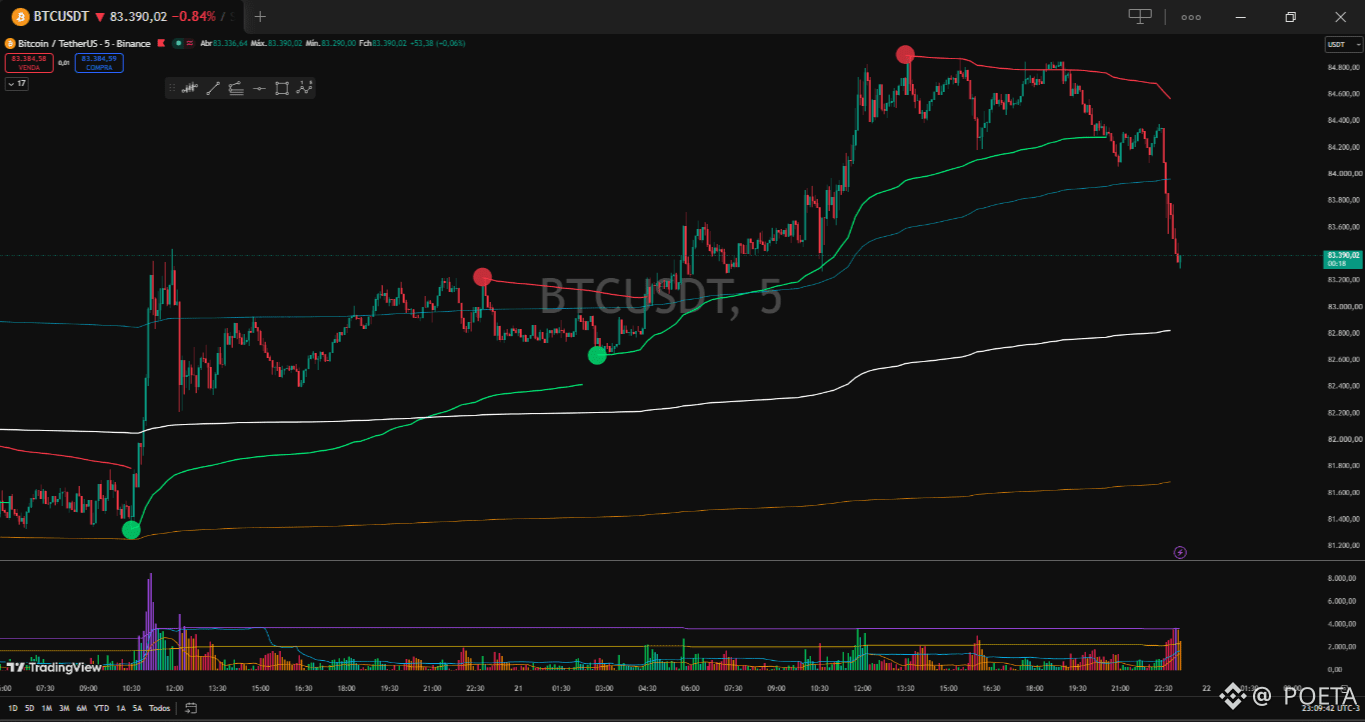
#🟢After the strong buying expansion that led Bitcoin to test the top region near $84,800, the market began a significant profit-taking move. At the peak of this move, our indicator lit up the red circle and changed the color of the fast trend line, clearly signaling the exhaustion of buying strength and the entry of high-volume selling flow.📊
💱After losing support from the shorter VWAPs, the price made a mean-reversion move, returning to test the support bands of the central VWAP, represented by the white line. This white line serves as the main dividing line and value axis for the medium-term trend.
↕️At this point, as the price approaches this central VWAP, the indicator enters a strategic monitoring phase: if buyers defend this area around the white line, the algorithm may validate a continuation pullback to resume the uptrend; otherwise, a break below this band will open the way to test deeper liquidity zones near the orange line anchored at the base.
#btc
#vwaps
#indicadorvwap
#vwapdinamica
#scalping
1
147
Log in to explore more content
Join global crypto users on Binance Square
⚡️ Get latest and useful information about crypto.
💬 Trusted by the world’s largest crypto exchange.
👍 Discover real insights from verified creators.
Email / Phone number
Trending Topics
1
#BinancePick
2.9M views
151,205 Discussing
2
#EarningsSeason
5.2M views
25,724 Discussing
3
#AnthropicTTMRevenueGrewAbout1200%
15,167 views
305 Discussing
4
#AnthropicS1ExpectedToday
17,702 views
278 Discussing
5
#SouthKoreaReportedlyWeighsFourthCryptoTaxDelay
24,144 views
406 Discussing
6
#FranklinTempletonFilesForTwoDividendToBitcoinETFs
31,263 views
503 Discussing
7
#StrategyMSTRSurpassesNasdaqInMarketCap
24,226 views
362 Discussing
8
#CanadaProposesStablecoinRedemptionWithin3BusinessDays
1,118 views
34 Discussing
9
#ElectrumWalletBugLetRogueServersStealFunds
26,291 views
442 Discussing
10
#ArgentineCourtDismissesLIBRACaseAgainstMilei
40,053 views
547 Discussing