

Joshua Brown 007
3k Posts

Joshua Brown 007
Report
Block User
I am a forward-thinking crypto advisor with a strong grasp of blockchain innovation and digital asset management. @JavedJatt331726
Open Trade
High-Frequency Trader
2.5 Years
1.2K+ Following
15.7K+ Followers
6.5K+ Liked
Posts
Portfolio
All
Quotes
Videos
Live
I’m watching one number before making my next BTC move:
🇺🇸 US Jobless Claims
The market was looking around 201K, after last week’s surprisingly low 196K.
But here’s what matters to me:
🔹 Below 198K → Strong labor market
→ Less pressure for easier Fed policy
→ Could support USD/yields
→ Risk assets may face pressure
🔹 Around 202K → Close to expectations
→ Likely limited immediate reaction
→ BTC may return to technical levels
🔹 Above 210K → Clearer labor-market cooling
→ More attention on future Fed policy
→ Could support rate-sensitive assets, including crypto
The bigger picture is interesting.
Reuters reported that the recent 196K reading may have been distorted by Labor Day seasonal volatility, while the underlying labor market remained relatively steady.
And another important warning: jobless claims mainly measure layoffs, not hiring. So a low number alone doesn't prove the entire labor market is getting stronger.
For BTC, I’m not trading the headline alone.
I’ll watch:
Claims → DXY → Treasury yields → Fed expectations → BTC liquidity
That chain reaction matters more than one economic number.
No blind long.
No blind short.
Let the data hit first, then watch how price reacts.
#USGovernment
{future}(BTCUSDT)
{future}(BNBUSDT)
{future}(XRPUSDT)
I’m watching one number before making my next BTC move:
🇺🇸 US Jobless Claims
The market was looking around 201K, after last week’s surprisingly low 196K.
But here’s what matters to me:
🔹 Below 198K → Strong labor market
→ Less pressure for easier Fed policy
→ Could support USD/yields
→ Risk assets may face pressure
🔹 Around 202K → Close to expectations
→ Likely limited immediate reaction
→ BTC may return to technical levels
🔹 Above 210K → Clearer labor-market cooling
→ More attention on future Fed policy
→ Could support rate-sensitive assets, including crypto
The bigger picture is interesting.
Reuters reported that the recent 196K reading may have been distorted by Labor Day seasonal volatility, while the underlying labor market remained relatively steady.
And another important warning: jobless claims mainly measure layoffs, not hiring. So a low number alone doesn't prove the entire labor market is getting stronger.
For BTC, I’m not trading the headline alone.
I’ll watch:
Claims → DXY → Treasury yields → Fed expectations → BTC liquidity
That chain reaction matters more than one economic number.
No blind long.
No blind short.
Let the data hit first, then watch how price reacts.
#USGovernment
🇺🇸 US Jobless Claims
The market was looking around 201K, after last week’s surprisingly low 196K.
But here’s what matters to me:
🔹 Below 198K → Strong labor market
→ Less pressure for easier Fed policy
→ Could support USD/yields
→ Risk assets may face pressure
🔹 Around 202K → Close to expectations
→ Likely limited immediate reaction
→ BTC may return to technical levels
🔹 Above 210K → Clearer labor-market cooling
→ More attention on future Fed policy
→ Could support rate-sensitive assets, including crypto
The bigger picture is interesting.
Reuters reported that the recent 196K reading may have been distorted by Labor Day seasonal volatility, while the underlying labor market remained relatively steady.
And another important warning: jobless claims mainly measure layoffs, not hiring. So a low number alone doesn't prove the entire labor market is getting stronger.
For BTC, I’m not trading the headline alone.
I’ll watch:
Claims → DXY → Treasury yields → Fed expectations → BTC liquidity
That chain reaction matters more than one economic number.
No blind long.
No blind short.
Let the data hit first, then watch how price reacts.
#USGovernment
113
30D trade $LSK 10.7K USDT
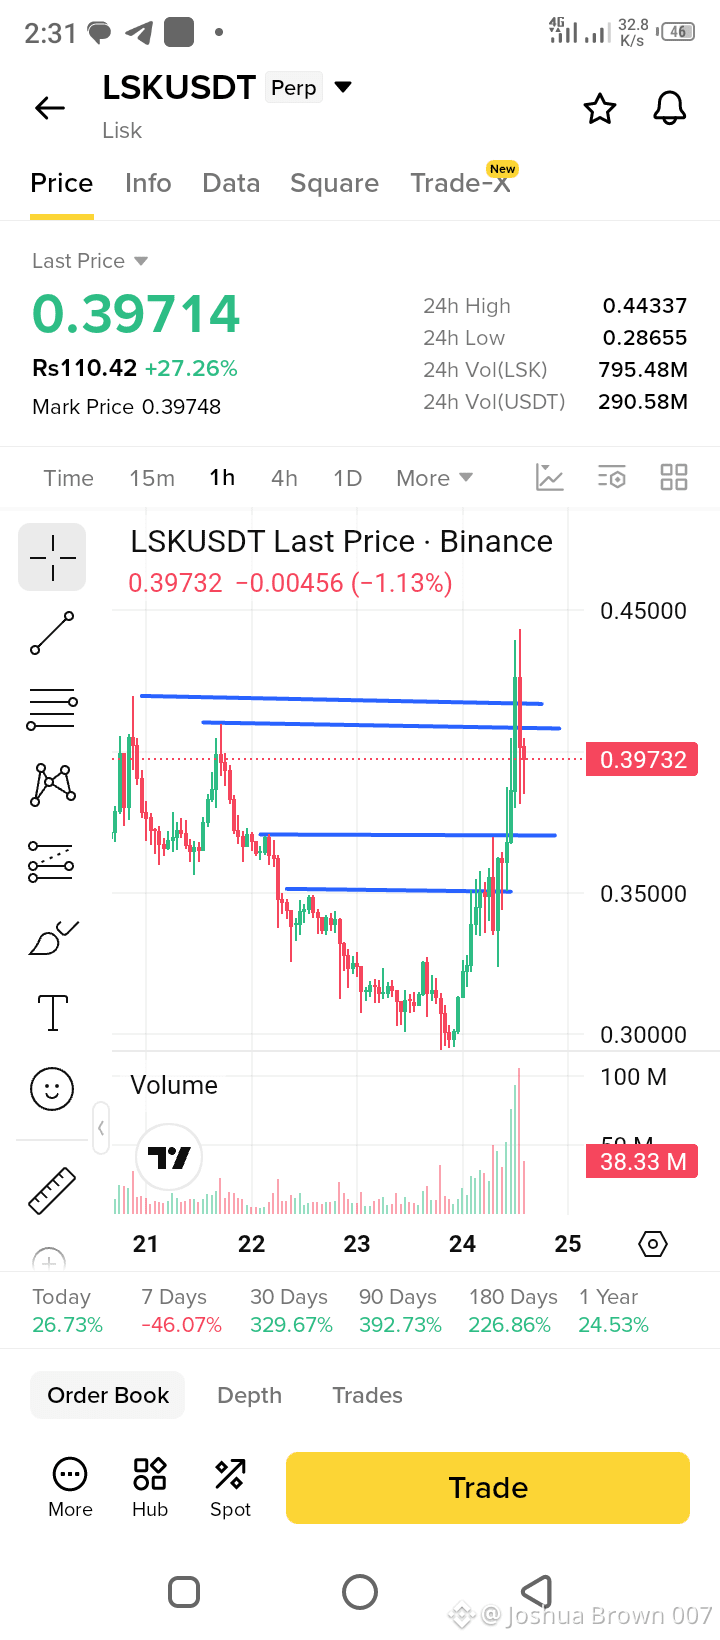
#Trade Short scalp $LSK
Entry 0.3930 - 0.4000
SL 0.4150
TP 0.3700 FVG 1H
TP 0.3500 major demand Zone
Invalidation Conditions:
1H candle close above 0.4200 completely invalidates the bearish micro thesis.
$LSK
{future}(LSKUSDT)
#Trade Short scalp $LSK
Entry 0.3930 - 0.4000
SL 0.4150
TP 0.3700 FVG 1H
TP 0.3500 major demand Zone
Invalidation Conditions:
1H candle close above 0.4200 completely invalidates the bearish micro thesis.
$LSK
Entry 0.3930 - 0.4000
SL 0.4150
TP 0.3700 FVG 1H
TP 0.3500 major demand Zone
Invalidation Conditions:
1H candle close above 0.4200 completely invalidates the bearish micro thesis.
$LSK
192
·
--
Bullish
30D trade $FLOCK 7K USDT
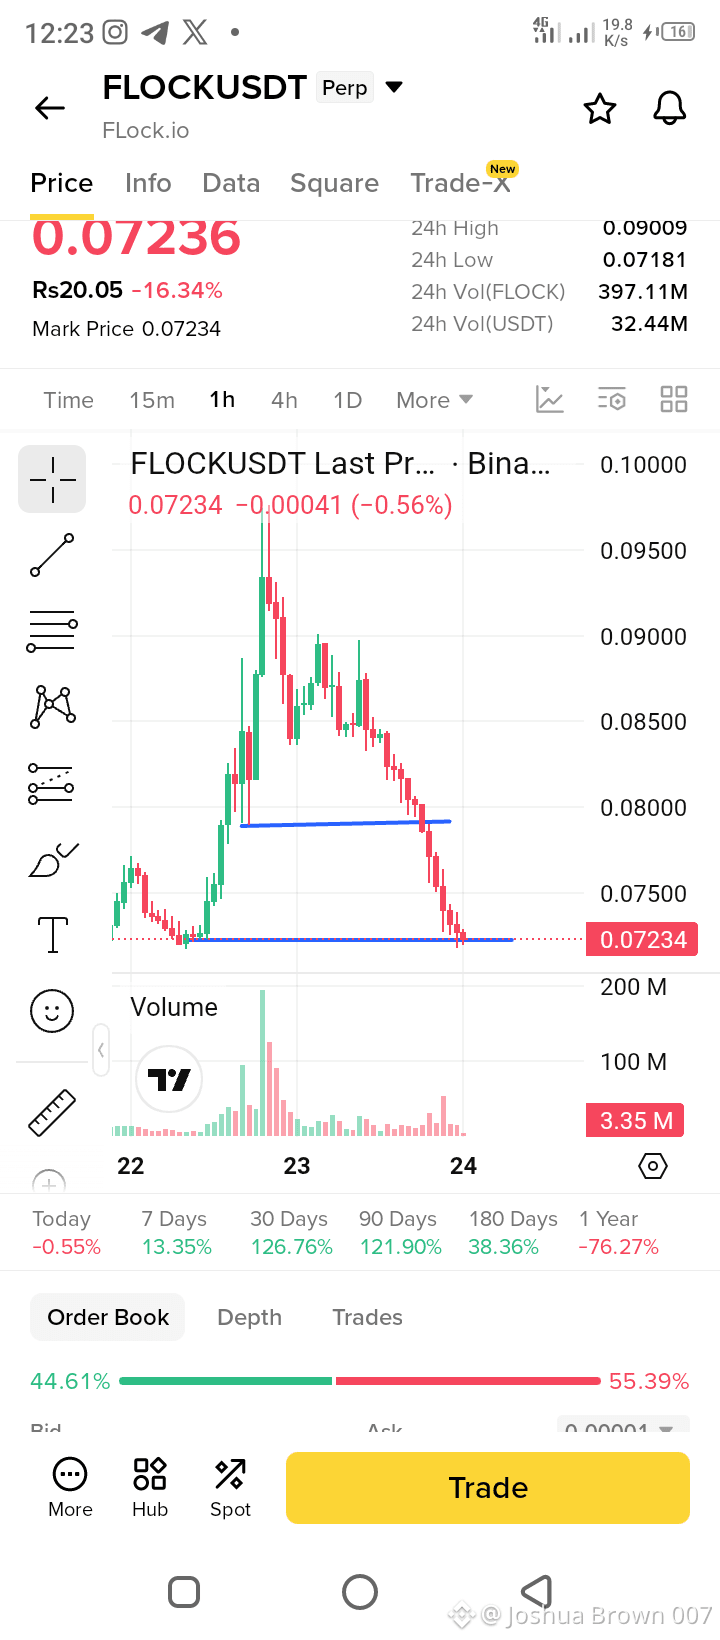
#Trade $FLOCK LONG Setup
Limit Entry 0.0715 - 0.0725
SL 0.0690
TP 0.07482
TP 0.08050
Invalidation Conditions:
1H candle close below 0.0690 invalidates the immediate bounce thesis.
sudden spike in selling volume that breaks the 0.0650 support.
If the price breaks below 0.0690 with high volume, enter short on the retest of 0.0710, targeting 0.0650. SL at 0.0730.
$TAKE $CAP
{future}(FLOCKUSDT)
{future}(TAKEUSDT)
{future}(CAPUSDT)
#Trade $FLOCK LONG Setup
Limit Entry 0.0715 - 0.0725
SL 0.0690
TP 0.07482
TP 0.08050
Invalidation Conditions:
1H candle close below 0.0690 invalidates the immediate bounce thesis.
sudden spike in selling volume that breaks the 0.0650 support.
If the price breaks below 0.0690 with high volume, enter short on the retest of 0.0710, targeting 0.0650. SL at 0.0730.
$TAKE $CAP
Limit Entry 0.0715 - 0.0725
SL 0.0690
TP 0.07482
TP 0.08050
Invalidation Conditions:
1H candle close below 0.0690 invalidates the immediate bounce thesis.
sudden spike in selling volume that breaks the 0.0650 support.
If the price breaks below 0.0690 with high volume, enter short on the retest of 0.0710, targeting 0.0650. SL at 0.0730.
$TAKE $CAP
546
Article
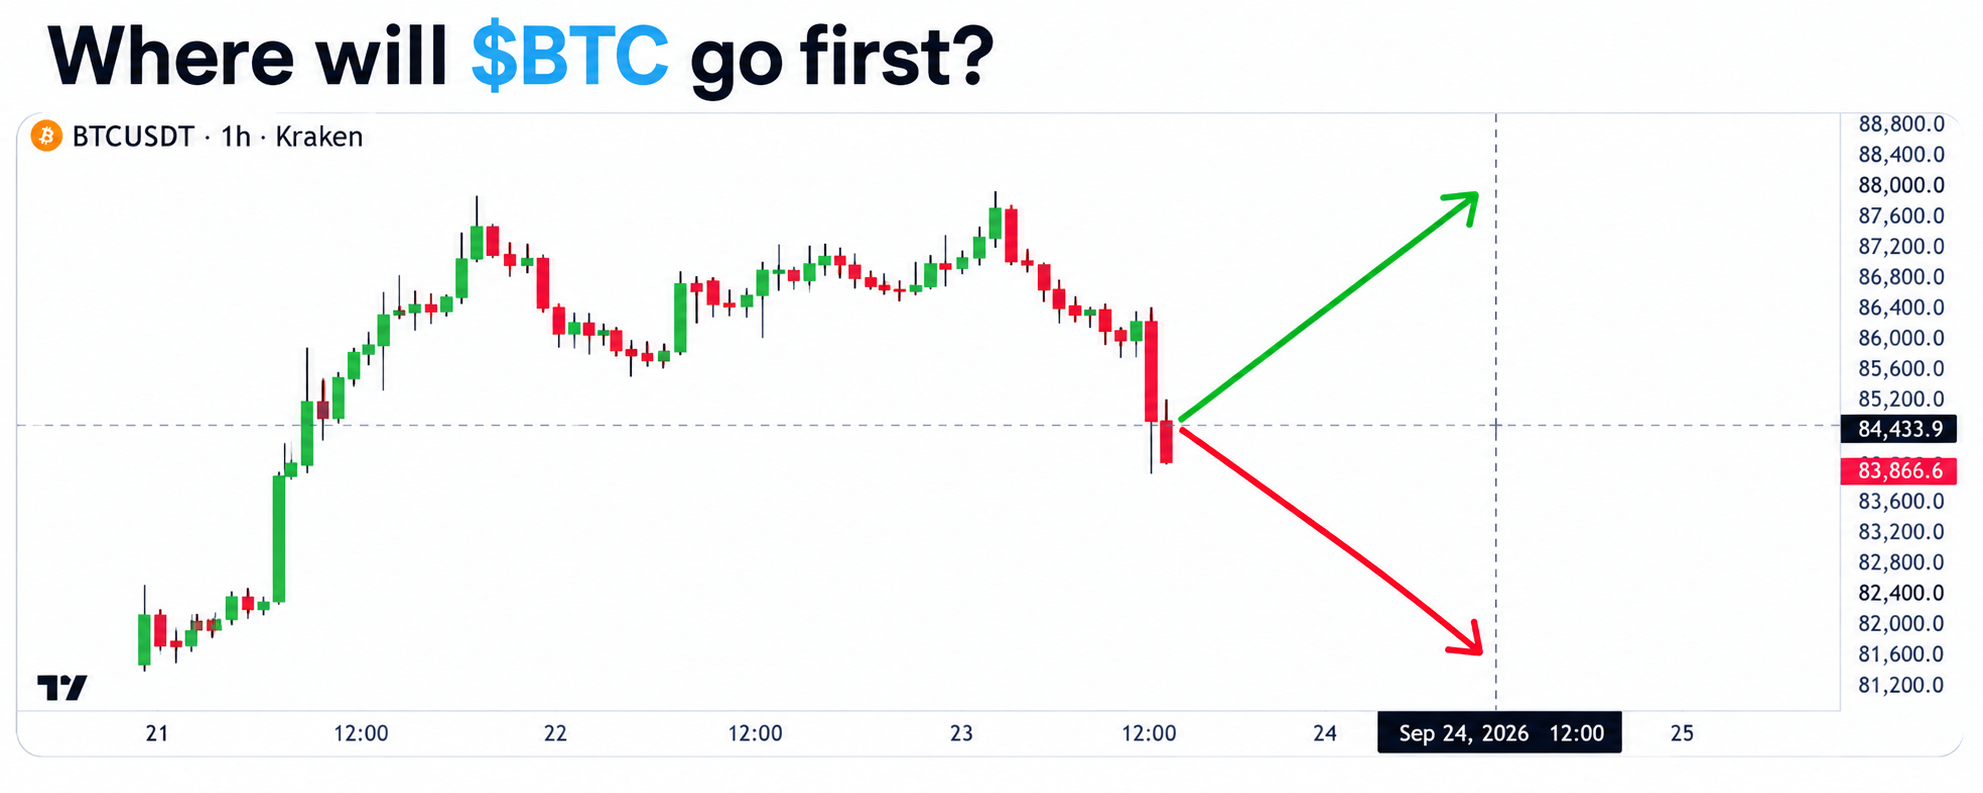
Where will $BTC go first up or down?I keep looking at this chart and one question stands out:
Will Bitcoin take the liquidity above first, or sweep the downside before the next move?
The chart shows the key decision area around $84.4K, with roughly $87.6K on the upside and $81.6K on the downside.
But there is an important update: BTC has already pushed into the $87K area today, so this chart should be treated as a snapshot of the earlier setup, not the current live structure. CryptoQuant's latest dashboard had BTC around $87.36K and its Bull/Bear Indicator had turned positive at +0.27.
CryptoQuant Alpha Library
What the data is telling me 👇
Technical structure
The original chart's $84K–$85K zone remains important. Glassnode currently identifies a large long-term-holder supply cluster around $84K–$85K. Above that, its next major on-chain resistance is around $96.7K, the mean MVRV price.
So my levels to watch:
Resistance: $88K → $92K → $95K → $96.7K
Support: $85K → $84K → $82K → $81.6K
A sustained move above $88K would put the market closer to the $92K–$96.7K resistance zone.
A rejection followed by a loss of $84K would reopen the downside liquidity area.
On chain demand
There is a mixed but improving picture.
Glassnode says spot buying has returned, spot volume has more than doubled from its August low, ETF buying is picking up, and profit-taking remains relatively light compared with previous cycle tops.
But exchange data needs watching: another recent report showed Bitcoin exchange reserves had risen by about 14,800 BTC from the September 5 low, meaning some supply has moved back toward exchanges.
That's why I don't want to call every green candle a guaranteed breakout.
What is Polymarket saying?
This is interesting.
Polymarket currently prices the September market with $82.5K downside at about 68%, while the $88K level for the Sept. 21–27 window is around 23%. The hourly BTC market was showing 81% Up, while the daily market was around 57% Up when I checked.
But remember: these are market-implied probabilities, not guaranteed predictions. Polymarket itself says the odds represent trader consensus at a point in time.
What are major analysts saying?
There isn't one universal forecast.
Glassnode: BTC has moved above important cost bases, with $84K–$85K as a major supply area and $96.7K as the next major on-chain resistance.
CryptoQuant: previously identified $81.7K, $83.6K and $88.7K as important resistance levels; its latest dashboard now shows a positive bull/bear reading.
The Block +1
Grayscale's Zach Pandl: said the roughly $58K June low remained his view of the cycle bottom.
Coinbase CEO Brian Armstrong: also said he believed BTC had likely bottomed and expected an upward trend over the next 1–2 years.
Bernstein: has a much longer-term scenario of $150K by mid 2027, with a projected next cycle peak around $300K in 2029. That's a long term forecast, not a short term target.
Standard Chartered's Geoffrey Kendrick: has maintained a $100K end-2026 view despite earlier volatility.
My trading map
Bullish path:
$87K → $88K → $92K → $95K → $96.7K
Bearish path:
$87K rejection → $85K → $84K → $82K → $81.6K
The important part for me isn't guessing the exact next candle.
I want to see which liquidity zone BTC takes first and whether price can hold after the sweep.
If BTC breaks resistance with spot demand + volume + positive on chain flows, the upside structure becomes stronger.
If it loses $84K with increasing exchange inflows and selling pressure, I would start watching the lower liquidity levels instead.
No blind long. No blind short.
Let BTC show the direction first.
#Bitcoin #BTC #BitcoinAnalysis #Polymarket #Trading
{spot}(BTCUSDT)
Where will $BTC go first up or down?
I keep looking at this chart and one question stands out:
Will Bitcoin take the liquidity above first, or sweep the downside before the next move?
The chart shows the key decision area around $84.4K, with roughly $87.6K on the upside and $81.6K on the downside.
But there is an important update: BTC has already pushed into the $87K area today, so this chart should be treated as a snapshot of the earlier setup, not the current live structure. CryptoQuant's latest dashboard had BTC around $87.36K and its Bull/Bear Indicator had turned positive at +0.27.
CryptoQuant Alpha Library
What the data is telling me 👇
Technical structure
The original chart's $84K–$85K zone remains important. Glassnode currently identifies a large long-term-holder supply cluster around $84K–$85K. Above that, its next major on-chain resistance is around $96.7K, the mean MVRV price.
So my levels to watch:
Resistance: $88K → $92K → $95K → $96.7K
Support: $85K → $84K → $82K → $81.6K
A sustained move above $88K would put the market closer to the $92K–$96.7K resistance zone.
A rejection followed by a loss of $84K would reopen the downside liquidity area.
On chain demand
There is a mixed but improving picture.
Glassnode says spot buying has returned, spot volume has more than doubled from its August low, ETF buying is picking up, and profit-taking remains relatively light compared with previous cycle tops.
But exchange data needs watching: another recent report showed Bitcoin exchange reserves had risen by about 14,800 BTC from the September 5 low, meaning some supply has moved back toward exchanges.
That's why I don't want to call every green candle a guaranteed breakout.
What is Polymarket saying?
This is interesting.
Polymarket currently prices the September market with $82.5K downside at about 68%, while the $88K level for the Sept. 21–27 window is around 23%. The hourly BTC market was showing 81% Up, while the daily market was around 57% Up when I checked.
But remember: these are market-implied probabilities, not guaranteed predictions. Polymarket itself says the odds represent trader consensus at a point in time.
What are major analysts saying?
There isn't one universal forecast.
Glassnode: BTC has moved above important cost bases, with $84K–$85K as a major supply area and $96.7K as the next major on-chain resistance.
CryptoQuant: previously identified $81.7K, $83.6K and $88.7K as important resistance levels; its latest dashboard now shows a positive bull/bear reading.
The Block +1
Grayscale's Zach Pandl: said the roughly $58K June low remained his view of the cycle bottom.
Coinbase CEO Brian Armstrong: also said he believed BTC had likely bottomed and expected an upward trend over the next 1–2 years.
Bernstein: has a much longer-term scenario of $150K by mid 2027, with a projected next cycle peak around $300K in 2029. That's a long term forecast, not a short term target.
Standard Chartered's Geoffrey Kendrick: has maintained a $100K end-2026 view despite earlier volatility.
My trading map
Bullish path:
$87K → $88K → $92K → $95K → $96.7K
Bearish path:
$87K rejection → $85K → $84K → $82K → $81.6K
The important part for me isn't guessing the exact next candle.
I want to see which liquidity zone BTC takes first and whether price can hold after the sweep.
If BTC breaks resistance with spot demand + volume + positive on chain flows, the upside structure becomes stronger.
If it loses $84K with increasing exchange inflows and selling pressure, I would start watching the lower liquidity levels instead.
No blind long. No blind short.
Let BTC show the direction first.
#Bitcoin #BTC #BitcoinAnalysis #Polymarket #Trading
Will Bitcoin take the liquidity above first, or sweep the downside before the next move?
The chart shows the key decision area around $84.4K, with roughly $87.6K on the upside and $81.6K on the downside.
But there is an important update: BTC has already pushed into the $87K area today, so this chart should be treated as a snapshot of the earlier setup, not the current live structure. CryptoQuant's latest dashboard had BTC around $87.36K and its Bull/Bear Indicator had turned positive at +0.27.
CryptoQuant Alpha Library
What the data is telling me 👇
Technical structure
The original chart's $84K–$85K zone remains important. Glassnode currently identifies a large long-term-holder supply cluster around $84K–$85K. Above that, its next major on-chain resistance is around $96.7K, the mean MVRV price.
So my levels to watch:
Resistance: $88K → $92K → $95K → $96.7K
Support: $85K → $84K → $82K → $81.6K
A sustained move above $88K would put the market closer to the $92K–$96.7K resistance zone.
A rejection followed by a loss of $84K would reopen the downside liquidity area.
On chain demand
There is a mixed but improving picture.
Glassnode says spot buying has returned, spot volume has more than doubled from its August low, ETF buying is picking up, and profit-taking remains relatively light compared with previous cycle tops.
But exchange data needs watching: another recent report showed Bitcoin exchange reserves had risen by about 14,800 BTC from the September 5 low, meaning some supply has moved back toward exchanges.
That's why I don't want to call every green candle a guaranteed breakout.
What is Polymarket saying?
This is interesting.
Polymarket currently prices the September market with $82.5K downside at about 68%, while the $88K level for the Sept. 21–27 window is around 23%. The hourly BTC market was showing 81% Up, while the daily market was around 57% Up when I checked.
But remember: these are market-implied probabilities, not guaranteed predictions. Polymarket itself says the odds represent trader consensus at a point in time.
What are major analysts saying?
There isn't one universal forecast.
Glassnode: BTC has moved above important cost bases, with $84K–$85K as a major supply area and $96.7K as the next major on-chain resistance.
CryptoQuant: previously identified $81.7K, $83.6K and $88.7K as important resistance levels; its latest dashboard now shows a positive bull/bear reading.
The Block +1
Grayscale's Zach Pandl: said the roughly $58K June low remained his view of the cycle bottom.
Coinbase CEO Brian Armstrong: also said he believed BTC had likely bottomed and expected an upward trend over the next 1–2 years.
Bernstein: has a much longer-term scenario of $150K by mid 2027, with a projected next cycle peak around $300K in 2029. That's a long term forecast, not a short term target.
Standard Chartered's Geoffrey Kendrick: has maintained a $100K end-2026 view despite earlier volatility.
My trading map
Bullish path:
$87K → $88K → $92K → $95K → $96.7K
Bearish path:
$87K rejection → $85K → $84K → $82K → $81.6K
The important part for me isn't guessing the exact next candle.
I want to see which liquidity zone BTC takes first and whether price can hold after the sweep.
If BTC breaks resistance with spot demand + volume + positive on chain flows, the upside structure becomes stronger.
If it loses $84K with increasing exchange inflows and selling pressure, I would start watching the lower liquidity levels instead.
No blind long. No blind short.
Let BTC show the direction first.
#Bitcoin #BTC #BitcoinAnalysis #Polymarket #Trading
1
6
8.6k
#zec
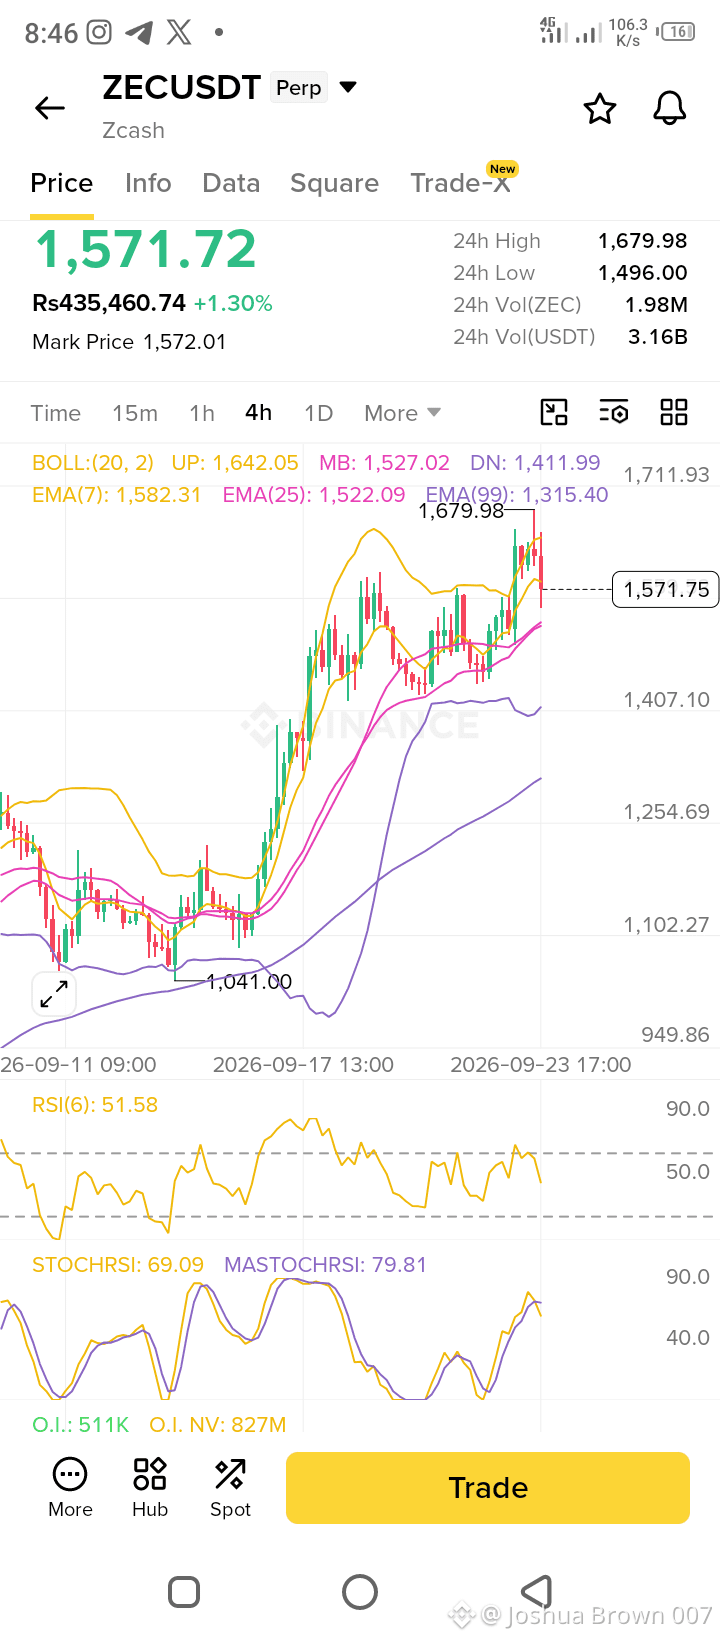
WAIT FOR PULLBACK AND Go LONG.
$ZEC USDT is in a powerful uptrend but is currently experiencing a necessary short-term correction. The indicators have cooled off significantly, and the price is testing the EMA(25). Do not FOMO into the current price (1,571).
Entry Long 1,520 - 1,540
SL 1,480
TP 1,645
TP 1,780
Expected Time frame 08 hrs - 1 Days
Invalidation Conditions:
If 4H candle close below 1,315 (EMA 99) completely invalidates the bullish macro thesis.
{future}(ZECUSDT)
$TAO
{future}(TAOUSDT)
$ZEN
{future}(ZENUSDT)
#zec
WAIT FOR PULLBACK AND Go LONG.
$ZEC USDT is in a powerful uptrend but is currently experiencing a necessary short-term correction. The indicators have cooled off significantly, and the price is testing the EMA(25). Do not FOMO into the current price (1,571).
Entry Long 1,520 - 1,540
SL 1,480
TP 1,645
TP 1,780
Expected Time frame 08 hrs - 1 Days
Invalidation Conditions:
If 4H candle close below 1,315 (EMA 99) completely invalidates the bullish macro thesis.
$TAO
$ZEN
WAIT FOR PULLBACK AND Go LONG.
$ZEC USDT is in a powerful uptrend but is currently experiencing a necessary short-term correction. The indicators have cooled off significantly, and the price is testing the EMA(25). Do not FOMO into the current price (1,571).
Entry Long 1,520 - 1,540
SL 1,480
TP 1,645
TP 1,780
Expected Time frame 08 hrs - 1 Days
Invalidation Conditions:
If 4H candle close below 1,315 (EMA 99) completely invalidates the bullish macro thesis.
$TAO
$ZEN
423
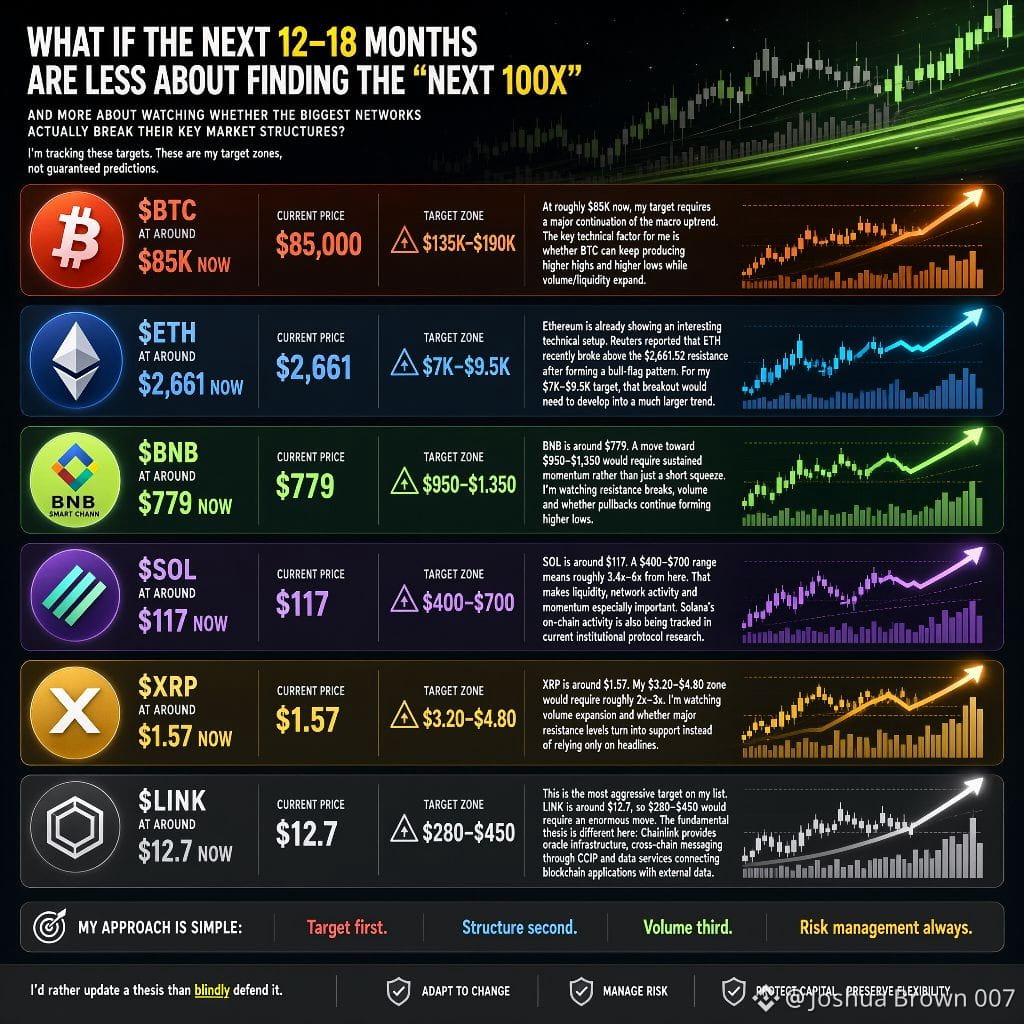
What if the next 12–18 months are less about finding the “next 100x” and more about watching whether the biggest networks actually break their key market structures?
I’m tracking these targets:
$BTC → $135K–$190K
$ETH → $7K–$9.5K
$BNB → $950–$1,350
$SOL → $400–$700
$XRP → $3.20–$4.80
$LINK → $280–$450
These are my target zones, not guaranteed predictions.
🔹 $BTC
At roughly $85K now, my target requires a major continuation of the macro uptrend. The key technical factor for me is whether BTC can keep producing higher highs and higher lows while volume/liquidity expand.
🔹 $ETH
Ethereum is already showing an interesting technical setup. Reuters reported that ETH recently broke above the $2,661.52 resistance after forming a bull-flag pattern.
For my $7K–$9.5K target, that breakout would need to develop into a much larger trend.
🔹 $BNB
BNB is around $779. A move toward $950–$1,350 would require sustained momentum rather than just a short squeeze. I’m watching resistance breaks, volume and whether pullbacks continue forming higher lows.
🔹 $SOL
SOL is around $117. A $400–$700 range means roughly 3.4x–6x from here.
That makes liquidity, network activity and momentum especially important. Solana's on-chain activity is also being tracked in current institutional protocol research.
🔹 $XRP
XRP is around $1.57. My $3.20–$4.80 zone would require roughly 2x–3x. I’m watching volume expansion and whether major resistance levels turn into support instead of relying only on headlines.
My approach is simple:
Target first.
Structure second.
Volume third.
Risk management always.
If the market structure changes, my targets can change too.
I’d rather update a thesis than blindly defend it.
{spot}(BTCUSDT)
{spot}(ETHUSDT)
{spot}(BNBUSDT)
What if the next 12–18 months are less about finding the “next 100x” and more about watching whether the biggest networks actually break their key market structures?
I’m tracking these targets:
$BTC → $135K–$190K
$ETH → $7K–$9.5K
$BNB → $950–$1,350
$SOL → $400–$700
$XRP → $3.20–$4.80
$LINK → $280–$450
These are my target zones, not guaranteed predictions.
🔹 $BTC
At roughly $85K now, my target requires a major continuation of the macro uptrend. The key technical factor for me is whether BTC can keep producing higher highs and higher lows while volume/liquidity expand.
🔹 $ETH
Ethereum is already showing an interesting technical setup. Reuters reported that ETH recently broke above the $2,661.52 resistance after forming a bull-flag pattern.
For my $7K–$9.5K target, that breakout would need to develop into a much larger trend.
🔹 $BNB
BNB is around $779. A move toward $950–$1,350 would require sustained momentum rather than just a short squeeze. I’m watching resistance breaks, volume and whether pullbacks continue forming higher lows.
🔹 $SOL
SOL is around $117. A $400–$700 range means roughly 3.4x–6x from here.
That makes liquidity, network activity and momentum especially important. Solana's on-chain activity is also being tracked in current institutional protocol research.
🔹 $XRP
XRP is around $1.57. My $3.20–$4.80 zone would require roughly 2x–3x. I’m watching volume expansion and whether major resistance levels turn into support instead of relying only on headlines.
My approach is simple:
Target first.
Structure second.
Volume third.
Risk management always.
If the market structure changes, my targets can change too.
I’d rather update a thesis than blindly defend it.
I’m tracking these targets:
$BTC → $135K–$190K
$ETH → $7K–$9.5K
$BNB → $950–$1,350
$SOL → $400–$700
$XRP → $3.20–$4.80
$LINK → $280–$450
These are my target zones, not guaranteed predictions.
🔹 $BTC
At roughly $85K now, my target requires a major continuation of the macro uptrend. The key technical factor for me is whether BTC can keep producing higher highs and higher lows while volume/liquidity expand.
🔹 $ETH
Ethereum is already showing an interesting technical setup. Reuters reported that ETH recently broke above the $2,661.52 resistance after forming a bull-flag pattern.
For my $7K–$9.5K target, that breakout would need to develop into a much larger trend.
🔹 $BNB
BNB is around $779. A move toward $950–$1,350 would require sustained momentum rather than just a short squeeze. I’m watching resistance breaks, volume and whether pullbacks continue forming higher lows.
🔹 $SOL
SOL is around $117. A $400–$700 range means roughly 3.4x–6x from here.
That makes liquidity, network activity and momentum especially important. Solana's on-chain activity is also being tracked in current institutional protocol research.
🔹 $XRP
XRP is around $1.57. My $3.20–$4.80 zone would require roughly 2x–3x. I’m watching volume expansion and whether major resistance levels turn into support instead of relying only on headlines.
My approach is simple:
Target first.
Structure second.
Volume third.
Risk management always.
If the market structure changes, my targets can change too.
I’d rather update a thesis than blindly defend it.
200
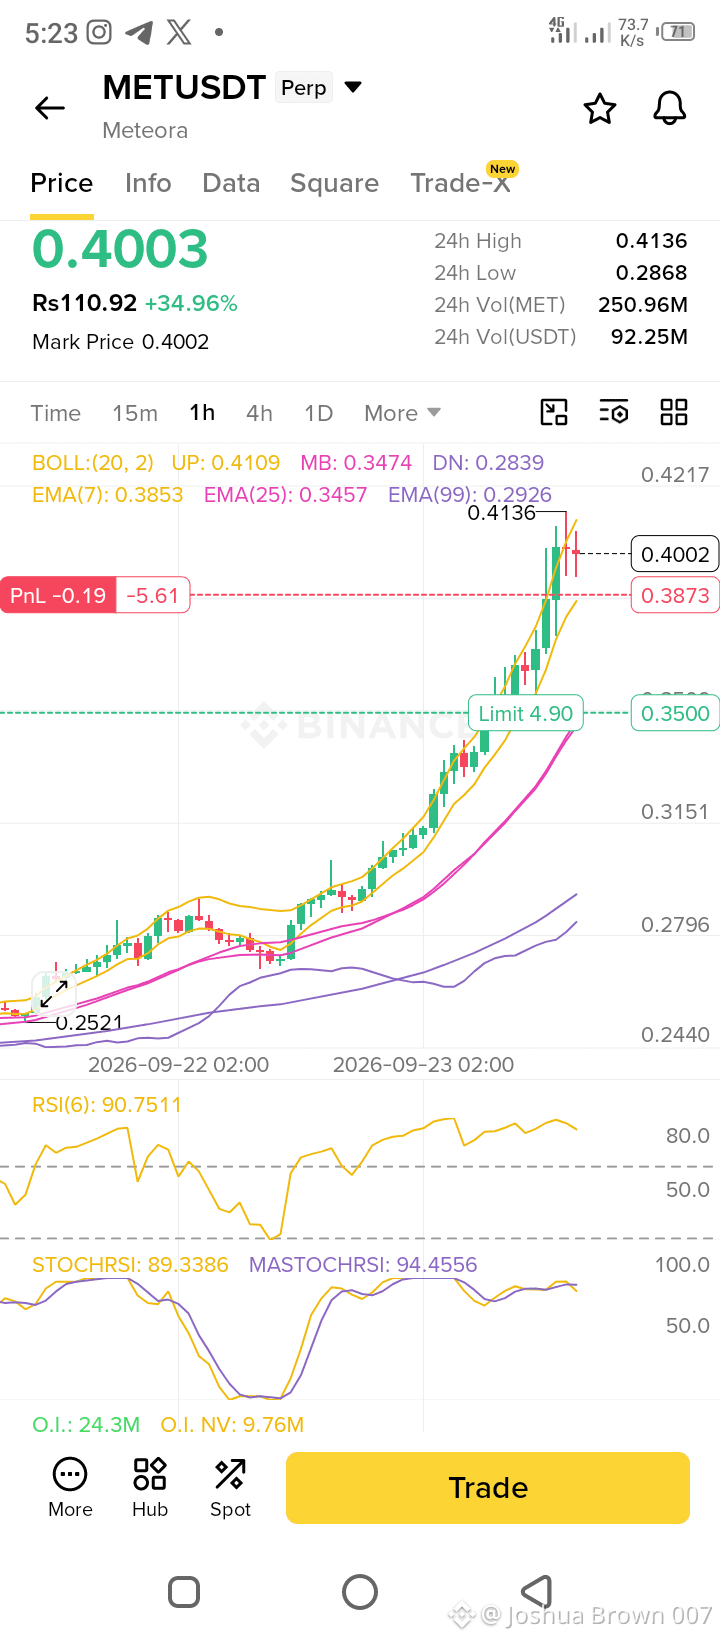
$MET Short Sell
Entry0.4000 - 0.4050
SL 0.4150
TP 0.3860 and 0.3490
caution:
If the price reclaims 0.4136 with high volume and breaks 0.4217, enter long targeting 0.450. SL at 0.400.
{future}(METUSDT)
$MET Short Sell
Entry0.4000 - 0.4050
SL 0.4150
TP 0.3860 and 0.3490
caution:
If the price reclaims 0.4136 with high volume and breaks 0.4217, enter long targeting 0.450. SL at 0.400.
Entry0.4000 - 0.4050
SL 0.4150
TP 0.3860 and 0.3490
caution:
If the price reclaims 0.4136 with high volume and breaks 0.4217, enter long targeting 0.450. SL at 0.400.
154
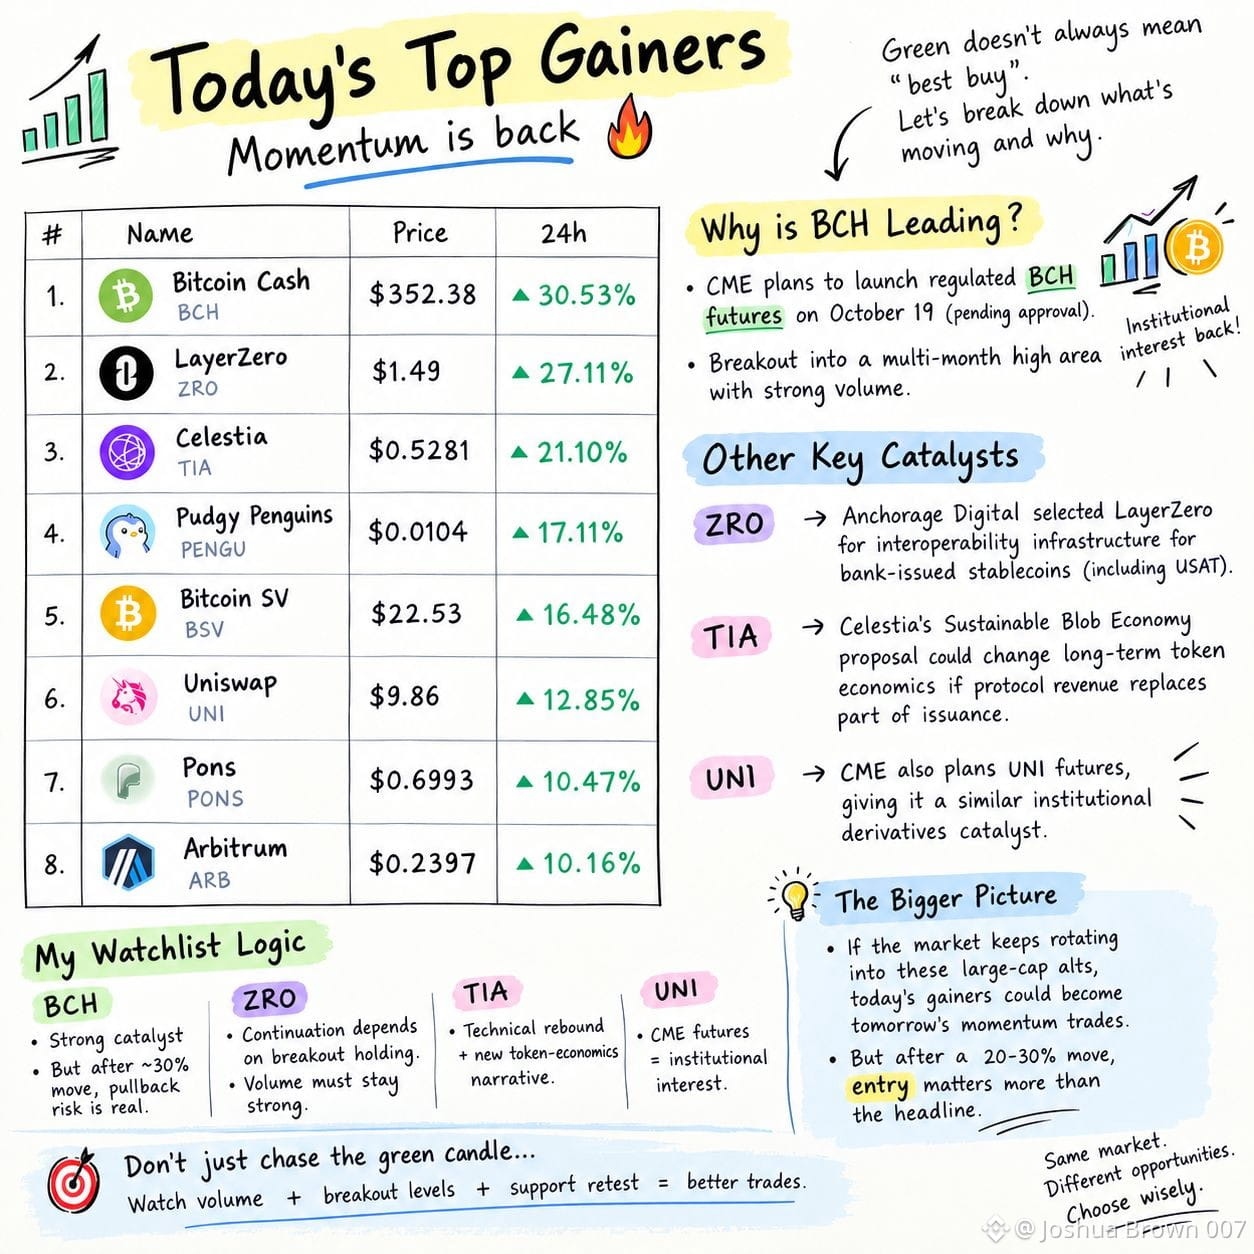
Today’s Top Gainers Momentum Is Back 🔥
Today’s leaderboard is interesting because this is not just a small cap pump.
$BCH +30.53%
$ZRO +27.11%
$TIA +21.10%
$PENGU +17.11%
$BSV +16.48%
$UNI +12.85%
$PONS +10.47%
$ARB +10.16%
The biggest story is BCH. The move is linked to CME plans for regulated BCH futures, scheduled for October 19, pending regulatory approval. BCH has also broken into a multi-month high area with heavy volume.
But here is the important part 👇
A coin that already pumped 30% is not automatically the coin with the most upside left.
ZRO has another interesting fundamental catalyst: Anchorage Digital selected LayerZero for interoperability infrastructure for bank-issued stablecoins, including Tether's USAT.
TIA also deserves attention because Celestia's new Sustainable Blob Economy proposal could change the long term token economics if protocol revenue eventually replaces part of issuance.
My watchlist logic
BCH: strongest current catalyst, but after a ~30% daily move, pullback risk matters.
ZRO: continuation depends on whether today's breakout holds and volume remains strong.
TIA: interesting combination of technical rebound + new token economics narrative.
UNI: CME also plans UNI futures, giving it a similar institutional-derivatives catalyst.
So instead of blindly chasing the biggest green candle, I'm watching volume + breakout level + support retest.
If the market keeps rotating into these large cap Alts, today's gainers could become tomorrow's momentum trades but after a 20–30% move, entry matters more than the headline.
{future}(BCHUSDT)
{future}(ZROUSDT)
{future}(TIAUSDT)
Today’s Top Gainers Momentum Is Back 🔥
Today’s leaderboard is interesting because this is not just a small cap pump.
$BCH +30.53%
$ZRO +27.11%
$TIA +21.10%
$PENGU +17.11%
$BSV +16.48%
$UNI +12.85%
$PONS +10.47%
$ARB +10.16%
The biggest story is BCH. The move is linked to CME plans for regulated BCH futures, scheduled for October 19, pending regulatory approval. BCH has also broken into a multi-month high area with heavy volume.
But here is the important part 👇
A coin that already pumped 30% is not automatically the coin with the most upside left.
ZRO has another interesting fundamental catalyst: Anchorage Digital selected LayerZero for interoperability infrastructure for bank-issued stablecoins, including Tether's USAT.
TIA also deserves attention because Celestia's new Sustainable Blob Economy proposal could change the long term token economics if protocol revenue eventually replaces part of issuance.
My watchlist logic
BCH: strongest current catalyst, but after a ~30% daily move, pullback risk matters.
ZRO: continuation depends on whether today's breakout holds and volume remains strong.
TIA: interesting combination of technical rebound + new token economics narrative.
UNI: CME also plans UNI futures, giving it a similar institutional-derivatives catalyst.
So instead of blindly chasing the biggest green candle, I'm watching volume + breakout level + support retest.
If the market keeps rotating into these large cap Alts, today's gainers could become tomorrow's momentum trades but after a 20–30% move, entry matters more than the headline.
Today’s leaderboard is interesting because this is not just a small cap pump.
$BCH +30.53%
$ZRO +27.11%
$TIA +21.10%
$PENGU +17.11%
$BSV +16.48%
$UNI +12.85%
$PONS +10.47%
$ARB +10.16%
The biggest story is BCH. The move is linked to CME plans for regulated BCH futures, scheduled for October 19, pending regulatory approval. BCH has also broken into a multi-month high area with heavy volume.
But here is the important part 👇
A coin that already pumped 30% is not automatically the coin with the most upside left.
ZRO has another interesting fundamental catalyst: Anchorage Digital selected LayerZero for interoperability infrastructure for bank-issued stablecoins, including Tether's USAT.
TIA also deserves attention because Celestia's new Sustainable Blob Economy proposal could change the long term token economics if protocol revenue eventually replaces part of issuance.
My watchlist logic
BCH: strongest current catalyst, but after a ~30% daily move, pullback risk matters.
ZRO: continuation depends on whether today's breakout holds and volume remains strong.
TIA: interesting combination of technical rebound + new token economics narrative.
UNI: CME also plans UNI futures, giving it a similar institutional-derivatives catalyst.
So instead of blindly chasing the biggest green candle, I'm watching volume + breakout level + support retest.
If the market keeps rotating into these large cap Alts, today's gainers could become tomorrow's momentum trades but after a 20–30% move, entry matters more than the headline.
1
305
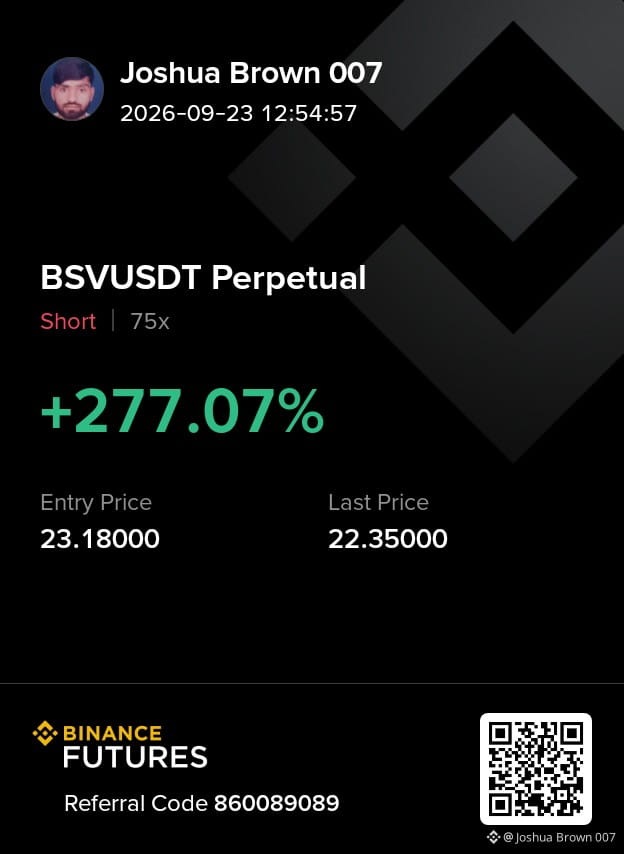
#AIStocksWhatNext
Trade need calculate the market + passion and wait for Result😎
{future}(BSVUSDT)
[https://www.binance.info/en/futures/ref/860089089](https://www.binance.info/en/futures/ref/860089089)
#AIStocksWhatNext
Trade need calculate the market + passion and wait for Result😎
https://www.binance.info/en/futures/ref/860089089
Trade need calculate the market + passion and wait for Result😎
https://www.binance.info/en/futures/ref/860089089
118
Article
SEC Innovation Exemption Could Open the Door to Tokenized Stock Platforms in Q4Something important is changing between traditional Wall Street and blockchain.
On September 17, 2026, the U.S. Securities and Exchange Commission (SEC) introduced its temporary Innovation Exemption, creating a regulatory pathway for certain platforms to trade tokenized U.S. stocks on blockchain-based venues. The development could allow interested tokenized-stock platforms to announce plans as early as Q4 2026.
But before looking at the crypto impact, it is important to understand what the SEC actually does.
What is the SEC?
The Securities and Exchange Commission is the U.S. federal regulator responsible for overseeing the securities markets.
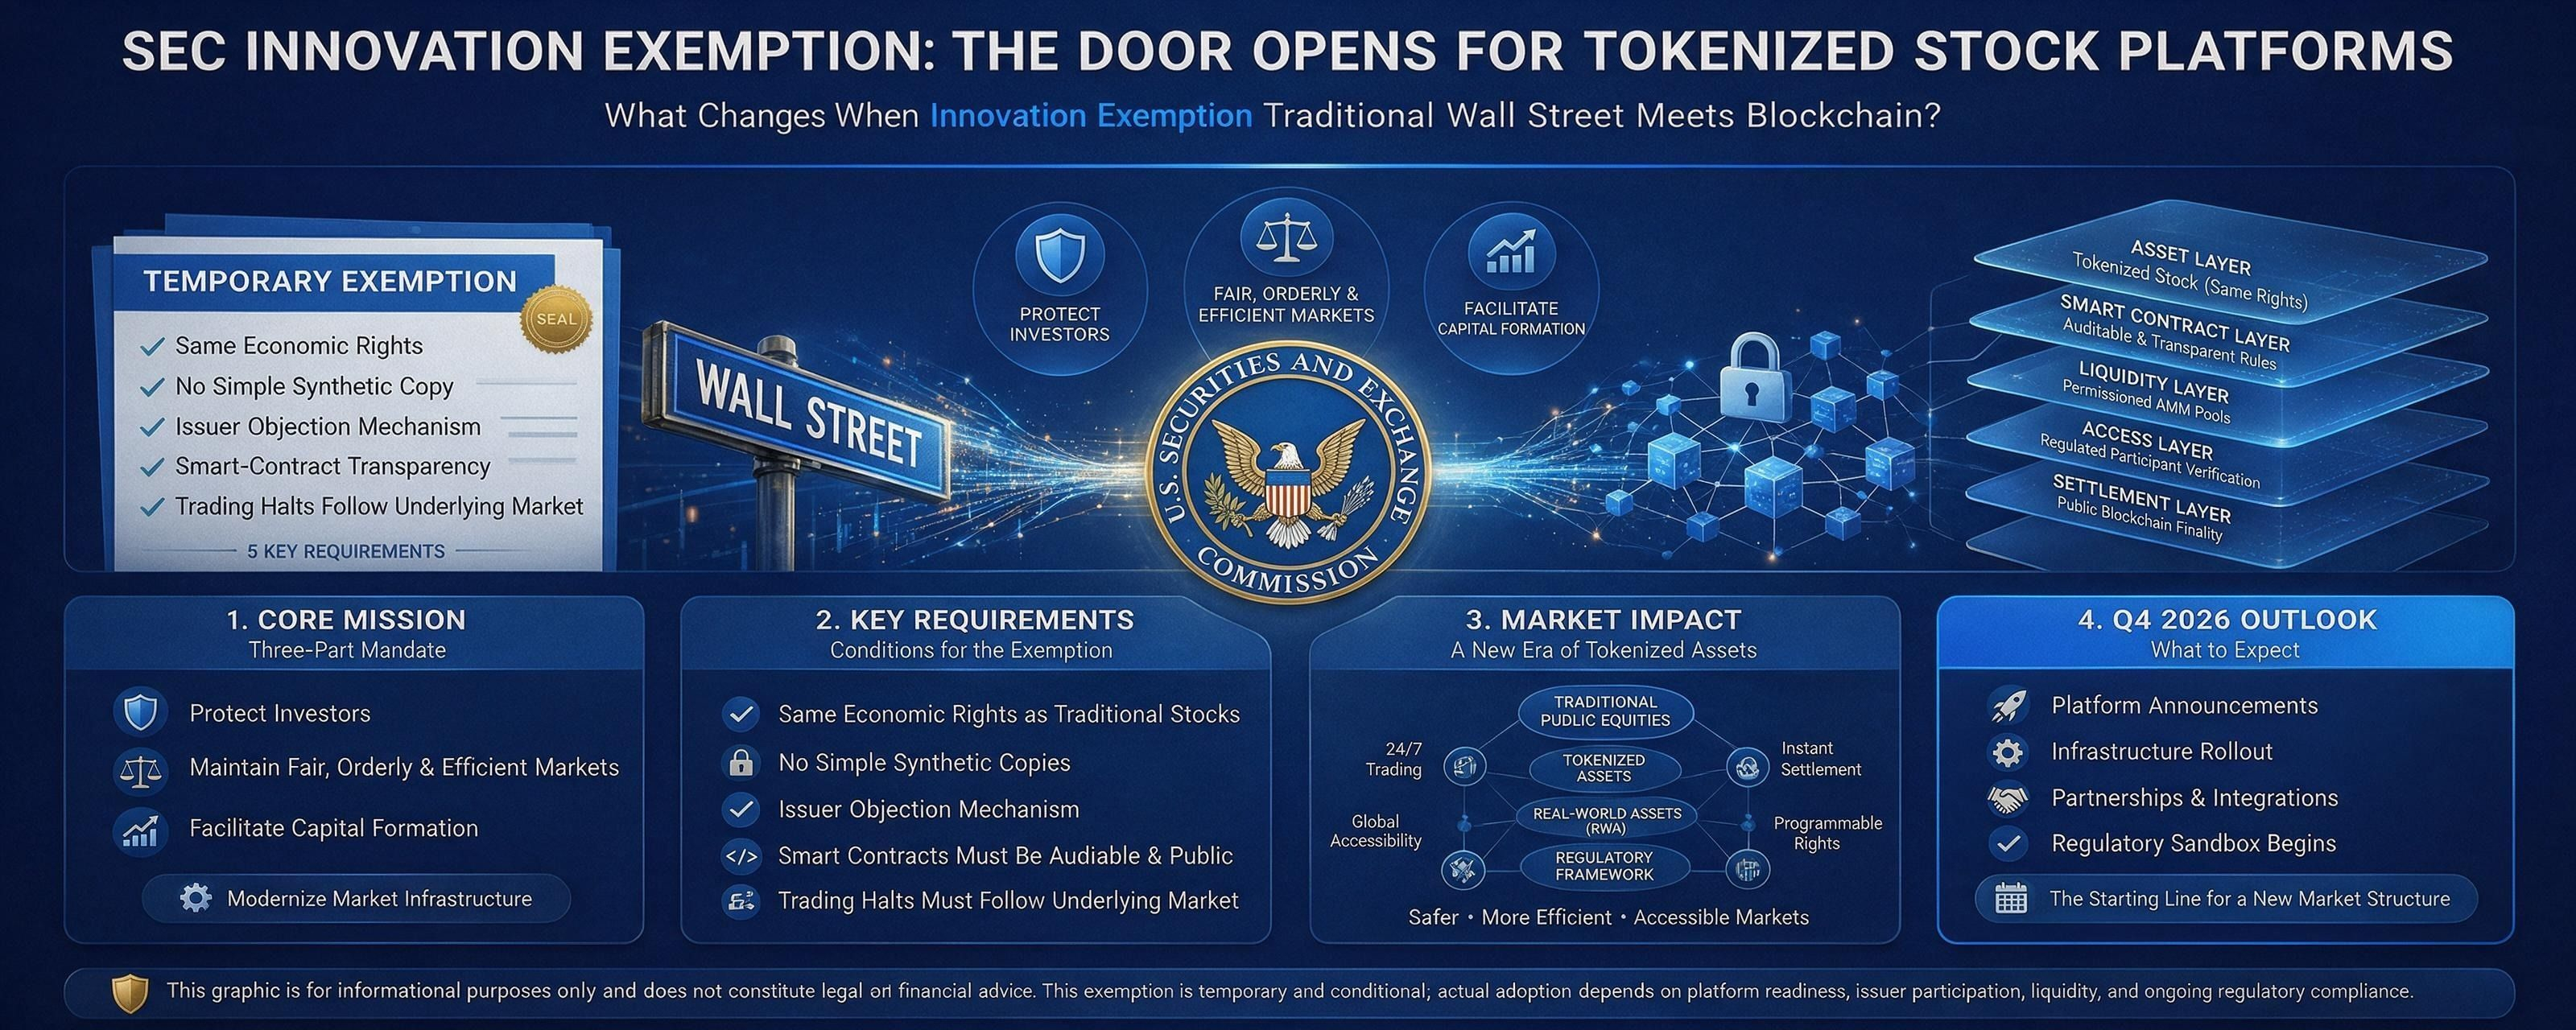
Its core mission has three parts:
Protect investorsMaintain fair, orderly and efficient marketsFacilitate capital formation
The SEC also oversees securities exchanges, brokers, dealers, investment advisers and other important parts of the U.S. securities ecosystem.
So when the SEC changes how tokenized stocks can be traded, this isn't simply a crypto announcement.
It potentially changes the infrastructure connecting blockchain + traditional equities.
What exactly changed?
The SEC granted temporary, conditional exemptions to Tokenized Securities Venues (TSVs).
These venues can use permissioned automated market makers and liquidity pools to facilitate trading of certain tokenized National Market System (NMS) stocks. The order also provides conditional relief for certain liquidity providers from the dealer definition.
The important word is conditional.
This is not a blanket approval for every crypto platform to tokenize every stock.
The framework includes several requirements.
For example:
1. Same economic rights
A tokenized stock must provide holders with the same rights and privileges as the equivalent traditional stock, including relevant dividend and voting rights.
2. No simple synthetic copy
The framework is designed around tokenized securities rather than tokens that merely imitate a stock's price without representing the underlying security rights.
3. Issuer objection mechanism
When a third party tokenizes a stock, the issuer must receive notice and an opportunity to object.
4. Smart-contract transparency
Smart contracts used by TSVs must be auditable and public, and deployed on a public, permissionless distributed ledger.
5. Trading halts must follow the underlying market
If trading in the underlying stock stops on its primary exchange, trading of its tokenized version must also stop.
The exemption is temporary and is scheduled to expire five years after publication, while the SEC collects public comments and considers longer-term rules.
Fundamental Analysis
The fundamental story is bigger than simply putting stock tickers on a blockchain.
Tokenization could potentially change several layers of market infrastructure:
Settlement:
Blockchain-based settlement can reduce the number of intermediaries involved in transferring ownership.
Transparency:
Onchain records can provide a verifiable transaction history.
Liquidity:
Permissioned AMM liquidity pools create a different mechanism for matching buyers and sellers.
Market access:
Tokenized securities could eventually make equity infrastructure more interoperable with digital-asset markets.
24/7 infrastructure:
Blockchain markets can technically operate outside traditional exchange hours, although the SEC framework still requires tokenized trading to respect restrictions such as underlying-stock trading halts.
The SEC itself has described tokenization as having potential to modernize issuance, trading, transfer, settlement and ownership-recording infrastructure.
That is why this development matters beyond crypto.
It is potentially an infrastructure upgrade, not simply another token narrative.
Technical Analysis What Changes on the Blockchain Side?
From a technical perspective, the interesting part is the combination of:
Tokenized equity + smart contracts + AMM liquidity + permissioned access + public blockchain settlement.
The architecture creates several important components:
Asset layer → token represents the underlying stock rights.
Smart-contract layer → rules govern transfers and trading.
Liquidity layer → AMM pools provide liquidity.
Access layer → only permitted participants can interact with the relevant trading venue.
Settlement layer → blockchain records transactions and ownership.
This is different from many existing crypto platforms where a token simply tracks the price of an external asset.
The SEC framework specifically focuses on tokenized NMS stock with underlying securities rights.
That distinction could become extremely important for the future of RWA markets.
What Could Happen in Q4 2026?
The current headline says platforms could announce plans as early as next quarter.
That should not be interpreted as:
Tokenized stock trading is guaranteed to launch next quarter.
The SEC has created a regulatory pathway. Individual platforms still need to satisfy the conditions, build the infrastructure, establish liquidity, address issuer participation and meet applicable requirements.
But Q4 could become an important period for announcements, partnerships and platform development.
Major financial and crypto companies have already shown interest in tokenized equities, while traditional market infrastructure providers are also exploring tokenization.
The Bigger Crypto Impact
If tokenized equities gain meaningful adoption, the boundary between crypto markets and traditional capital markets becomes much thinner.
Imagine one infrastructure where investors can interact with:
BTC
ETH
Tokenized equities
Tokenized funds
Tokenized Treasuries
Other RWAs
The technology doesn't automatically guarantee adoption.
The real test will be:
Liquidity → regulation → issuer participation → custody → settlement → investor demand.
That is where the next phase of tokenization will be decided.
For me, the most interesting part of this SEC decision isn't the headline that “stocks are coming onchain.”
It is that regulators are now experimenting with the market infrastructure itself.
And if Q4 2026 brings actual platform announcements, the tokenization narrative could move from an RWA concept into a real market-structure experiment.
Not financial advice. The exemption is temporary and conditional, and actual adoption remains dependent on platforms, issuers, liquidity and regulatory requirements.
#Binance #SEC #TokenizedStockPlatformsCouldLaunchNextQuarter $NVDAB $NVDA.US $GOOGL.US
{spot}(NVDABUSDT)
{future}(NVDAUSDT)
SEC Innovation Exemption Could Open the Door to Tokenized Stock Platforms in Q4
Something important is changing between traditional Wall Street and blockchain.
On September 17, 2026, the U.S. Securities and Exchange Commission (SEC) introduced its temporary Innovation Exemption, creating a regulatory pathway for certain platforms to trade tokenized U.S. stocks on blockchain-based venues. The development could allow interested tokenized-stock platforms to announce plans as early as Q4 2026.
But before looking at the crypto impact, it is important to understand what the SEC actually does.
What is the SEC?
The Securities and Exchange Commission is the U.S. federal regulator responsible for overseeing the securities markets.
Its core mission has three parts:
Protect investorsMaintain fair, orderly and efficient marketsFacilitate capital formation
The SEC also oversees securities exchanges, brokers, dealers, investment advisers and other important parts of the U.S. securities ecosystem.
So when the SEC changes how tokenized stocks can be traded, this isn't simply a crypto announcement.
It potentially changes the infrastructure connecting blockchain + traditional equities.
What exactly changed?
The SEC granted temporary, conditional exemptions to Tokenized Securities Venues (TSVs).
These venues can use permissioned automated market makers and liquidity pools to facilitate trading of certain tokenized National Market System (NMS) stocks. The order also provides conditional relief for certain liquidity providers from the dealer definition.
The important word is conditional.
This is not a blanket approval for every crypto platform to tokenize every stock.
The framework includes several requirements.
For example:
1. Same economic rights
A tokenized stock must provide holders with the same rights and privileges as the equivalent traditional stock, including relevant dividend and voting rights.
2. No simple synthetic copy
The framework is designed around tokenized securities rather than tokens that merely imitate a stock's price without representing the underlying security rights.
3. Issuer objection mechanism
When a third party tokenizes a stock, the issuer must receive notice and an opportunity to object.
4. Smart-contract transparency
Smart contracts used by TSVs must be auditable and public, and deployed on a public, permissionless distributed ledger.
5. Trading halts must follow the underlying market
If trading in the underlying stock stops on its primary exchange, trading of its tokenized version must also stop.
The exemption is temporary and is scheduled to expire five years after publication, while the SEC collects public comments and considers longer-term rules.
Fundamental Analysis
The fundamental story is bigger than simply putting stock tickers on a blockchain.
Tokenization could potentially change several layers of market infrastructure:
Settlement:
Blockchain-based settlement can reduce the number of intermediaries involved in transferring ownership.
Transparency:
Onchain records can provide a verifiable transaction history.
Liquidity:
Permissioned AMM liquidity pools create a different mechanism for matching buyers and sellers.
Market access:
Tokenized securities could eventually make equity infrastructure more interoperable with digital-asset markets.
24/7 infrastructure:
Blockchain markets can technically operate outside traditional exchange hours, although the SEC framework still requires tokenized trading to respect restrictions such as underlying-stock trading halts.
The SEC itself has described tokenization as having potential to modernize issuance, trading, transfer, settlement and ownership-recording infrastructure.
That is why this development matters beyond crypto.
It is potentially an infrastructure upgrade, not simply another token narrative.
Technical Analysis What Changes on the Blockchain Side?
From a technical perspective, the interesting part is the combination of:
Tokenized equity + smart contracts + AMM liquidity + permissioned access + public blockchain settlement.
The architecture creates several important components:
Asset layer → token represents the underlying stock rights.
Smart-contract layer → rules govern transfers and trading.
Liquidity layer → AMM pools provide liquidity.
Access layer → only permitted participants can interact with the relevant trading venue.
Settlement layer → blockchain records transactions and ownership.
This is different from many existing crypto platforms where a token simply tracks the price of an external asset.
The SEC framework specifically focuses on tokenized NMS stock with underlying securities rights.
That distinction could become extremely important for the future of RWA markets.
What Could Happen in Q4 2026?
The current headline says platforms could announce plans as early as next quarter.
That should not be interpreted as:
Tokenized stock trading is guaranteed to launch next quarter.
The SEC has created a regulatory pathway. Individual platforms still need to satisfy the conditions, build the infrastructure, establish liquidity, address issuer participation and meet applicable requirements.
But Q4 could become an important period for announcements, partnerships and platform development.
Major financial and crypto companies have already shown interest in tokenized equities, while traditional market infrastructure providers are also exploring tokenization.
The Bigger Crypto Impact
If tokenized equities gain meaningful adoption, the boundary between crypto markets and traditional capital markets becomes much thinner.
Imagine one infrastructure where investors can interact with:
BTC
ETH
Tokenized equities
Tokenized funds
Tokenized Treasuries
Other RWAs
The technology doesn't automatically guarantee adoption.
The real test will be:
Liquidity → regulation → issuer participation → custody → settlement → investor demand.
That is where the next phase of tokenization will be decided.
For me, the most interesting part of this SEC decision isn't the headline that “stocks are coming onchain.”
It is that regulators are now experimenting with the market infrastructure itself.
And if Q4 2026 brings actual platform announcements, the tokenization narrative could move from an RWA concept into a real market-structure experiment.
Not financial advice. The exemption is temporary and conditional, and actual adoption remains dependent on platforms, issuers, liquidity and regulatory requirements.
#Binance #SEC #TokenizedStockPlatformsCouldLaunchNextQuarter $NVDAB $NVDA.US $GOOGL.US
On September 17, 2026, the U.S. Securities and Exchange Commission (SEC) introduced its temporary Innovation Exemption, creating a regulatory pathway for certain platforms to trade tokenized U.S. stocks on blockchain-based venues. The development could allow interested tokenized-stock platforms to announce plans as early as Q4 2026.
But before looking at the crypto impact, it is important to understand what the SEC actually does.
What is the SEC?
The Securities and Exchange Commission is the U.S. federal regulator responsible for overseeing the securities markets.
Its core mission has three parts:
Protect investorsMaintain fair, orderly and efficient marketsFacilitate capital formation
The SEC also oversees securities exchanges, brokers, dealers, investment advisers and other important parts of the U.S. securities ecosystem.
So when the SEC changes how tokenized stocks can be traded, this isn't simply a crypto announcement.
It potentially changes the infrastructure connecting blockchain + traditional equities.
What exactly changed?
The SEC granted temporary, conditional exemptions to Tokenized Securities Venues (TSVs).
These venues can use permissioned automated market makers and liquidity pools to facilitate trading of certain tokenized National Market System (NMS) stocks. The order also provides conditional relief for certain liquidity providers from the dealer definition.
The important word is conditional.
This is not a blanket approval for every crypto platform to tokenize every stock.
The framework includes several requirements.
For example:
1. Same economic rights
A tokenized stock must provide holders with the same rights and privileges as the equivalent traditional stock, including relevant dividend and voting rights.
2. No simple synthetic copy
The framework is designed around tokenized securities rather than tokens that merely imitate a stock's price without representing the underlying security rights.
3. Issuer objection mechanism
When a third party tokenizes a stock, the issuer must receive notice and an opportunity to object.
4. Smart-contract transparency
Smart contracts used by TSVs must be auditable and public, and deployed on a public, permissionless distributed ledger.
5. Trading halts must follow the underlying market
If trading in the underlying stock stops on its primary exchange, trading of its tokenized version must also stop.
The exemption is temporary and is scheduled to expire five years after publication, while the SEC collects public comments and considers longer-term rules.
Fundamental Analysis
The fundamental story is bigger than simply putting stock tickers on a blockchain.
Tokenization could potentially change several layers of market infrastructure:
Settlement:
Blockchain-based settlement can reduce the number of intermediaries involved in transferring ownership.
Transparency:
Onchain records can provide a verifiable transaction history.
Liquidity:
Permissioned AMM liquidity pools create a different mechanism for matching buyers and sellers.
Market access:
Tokenized securities could eventually make equity infrastructure more interoperable with digital-asset markets.
24/7 infrastructure:
Blockchain markets can technically operate outside traditional exchange hours, although the SEC framework still requires tokenized trading to respect restrictions such as underlying-stock trading halts.
The SEC itself has described tokenization as having potential to modernize issuance, trading, transfer, settlement and ownership-recording infrastructure.
That is why this development matters beyond crypto.
It is potentially an infrastructure upgrade, not simply another token narrative.
Technical Analysis What Changes on the Blockchain Side?
From a technical perspective, the interesting part is the combination of:
Tokenized equity + smart contracts + AMM liquidity + permissioned access + public blockchain settlement.
The architecture creates several important components:
Asset layer → token represents the underlying stock rights.
Smart-contract layer → rules govern transfers and trading.
Liquidity layer → AMM pools provide liquidity.
Access layer → only permitted participants can interact with the relevant trading venue.
Settlement layer → blockchain records transactions and ownership.
This is different from many existing crypto platforms where a token simply tracks the price of an external asset.
The SEC framework specifically focuses on tokenized NMS stock with underlying securities rights.
That distinction could become extremely important for the future of RWA markets.
What Could Happen in Q4 2026?
The current headline says platforms could announce plans as early as next quarter.
That should not be interpreted as:
Tokenized stock trading is guaranteed to launch next quarter.
The SEC has created a regulatory pathway. Individual platforms still need to satisfy the conditions, build the infrastructure, establish liquidity, address issuer participation and meet applicable requirements.
But Q4 could become an important period for announcements, partnerships and platform development.
Major financial and crypto companies have already shown interest in tokenized equities, while traditional market infrastructure providers are also exploring tokenization.
The Bigger Crypto Impact
If tokenized equities gain meaningful adoption, the boundary between crypto markets and traditional capital markets becomes much thinner.
Imagine one infrastructure where investors can interact with:
BTC
ETH
Tokenized equities
Tokenized funds
Tokenized Treasuries
Other RWAs
The technology doesn't automatically guarantee adoption.
The real test will be:
Liquidity → regulation → issuer participation → custody → settlement → investor demand.
That is where the next phase of tokenization will be decided.
For me, the most interesting part of this SEC decision isn't the headline that “stocks are coming onchain.”
It is that regulators are now experimenting with the market infrastructure itself.
And if Q4 2026 brings actual platform announcements, the tokenization narrative could move from an RWA concept into a real market-structure experiment.
Not financial advice. The exemption is temporary and conditional, and actual adoption remains dependent on platforms, issuers, liquidity and regulatory requirements.
#Binance #SEC #TokenizedStockPlatformsCouldLaunchNextQuarter $NVDAB $NVDA.US $GOOGL.US
1
169
Top 10 assets By volume Crypto Market Snapshot | September 20, 2026.
The Rotation Is Getting Interesting
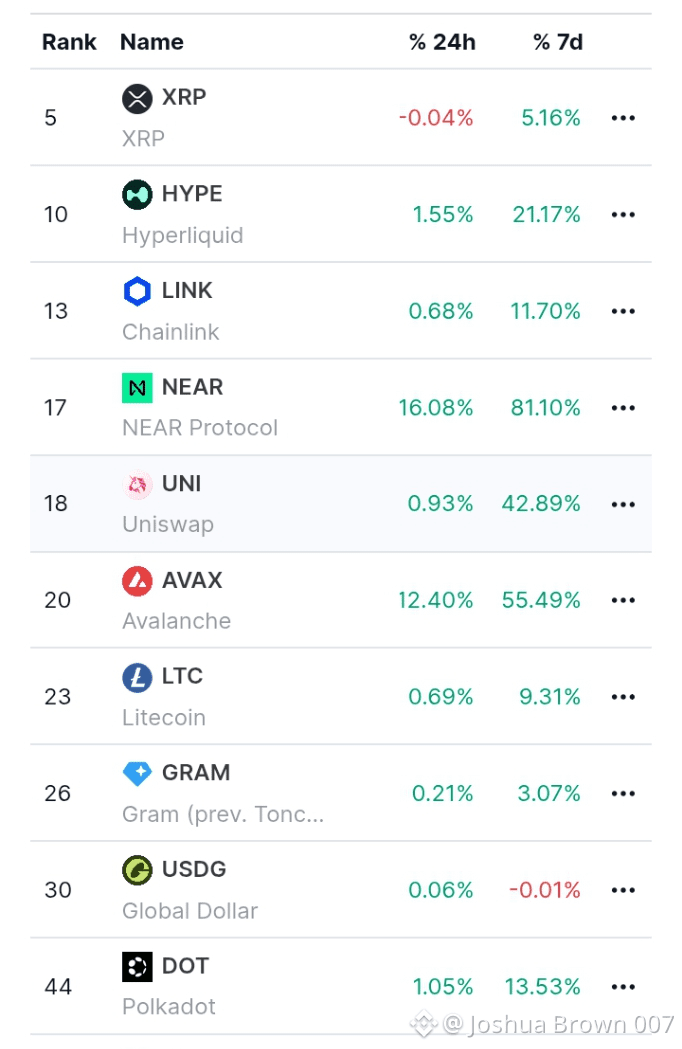
September 20 data shows strong 7 day momentum across several major altcoins.
🔹 $NEAR: +81.10% in 7D biggest move in this group
🔹 $AVAX: +55.49%
🔹 $UNI: +42.89%
🔹 $HYPE: +21.17%
🔹 $DOT: +13.53%
🔹 $LINK: +11.70%
🔹 $LTC: +9.31%
🔹 $XRP: +5.16%
The interesting part is volume.
$XRP traded $2.69B, $NEAR $2.05B, $AVAX $1.48B and $HYPE $854M in 24h.
This isn't just a price move capital and volume are rotating across different sectors.
But after such sharp weekly gains, volatility can expand quickly.
I’m watching whether volume continues to confirm the move or starts fading.
Not chasing candles. Watching the flow.
Top 10 assets By volume Crypto Market Snapshot | September 20, 2026.
The Rotation Is Getting Interesting
September 20 data shows strong 7 day momentum across several major altcoins.
🔹 $NEAR: +81.10% in 7D biggest move in this group
🔹 $AVAX: +55.49%
🔹 $UNI: +42.89%
🔹 $HYPE: +21.17%
🔹 $DOT: +13.53%
🔹 $LINK: +11.70%
🔹 $LTC: +9.31%
🔹 $XRP: +5.16%
The interesting part is volume.
$XRP traded $2.69B, $NEAR $2.05B, $AVAX $1.48B and $HYPE $854M in 24h.
This isn't just a price move capital and volume are rotating across different sectors.
But after such sharp weekly gains, volatility can expand quickly.
I’m watching whether volume continues to confirm the move or starts fading.
Not chasing candles. Watching the flow.
The Rotation Is Getting Interesting
September 20 data shows strong 7 day momentum across several major altcoins.
🔹 $NEAR: +81.10% in 7D biggest move in this group
🔹 $AVAX: +55.49%
🔹 $UNI: +42.89%
🔹 $HYPE: +21.17%
🔹 $DOT: +13.53%
🔹 $LINK: +11.70%
🔹 $LTC: +9.31%
🔹 $XRP: +5.16%
The interesting part is volume.
$XRP traded $2.69B, $NEAR $2.05B, $AVAX $1.48B and $HYPE $854M in 24h.
This isn't just a price move capital and volume are rotating across different sectors.
But after such sharp weekly gains, volatility can expand quickly.
I’m watching whether volume continues to confirm the move or starts fading.
Not chasing candles. Watching the flow.
1
385
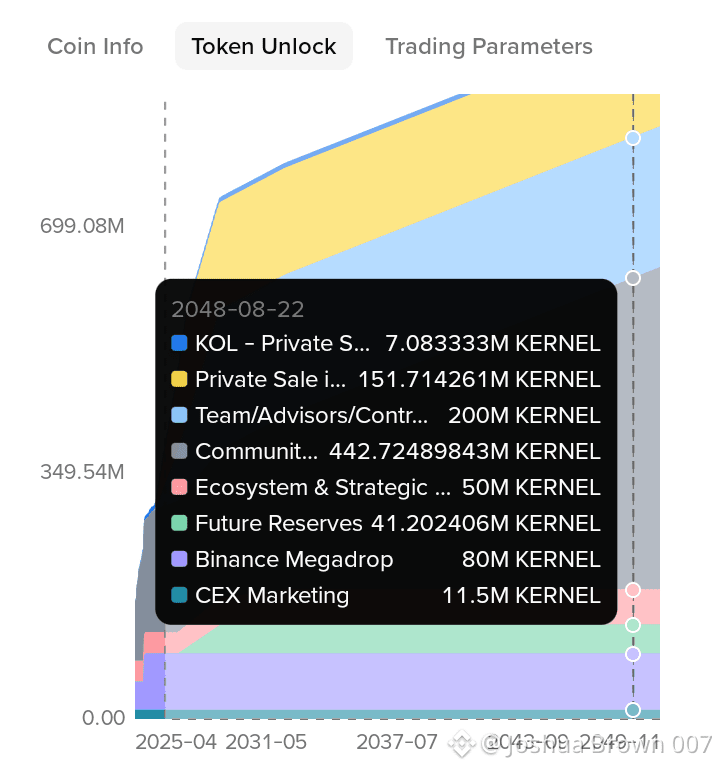
$KERNEL is up sharply but tomorrow starts a supply test.
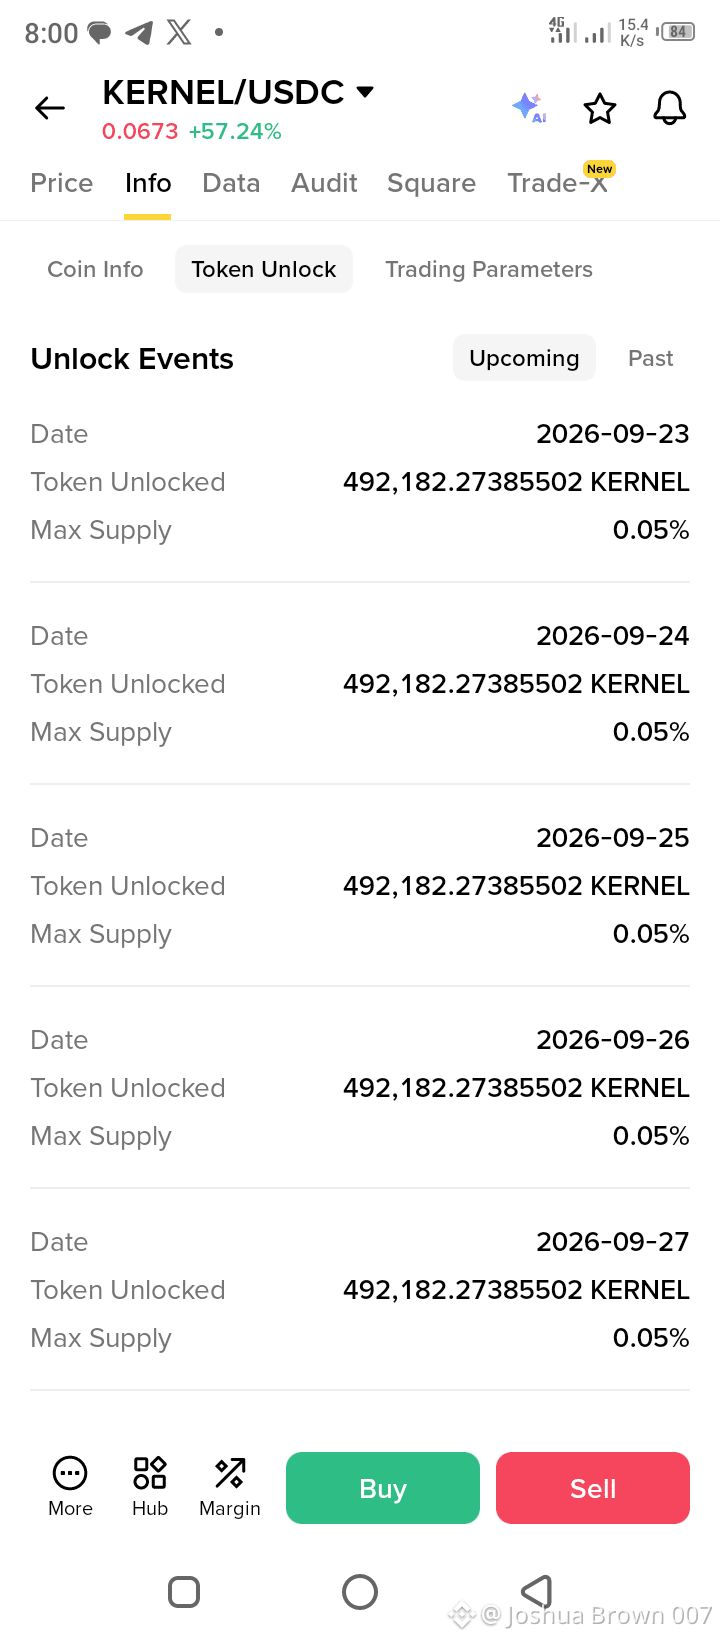
KERNEL is around $0.0673, already +57% on the screen I’m watching.
But from Sept. 23, the token unlock schedule shows:
492,182 KERNEL every day = 0.05% of max supply
Sept 23 → 24 → 25 → 26 → 27…
This same rate continues, that’s ~1% of max supply next 20 days.
At $0.0673, each daily unlock is roughly $33K worth of tokens.
That sounds small but KERNEL’s circulating supply is only around 28.8% of the 1B max supply, so even a relatively small daily release increases available supply.
Tokenomist +1
The interesting part:
Price is pumping +57%, while new supply is entering daily.
That creates two forces:
🟢 Strong volume can absorb the new tokens
🔴 Weak demand can turn unlocks into selling pressure
And KERNEL has historically shown notable volatility around larger unlock events; previous unlocks were followed by declines in several periods, although that does not mean the same pattern must repeat.
So tomorrow I’m watching:
Price + Volume + CEX inflows + Daily unlocks
The pump is one story.
The supply entering the market is the story I’m watching next.
#DAO #ARB🔥🔥🔥 #NEARRisesNearly80%InAWeek
{future}(KERNELUSDT)
{future}(ARBUSDT)
{future}(NEARUSDT)
$KERNEL is up sharply but tomorrow starts a supply test.
KERNEL is around $0.0673, already +57% on the screen I’m watching.
But from Sept. 23, the token unlock schedule shows:
492,182 KERNEL every day = 0.05% of max supply
Sept 23 → 24 → 25 → 26 → 27…
This same rate continues, that’s ~1% of max supply next 20 days.
At $0.0673, each daily unlock is roughly $33K worth of tokens.
That sounds small but KERNEL’s circulating supply is only around 28.8% of the 1B max supply, so even a relatively small daily release increases available supply.
Tokenomist +1
The interesting part:
Price is pumping +57%, while new supply is entering daily.
That creates two forces:
🟢 Strong volume can absorb the new tokens
🔴 Weak demand can turn unlocks into selling pressure
And KERNEL has historically shown notable volatility around larger unlock events; previous unlocks were followed by declines in several periods, although that does not mean the same pattern must repeat.
So tomorrow I’m watching:
Price + Volume + CEX inflows + Daily unlocks
The pump is one story.
The supply entering the market is the story I’m watching next.
#DAO #ARB🔥🔥🔥 #NEARRisesNearly80%InAWeek
KERNEL is around $0.0673, already +57% on the screen I’m watching.
But from Sept. 23, the token unlock schedule shows:
492,182 KERNEL every day = 0.05% of max supply
Sept 23 → 24 → 25 → 26 → 27…
This same rate continues, that’s ~1% of max supply next 20 days.
At $0.0673, each daily unlock is roughly $33K worth of tokens.
That sounds small but KERNEL’s circulating supply is only around 28.8% of the 1B max supply, so even a relatively small daily release increases available supply.
Tokenomist +1
The interesting part:
Price is pumping +57%, while new supply is entering daily.
That creates two forces:
🟢 Strong volume can absorb the new tokens
🔴 Weak demand can turn unlocks into selling pressure
And KERNEL has historically shown notable volatility around larger unlock events; previous unlocks were followed by declines in several periods, although that does not mean the same pattern must repeat.
So tomorrow I’m watching:
Price + Volume + CEX inflows + Daily unlocks
The pump is one story.
The supply entering the market is the story I’m watching next.
#DAO #ARB🔥🔥🔥 #NEARRisesNearly80%InAWeek
1
1
449
#Binance
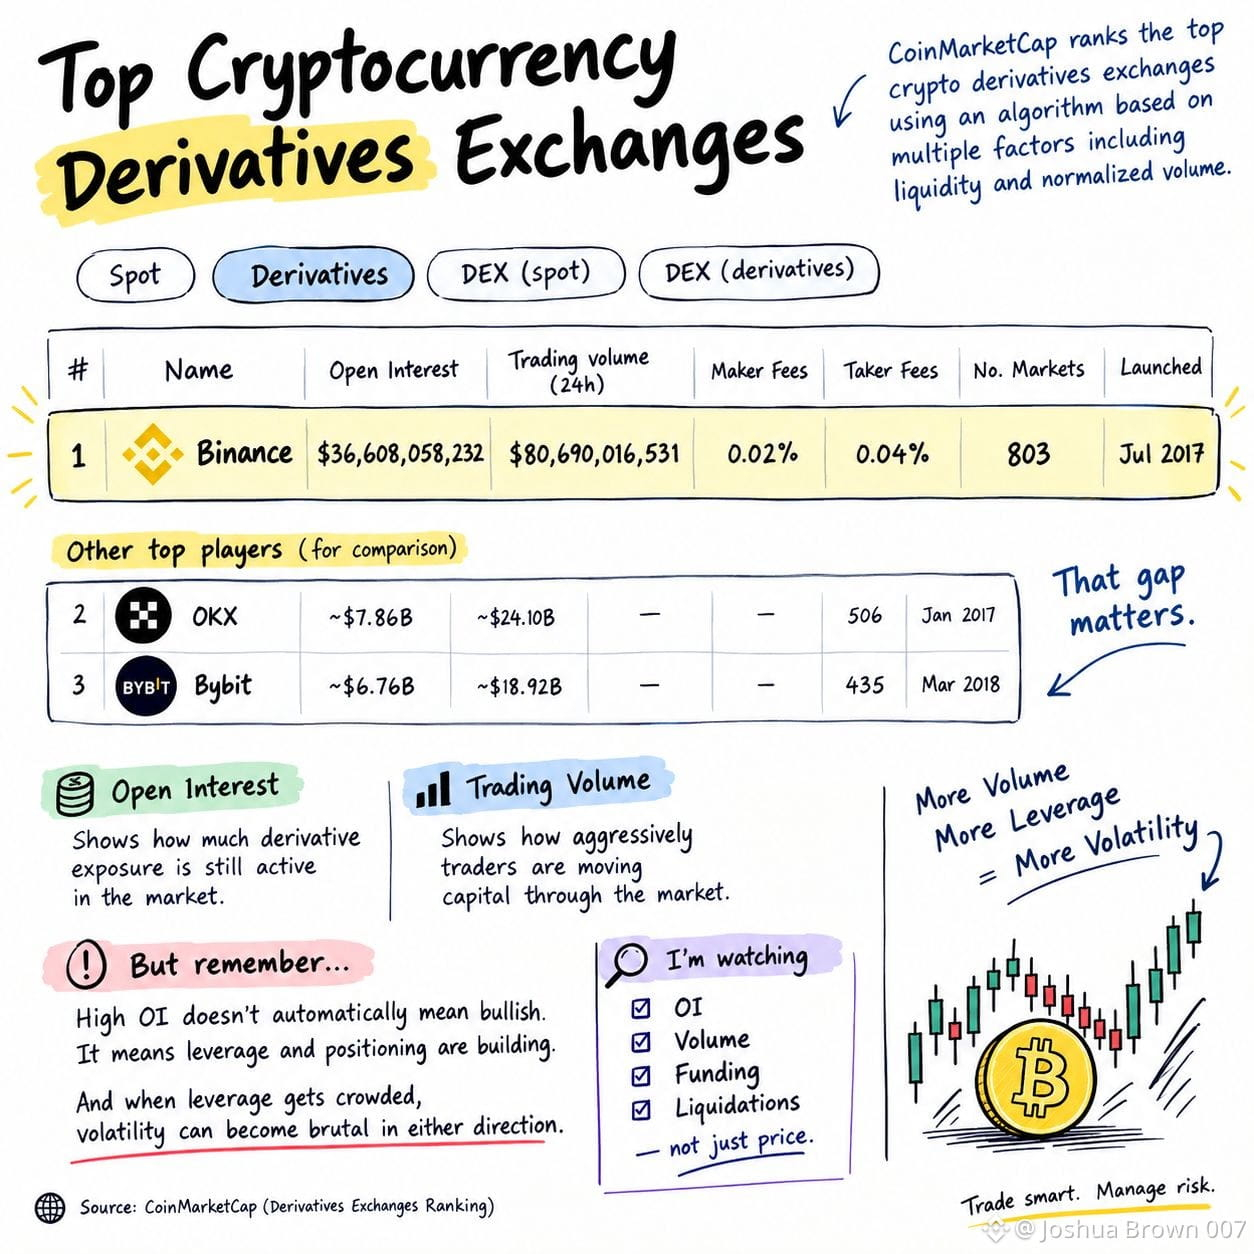
I checked the latest CoinMarketCap derivatives data and one number immediately stands out:
$BNB’s ecosystem exchange, Binance, is still dominating derivatives.
Binance • $35.09B Open Interest • $51.10B 24H derivatives volume • 803 markets • 0.02% maker fee • 0.04% taker fee
For comparison, OKX has ~$7.86B OI and Bybit ~$6.76B.
That gap matters.
Open Interest shows how much derivative exposure is still active, while volume shows how aggressively traders are moving capital through the market.
But remember: high OI doesn't automatically mean bullish.
It means leverage and positioning are building.
And when leverage gets crowded, volatility can become brutal in either direction.
I’m watching OI + volume + funding + liquidations together not just price.
{spot}(BNBUSDT)
$PHA
{future}(PHAUSDT)
$SUI
{future}(SUIUSDT)
#Binance
I checked the latest CoinMarketCap derivatives data and one number immediately stands out:
$BNB’s ecosystem exchange, Binance, is still dominating derivatives.
Binance • $35.09B Open Interest • $51.10B 24H derivatives volume • 803 markets • 0.02% maker fee • 0.04% taker fee
For comparison, OKX has ~$7.86B OI and Bybit ~$6.76B.
That gap matters.
Open Interest shows how much derivative exposure is still active, while volume shows how aggressively traders are moving capital through the market.
But remember: high OI doesn't automatically mean bullish.
It means leverage and positioning are building.
And when leverage gets crowded, volatility can become brutal in either direction.
I’m watching OI + volume + funding + liquidations together not just price.
$PHA
$SUI
I checked the latest CoinMarketCap derivatives data and one number immediately stands out:
$BNB’s ecosystem exchange, Binance, is still dominating derivatives.
Binance • $35.09B Open Interest • $51.10B 24H derivatives volume • 803 markets • 0.02% maker fee • 0.04% taker fee
For comparison, OKX has ~$7.86B OI and Bybit ~$6.76B.
That gap matters.
Open Interest shows how much derivative exposure is still active, while volume shows how aggressively traders are moving capital through the market.
But remember: high OI doesn't automatically mean bullish.
It means leverage and positioning are building.
And when leverage gets crowded, volatility can become brutal in either direction.
I’m watching OI + volume + funding + liquidations together not just price.
$PHA
$SUI
1
205
#BTC☀
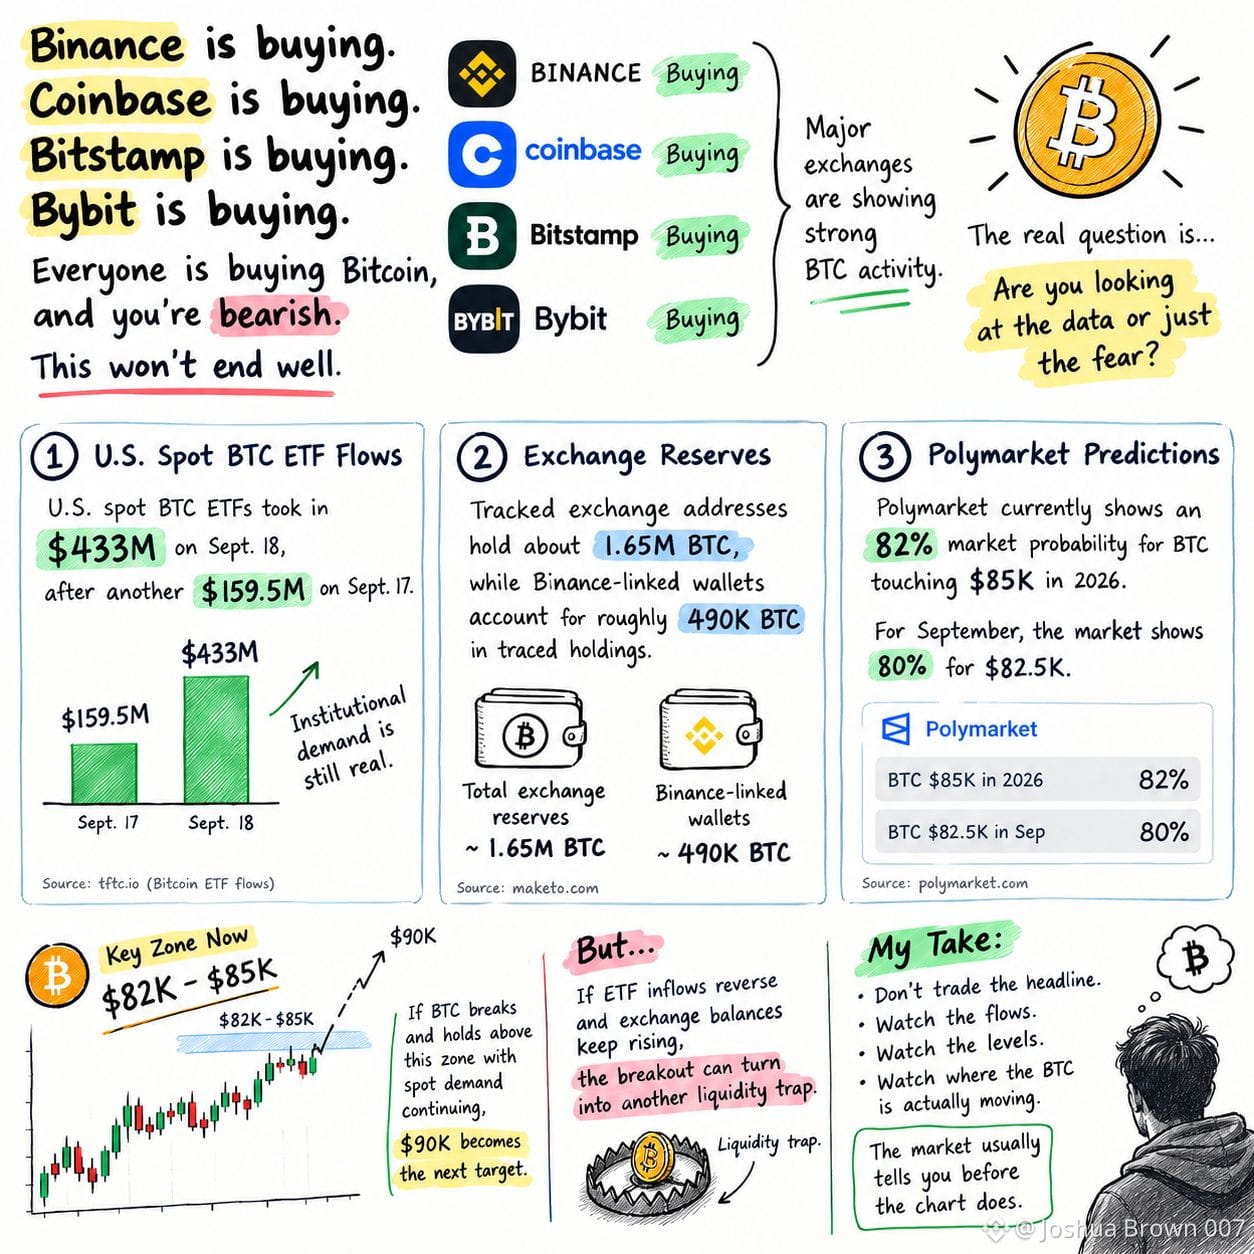
Are you waiting for dip $64K for Bitcoin Let Look a view of institutional buy and demand.
The interesting part isn’t just the narrative the data is starting to show a split between exchange liquidity and institutional demand.
Recent data shows U.S. spot BTC ETFs took in $433M on Sept. 18, after another $159.5M on Sept. 17.
TFTC +1
At the same time, tracked exchange addresses hold about 1.65M BTC, while Binance linked wallets account for roughly 490K BTC in traced holdings.
And Polymarket currently shows an 82% market probability for BTC touching $85K in 2026, while the September market shows 80% for $82.5K.
My take:
$82K–$85K is the key zone now.
If BTC breaks and holds above it with spot demand continuing, $90K becomes the next psychological target.
But if ETF inflows reverse and exchange balances keep rising, the breakout can turn into another liquidity trap.
Don't trade the headline.
Watch the flows. Watch the levels. Watch where the BTC is actually moving.
The market usually tells you before the chart does.$BTC
{spot}(BTCUSDT)
#BTC☀
Are you waiting for dip $64K for Bitcoin Let Look a view of institutional buy and demand.
The interesting part isn’t just the narrative the data is starting to show a split between exchange liquidity and institutional demand.
Recent data shows U.S. spot BTC ETFs took in $433M on Sept. 18, after another $159.5M on Sept. 17.
TFTC +1
At the same time, tracked exchange addresses hold about 1.65M BTC, while Binance linked wallets account for roughly 490K BTC in traced holdings.
And Polymarket currently shows an 82% market probability for BTC touching $85K in 2026, while the September market shows 80% for $82.5K.
My take:
$82K–$85K is the key zone now.
If BTC breaks and holds above it with spot demand continuing, $90K becomes the next psychological target.
But if ETF inflows reverse and exchange balances keep rising, the breakout can turn into another liquidity trap.
Don't trade the headline.
Watch the flows. Watch the levels. Watch where the BTC is actually moving.
The market usually tells you before the chart does.$BTC
Are you waiting for dip $64K for Bitcoin Let Look a view of institutional buy and demand.
The interesting part isn’t just the narrative the data is starting to show a split between exchange liquidity and institutional demand.
Recent data shows U.S. spot BTC ETFs took in $433M on Sept. 18, after another $159.5M on Sept. 17.
TFTC +1
At the same time, tracked exchange addresses hold about 1.65M BTC, while Binance linked wallets account for roughly 490K BTC in traced holdings.
And Polymarket currently shows an 82% market probability for BTC touching $85K in 2026, while the September market shows 80% for $82.5K.
My take:
$82K–$85K is the key zone now.
If BTC breaks and holds above it with spot demand continuing, $90K becomes the next psychological target.
But if ETF inflows reverse and exchange balances keep rising, the breakout can turn into another liquidity trap.
Don't trade the headline.
Watch the flows. Watch the levels. Watch where the BTC is actually moving.
The market usually tells you before the chart does.$BTC
1
67
$TRUMP ON CHAIN ALERT
The Trump Meme team just moved another 8.73M $TRUMP (~$17.99M) to BitGo custody.
That brings the 2-week total to ~31M TRUMP, worth ~$70.64M.
But here is the important part:
⚠️ BitGo custody ≠ confirmed selling.
So I’m watching the next wallet movement, not simply assuming a dump.
📉 Price impact if selling follows:
A large team-linked supply entering market liquidity could increase sell pressure and weaken support. If exchange deposits appear afterward, the risk of a sharper move increases.
📊 Technical levels to watch:
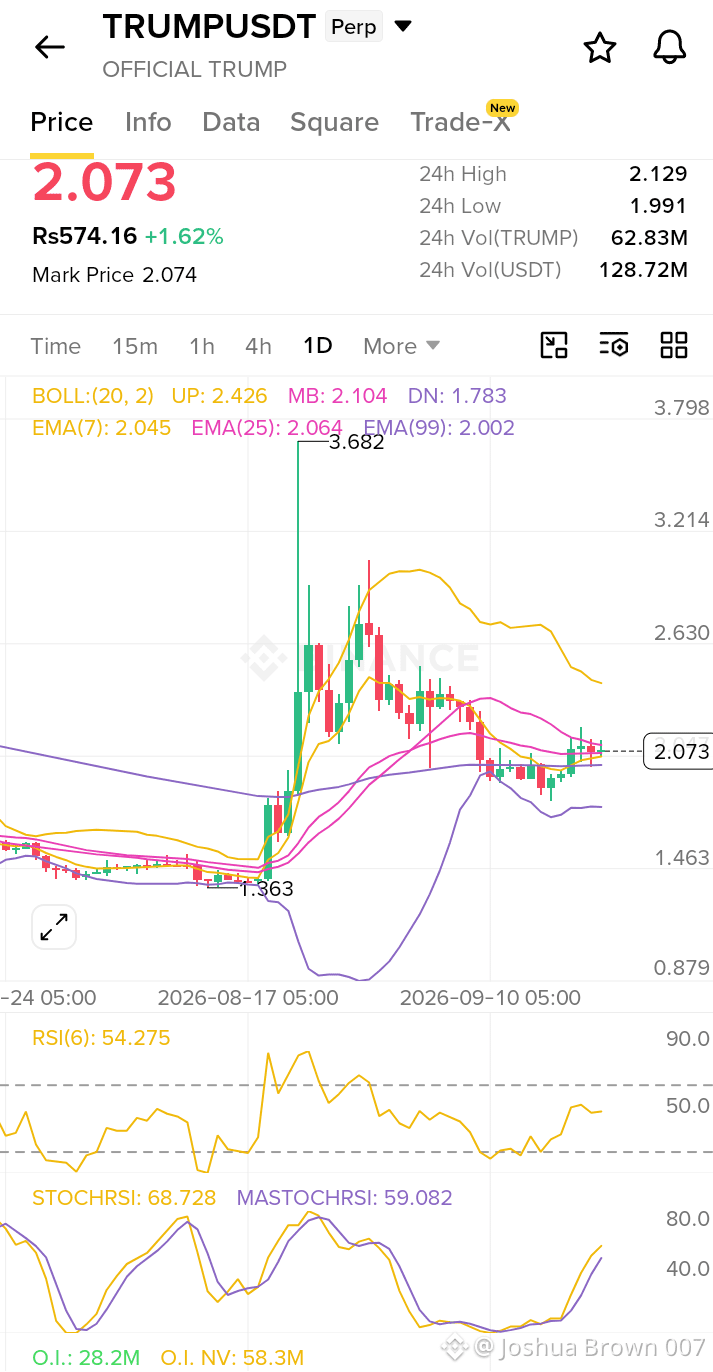
Current reporting places $TRUMP around $2.05, with resistance near $2.14 and support around $1.96. Price is also near the 50/200 EMA zone, making this an important area for confirmation.
My approach: Don’t panic-sell. Don’t blindly buy the dip.
Watch: → BitGo → exchange transfers
→ Spot volume
→ $1.96 support
→ $2.14 breakout
→ Wallet outflows/inflows
If $1.96 breaks with strong volume, downside pressure can accelerate.
If $2.14 is reclaimed with strong spot volume, the market may absorb the supply.
On chain flow first. Price confirmation second.
{future}(TRUMPUSDT)
{future}(MELANIAUSDT)
{future}(WLFIUSDT)
#TrumpCrypto #XRPExchangeReservesHitSevenYearLow #trumpcoin
$TRUMP ON CHAIN ALERT
The Trump Meme team just moved another 8.73M $TRUMP (~$17.99M) to BitGo custody.
That brings the 2-week total to ~31M TRUMP, worth ~$70.64M.
But here is the important part:
⚠️ BitGo custody ≠ confirmed selling.
So I’m watching the next wallet movement, not simply assuming a dump.
📉 Price impact if selling follows:
A large team-linked supply entering market liquidity could increase sell pressure and weaken support. If exchange deposits appear afterward, the risk of a sharper move increases.
📊 Technical levels to watch:
Current reporting places $TRUMP around $2.05, with resistance near $2.14 and support around $1.96. Price is also near the 50/200 EMA zone, making this an important area for confirmation.
My approach: Don’t panic-sell. Don’t blindly buy the dip.
Watch: → BitGo → exchange transfers
→ Spot volume
→ $1.96 support
→ $2.14 breakout
→ Wallet outflows/inflows
If $1.96 breaks with strong volume, downside pressure can accelerate.
If $2.14 is reclaimed with strong spot volume, the market may absorb the supply.
On chain flow first. Price confirmation second.
#TrumpCrypto #XRPExchangeReservesHitSevenYearLow #trumpcoin
The Trump Meme team just moved another 8.73M $TRUMP (~$17.99M) to BitGo custody.
That brings the 2-week total to ~31M TRUMP, worth ~$70.64M.
But here is the important part:
⚠️ BitGo custody ≠ confirmed selling.
So I’m watching the next wallet movement, not simply assuming a dump.
📉 Price impact if selling follows:
A large team-linked supply entering market liquidity could increase sell pressure and weaken support. If exchange deposits appear afterward, the risk of a sharper move increases.
📊 Technical levels to watch:
Current reporting places $TRUMP around $2.05, with resistance near $2.14 and support around $1.96. Price is also near the 50/200 EMA zone, making this an important area for confirmation.
My approach: Don’t panic-sell. Don’t blindly buy the dip.
Watch: → BitGo → exchange transfers
→ Spot volume
→ $1.96 support
→ $2.14 breakout
→ Wallet outflows/inflows
If $1.96 breaks with strong volume, downside pressure can accelerate.
If $2.14 is reclaimed with strong spot volume, the market may absorb the supply.
On chain flow first. Price confirmation second.
#TrumpCrypto #XRPExchangeReservesHitSevenYearLow #trumpcoin

1
676
Article
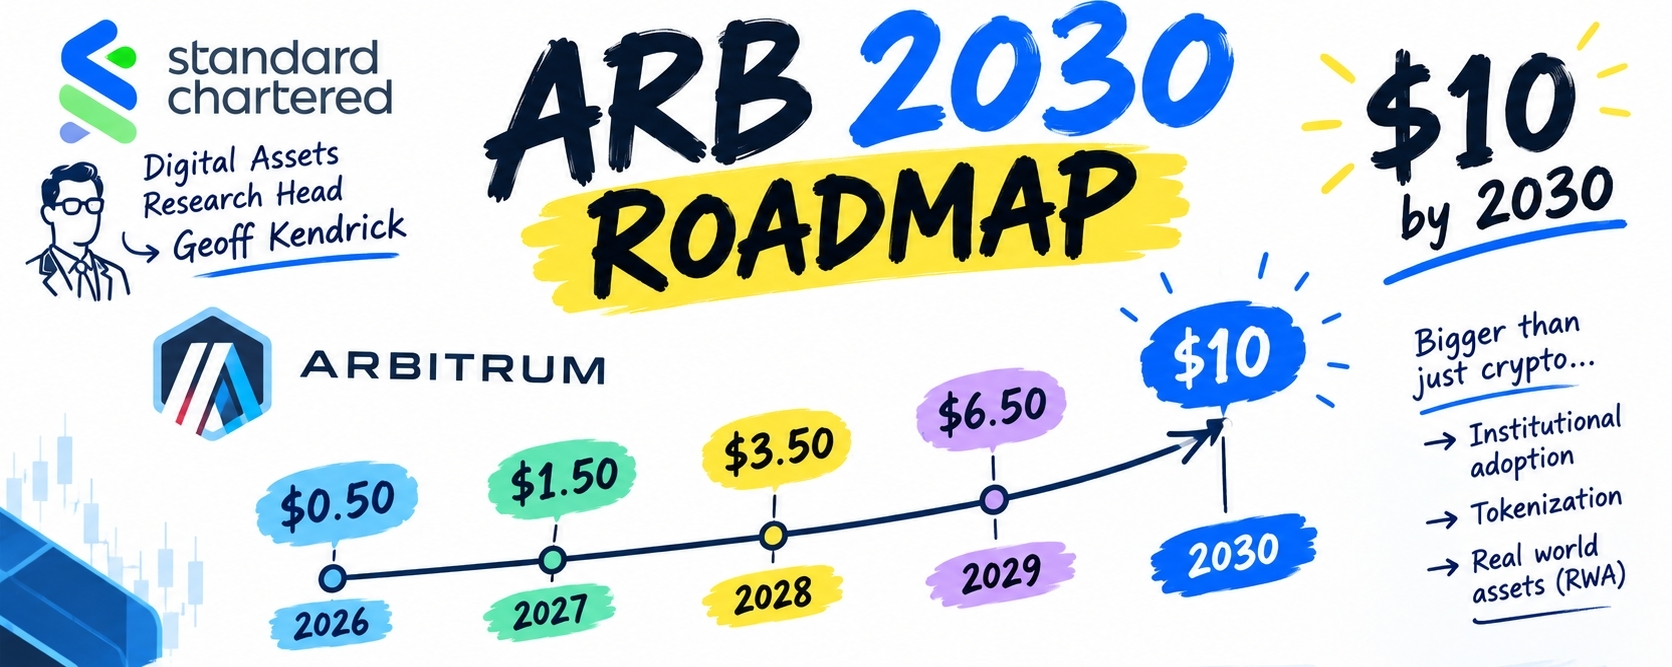
ARB Road map 2030 by Standard Chartered’s digital assets research head,Geoff KendrickStandard Chartered’s digital assets research head, Geoff Kendrick, just dropped a massive $10 long-term price target for Arbitrum (ARB) by the end of 2030. Using a baseline reference price of $0.14, the bank laid out an aggressive staircase trajectory:
2026 Target: $0.50
2027 Target: $1.50
2028 Target: $3.50
2029 Target: $6.50
2030 Target: $10.00
The Defiant
While a 70x growth projection from a major global bank sounds like an easy win, we need to bridge the gap between institutional theory and the cold hard data on the chart.
Here is what the technical and fundamental structure actually shows right now:
Technical Analysis Breakdown
The Local Bottom Is in Play: ARB recently found its all-time macro low at $0.07 in June. The subsequent recovery back to the $0.21 zone represents a solid baseline structure. The market is actively trying to establish this area as a long-term accumulation floor.
MetaMask +2
The Breakout Target ($0.50): For Kendrick’s 2026 target of $0.50 to hit, ARB needs to clear its current consolidation zone and break past its mid-year resistance levels. A push to $0.50 represents a roughly 138% move upward from the current $0.21 range, which is standard volatility for a layer-2 token entering an expansion phase.
Volume & Revenue Disconnect: On-chain data shows massive fundamentals. Thanks to the rollout of sub-networks like Robinhood Chain, Arbitrum’s monthly revenue has surged fivefold to $5 million. However, the price is not reacting proportionally yet because ARB is strictly a governance token—holders do not get a direct cut of those transaction fees today.
Binance +2
The Verdict for Retail Traders
This is not a meme coin pump-and-dump. It is a slow, structural institutional play based on the growth of real-world asset tokenization. Standard Chartered believes traditional finance firms will heavily license Arbitrum's technology stack.
Yahoo! Finance Canada +1
The Risk: ARB has heavy token unlocks and currently lacks direct value capture (like staking rewards or fee-sharing). If you buy into the $10 thesis, you have to be comfortable holding through years of dilution and hoping the DAO votes in a revenue-sharing model later on. It is a long-term infrastructure bet, not a get-rich-quick trade.
Standard Chartered just put out a massive $10 price target for Arbitrum (ARB) by the end of 2030. Their head of digital assets research, Geoff Kendrick, mapped out a step-by-step climb starting from a reference price of $0.14:
2026: $0.50
2027: $1.50
2028: $3.50
2029: $6.50
2030: $10.00
A 70x move predicted by a major global bank sounds amazing on paper, but I wanted to dig into the actual charts and data to see if this is realistic or just institutional hype. Here is my personal take based on what the market is showing right now.
The Chart Structure
Looking at the technicals, ARB hit its macro low right around $0.07 earlier this summer. Right now, it is fighting to establish a solid accumulation floor around the $0.21 zone.
For that 2026 target of $0.50 to happen, the price needs to clear its current consolidation range and flip previous mid-year resistance into support. That is roughly a 138% move from here—definitely doable in crypto, but it requires sustained buying volume to break the current downtrend structure.
The Massive Catch: Fundamentals vs. Price
Here is where things get tricky. Arbitrum's underlying ecosystem is actually doing great. Thanks to massive adoption from platforms like the Robinhood Chain, their monthly network revenue skyrocketed 5x to $5 million.
But here is the problem: ARB is a governance token, not a utility token.
Even though the network is making millions, none of that money goes directly to token holders. There is no native staking yield or fee-sharing mechanism yet. Until the DAO changes the tokenomics to give ARB direct value capture, the price is purely driven by speculation and sentiment, not network revenue.
My Personal Verdict
This is completely different from the pump-and-dump tokens we usually see. This is a long-term infrastructure play. Standard Chartered is banking heavily on the idea that big institutions will build on Arbitrum's tech stack for real-world asset tokenization.
If you are buying ARB based on this $10 target, you have to be ready to play the long game. You are going to absorb constant supply dilution from team and investor token unlocks, and you are betting that the community eventually votes in a revenue-share model. It is a solid layer-2 project, but do not expect it to make you rich overnight.
ARB Road map 2030 by Standard Chartered’s digital assets research head,Geoff Kendrick
Standard Chartered’s digital assets research head, Geoff Kendrick, just dropped a massive $10 long-term price target for Arbitrum (ARB) by the end of 2030. Using a baseline reference price of $0.14, the bank laid out an aggressive staircase trajectory:
2026 Target: $0.50
2027 Target: $1.50
2028 Target: $3.50
2029 Target: $6.50
2030 Target: $10.00
The Defiant
While a 70x growth projection from a major global bank sounds like an easy win, we need to bridge the gap between institutional theory and the cold hard data on the chart.
Here is what the technical and fundamental structure actually shows right now:
Technical Analysis Breakdown
The Local Bottom Is in Play: ARB recently found its all-time macro low at $0.07 in June. The subsequent recovery back to the $0.21 zone represents a solid baseline structure. The market is actively trying to establish this area as a long-term accumulation floor.
MetaMask +2
The Breakout Target ($0.50): For Kendrick’s 2026 target of $0.50 to hit, ARB needs to clear its current consolidation zone and break past its mid-year resistance levels. A push to $0.50 represents a roughly 138% move upward from the current $0.21 range, which is standard volatility for a layer-2 token entering an expansion phase.
Volume & Revenue Disconnect: On-chain data shows massive fundamentals. Thanks to the rollout of sub-networks like Robinhood Chain, Arbitrum’s monthly revenue has surged fivefold to $5 million. However, the price is not reacting proportionally yet because ARB is strictly a governance token—holders do not get a direct cut of those transaction fees today.
Binance +2
The Verdict for Retail Traders
This is not a meme coin pump-and-dump. It is a slow, structural institutional play based on the growth of real-world asset tokenization. Standard Chartered believes traditional finance firms will heavily license Arbitrum's technology stack.
Yahoo! Finance Canada +1
The Risk: ARB has heavy token unlocks and currently lacks direct value capture (like staking rewards or fee-sharing). If you buy into the $10 thesis, you have to be comfortable holding through years of dilution and hoping the DAO votes in a revenue-sharing model later on. It is a long-term infrastructure bet, not a get-rich-quick trade.
Standard Chartered just put out a massive $10 price target for Arbitrum (ARB) by the end of 2030. Their head of digital assets research, Geoff Kendrick, mapped out a step-by-step climb starting from a reference price of $0.14:
2026: $0.50
2027: $1.50
2028: $3.50
2029: $6.50
2030: $10.00
A 70x move predicted by a major global bank sounds amazing on paper, but I wanted to dig into the actual charts and data to see if this is realistic or just institutional hype. Here is my personal take based on what the market is showing right now.
The Chart Structure
Looking at the technicals, ARB hit its macro low right around $0.07 earlier this summer. Right now, it is fighting to establish a solid accumulation floor around the $0.21 zone.
For that 2026 target of $0.50 to happen, the price needs to clear its current consolidation range and flip previous mid-year resistance into support. That is roughly a 138% move from here—definitely doable in crypto, but it requires sustained buying volume to break the current downtrend structure.
The Massive Catch: Fundamentals vs. Price
Here is where things get tricky. Arbitrum's underlying ecosystem is actually doing great. Thanks to massive adoption from platforms like the Robinhood Chain, their monthly network revenue skyrocketed 5x to $5 million.
But here is the problem: ARB is a governance token, not a utility token.
Even though the network is making millions, none of that money goes directly to token holders. There is no native staking yield or fee-sharing mechanism yet. Until the DAO changes the tokenomics to give ARB direct value capture, the price is purely driven by speculation and sentiment, not network revenue.
My Personal Verdict
This is completely different from the pump-and-dump tokens we usually see. This is a long-term infrastructure play. Standard Chartered is banking heavily on the idea that big institutions will build on Arbitrum's tech stack for real-world asset tokenization.
If you are buying ARB based on this $10 target, you have to be ready to play the long game. You are going to absorb constant supply dilution from team and investor token unlocks, and you are betting that the community eventually votes in a revenue-share model. It is a solid layer-2 project, but do not expect it to make you rich overnight.
2026 Target: $0.50
2027 Target: $1.50
2028 Target: $3.50
2029 Target: $6.50
2030 Target: $10.00
The Defiant
While a 70x growth projection from a major global bank sounds like an easy win, we need to bridge the gap between institutional theory and the cold hard data on the chart.
Here is what the technical and fundamental structure actually shows right now:
Technical Analysis Breakdown
The Local Bottom Is in Play: ARB recently found its all-time macro low at $0.07 in June. The subsequent recovery back to the $0.21 zone represents a solid baseline structure. The market is actively trying to establish this area as a long-term accumulation floor.
MetaMask +2
The Breakout Target ($0.50): For Kendrick’s 2026 target of $0.50 to hit, ARB needs to clear its current consolidation zone and break past its mid-year resistance levels. A push to $0.50 represents a roughly 138% move upward from the current $0.21 range, which is standard volatility for a layer-2 token entering an expansion phase.
Volume & Revenue Disconnect: On-chain data shows massive fundamentals. Thanks to the rollout of sub-networks like Robinhood Chain, Arbitrum’s monthly revenue has surged fivefold to $5 million. However, the price is not reacting proportionally yet because ARB is strictly a governance token—holders do not get a direct cut of those transaction fees today.
Binance +2
The Verdict for Retail Traders
This is not a meme coin pump-and-dump. It is a slow, structural institutional play based on the growth of real-world asset tokenization. Standard Chartered believes traditional finance firms will heavily license Arbitrum's technology stack.
Yahoo! Finance Canada +1
The Risk: ARB has heavy token unlocks and currently lacks direct value capture (like staking rewards or fee-sharing). If you buy into the $10 thesis, you have to be comfortable holding through years of dilution and hoping the DAO votes in a revenue-sharing model later on. It is a long-term infrastructure bet, not a get-rich-quick trade.
Standard Chartered just put out a massive $10 price target for Arbitrum (ARB) by the end of 2030. Their head of digital assets research, Geoff Kendrick, mapped out a step-by-step climb starting from a reference price of $0.14:
2026: $0.50
2027: $1.50
2028: $3.50
2029: $6.50
2030: $10.00
A 70x move predicted by a major global bank sounds amazing on paper, but I wanted to dig into the actual charts and data to see if this is realistic or just institutional hype. Here is my personal take based on what the market is showing right now.
The Chart Structure
Looking at the technicals, ARB hit its macro low right around $0.07 earlier this summer. Right now, it is fighting to establish a solid accumulation floor around the $0.21 zone.
For that 2026 target of $0.50 to happen, the price needs to clear its current consolidation range and flip previous mid-year resistance into support. That is roughly a 138% move from here—definitely doable in crypto, but it requires sustained buying volume to break the current downtrend structure.
The Massive Catch: Fundamentals vs. Price
Here is where things get tricky. Arbitrum's underlying ecosystem is actually doing great. Thanks to massive adoption from platforms like the Robinhood Chain, their monthly network revenue skyrocketed 5x to $5 million.
But here is the problem: ARB is a governance token, not a utility token.
Even though the network is making millions, none of that money goes directly to token holders. There is no native staking yield or fee-sharing mechanism yet. Until the DAO changes the tokenomics to give ARB direct value capture, the price is purely driven by speculation and sentiment, not network revenue.
My Personal Verdict
This is completely different from the pump-and-dump tokens we usually see. This is a long-term infrastructure play. Standard Chartered is banking heavily on the idea that big institutions will build on Arbitrum's tech stack for real-world asset tokenization.
If you are buying ARB based on this $10 target, you have to be ready to play the long game. You are going to absorb constant supply dilution from team and investor token unlocks, and you are betting that the community eventually votes in a revenue-share model. It is a solid layer-2 project, but do not expect it to make you rich overnight.
2
16
19.8k
$CELR Trade Setup on 1 H candle
if close above 0.0042 LONG
TP 0.0045 and 0.0050
SL 0.0037
if 1 H close below 0.003097 Short
A sudden spike in selling volume that breaks the 0.0030 support.
{future}(CELRUSDT)
$CELR Trade Setup on 1 H candle
if close above 0.0042 LONG
TP 0.0045 and 0.0050
SL 0.0037
if 1 H close below 0.003097 Short
A sudden spike in selling volume that breaks the 0.0030 support.
if close above 0.0042 LONG
TP 0.0045 and 0.0050
SL 0.0037
if 1 H close below 0.003097 Short
A sudden spike in selling volume that breaks the 0.0030 support.
1
99
#Binance
AKEUSDT $AKE is looking like a textbook pump and dump trap right now. If you are a retail trader, you need to stay far away from this one and avoid throwing your hard-earned money into a sinking ship.
Here is exactly what the chart is revealing:
The Massive Wick: That giant, vertical red spike followed by a long upper tail is a massive warning sign. It shows that insiders and early buyers pumped the price up to 0.088500, immediately dumped their heavy bags on late buyers, and forced the price straight back down.
The Trapped Volume: Look at the massive 24-hour volume sitting at 15.09B AKE. A ton of liquidity moved through this token in a very short window, which is exactly how creators and whales exit their positions while leaving everyday traders holding the bag.
Artificial Hype: Seeing a token up +63.12% on the day looks enticing, but it is highly deceptive. The price action has already flattened out significantly after the crash, signaling that the initial artificial momentum is dying out.
When tokens move like this, retail traders almost always lose. The game is completely rigged by the people who control the supply. Do not let FOMO (fear of missing out) get the better of you protect your capital and look for projects with actual substance.
Guys don't greed its not a single pair for Trade on Binance😁
{future}(AKEUSDT)
{future}(ONEUSDT)
{future}(BANKUSDT)
#Binance
AKEUSDT $AKE is looking like a textbook pump and dump trap right now. If you are a retail trader, you need to stay far away from this one and avoid throwing your hard-earned money into a sinking ship.
Here is exactly what the chart is revealing:
The Massive Wick: That giant, vertical red spike followed by a long upper tail is a massive warning sign. It shows that insiders and early buyers pumped the price up to 0.088500, immediately dumped their heavy bags on late buyers, and forced the price straight back down.
The Trapped Volume: Look at the massive 24-hour volume sitting at 15.09B AKE. A ton of liquidity moved through this token in a very short window, which is exactly how creators and whales exit their positions while leaving everyday traders holding the bag.
Artificial Hype: Seeing a token up +63.12% on the day looks enticing, but it is highly deceptive. The price action has already flattened out significantly after the crash, signaling that the initial artificial momentum is dying out.
When tokens move like this, retail traders almost always lose. The game is completely rigged by the people who control the supply. Do not let FOMO (fear of missing out) get the better of you protect your capital and look for projects with actual substance.
Guys don't greed its not a single pair for Trade on Binance😁
AKEUSDT $AKE is looking like a textbook pump and dump trap right now. If you are a retail trader, you need to stay far away from this one and avoid throwing your hard-earned money into a sinking ship.
Here is exactly what the chart is revealing:
The Massive Wick: That giant, vertical red spike followed by a long upper tail is a massive warning sign. It shows that insiders and early buyers pumped the price up to 0.088500, immediately dumped their heavy bags on late buyers, and forced the price straight back down.
The Trapped Volume: Look at the massive 24-hour volume sitting at 15.09B AKE. A ton of liquidity moved through this token in a very short window, which is exactly how creators and whales exit their positions while leaving everyday traders holding the bag.
Artificial Hype: Seeing a token up +63.12% on the day looks enticing, but it is highly deceptive. The price action has already flattened out significantly after the crash, signaling that the initial artificial momentum is dying out.
When tokens move like this, retail traders almost always lose. The game is completely rigged by the people who control the supply. Do not let FOMO (fear of missing out) get the better of you protect your capital and look for projects with actual substance.
Guys don't greed its not a single pair for Trade on Binance😁
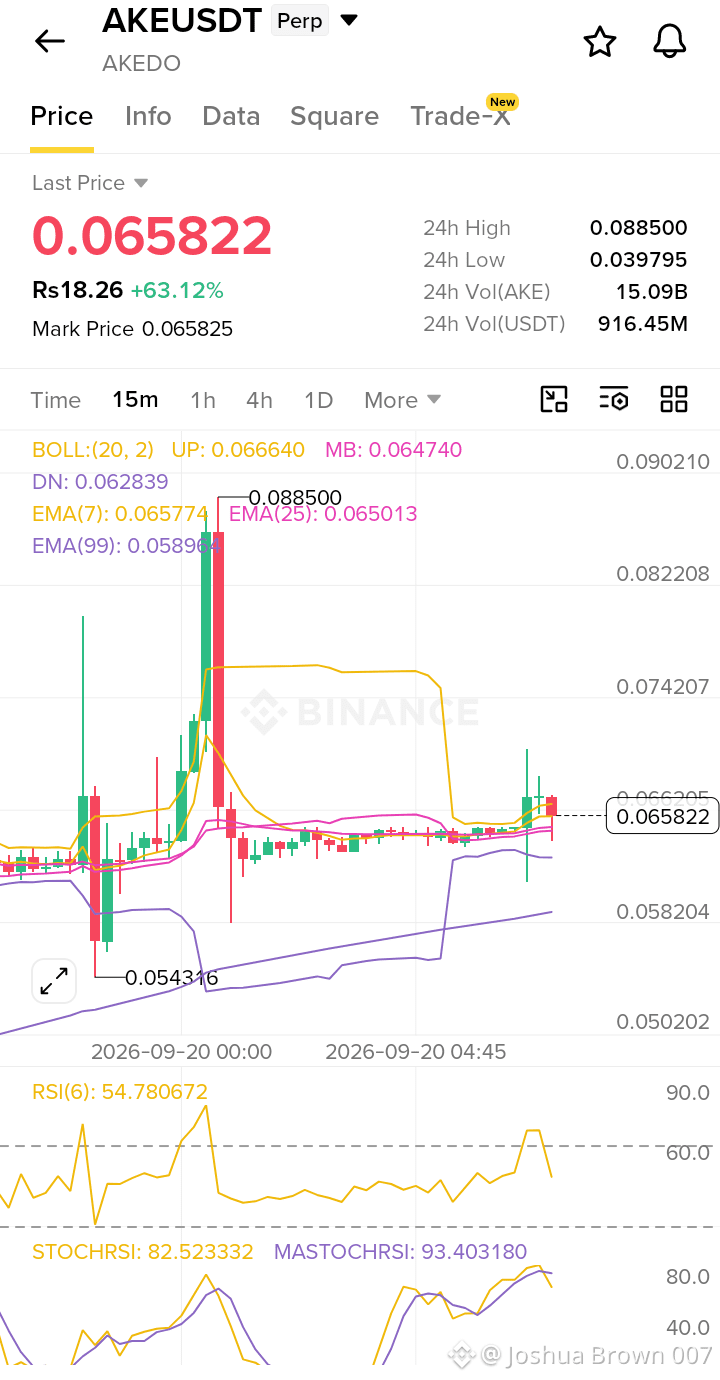
1
479
#AVAX Scalp long
Entry market
SL 9.64
TP 9.923
TP 10.01
Short Breakdown. If the price breaks below 9.70 with high volume, enter short on the retest of 9.70, targeting 9.40. SL at 9.85.
$AVAIL
{future}(AVAXUSDT)
#AVAX Scalp long
Entry market
SL 9.64
TP 9.923
TP 10.01
Short Breakdown. If the price breaks below 9.70 with high volume, enter short on the retest of 9.70, targeting 9.40. SL at 9.85.
$AVAIL
Entry market
SL 9.64
TP 9.923
TP 10.01
Short Breakdown. If the price breaks below 9.70 with high volume, enter short on the retest of 9.70, targeting 9.40. SL at 9.85.
$AVAIL
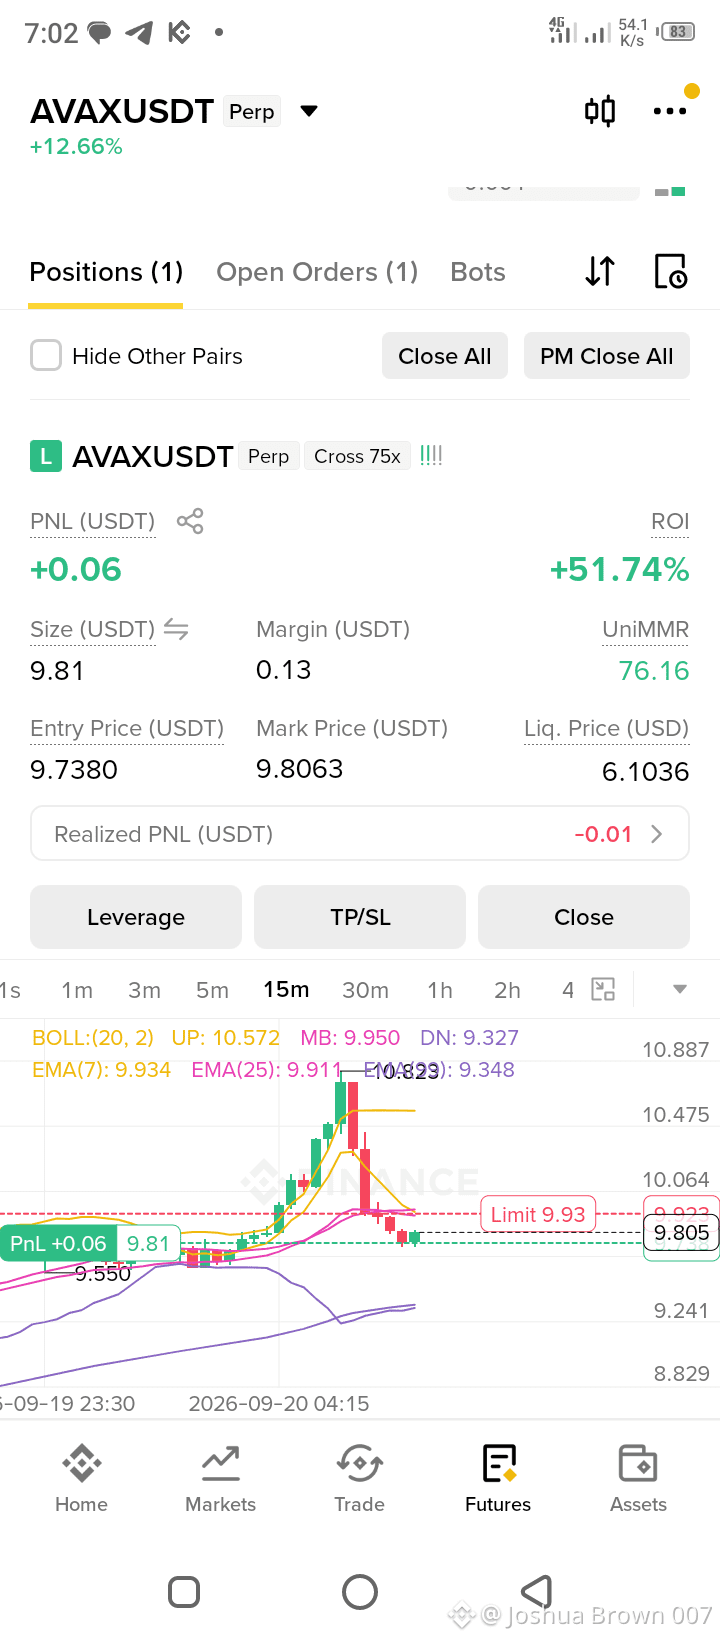
1
149
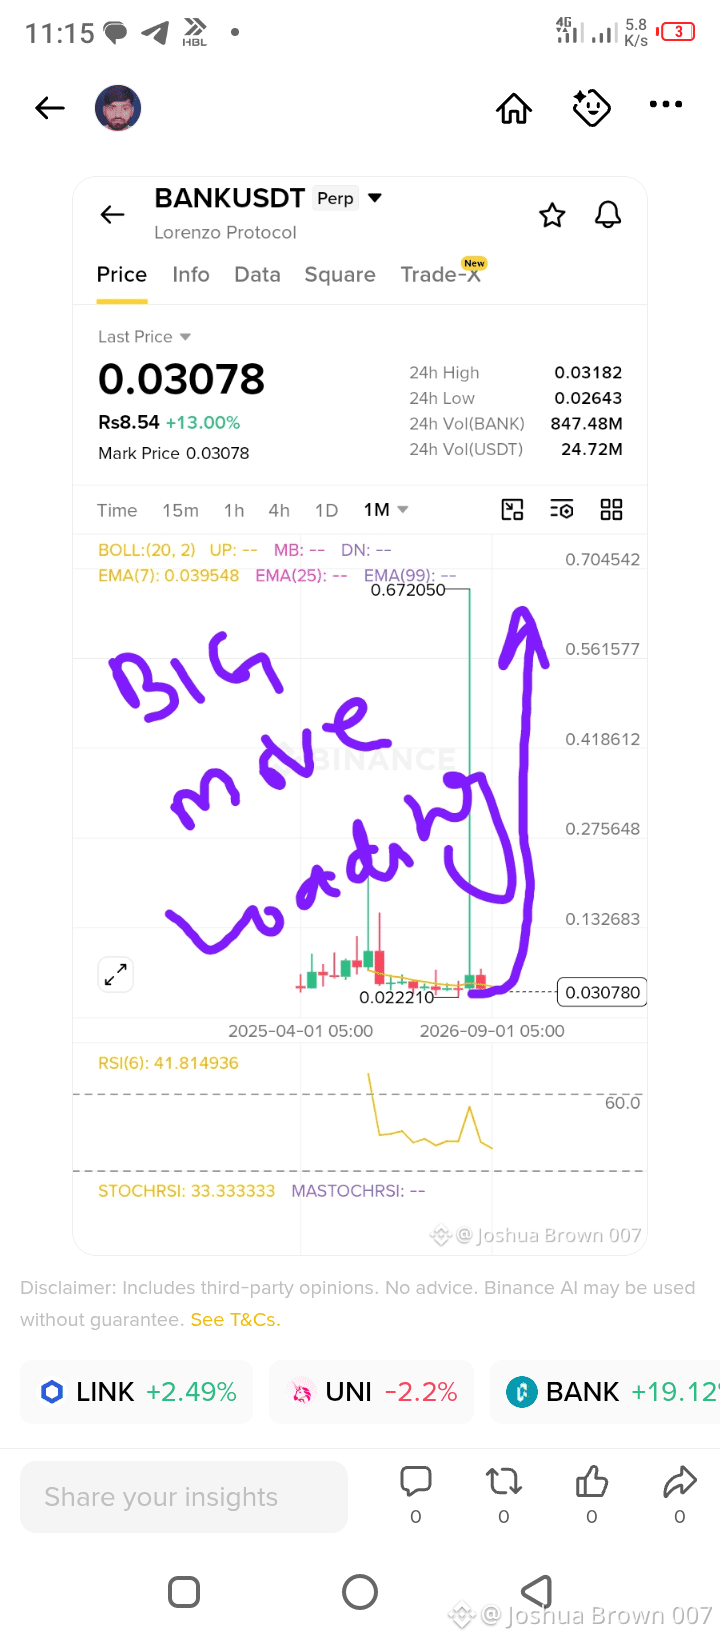
Log in to explore more content
Join global crypto users on Binance Square
⚡️ Get latest and useful information about crypto.
💬 Trusted by the world’s largest crypto exchange.
👍 Discover real insights from verified creators.
Email / Phone number
Trending Topics
BitcoinSpotETFsNetInflow$191M
1,264 views
92 Discussing
🚨 WALL STREET IS STILL BUYING BITCOIN.
U.S. spot Bitcoin ETFs pulled in another $191M in net inflows on Sept. 24, extending their positive streak to 6 straight trading sessions.
And the biggest buyer?
BlackRock’s IBIT — roughly $163M in a single day.
Fidelity’s FBTC added another $12.9M, while total net assets across U.S. spot Bitcoin ETFs climbed to about $108.9B.
The bigger picture is even more interesting:
Over the last 6 sessions, Bitcoin ETFs have absorbed more than $2.8 BILLION — even as BTC cooled after briefly trading above $87K.
That means institutional demand hasn’t disappeared with the pullback.
The pace has slowed from Monday’s massive ~$999M inflow, but money is still moving into Bitcoin instead of running for the exits.
Now the question is simple:
If ETF demand keeps absorbing supply while BTC consolidates… what happens when momentum returns? 👀
$BTC $ZEC $XAU
#BitcoinSpotETFsNetInflow$191M #CFTCUpdatesGuidanceOnTokenizedAssets #BitgetSays$352MAffectedInHack #BinanceWillListHyperliquid(HYPE) #FedProposesRulesForBankIssuedStablecoins
KimHotbae
·0 Likes
·26 views
CFTCUpdatesGuidanceOnTokenizedAssets
13,774 views
619 Discussing
BitgetSays$352MAffectedInHack
3,429 views
49 Discussing