

#zamasetup
zamasetup
824 views
10 Discussing
Hot
Latest

·
--
Bullish
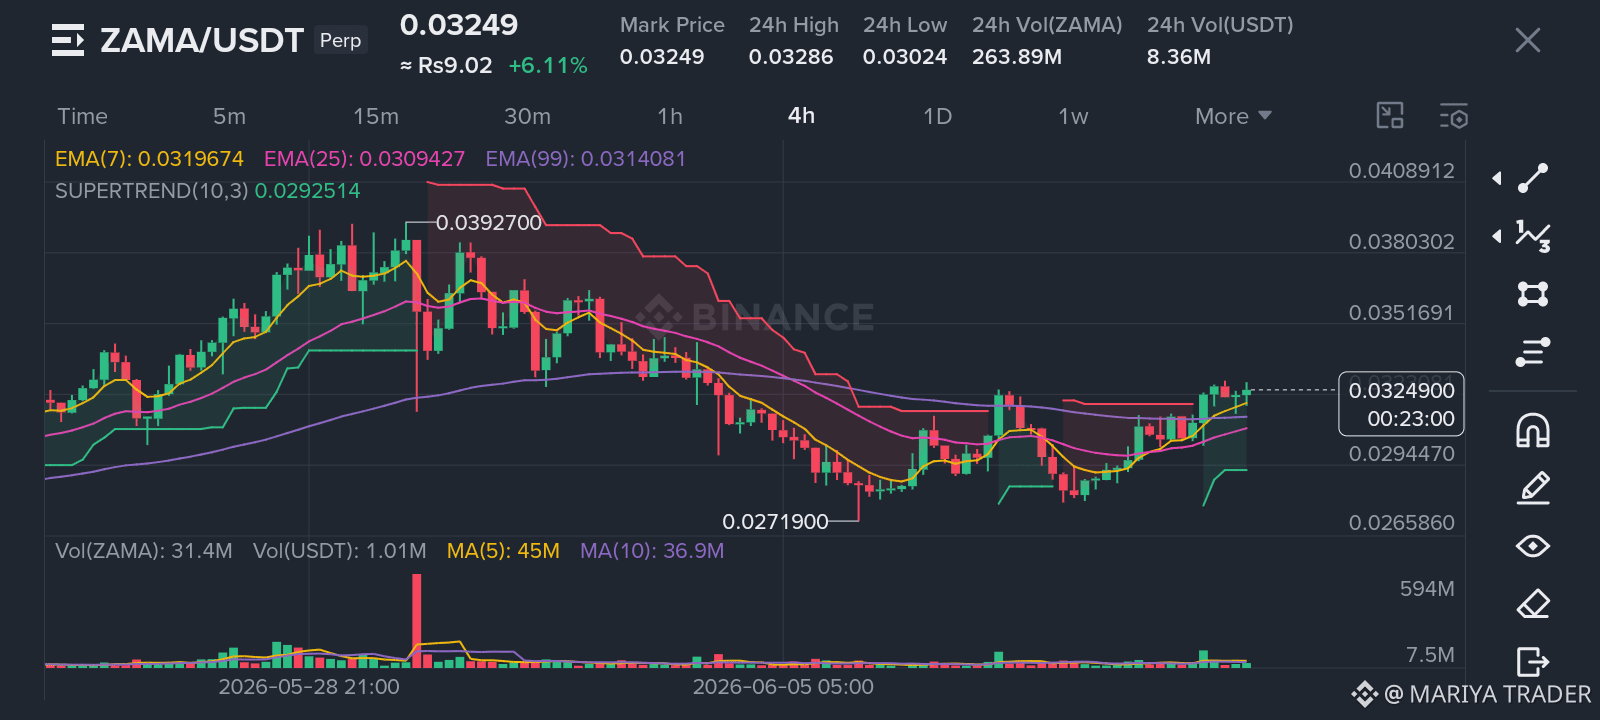
$ZAMA is building a solid bullish base after sweeping key liquidity. A minor dip to the 1H order block sets up a quick move higher.
Entry: 0.03120 - 0.03285
SL: 0.03050
TP: 0.03320 | 0.03420 | 0.03520
Trade $ZAMA here and show your support 👇👇
{future}(ZAMAUSDT)
#zaman #ZAMASetup
$ZAMA is building a solid bullish base after sweeping key liquidity. A minor dip to the 1H order block sets up a quick move higher.
Entry: 0.03120 - 0.03285
SL: 0.03050
TP: 0.03320 | 0.03420 | 0.03520
Trade $ZAMA here and show your support 👇👇
#zaman #ZAMASetup
Entry: 0.03120 - 0.03285
SL: 0.03050
TP: 0.03320 | 0.03420 | 0.03520
Trade $ZAMA here and show your support 👇👇
#zaman #ZAMASetup
88

·
--
Bullish
ZAMA/USDT Latest Update (16 June 2026)
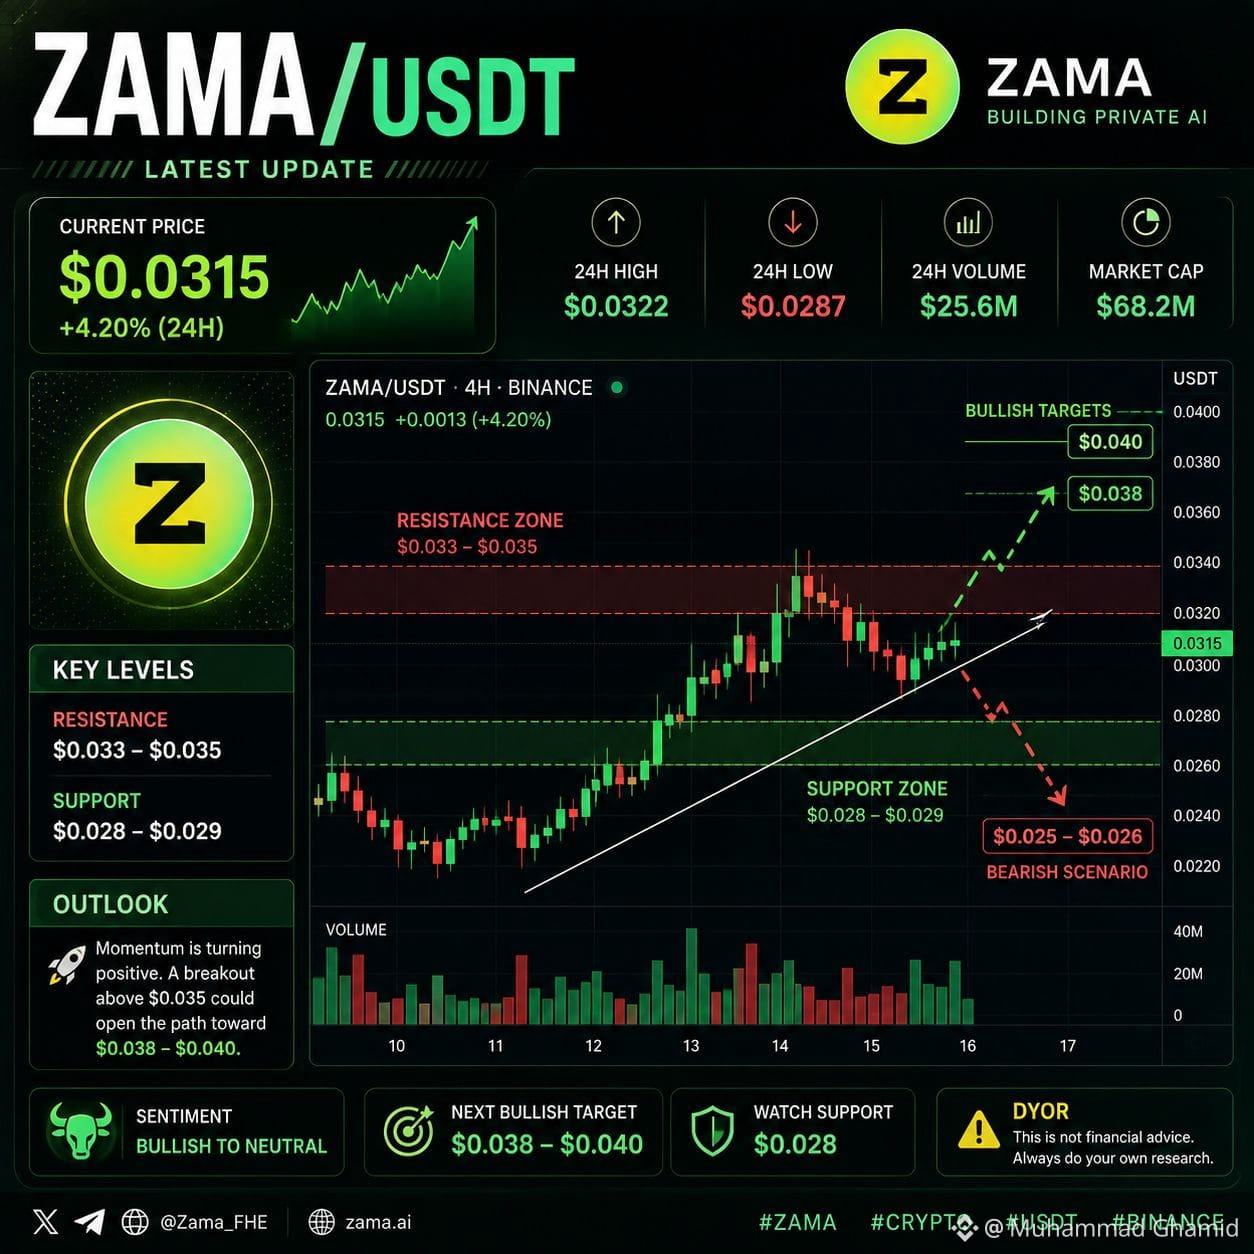
$ZAMA is trading around $0.032–$0.033 and has shown positive momentum over the past week, gaining roughly 14–17%. Trading volume has increased significantly, indicating renewed market interest in the project.
CoinGecko +1
Key Highlights:
$ZAMA remains one of the leading privacy-focused blockchain projects built around Fully Homomorphic Encryption (FHE) technology.
Bitget +1
Market capitalization is approximately $71 million, with daily trading volume near $13 million.
CoinGecko +1
Recent community sentiment is cautiously bullish due to ecosystem growth, developer incentives, and ongoing roadmap developments.
coinmarketcap.com
Major exchange support, including Binance spot and futures markets, continues to provide liquidity and visibility for the token.
binance.com +1
Technical Outlook
Immediate support: $0.030
Strong support: $0.027
Resistance: $0.035
Major breakout level: $0.040–$0.050
CoinGecko +2
Short-Term View If buyers maintain volume above the $0.030 area, ZAMA could attempt another move toward $0.035–$0.040. A break below support may trigger a pullback toward the $0.027 zone.
weex.com +1
Trend: 🟢 Moderately Bullish
Risk Level: 🔴 High Volatility (newly listed, low-cap crypto)
*This is market information only, not financial advice.*
#zamaprizepool #ZAMASHORT #ZAMASetup #zamarusdt
$ZAMA
ZAMA/USDT Latest Update (16 June 2026)
$ZAMA is trading around $0.032–$0.033 and has shown positive momentum over the past week, gaining roughly 14–17%. Trading volume has increased significantly, indicating renewed market interest in the project.
CoinGecko +1
Key Highlights:
$ZAMA remains one of the leading privacy-focused blockchain projects built around Fully Homomorphic Encryption (FHE) technology.
Bitget +1
Market capitalization is approximately $71 million, with daily trading volume near $13 million.
CoinGecko +1
Recent community sentiment is cautiously bullish due to ecosystem growth, developer incentives, and ongoing roadmap developments.
coinmarketcap.com
Major exchange support, including Binance spot and futures markets, continues to provide liquidity and visibility for the token.
binance.com +1
Technical Outlook
Immediate support: $0.030
Strong support: $0.027
Resistance: $0.035
Major breakout level: $0.040–$0.050
CoinGecko +2
Short-Term View If buyers maintain volume above the $0.030 area, ZAMA could attempt another move toward $0.035–$0.040. A break below support may trigger a pullback toward the $0.027 zone.
weex.com +1
Trend: 🟢 Moderately Bullish
Risk Level: 🔴 High Volatility (newly listed, low-cap crypto)
*This is market information only, not financial advice.*
#zamaprizepool #ZAMASHORT #ZAMASetup #zamarusdt
$ZAMA
$ZAMA is trading around $0.032–$0.033 and has shown positive momentum over the past week, gaining roughly 14–17%. Trading volume has increased significantly, indicating renewed market interest in the project.
CoinGecko +1
Key Highlights:
$ZAMA remains one of the leading privacy-focused blockchain projects built around Fully Homomorphic Encryption (FHE) technology.
Bitget +1
Market capitalization is approximately $71 million, with daily trading volume near $13 million.
CoinGecko +1
Recent community sentiment is cautiously bullish due to ecosystem growth, developer incentives, and ongoing roadmap developments.
coinmarketcap.com
Major exchange support, including Binance spot and futures markets, continues to provide liquidity and visibility for the token.
binance.com +1
Technical Outlook
Immediate support: $0.030
Strong support: $0.027
Resistance: $0.035
Major breakout level: $0.040–$0.050
CoinGecko +2
Short-Term View If buyers maintain volume above the $0.030 area, ZAMA could attempt another move toward $0.035–$0.040. A break below support may trigger a pullback toward the $0.027 zone.
weex.com +1
Trend: 🟢 Moderately Bullish
Risk Level: 🔴 High Volatility (newly listed, low-cap crypto)
*This is market information only, not financial advice.*
#zamaprizepool #ZAMASHORT #ZAMASetup #zamarusdt
$ZAMA
146

·
--
$ZAMA
🔐 ZAMA/USDT: Strong Support Tech, Chart is Coiling for a Breakout
$ZAMA has surged +22.45% over the past week not just due to MM waves pushing it but also thanks to a robust internal foundation: This project is a pioneer in FHE technology (Fully Homomorphic Encryption), ensuring absolute data security for DeFi/RWA and backed by major funds (Multicoin, Pantera).
🔍 In-depth Price Action Analysis (1H Frame)
✅ Absorbing Selling Pressure Effectively: After hitting a peak of 0.03338 USDT, the price retraced to 0.029x USDT with decreasing Volume. This shows there's no panic selling; the buyers are actively supporting the price and accumulating the inventory of profit-takers.
✅ Price Coiling Structure: Currently, the price is holding steady at 0.03190 USDT, with narrowing candlestick ranges creating a classic bullish pennant pattern.
✅ MACD Indicator: The signal line has pulled close to the zero axis, and the negative Histogram is drying up. This is a dynamic equilibrium state – a classic sign of waning selling pressure, just waiting for a spark (capital inflow) to trigger a Volume explosion (Breakout).
#l✅ 🔮 Scenario & Trading Strategy
Accumulation Zone (Support): 0.02950 – 0.03050 USDT. The short-term bullish structure remains intact as long as this zone holds.
Trigger Point: Wait for a decisive close on the 1H candle above the 0.03250 USDT mark with high Volume (exceeding the 10M ZAMA average).
✅ Targets: Previous resistance at 0.03338 USDT and further up to the area of 0.03650 – 0.03800 USDT
> 💡 Quick Assessment: ZAMA is in a "bowstring tension" position. The accumulation chart looks solid and is underpinned by technology. Those already in a position should hold, and newcomers can either spread their capital around the support or wait for a confirmed breakout for a safer entry.
#CreatorpadVN #ZAMASetup $ZAMA
{future}(ZAMAUSDT)
$ZAMA
🔐 ZAMA/USDT: Strong Support Tech, Chart is Coiling for a Breakout
$ZAMA has surged +22.45% over the past week not just due to MM waves pushing it but also thanks to a robust internal foundation: This project is a pioneer in FHE technology (Fully Homomorphic Encryption), ensuring absolute data security for DeFi/RWA and backed by major funds (Multicoin, Pantera).
🔍 In-depth Price Action Analysis (1H Frame)
✅ Absorbing Selling Pressure Effectively: After hitting a peak of 0.03338 USDT, the price retraced to 0.029x USDT with decreasing Volume. This shows there's no panic selling; the buyers are actively supporting the price and accumulating the inventory of profit-takers.
✅ Price Coiling Structure: Currently, the price is holding steady at 0.03190 USDT, with narrowing candlestick ranges creating a classic bullish pennant pattern.
✅ MACD Indicator: The signal line has pulled close to the zero axis, and the negative Histogram is drying up. This is a dynamic equilibrium state – a classic sign of waning selling pressure, just waiting for a spark (capital inflow) to trigger a Volume explosion (Breakout).
#l✅ 🔮 Scenario & Trading Strategy
Accumulation Zone (Support): 0.02950 – 0.03050 USDT. The short-term bullish structure remains intact as long as this zone holds.
Trigger Point: Wait for a decisive close on the 1H candle above the 0.03250 USDT mark with high Volume (exceeding the 10M ZAMA average).
✅ Targets: Previous resistance at 0.03338 USDT and further up to the area of 0.03650 – 0.03800 USDT
> 💡 Quick Assessment: ZAMA is in a "bowstring tension" position. The accumulation chart looks solid and is underpinned by technology. Those already in a position should hold, and newcomers can either spread their capital around the support or wait for a confirmed breakout for a safer entry.
#CreatorpadVN #ZAMASetup $ZAMA
🔐 ZAMA/USDT: Strong Support Tech, Chart is Coiling for a Breakout
$ZAMA has surged +22.45% over the past week not just due to MM waves pushing it but also thanks to a robust internal foundation: This project is a pioneer in FHE technology (Fully Homomorphic Encryption), ensuring absolute data security for DeFi/RWA and backed by major funds (Multicoin, Pantera).
🔍 In-depth Price Action Analysis (1H Frame)
✅ Absorbing Selling Pressure Effectively: After hitting a peak of 0.03338 USDT, the price retraced to 0.029x USDT with decreasing Volume. This shows there's no panic selling; the buyers are actively supporting the price and accumulating the inventory of profit-takers.
✅ Price Coiling Structure: Currently, the price is holding steady at 0.03190 USDT, with narrowing candlestick ranges creating a classic bullish pennant pattern.
✅ MACD Indicator: The signal line has pulled close to the zero axis, and the negative Histogram is drying up. This is a dynamic equilibrium state – a classic sign of waning selling pressure, just waiting for a spark (capital inflow) to trigger a Volume explosion (Breakout).
#l✅ 🔮 Scenario & Trading Strategy
Accumulation Zone (Support): 0.02950 – 0.03050 USDT. The short-term bullish structure remains intact as long as this zone holds.
Trigger Point: Wait for a decisive close on the 1H candle above the 0.03250 USDT mark with high Volume (exceeding the 10M ZAMA average).
✅ Targets: Previous resistance at 0.03338 USDT and further up to the area of 0.03650 – 0.03800 USDT
> 💡 Quick Assessment: ZAMA is in a "bowstring tension" position. The accumulation chart looks solid and is underpinned by technology. Those already in a position should hold, and newcomers can either spread their capital around the support or wait for a confirmed breakout for a safer entry.
#CreatorpadVN #ZAMASetup $ZAMA
2
152

·
--
$ZAMA
{future}(ZAMAUSDT)
🔻 Short Setup
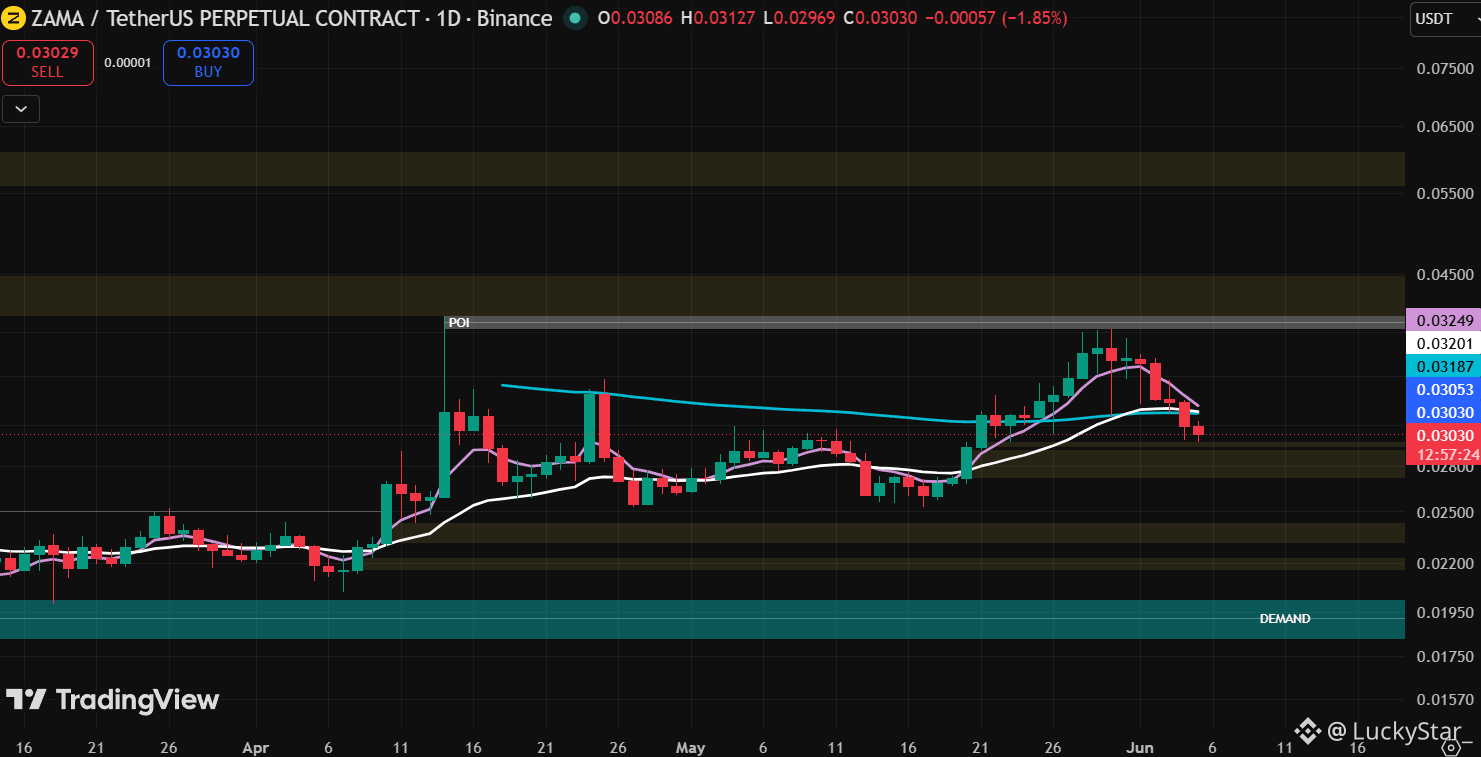
Entry: On breakdown below 0.0295 USDT with strong volume.
Target: 0.027–0.025 USDT, next demand zone.
Stop: Above 0.031 USDT.
🟩 Long Setup
Entry: After confirmation of a breakout above 0.0315 USDT with volume support.
Target: 0.034–0.045 USDT, upper supply zone.
Stop: Below 0.029 USDT.
#Zama #ZAMASetup #TradingTales
$ZAMA
🔻 Short Setup
Entry: On breakdown below 0.0295 USDT with strong volume.
Target: 0.027–0.025 USDT, next demand zone.
Stop: Above 0.031 USDT.
🟩 Long Setup
Entry: After confirmation of a breakout above 0.0315 USDT with volume support.
Target: 0.034–0.045 USDT, upper supply zone.
Stop: Below 0.029 USDT.
#Zama #ZAMASetup #TradingTales
🔻 Short Setup
Entry: On breakdown below 0.0295 USDT with strong volume.
Target: 0.027–0.025 USDT, next demand zone.
Stop: Above 0.031 USDT.
🟩 Long Setup
Entry: After confirmation of a breakout above 0.0315 USDT with volume support.
Target: 0.034–0.045 USDT, upper supply zone.
Stop: Below 0.029 USDT.
#Zama #ZAMASetup #TradingTales
164

·
--
Bullish
🔥 $ZAMA / USDT: Institutional 1H Overhead Breakout & Dynamic Reclaim Phase
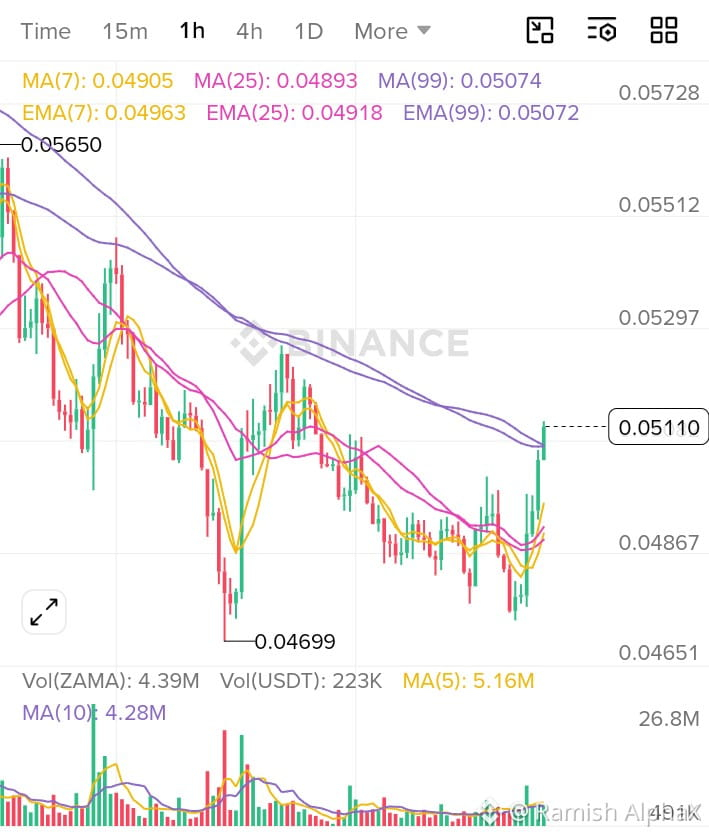
The 1-Hour (1H) chart for $ZAMA /USDT reveals an impulsive bullish breakout candle reclaiming the $0.05070 resistance cluster following a temporary capitulation drop to $0.04699. Price is currently trading at $0.05110, breaking cleanly above both fast and long-term dynamic moving averages.
📊 Market Bias: Bullish (Dynamic Resistance Reclaim & Market Structure Shift)
Trend Analysis: ZAMA has executed a bullish trend reversal on the 1H timeframe. Price has surged above all moving average hurdles—1H MA(7) ($0.04905), EMA(7) ($0.04963), MA(25) ($0.04893), EMA(25) ($0.04918), MA(99) ($0.05074), and EMA(99) ($0.05072)—converting former overhead dynamic resistance into a rising structural floor.
🎯 Trade Setup: LONG (On Retest / Imbalance Mitigation)
Action: LONG on a controlled retest into the reclaimed moving average baseline and internal Fair Value Gap.
Entry Zone: $0.04950 – $0.05070 (Confluence with 1H MA(99)/EMA(99) reclaim floor and top of FVG)
Stop Loss (SL): $0.04820 (Safely below the 1H MA(25) structural support zone)
Take Profit 1 (TP1): $0.05297 (Immediate Local High / Structural Resistance Target)
Take Profit 2 (TP2): $0.05512 (Mid-Term Liquidity Extension Target)
Take Profit 3 (TP3): $0.05650 (Macro Swing High / BSL Sweep Target)
Risk:Reward (R:R): ~1:2.4 (to TP2)
Trade Invalidation: A sustained 1H candle close below $0.04820 invalidates the immediate bullish breakout thesis.
#Zama #zamancrypto #ZAMASHORT #ZAMASignals #ZAMASetup
{future}(ZAMAUSDT)
🔥 $ZAMA / USDT: Institutional 1H Overhead Breakout & Dynamic Reclaim Phase
The 1-Hour (1H) chart for $ZAMA /USDT reveals an impulsive bullish breakout candle reclaiming the $0.05070 resistance cluster following a temporary capitulation drop to $0.04699. Price is currently trading at $0.05110, breaking cleanly above both fast and long-term dynamic moving averages.
📊 Market Bias: Bullish (Dynamic Resistance Reclaim & Market Structure Shift)
Trend Analysis: ZAMA has executed a bullish trend reversal on the 1H timeframe. Price has surged above all moving average hurdles—1H MA(7) ($0.04905), EMA(7) ($0.04963), MA(25) ($0.04893), EMA(25) ($0.04918), MA(99) ($0.05074), and EMA(99) ($0.05072)—converting former overhead dynamic resistance into a rising structural floor.
🎯 Trade Setup: LONG (On Retest / Imbalance Mitigation)
Action: LONG on a controlled retest into the reclaimed moving average baseline and internal Fair Value Gap.
Entry Zone: $0.04950 – $0.05070 (Confluence with 1H MA(99)/EMA(99) reclaim floor and top of FVG)
Stop Loss (SL): $0.04820 (Safely below the 1H MA(25) structural support zone)
Take Profit 1 (TP1): $0.05297 (Immediate Local High / Structural Resistance Target)
Take Profit 2 (TP2): $0.05512 (Mid-Term Liquidity Extension Target)
Take Profit 3 (TP3): $0.05650 (Macro Swing High / BSL Sweep Target)
Risk:Reward (R:R): ~1:2.4 (to TP2)
Trade Invalidation: A sustained 1H candle close below $0.04820 invalidates the immediate bullish breakout thesis.
#Zama #zamancrypto #ZAMASHORT #ZAMASignals #ZAMASetup
The 1-Hour (1H) chart for $ZAMA /USDT reveals an impulsive bullish breakout candle reclaiming the $0.05070 resistance cluster following a temporary capitulation drop to $0.04699. Price is currently trading at $0.05110, breaking cleanly above both fast and long-term dynamic moving averages.
📊 Market Bias: Bullish (Dynamic Resistance Reclaim & Market Structure Shift)
Trend Analysis: ZAMA has executed a bullish trend reversal on the 1H timeframe. Price has surged above all moving average hurdles—1H MA(7) ($0.04905), EMA(7) ($0.04963), MA(25) ($0.04893), EMA(25) ($0.04918), MA(99) ($0.05074), and EMA(99) ($0.05072)—converting former overhead dynamic resistance into a rising structural floor.
🎯 Trade Setup: LONG (On Retest / Imbalance Mitigation)
Action: LONG on a controlled retest into the reclaimed moving average baseline and internal Fair Value Gap.
Entry Zone: $0.04950 – $0.05070 (Confluence with 1H MA(99)/EMA(99) reclaim floor and top of FVG)
Stop Loss (SL): $0.04820 (Safely below the 1H MA(25) structural support zone)
Take Profit 1 (TP1): $0.05297 (Immediate Local High / Structural Resistance Target)
Take Profit 2 (TP2): $0.05512 (Mid-Term Liquidity Extension Target)
Take Profit 3 (TP3): $0.05650 (Macro Swing High / BSL Sweep Target)
Risk:Reward (R:R): ~1:2.4 (to TP2)
Trade Invalidation: A sustained 1H candle close below $0.04820 invalidates the immediate bullish breakout thesis.
#Zama #zamancrypto #ZAMASHORT #ZAMASignals #ZAMASetup
59

·
--
$ZAMA I asked for this crypto and now it's a reality, Really consistent and stable.
#ZAMASetup #zamarusdt
$ZAMA I asked for this crypto and now it's a reality, Really consistent and stable.
#ZAMASetup #zamarusdt
#ZAMASetup #zamarusdt
335

$ZAMA : Privacy Could Be the Next Big Narrative 🔐
ZAMA is one project I’m keeping on my radar.
The interesting part isn’t just the token — it’s the focus on confidential blockchain transactions and making on-chain activity more private without losing the benefits of blockchain technology.
If privacy becomes a bigger priority for DeFi, payments, and Web3 applications, projects working on confidential computing could get serious attention.
That doesn’t mean ZAMA is guaranteed to pump. Crypto is still high-risk, and adoption, tokenomics, liquidity, and overall market conditions will matter a lot.
For me, this is more of a watchlist project than a blind buy. 👀
Would you hold ZAMA for the long term, or trade the volatility?
#ZAMASetup #ZAMASignals #Crypto #web3空投 #defi #Privacy #altcoins
{future}(ZAMAUSDT)
$ZAMA : Privacy Could Be the Next Big Narrative 🔐
ZAMA is one project I’m keeping on my radar.
The interesting part isn’t just the token — it’s the focus on confidential blockchain transactions and making on-chain activity more private without losing the benefits of blockchain technology.
If privacy becomes a bigger priority for DeFi, payments, and Web3 applications, projects working on confidential computing could get serious attention.
That doesn’t mean ZAMA is guaranteed to pump. Crypto is still high-risk, and adoption, tokenomics, liquidity, and overall market conditions will matter a lot.
For me, this is more of a watchlist project than a blind buy. 👀
Would you hold ZAMA for the long term, or trade the volatility?
#ZAMASetup #ZAMASignals #Crypto #web3空投 #defi #Privacy #altcoins
ZAMA is one project I’m keeping on my radar.
The interesting part isn’t just the token — it’s the focus on confidential blockchain transactions and making on-chain activity more private without losing the benefits of blockchain technology.
If privacy becomes a bigger priority for DeFi, payments, and Web3 applications, projects working on confidential computing could get serious attention.
That doesn’t mean ZAMA is guaranteed to pump. Crypto is still high-risk, and adoption, tokenomics, liquidity, and overall market conditions will matter a lot.
For me, this is more of a watchlist project than a blind buy. 👀
Would you hold ZAMA for the long term, or trade the volatility?
#ZAMASetup #ZAMASignals #Crypto #web3空投 #defi #Privacy #altcoins
2
170
Log in to explore more content
Join global crypto users on Binance Square
⚡️ Get latest and useful information about crypto.
💬 Trusted by the world’s largest crypto exchange.
👍 Discover real insights from verified creators.
Email / Phone number
Trending Topics
1
#BNBSurpasses$790
10,124 views
83 Discussing
2
#ZamaRises15.99%ToIntradayHigh$0.09
4,512 views
71 Discussing
3
#BitcoinSpotETFsDraw$6.34BInflowsInQ3
3,534 views
57 Discussing
4
#EthereumValidatorExitQueueJumps392%
53,494 views
667 Discussing
5
#IMFApprovesElSalvador$138MWithBitcoinWaiver
7,065 views
40 Discussing
6
#SECHaltsCryptoETFReviewsAmidFundingLapse
205,322 views
1,566 Discussing
7
#ZcashETFPostsFirstWeeklyOutflow$93.6M
88,053 views
244 Discussing
8
#GreekPoliceBustCryptoScamRingArrest17
333,955 views
2,240 Discussing
9
#BitcoinRejectedAt$87K
204,636 views
304 Discussing
10
#FedOctoberRateHikeOddsFallTo17%
331,947 views
2,361 Discussing