
#virtual
virtual
5.2M views
11,261 Discussing
Hot
Latest

·
--
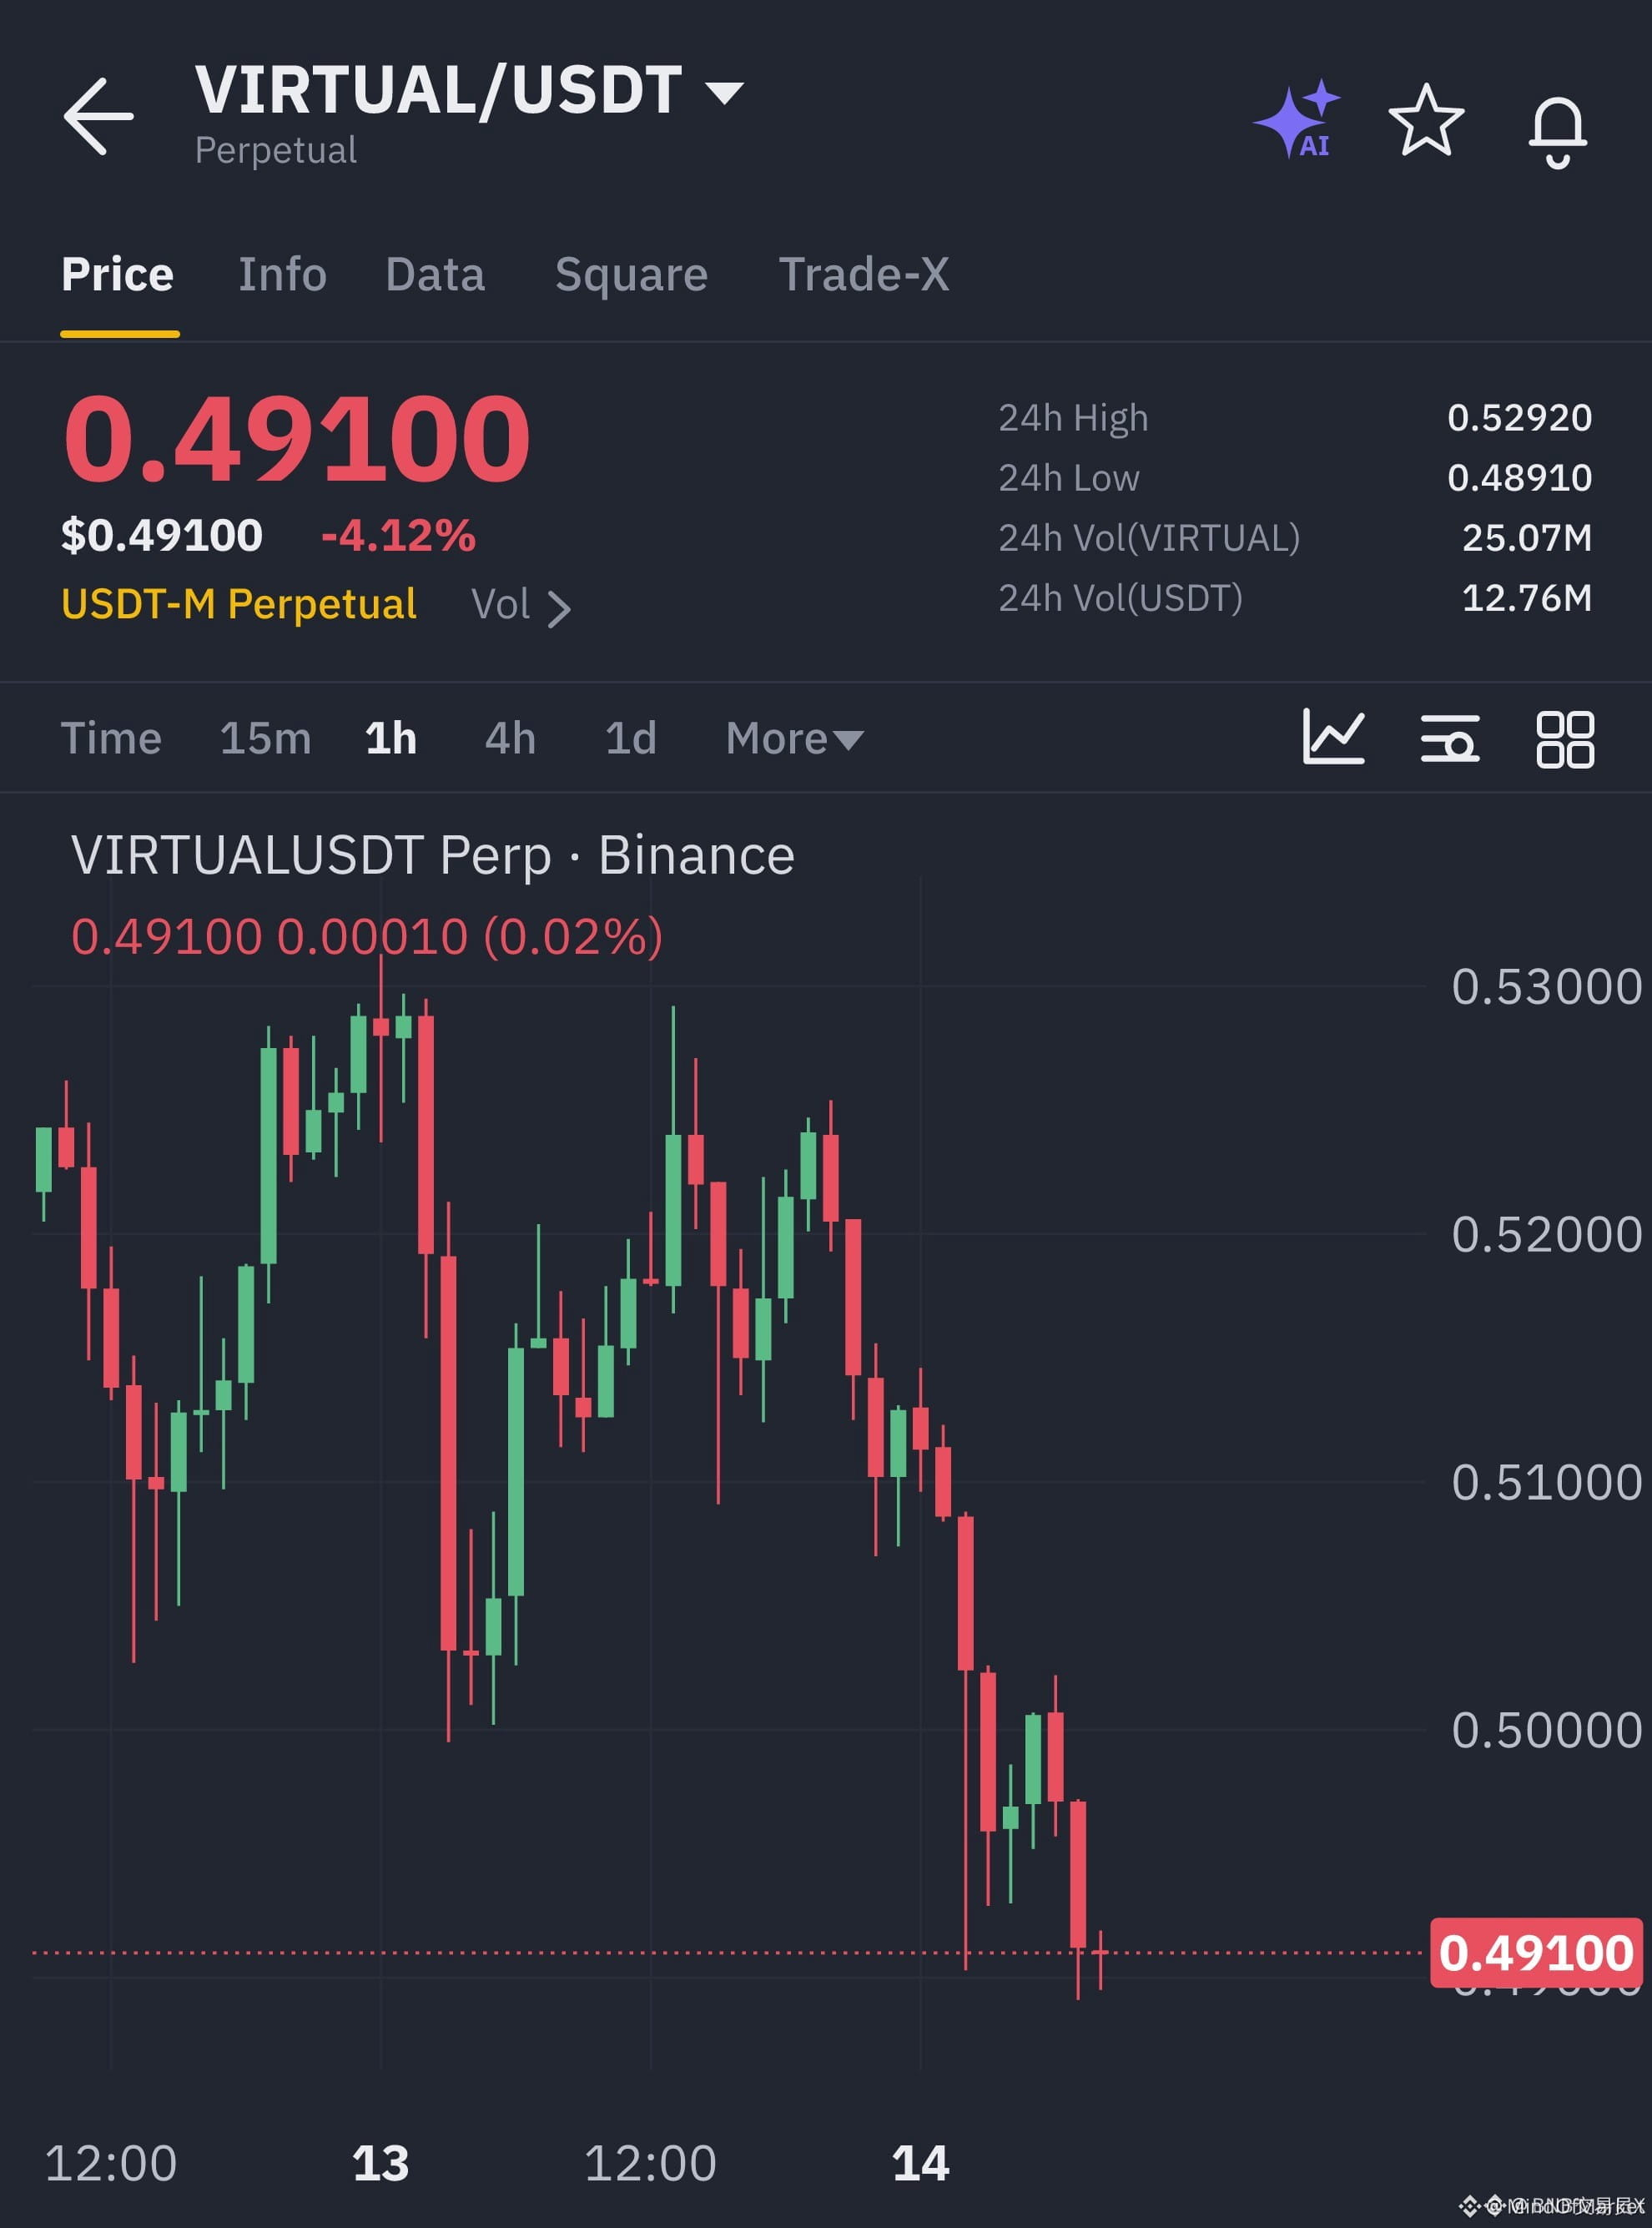
🔴 $VIRTUAL FAILING TO DEFEND RANGE HIGHS AS SMART MONEY DISTRIBUTES! 📉
Entry: 0.489145–0.492655 ⚡
Target: 0.465623 🎯
Stop Loss: 0.504943 🛑
Price action on $VIRTUAL continues to reject cleanly below the 0.529200 supply zone, confirming aggressive institutional distribution. 📊 Momentum indicators on the lower timeframes rollover as liquidity thins out above current bids. 🔍
With $INJ and $TRX showing relative weakness, capital is rotating away from heavy order blocks into cleaner structures. ⚡ Are you fading this bounce or waiting for a breakdown confirmation? 👇
⚠️ Not financial advice. Always manage your risk. 🛡️
🏷️ #VIRTUAL #ShortSetup #SmartMoney #Crypto #INJ
🦈 📉
🔴 $VIRTUAL FAILING TO DEFEND RANGE HIGHS AS SMART MONEY DISTRIBUTES! 📉
Entry: 0.489145–0.492655 ⚡
Target: 0.465623 🎯
Stop Loss: 0.504943 🛑
Price action on $VIRTUAL continues to reject cleanly below the 0.529200 supply zone, confirming aggressive institutional distribution. 📊 Momentum indicators on the lower timeframes rollover as liquidity thins out above current bids. 🔍
With $INJ and $TRX showing relative weakness, capital is rotating away from heavy order blocks into cleaner structures. ⚡ Are you fading this bounce or waiting for a breakdown confirmation? 👇
⚠️ Not financial advice. Always manage your risk. 🛡️
🏷️ #VIRTUAL #ShortSetup #SmartMoney #Crypto #INJ
🦈 📉
Entry: 0.489145–0.492655 ⚡
Target: 0.465623 🎯
Stop Loss: 0.504943 🛑
Price action on $VIRTUAL continues to reject cleanly below the 0.529200 supply zone, confirming aggressive institutional distribution. 📊 Momentum indicators on the lower timeframes rollover as liquidity thins out above current bids. 🔍
With $INJ and $TRX showing relative weakness, capital is rotating away from heavy order blocks into cleaner structures. ⚡ Are you fading this bounce or waiting for a breakdown confirmation? 👇
⚠️ Not financial advice. Always manage your risk. 🛡️
🏷️ #VIRTUAL #ShortSetup #SmartMoney #Crypto #INJ
🦈 📉
11

·
--
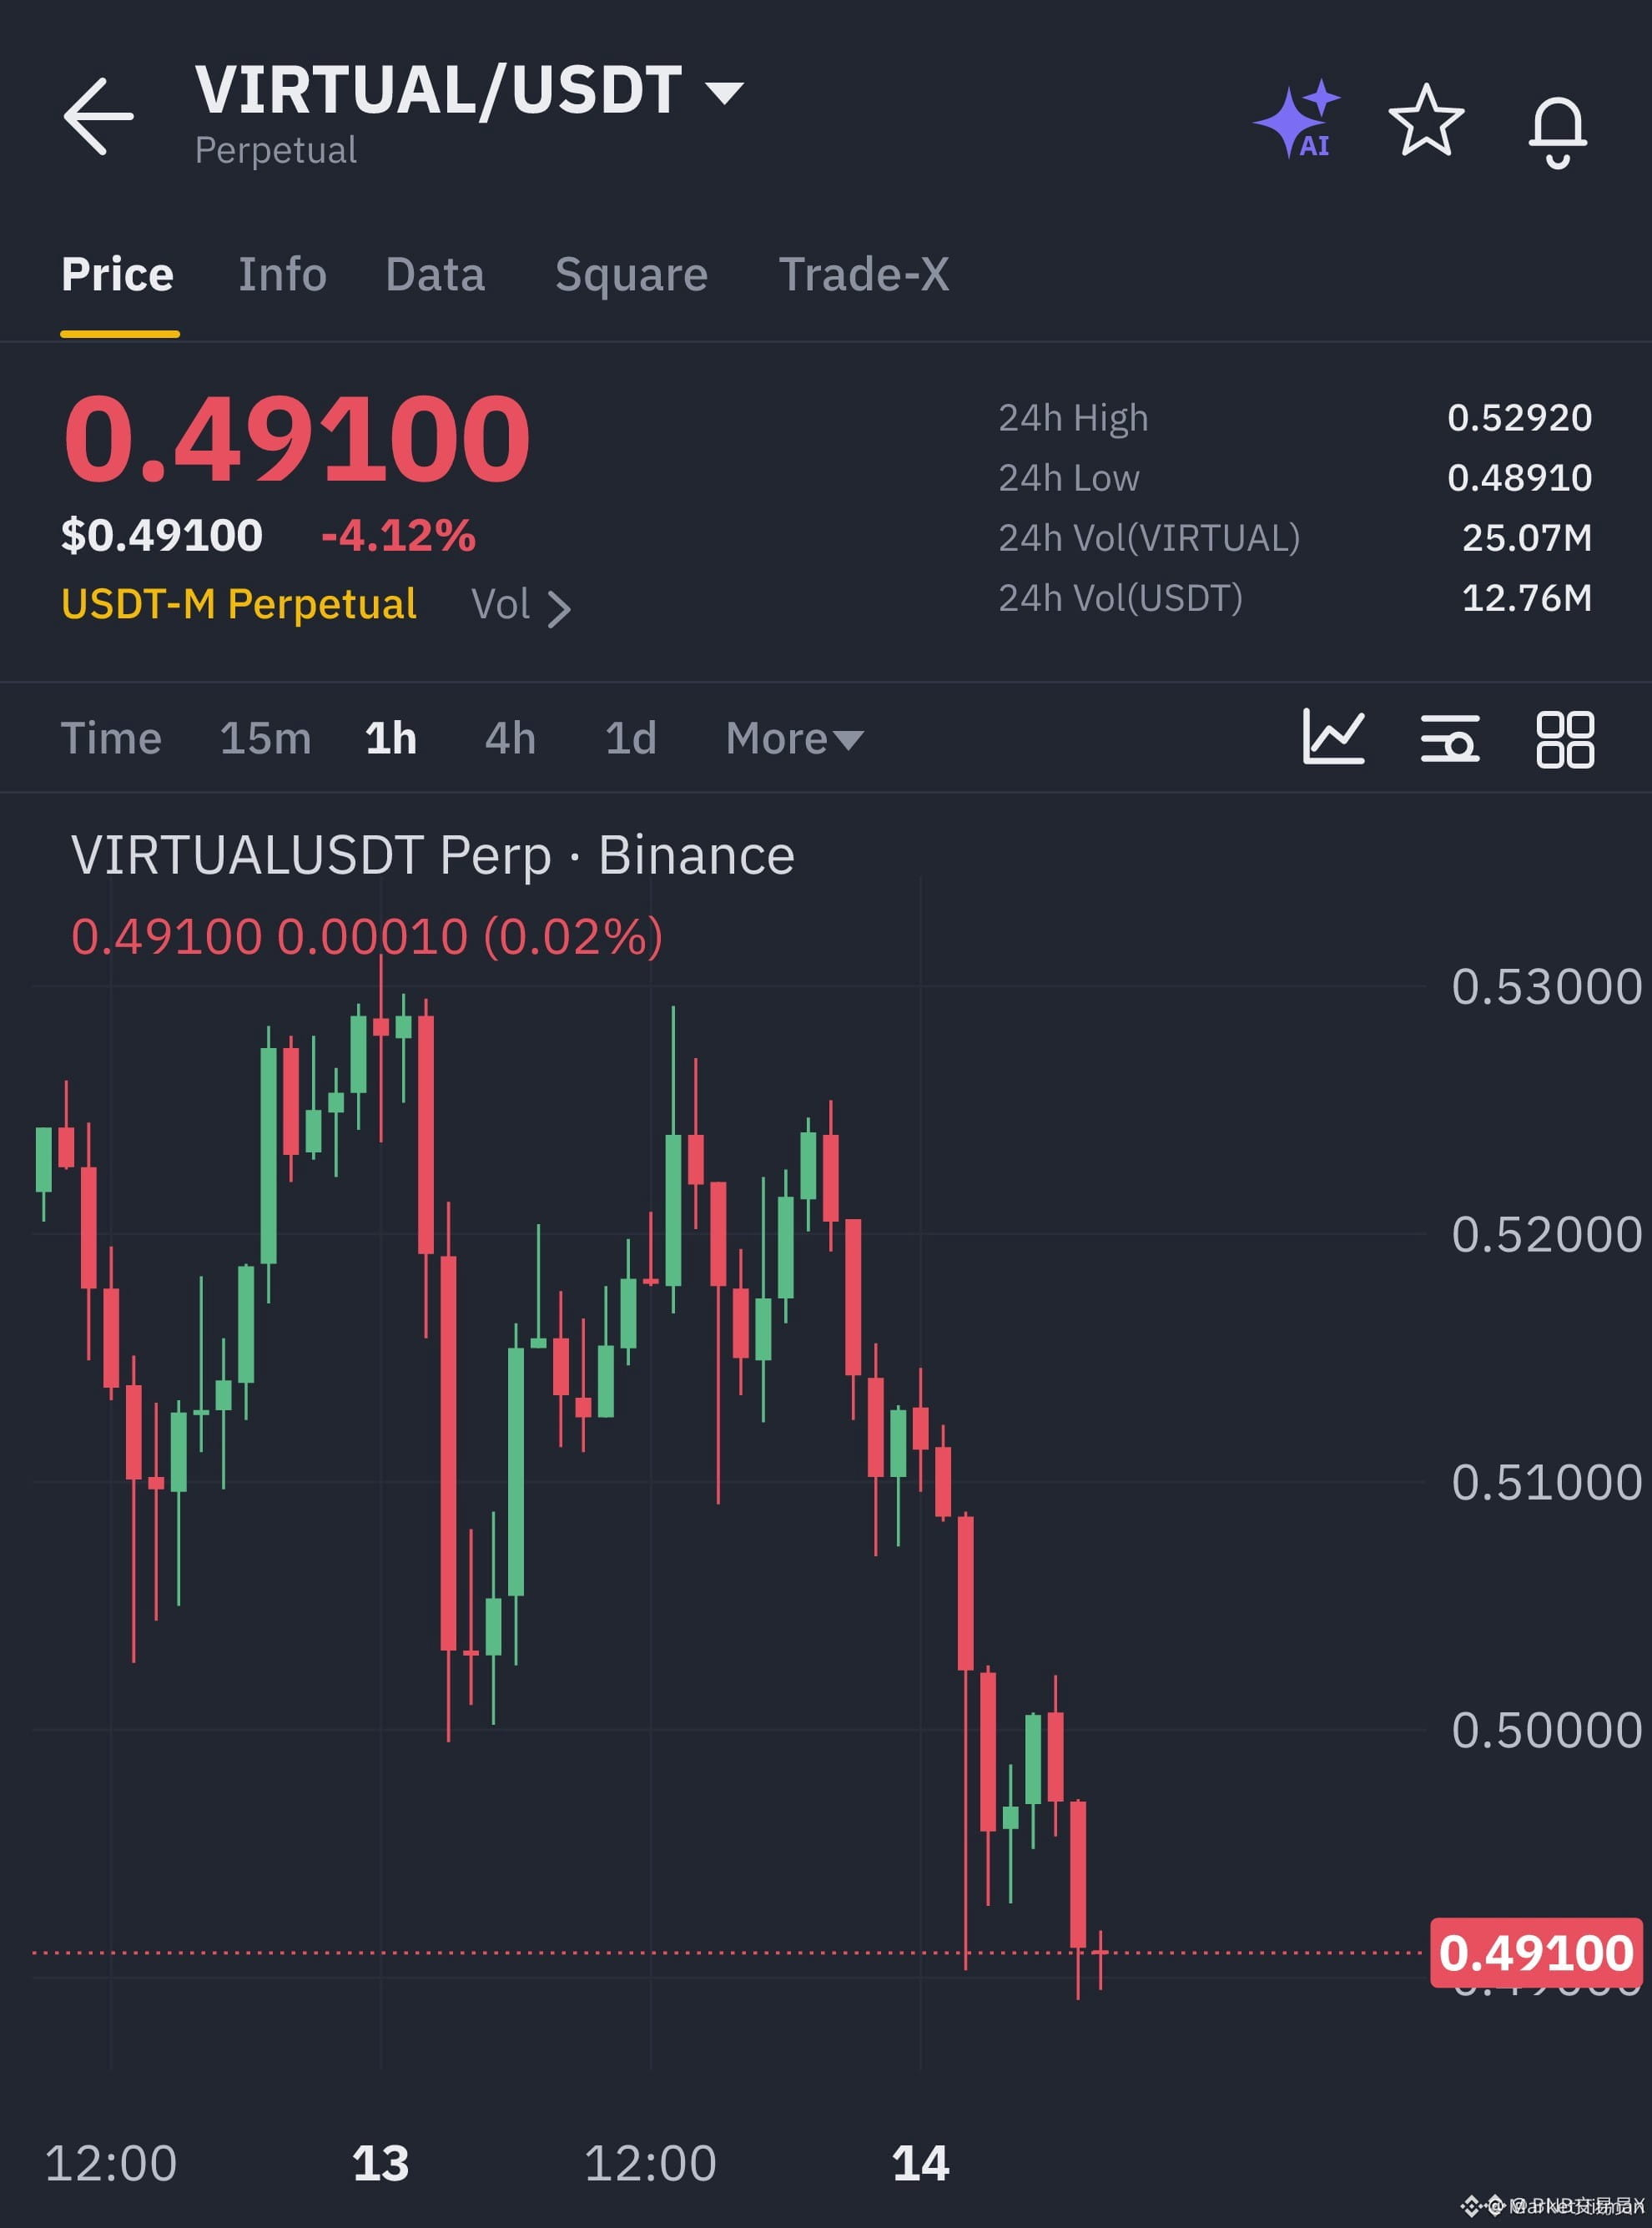
🔴 $VIRTUAL LOSING STEAM AS SELLERS CAP THE RALLY AND PRESS THE BID DOWN 📉
Entry: 0.489145 ⚡
Target: 0.465623 🚀
Stop Loss: 0.504943 ⚠️
Momentum is clearly rotating downward as buyers fail to defend key overhead resistance. Price action remains suffocated below 0.529200, signaling heavy distribution from institutional desks testing lower liquidity pools. 📊
Volume profiles show fading enthusiasm on every minor bounce attempt, leaving the door wide open for a deeper correction toward our downside targets. ⚡ Are you fading this weak bounce or waiting for a clean break below support before entry? 👇
⚠️ Not financial advice. Always manage your risk. 🛡️
🏷️ #VIRTUAL #ShortSetup #Crypto #Trading
📉 🦈
🔴 $VIRTUAL LOSING STEAM AS SELLERS CAP THE RALLY AND PRESS THE BID DOWN 📉
Entry: 0.489145 ⚡
Target: 0.465623 🚀
Stop Loss: 0.504943 ⚠️
Momentum is clearly rotating downward as buyers fail to defend key overhead resistance. Price action remains suffocated below 0.529200, signaling heavy distribution from institutional desks testing lower liquidity pools. 📊
Volume profiles show fading enthusiasm on every minor bounce attempt, leaving the door wide open for a deeper correction toward our downside targets. ⚡ Are you fading this weak bounce or waiting for a clean break below support before entry? 👇
⚠️ Not financial advice. Always manage your risk. 🛡️
🏷️ #VIRTUAL #ShortSetup #Crypto #Trading
📉 🦈
Entry: 0.489145 ⚡
Target: 0.465623 🚀
Stop Loss: 0.504943 ⚠️
Momentum is clearly rotating downward as buyers fail to defend key overhead resistance. Price action remains suffocated below 0.529200, signaling heavy distribution from institutional desks testing lower liquidity pools. 📊
Volume profiles show fading enthusiasm on every minor bounce attempt, leaving the door wide open for a deeper correction toward our downside targets. ⚡ Are you fading this weak bounce or waiting for a clean break below support before entry? 👇
⚠️ Not financial advice. Always manage your risk. 🛡️
🏷️ #VIRTUAL #ShortSetup #Crypto #Trading
📉 🦈
11


·
--
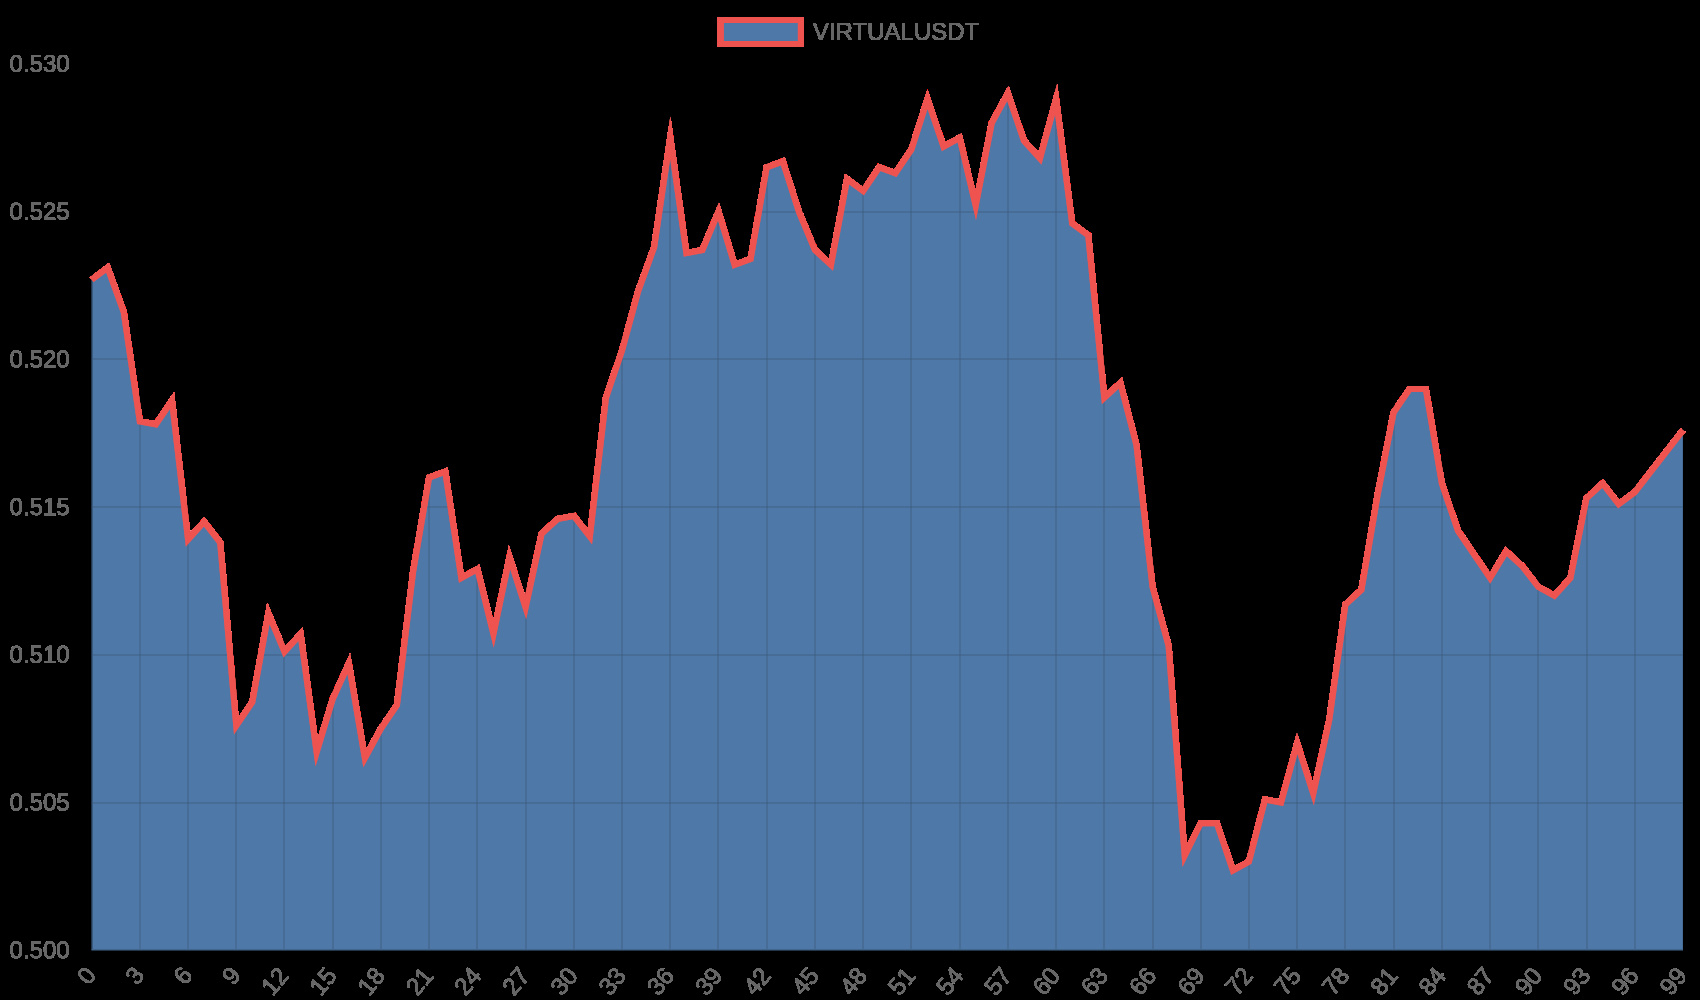
🎯 High-Probability Short: $VIRTUAL Failing to Reclaim Range
Setup: 🔴 SHORT $VIRTUAL (FUTURES)
🎯 Entry: 0.51580
🛑 Stop-Loss: 0.52865 (-2.49%)
✅ Take-Profit: 0.49011 (+4.98%)
⚖️ Risk/Reward: 1:2.0
🔍 Technical Reasoning:
Price encountered strong overhead rejection at the 50 EMA on the 1-hour chart, fully aligning with the broader 4-hour downtrend. The inability to reclaim higher levels signals persistent distribution by sellers.
💡 Key Confluences:
• Spot+Futures ✓
• 📊 ATR 1.6% — healthy volatility
• 🚀 Volume ×2.5 above average
🚫 Invalidation Rule: If a 1-hour candle closes above $0.52865 (+2.49%), this bearish thesis is invalidated. Cut position immediately.
💡 Trade Management: Secure 50% profit at Take-Profit target ($0.49011 +4.98%) and move Stop-Loss to Breakeven to eliminate downside risk.
📊 Market Metrics:
• Funding: 0.0023% (Neutral) • Next: 3h 43m
• Open Interest (OI): $10.75M
• 24h Volume: $16.78M
• 24h Range: 0.4995 — 0.5313 (-1.7%)
📈 Strategy Track Record: WR 62% over 1674 trades
#VIRTUAL #PriceAction #CryptoSignals #BinanceSquare
⚠️ Not financial advice. Always manage your risk.
🎯 High-Probability Short: $VIRTUAL Failing to Reclaim Range
Setup: 🔴 SHORT $VIRTUAL (FUTURES)
🎯 Entry: 0.51580
🛑 Stop-Loss: 0.52865 (-2.49%)
✅ Take-Profit: 0.49011 (+4.98%)
⚖️ Risk/Reward: 1:2.0
🔍 Technical Reasoning:
Price encountered strong overhead rejection at the 50 EMA on the 1-hour chart, fully aligning with the broader 4-hour downtrend. The inability to reclaim higher levels signals persistent distribution by sellers.
💡 Key Confluences:
• Spot+Futures ✓
• 📊 ATR 1.6% — healthy volatility
• 🚀 Volume ×2.5 above average
🚫 Invalidation Rule: If a 1-hour candle closes above $0.52865 (+2.49%), this bearish thesis is invalidated. Cut position immediately.
💡 Trade Management: Secure 50% profit at Take-Profit target ($0.49011 +4.98%) and move Stop-Loss to Breakeven to eliminate downside risk.
📊 Market Metrics:
• Funding: 0.0023% (Neutral) • Next: 3h 43m
• Open Interest (OI): $10.75M
• 24h Volume: $16.78M
• 24h Range: 0.4995 — 0.5313 (-1.7%)
📈 Strategy Track Record: WR 62% over 1674 trades
#VIRTUAL #PriceAction #CryptoSignals #BinanceSquare
⚠️ Not financial advice. Always manage your risk.
Setup: 🔴 SHORT $VIRTUAL (FUTURES)
🎯 Entry: 0.51580
🛑 Stop-Loss: 0.52865 (-2.49%)
✅ Take-Profit: 0.49011 (+4.98%)
⚖️ Risk/Reward: 1:2.0
🔍 Technical Reasoning:
Price encountered strong overhead rejection at the 50 EMA on the 1-hour chart, fully aligning with the broader 4-hour downtrend. The inability to reclaim higher levels signals persistent distribution by sellers.
💡 Key Confluences:
• Spot+Futures ✓
• 📊 ATR 1.6% — healthy volatility
• 🚀 Volume ×2.5 above average
🚫 Invalidation Rule: If a 1-hour candle closes above $0.52865 (+2.49%), this bearish thesis is invalidated. Cut position immediately.
💡 Trade Management: Secure 50% profit at Take-Profit target ($0.49011 +4.98%) and move Stop-Loss to Breakeven to eliminate downside risk.
📊 Market Metrics:
• Funding: 0.0023% (Neutral) • Next: 3h 43m
• Open Interest (OI): $10.75M
• 24h Volume: $16.78M
• 24h Range: 0.4995 — 0.5313 (-1.7%)
📈 Strategy Track Record: WR 62% over 1674 trades
#VIRTUAL #PriceAction #CryptoSignals #BinanceSquare
⚠️ Not financial advice. Always manage your risk.
46

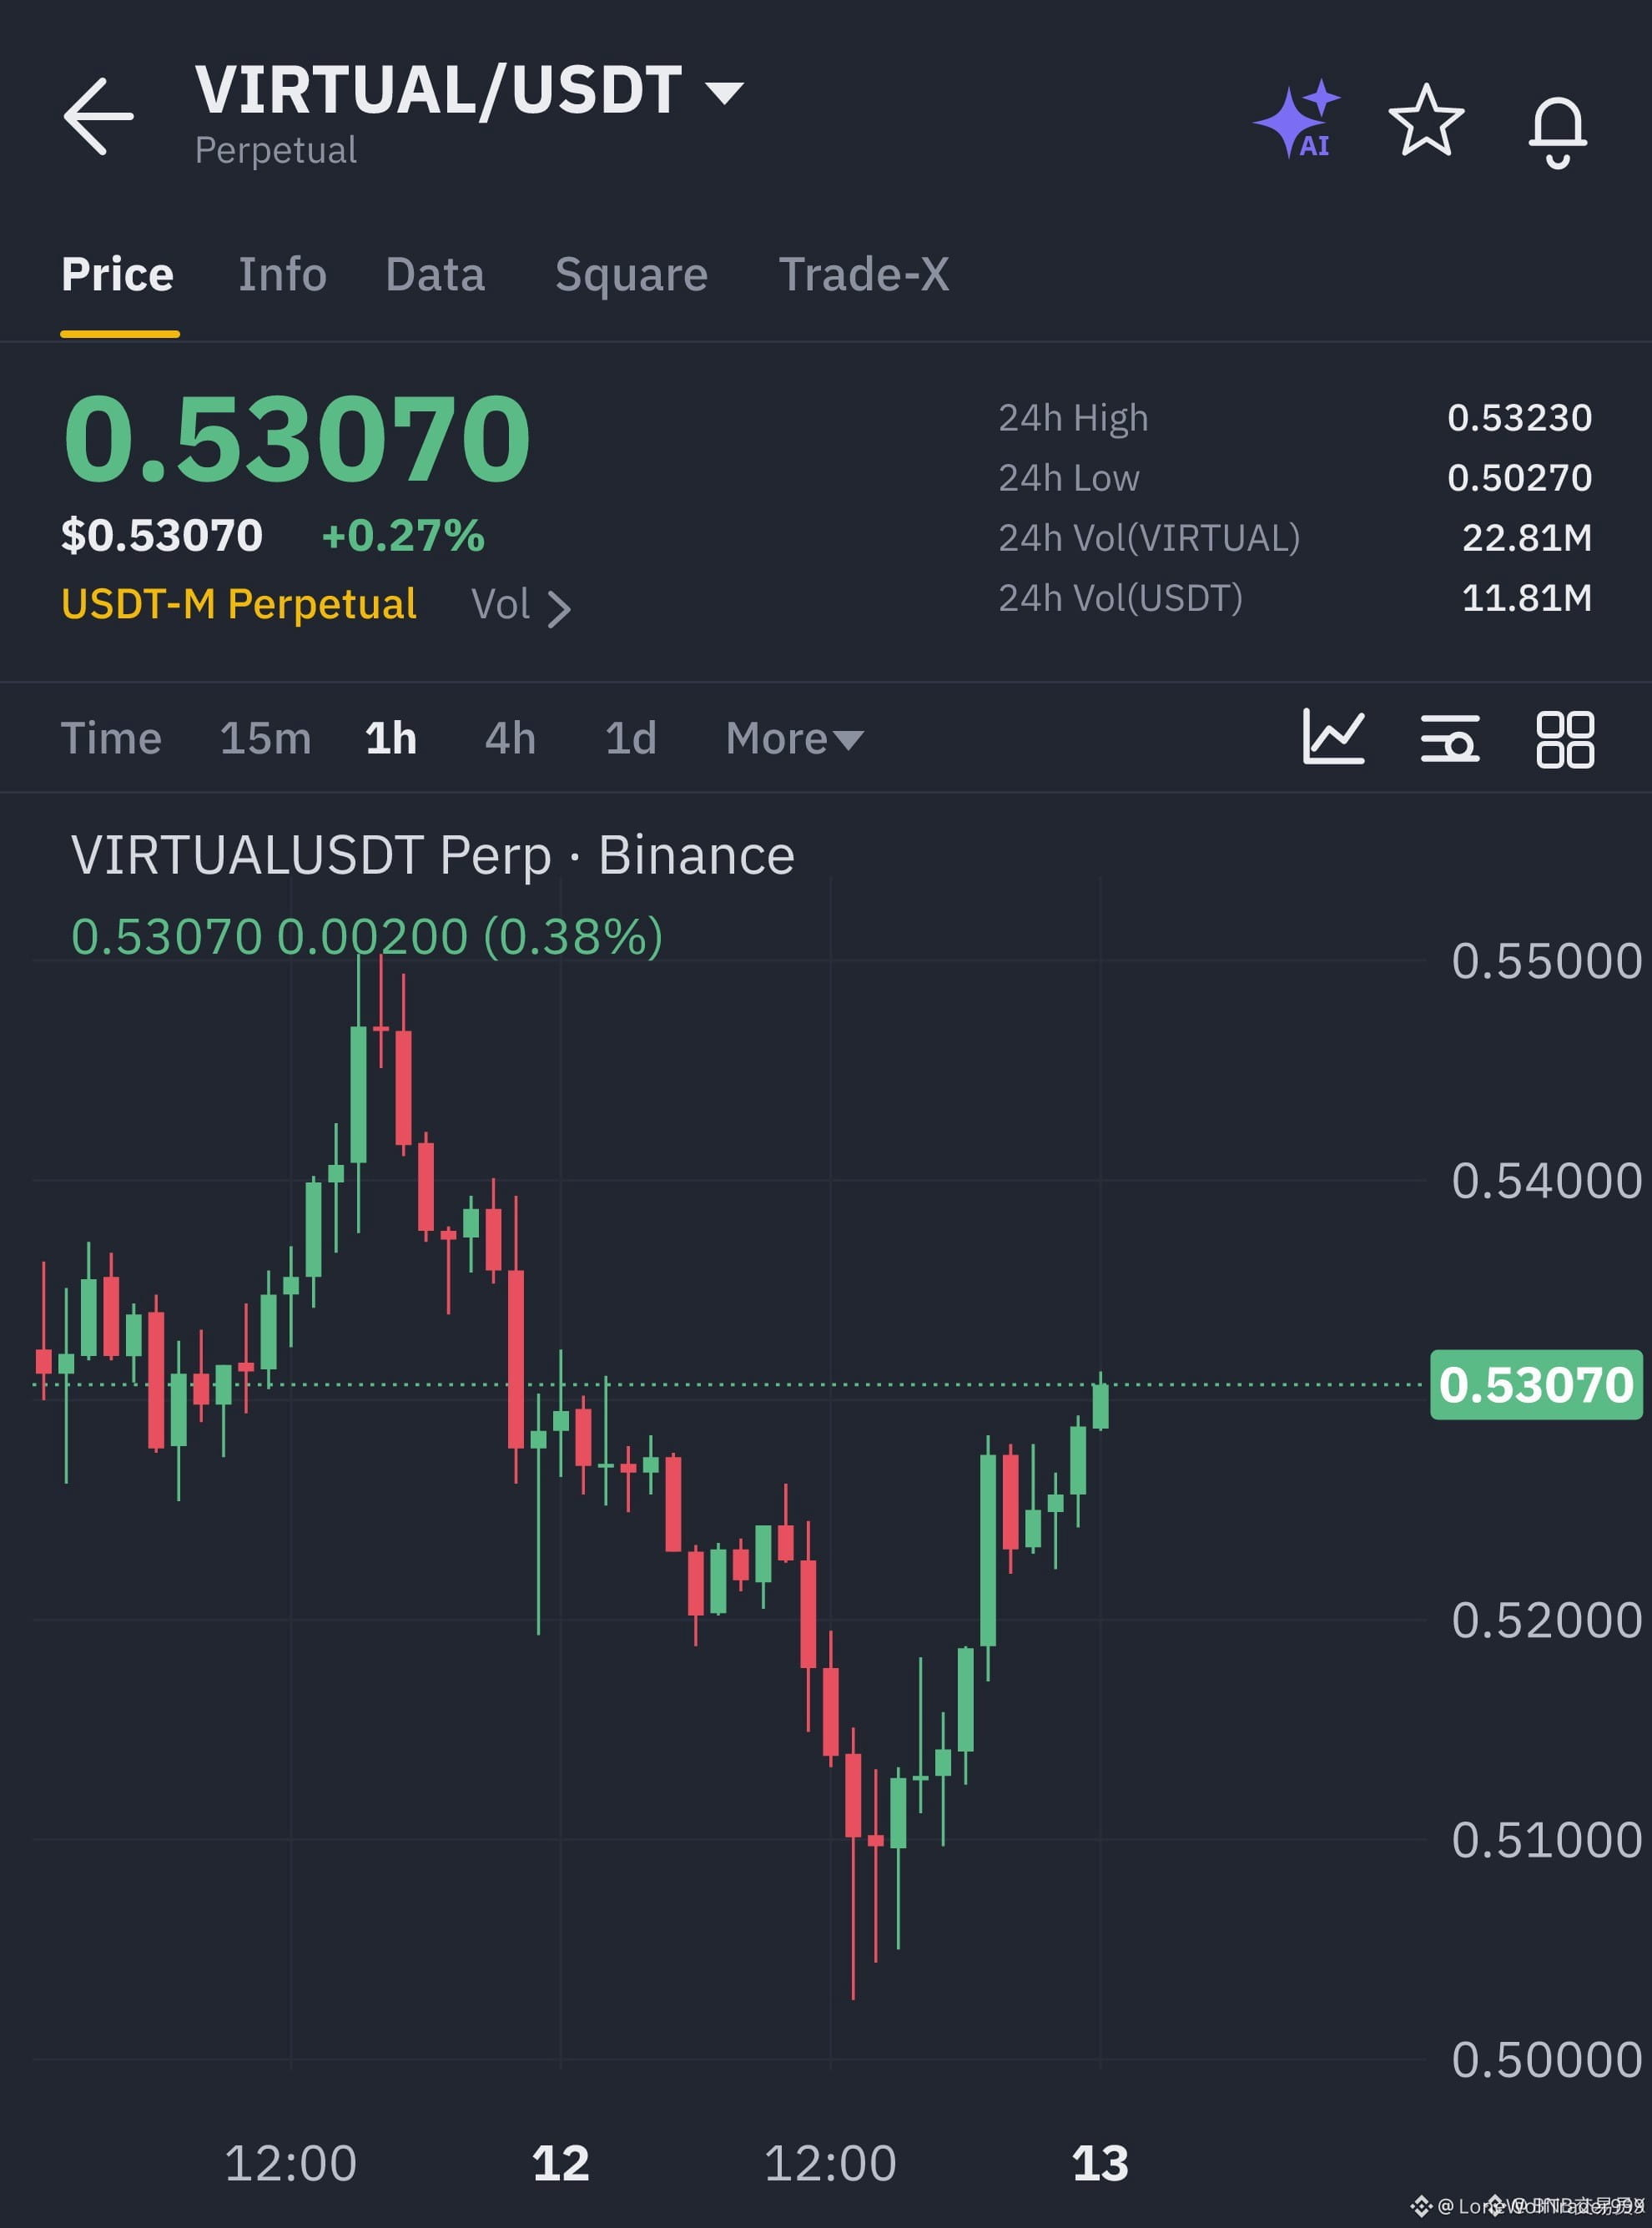
🦈 $VIRTUAL IS BUILDING A SOLID BASE FOR THE NEXT MOMENTUM SURGE ⚡
Entry: 0.528830–0.532370 ⚡
Target: 0.537679 - 0.556083 🚀
Stop Loss: 0.516443 ⚠️
Buyers are stepping in to defend the recent weakness, constructing a firm accumulation base above the 0.502700 floor. Momentum is quietly shifting as bids stack up right beneath current resistance, showing real intent to flip 0.531300 on the upside. 📊
With a clean 1:1.8 risk-to-reward ratio and 7x leverage mapped out, this structural recovery setup offers precise execution parameters for patient market participants watching the order flow. 💡 Are you positioned for this breakout continuation or waiting for a deeper retest? 👇
⚠️ Not financial advice. Always manage your risk. 🛡️
🏷️ #VIRTUAL #TIA #PYTH #LongSetup #Crypto
🔥 💎
🦈 $VIRTUAL IS BUILDING A SOLID BASE FOR THE NEXT MOMENTUM SURGE ⚡
Entry: 0.528830–0.532370 ⚡
Target: 0.537679 - 0.556083 🚀
Stop Loss: 0.516443 ⚠️
Buyers are stepping in to defend the recent weakness, constructing a firm accumulation base above the 0.502700 floor. Momentum is quietly shifting as bids stack up right beneath current resistance, showing real intent to flip 0.531300 on the upside. 📊
With a clean 1:1.8 risk-to-reward ratio and 7x leverage mapped out, this structural recovery setup offers precise execution parameters for patient market participants watching the order flow. 💡 Are you positioned for this breakout continuation or waiting for a deeper retest? 👇
⚠️ Not financial advice. Always manage your risk. 🛡️
🏷️ #VIRTUAL #TIA #PYTH #LongSetup #Crypto
🔥 💎
Entry: 0.528830–0.532370 ⚡
Target: 0.537679 - 0.556083 🚀
Stop Loss: 0.516443 ⚠️
Buyers are stepping in to defend the recent weakness, constructing a firm accumulation base above the 0.502700 floor. Momentum is quietly shifting as bids stack up right beneath current resistance, showing real intent to flip 0.531300 on the upside. 📊
With a clean 1:1.8 risk-to-reward ratio and 7x leverage mapped out, this structural recovery setup offers precise execution parameters for patient market participants watching the order flow. 💡 Are you positioned for this breakout continuation or waiting for a deeper retest? 👇
⚠️ Not financial advice. Always manage your risk. 🛡️
🏷️ #VIRTUAL #TIA #PYTH #LongSetup #Crypto
🔥 💎
57

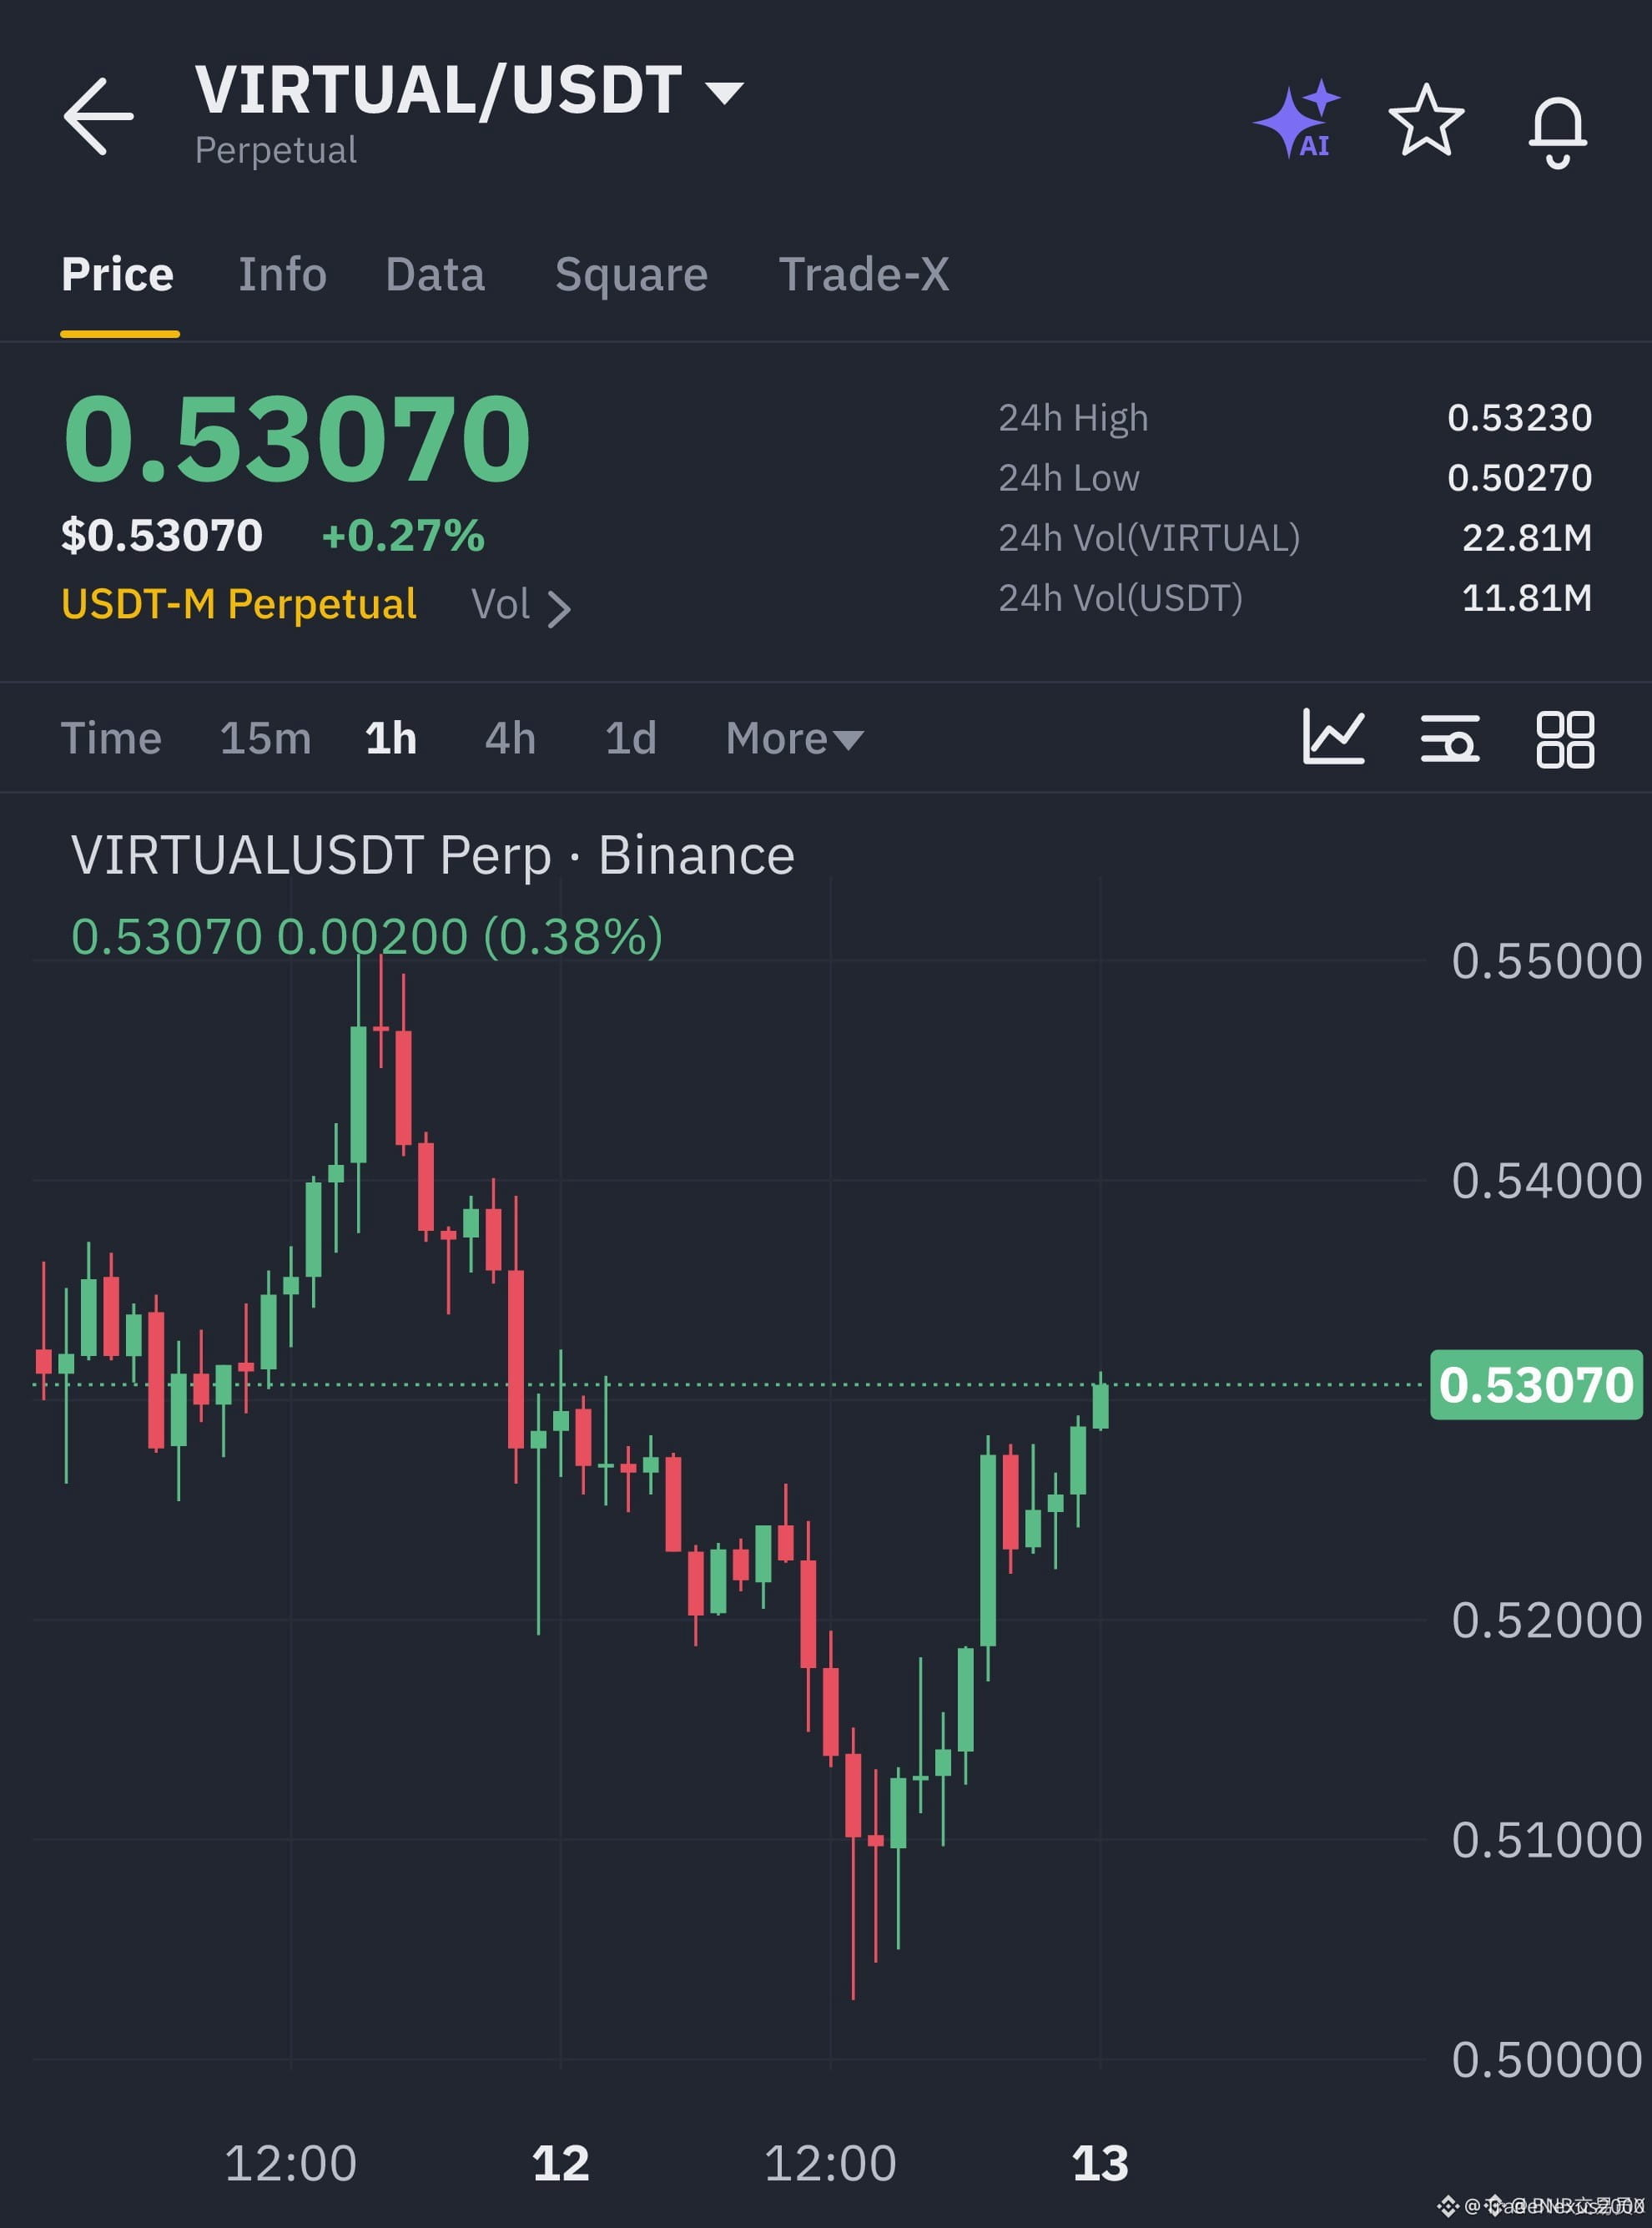
🦈 $VIRTUAL FORMING A TEXTBOOK ACCUMULATION BASE ABOVE MAJOR STRUCTURAL SUPPORT! ⚡
Entry: 0.528830–0.532370 ⚡
Target: 0.556083 🚀
Stop Loss: 0.516443 ⚠️
Smart money is methodically absorbing resting sell-side liquidity near the 0.502700 floor, building a high-probability compression base. Momentum oscillators are beginning to slope upward as institutional buyers step in to defend key structural boundaries. 📊
With inefficiency zones clearing overhead, price action is primed for a measured expansion toward higher liquidity pools. Risk parameters are tightly defined beneath the invalidation level to maintain an optimal risk-to-reward ratio. 💡
💬 Are you positioning for this structural recovery or waiting for a deeper sweep? 👇
⚠️ Not financial advice. Always manage your risk. 🛡️
🏷️ #VIRTUAL #SmartMoney #LongSetup #Crypto
🔥 💎
🦈 $VIRTUAL FORMING A TEXTBOOK ACCUMULATION BASE ABOVE MAJOR STRUCTURAL SUPPORT! ⚡
Entry: 0.528830–0.532370 ⚡
Target: 0.556083 🚀
Stop Loss: 0.516443 ⚠️
Smart money is methodically absorbing resting sell-side liquidity near the 0.502700 floor, building a high-probability compression base. Momentum oscillators are beginning to slope upward as institutional buyers step in to defend key structural boundaries. 📊
With inefficiency zones clearing overhead, price action is primed for a measured expansion toward higher liquidity pools. Risk parameters are tightly defined beneath the invalidation level to maintain an optimal risk-to-reward ratio. 💡
💬 Are you positioning for this structural recovery or waiting for a deeper sweep? 👇
⚠️ Not financial advice. Always manage your risk. 🛡️
🏷️ #VIRTUAL #SmartMoney #LongSetup #Crypto
🔥 💎
Entry: 0.528830–0.532370 ⚡
Target: 0.556083 🚀
Stop Loss: 0.516443 ⚠️
Smart money is methodically absorbing resting sell-side liquidity near the 0.502700 floor, building a high-probability compression base. Momentum oscillators are beginning to slope upward as institutional buyers step in to defend key structural boundaries. 📊
With inefficiency zones clearing overhead, price action is primed for a measured expansion toward higher liquidity pools. Risk parameters are tightly defined beneath the invalidation level to maintain an optimal risk-to-reward ratio. 💡
💬 Are you positioning for this structural recovery or waiting for a deeper sweep? 👇
⚠️ Not financial advice. Always manage your risk. 🛡️
🏷️ #VIRTUAL #SmartMoney #LongSetup #Crypto
🔥 💎
18

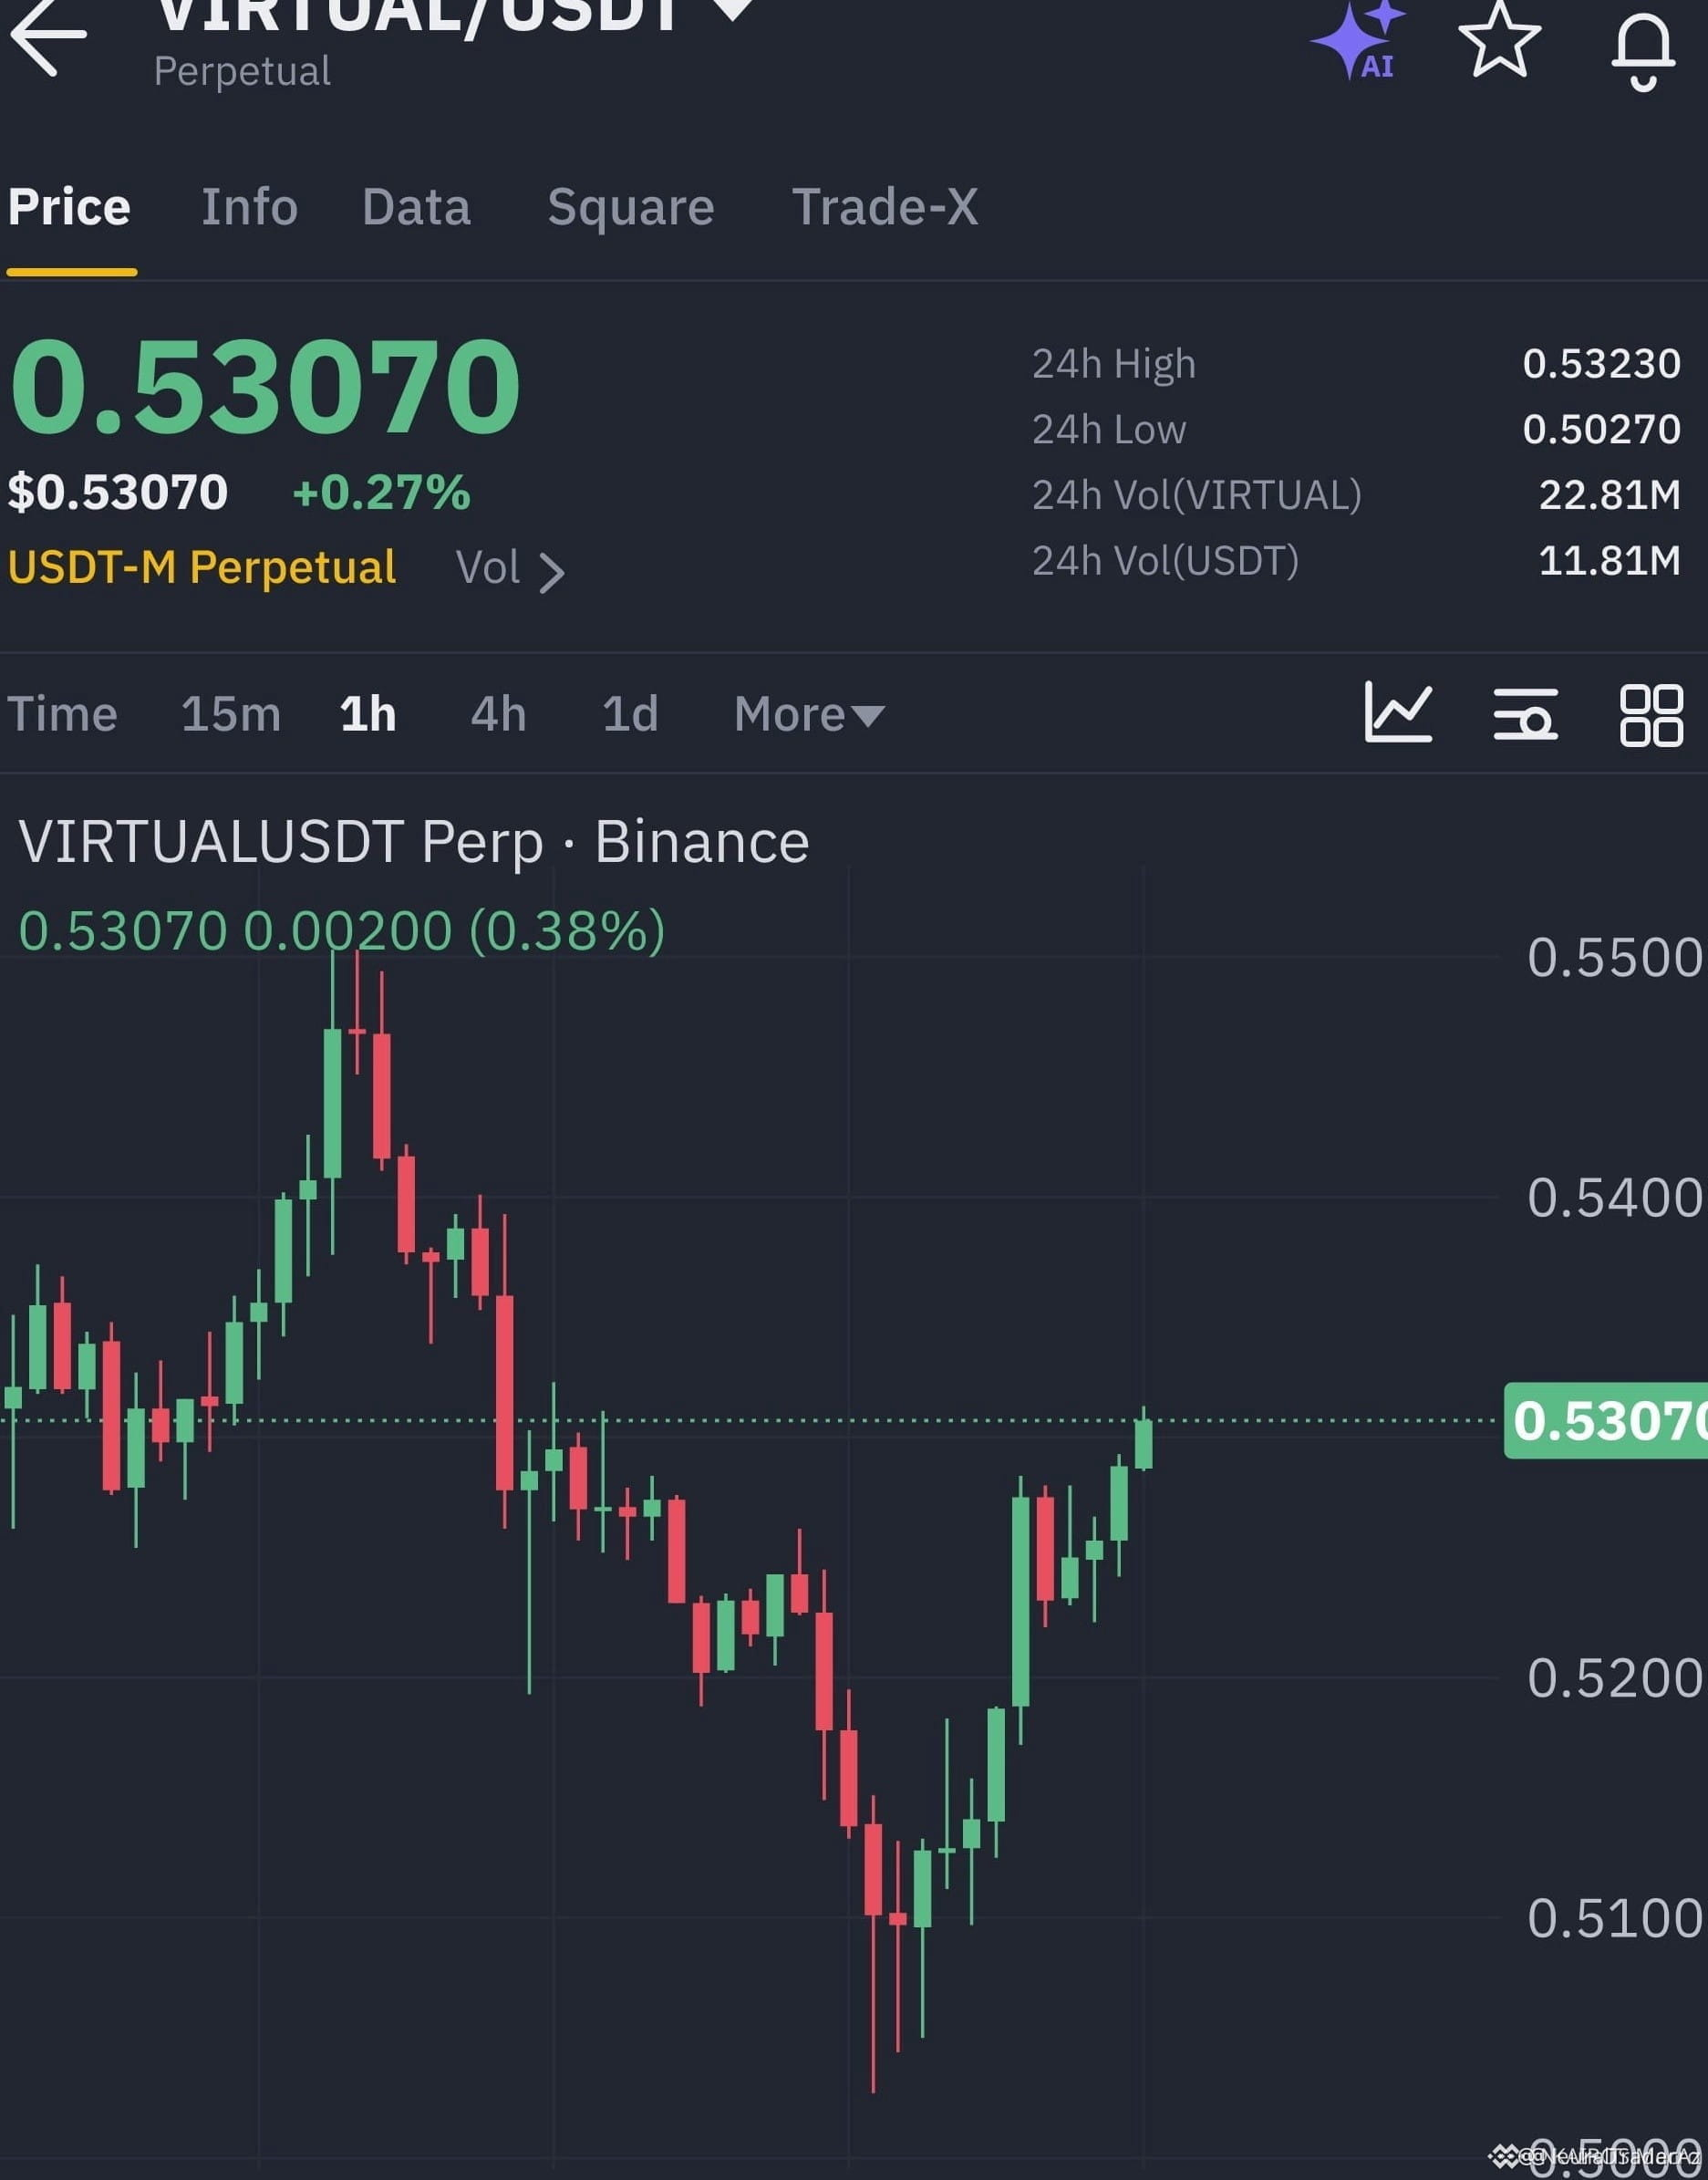
🦈 $VIRTUAL SWEEPING LIQUIDITY AT THE RANGE LOWS BEFORE A STRUCTURAL REBOUND! ⚡
Entry: 0.528830 ⚡
Target: 0.537679 🚀
Stop Loss: 0.516443 ⚠️
Institutional order flow shows smart money aggressively absorbing sell-side liquidity near the 0.502700 structural floor on $VIRTUAL . Price action is forming a classic accumulation footprint as late shorts get trapped in the recent sweep. 📊
Correlated assets like $TIA and $PYTH are mirroring this stabilization phase, confirming broader market intent to retest higher inefficiency zones. 💡
💬 Are you positioning alongside institutional accumulation here, or waiting for a confirmed range breakout? 👇
⚠️ Not financial advice. Always manage your risk. 🛡️
🏷️ #VIRTUAL #SmartMoney #Crypto #OrderBlock #Trading
🔥 💎
🦈 $VIRTUAL SWEEPING LIQUIDITY AT THE RANGE LOWS BEFORE A STRUCTURAL REBOUND! ⚡
Entry: 0.528830 ⚡
Target: 0.537679 🚀
Stop Loss: 0.516443 ⚠️
Institutional order flow shows smart money aggressively absorbing sell-side liquidity near the 0.502700 structural floor on $VIRTUAL . Price action is forming a classic accumulation footprint as late shorts get trapped in the recent sweep. 📊
Correlated assets like $TIA and $PYTH are mirroring this stabilization phase, confirming broader market intent to retest higher inefficiency zones. 💡
💬 Are you positioning alongside institutional accumulation here, or waiting for a confirmed range breakout? 👇
⚠️ Not financial advice. Always manage your risk. 🛡️
🏷️ #VIRTUAL #SmartMoney #Crypto #OrderBlock #Trading
🔥 💎
Entry: 0.528830 ⚡
Target: 0.537679 🚀
Stop Loss: 0.516443 ⚠️
Institutional order flow shows smart money aggressively absorbing sell-side liquidity near the 0.502700 structural floor on $VIRTUAL . Price action is forming a classic accumulation footprint as late shorts get trapped in the recent sweep. 📊
Correlated assets like $TIA and $PYTH are mirroring this stabilization phase, confirming broader market intent to retest higher inefficiency zones. 💡
💬 Are you positioning alongside institutional accumulation here, or waiting for a confirmed range breakout? 👇
⚠️ Not financial advice. Always manage your risk. 🛡️
🏷️ #VIRTUAL #SmartMoney #Crypto #OrderBlock #Trading
🔥 💎
38
·
--
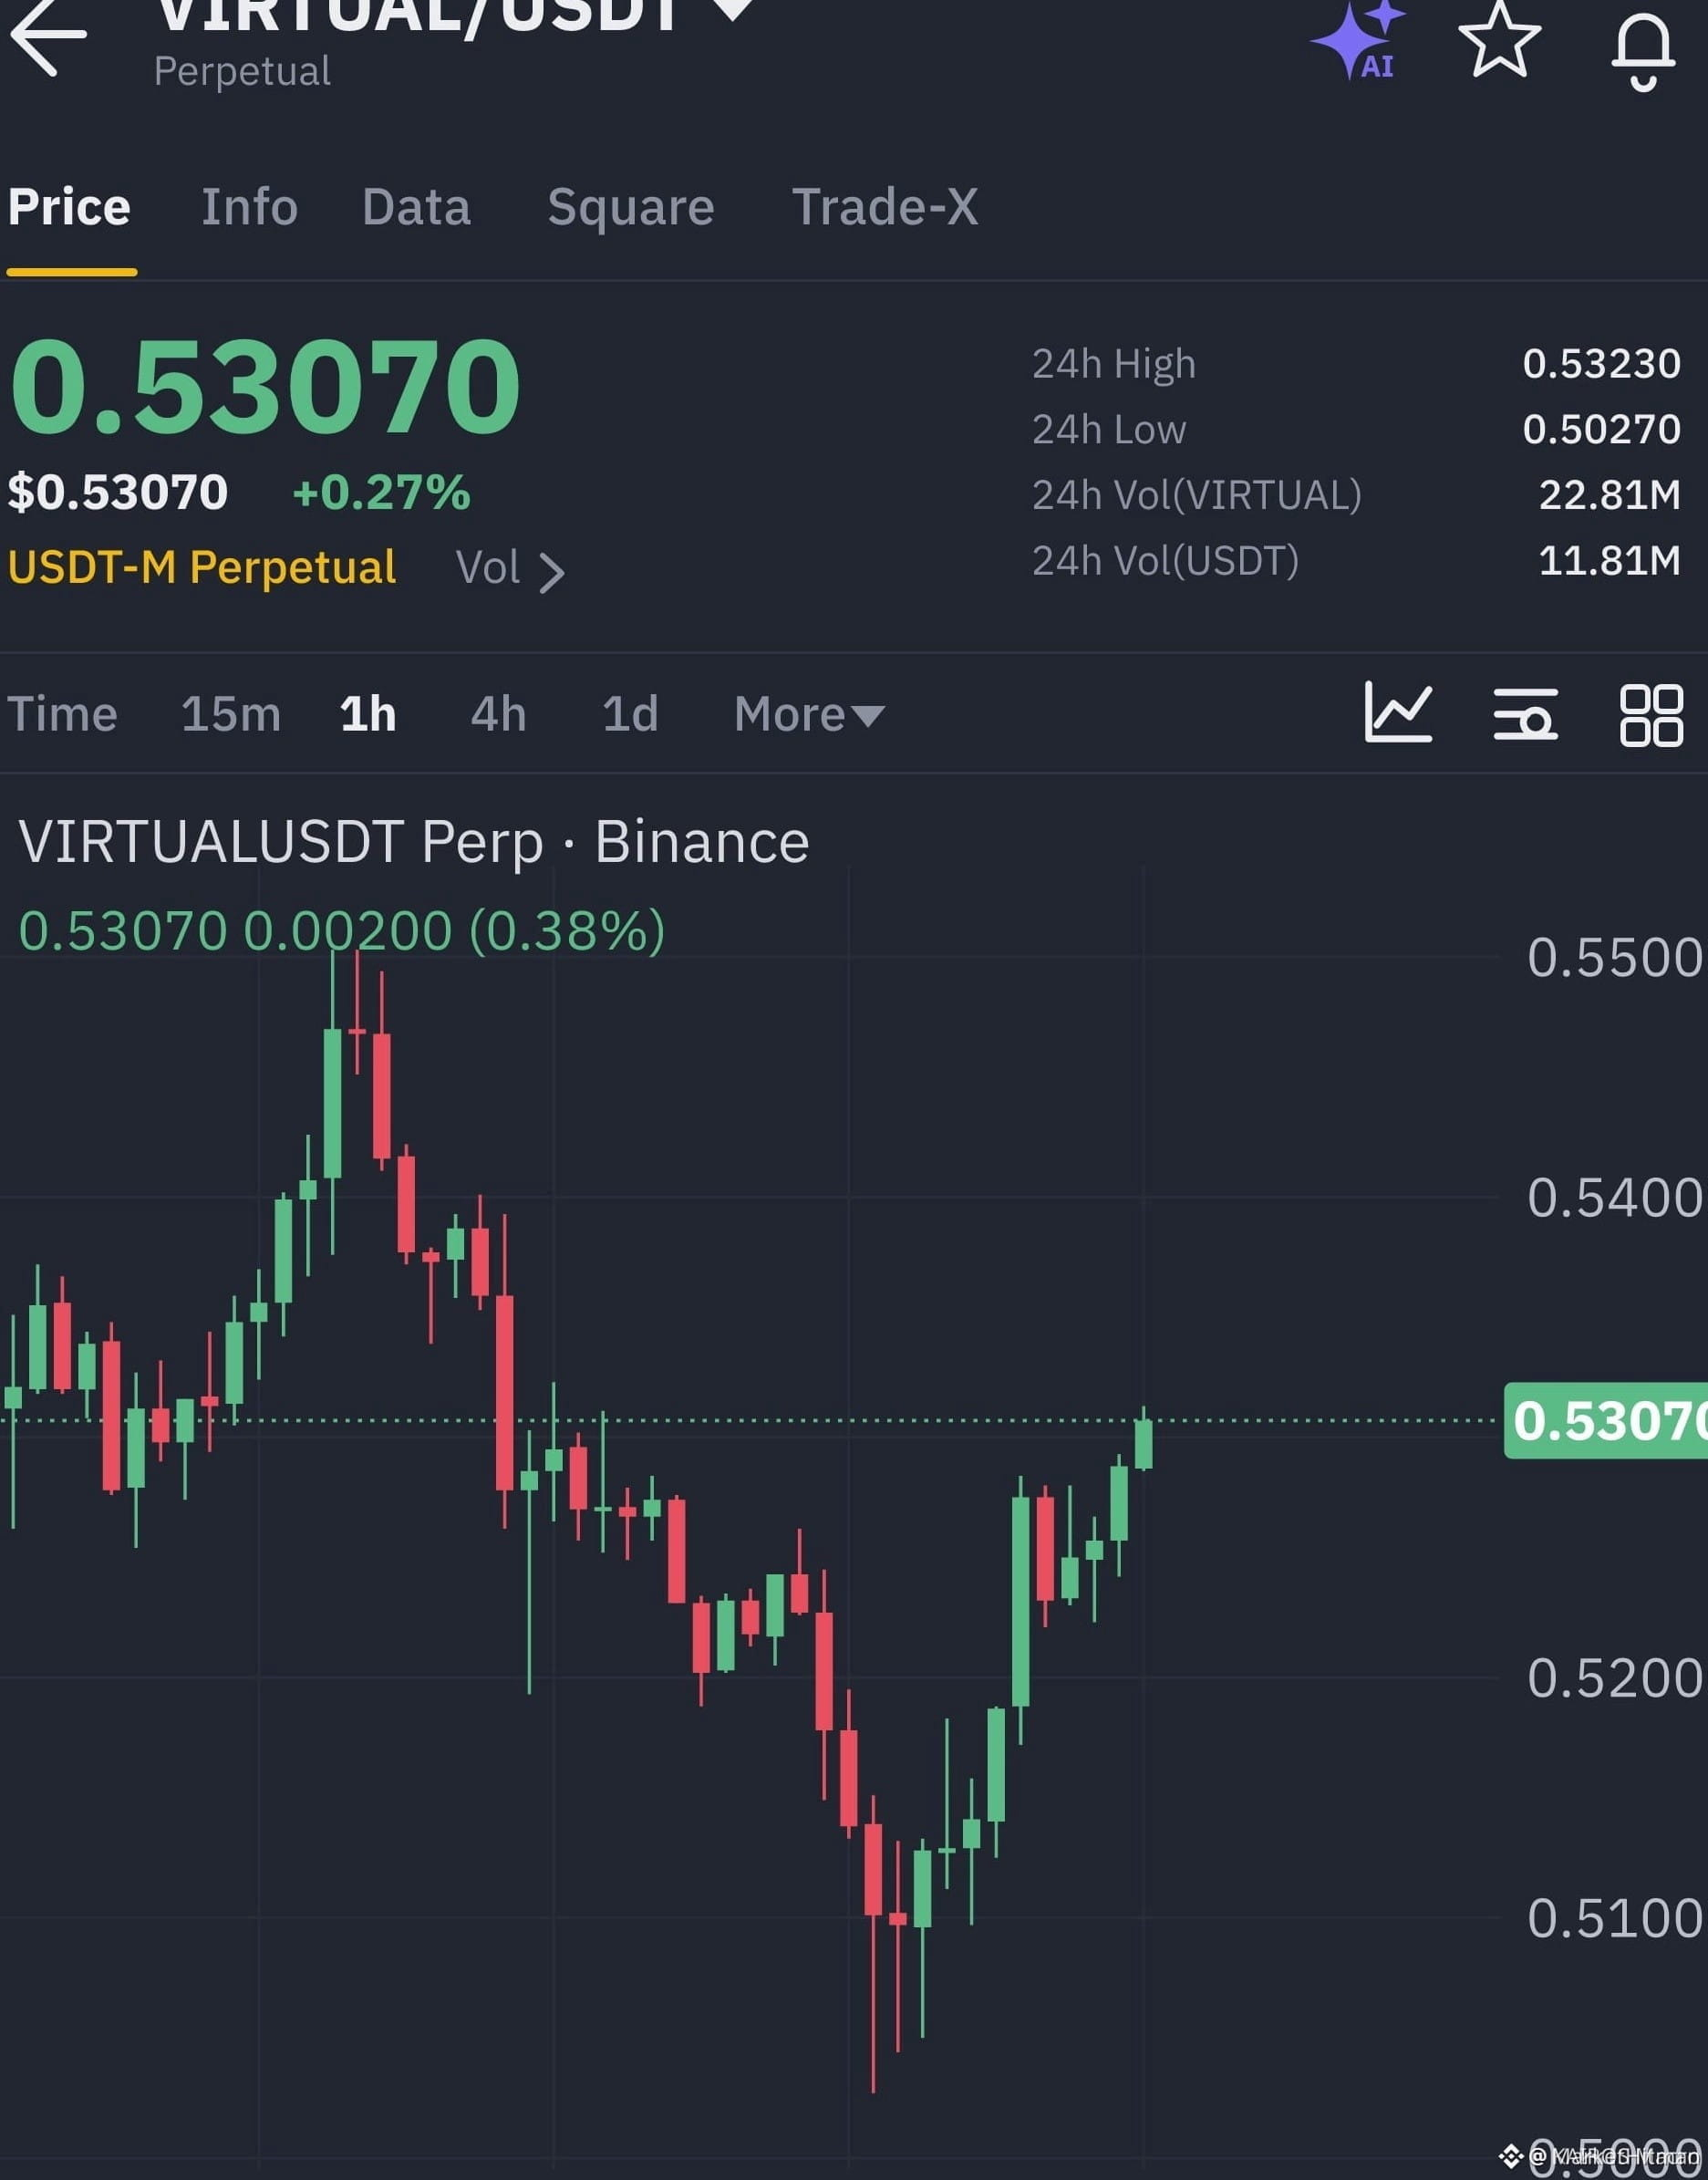
🚨 $VIRTUAL SURVIVING THE DEEP LIQUIDITY FLUSH BEFORE THE REBOUND! 💥
Entry: 0.528830 ⚡
Target: 0.537679 🚀
Stop Loss: 0.516443 ⚠️
The recent order book flush tested every ounce of patience, shaking out weak hands right into institutional bid zones. 📊 With price defending the crucial base above 0.502700, momentum indicators are starting to curl upward as buyers reclaim lost territory. ⚡
Both $TIA and $PYTH are showing similar consolidation footprints across the broader landscape, signaling a potential sector-wide rotation. 💡 Are you holding your ground through the chop or waiting for confirmation before stepping in? 👇
⚠️ Not financial advice. Always manage your risk. 🛡️
🏷️ #VIRTUAL #LongSetup #Momentum #Crypto #TIA
🔥 💎
🚨 $VIRTUAL SURVIVING THE DEEP LIQUIDITY FLUSH BEFORE THE REBOUND! 💥
Entry: 0.528830 ⚡
Target: 0.537679 🚀
Stop Loss: 0.516443 ⚠️
The recent order book flush tested every ounce of patience, shaking out weak hands right into institutional bid zones. 📊 With price defending the crucial base above 0.502700, momentum indicators are starting to curl upward as buyers reclaim lost territory. ⚡
Both $TIA and $PYTH are showing similar consolidation footprints across the broader landscape, signaling a potential sector-wide rotation. 💡 Are you holding your ground through the chop or waiting for confirmation before stepping in? 👇
⚠️ Not financial advice. Always manage your risk. 🛡️
🏷️ #VIRTUAL #LongSetup #Momentum #Crypto #TIA
🔥 💎
Entry: 0.528830 ⚡
Target: 0.537679 🚀
Stop Loss: 0.516443 ⚠️
The recent order book flush tested every ounce of patience, shaking out weak hands right into institutional bid zones. 📊 With price defending the crucial base above 0.502700, momentum indicators are starting to curl upward as buyers reclaim lost territory. ⚡
Both $TIA and $PYTH are showing similar consolidation footprints across the broader landscape, signaling a potential sector-wide rotation. 💡 Are you holding your ground through the chop or waiting for confirmation before stepping in? 👇
⚠️ Not financial advice. Always manage your risk. 🛡️
🏷️ #VIRTUAL #LongSetup #Momentum #Crypto #TIA
🔥 💎
80


·
--
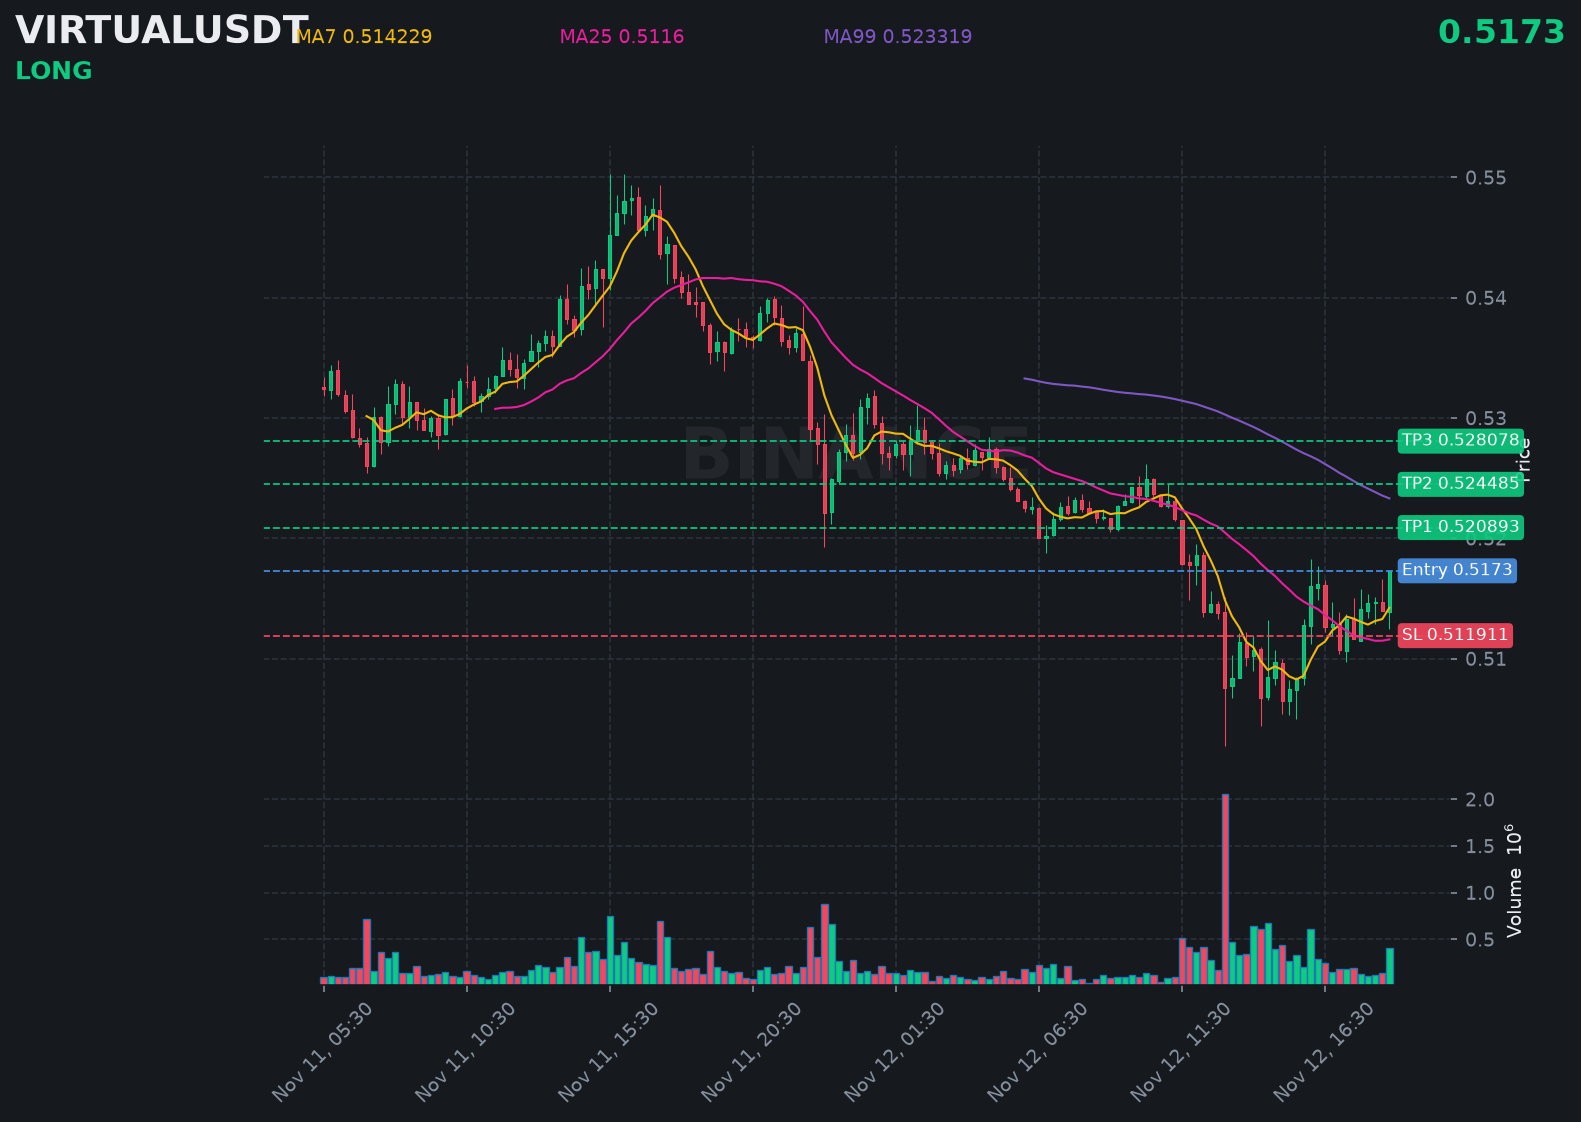
$VIRTUAL is showing a clear uptrend, with buyers stepping in and pushing the price higher.
📍 @ 0.5173 | Volume: 0.21M USD
RSI 57 | EMA20: 0.513621 USD
📈 Trade Plan:
📈 Entry: 0.516222 – 0.518378
🛑 Stop Loss: 0.511911
🎯 TP1: 0.520893
🎯 TP2: 0.524485
🎯 TP3: 0.528078
Waiting for a retest, then riding the uptrend.
👉 $VIRTUAL 👈 Catch it
#VIRTUAL
$VIRTUAL is showing a clear uptrend, with buyers stepping in and pushing the price higher.
📍 @ 0.5173 | Volume: 0.21M USD
RSI 57 | EMA20: 0.513621 USD
📈 Trade Plan:
📈 Entry: 0.516222 – 0.518378
🛑 Stop Loss: 0.511911
🎯 TP1: 0.520893
🎯 TP2: 0.524485
🎯 TP3: 0.528078
Waiting for a retest, then riding the uptrend.
👉 $VIRTUAL 👈 Catch it
#VIRTUAL
📍 @ 0.5173 | Volume: 0.21M USD
RSI 57 | EMA20: 0.513621 USD
📈 Trade Plan:
📈 Entry: 0.516222 – 0.518378
🛑 Stop Loss: 0.511911
🎯 TP1: 0.520893
🎯 TP2: 0.524485
🎯 TP3: 0.528078
Waiting for a retest, then riding the uptrend.
👉 $VIRTUAL 👈 Catch it
#VIRTUAL
65

·
--
30-minute weakness confirms the 4-hour bearish trend; $USELESS $VIRTUAL $PYTH show confluence to the downside 🔥
════════════════════
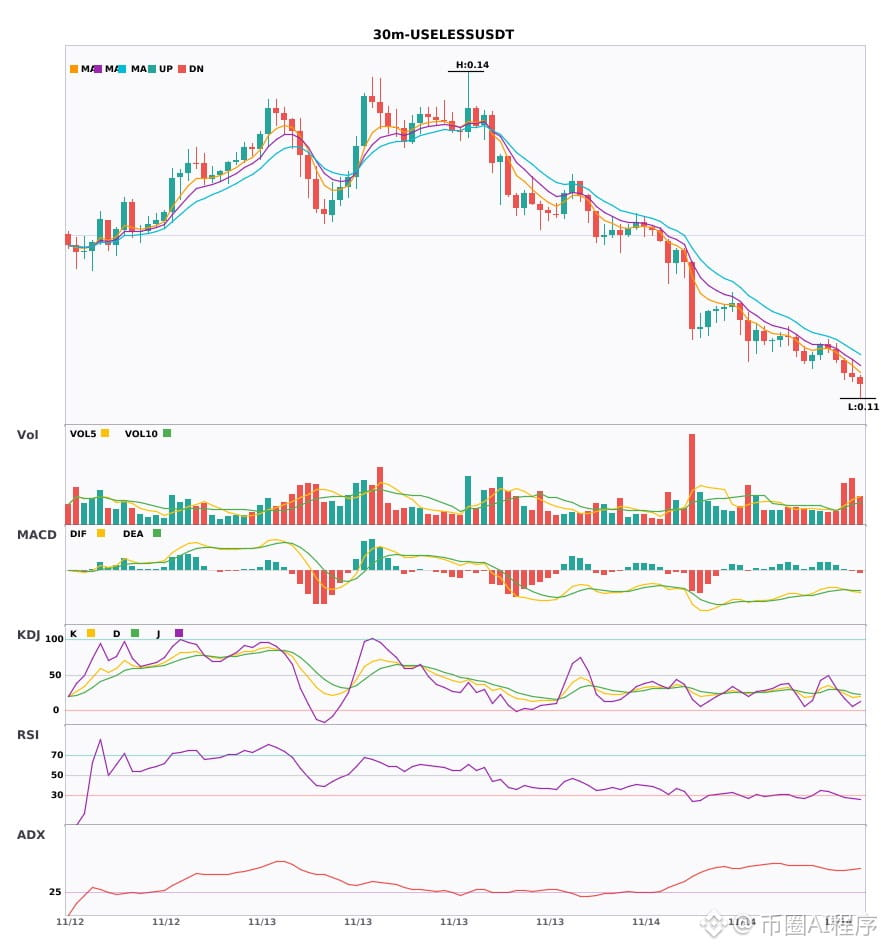
🟢 $USELESS 30-minute bearish signal
⚠️Technical analysis: Multi-timeframe confluence favors short positions: 30-minute MACD bearish crossover with rising volume; moving averages bearishly aligned and diverging downward; KDJ crossing downward in weak territory, not yet oversold. 4-hour bearish confluence confirmed, with rising volume in the same direction.
════════════════════
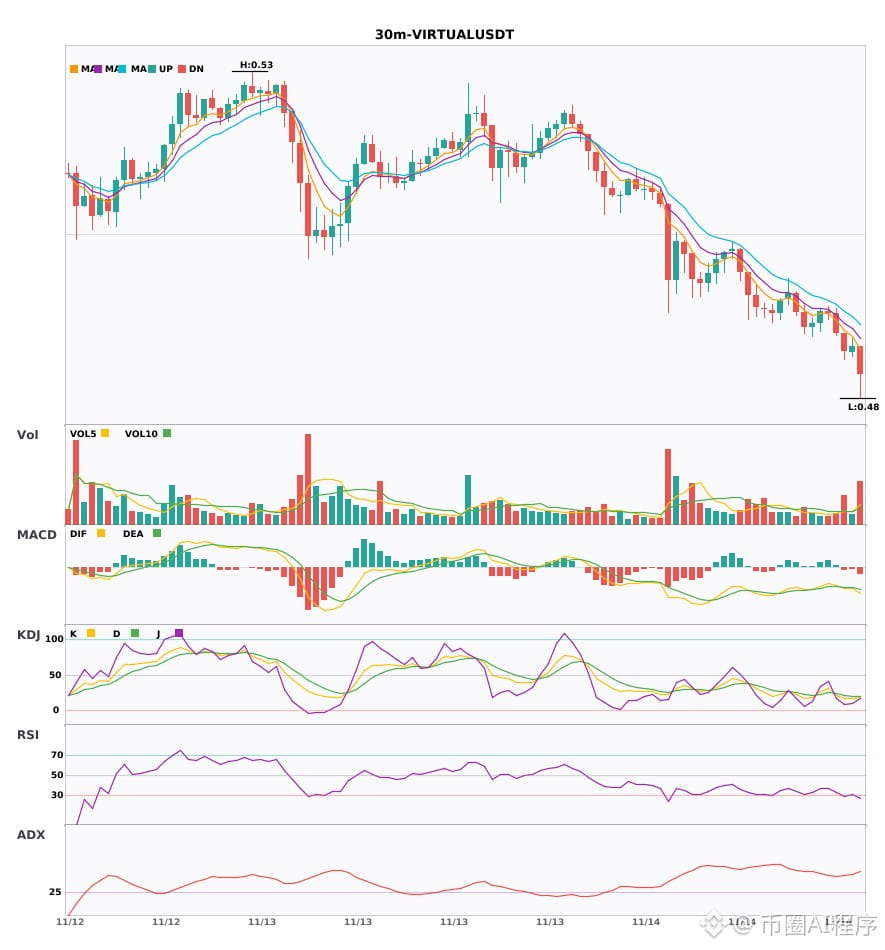
🟢 $VIRTUAL 30-minute bearish signal
⚠️Technical analysis: 4-hour + 30-minute bearish confluence confirms entry. 30-minute MACD bearish crossover below zero, with the green histogram bars continuing to expand; moving averages bearishly aligned and diverging downward; KDJ weak at low levels but not oversold; volume up 2.2x.
════════════════════
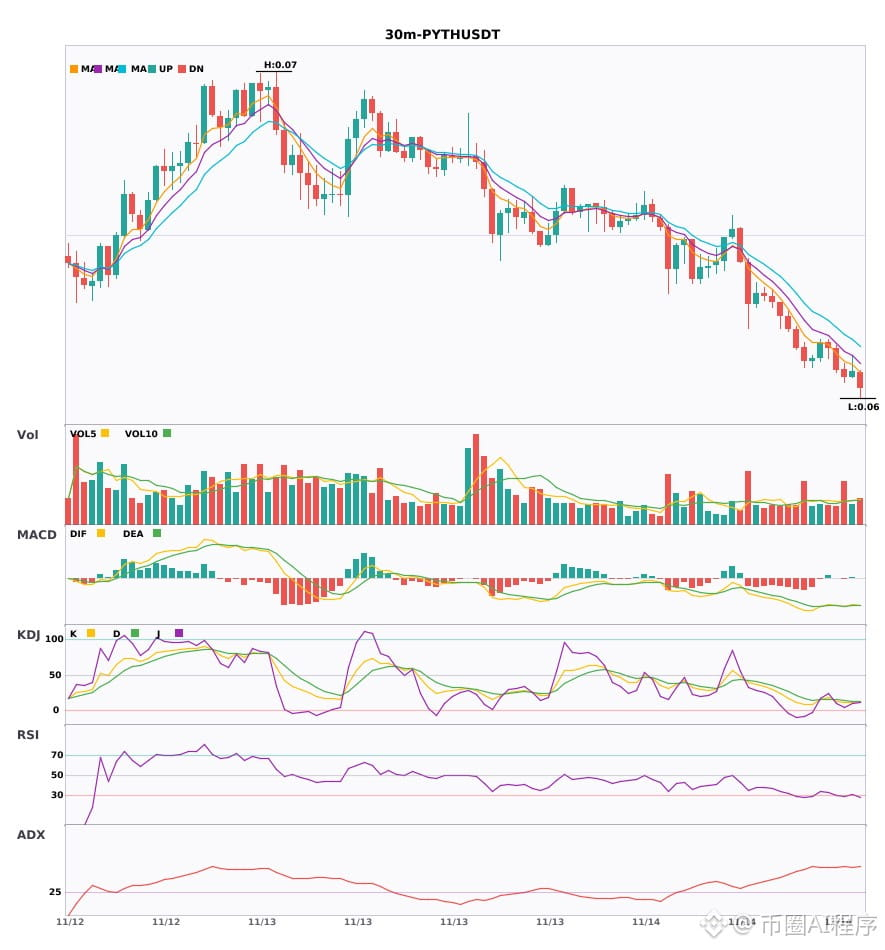
🟢 $PYTH 30-minute bearish signal
⚠️Technical analysis: 30-minute entry + 4-hour bearish trend, confirmed by multi-timeframe confluence: MACD bearish crossover below zero with expanding green histogram bars; moving averages bearishly aligned; KDJ entering oversold territory—watch for a rebound; volume up 1.8x.
════════════════════
🔔 Follow for first-hand market alerts 🔔
#多周期共振 #USELESS #VIRTUAL #PYTH
📌 When trading, watch whether the candlestick patterns match.
30-minute weakness confirms the 4-hour bearish trend; $USELESS $VIRTUAL $PYTH show confluence to the downside 🔥
════════════════════
🟢 $USELESS 30-minute bearish signal
⚠️Technical analysis: Multi-timeframe confluence favors short positions: 30-minute MACD bearish crossover with rising volume; moving averages bearishly aligned and diverging downward; KDJ crossing downward in weak territory, not yet oversold. 4-hour bearish confluence confirmed, with rising volume in the same direction.
════════════════════
🟢 $VIRTUAL 30-minute bearish signal
⚠️Technical analysis: 4-hour + 30-minute bearish confluence confirms entry. 30-minute MACD bearish crossover below zero, with the green histogram bars continuing to expand; moving averages bearishly aligned and diverging downward; KDJ weak at low levels but not oversold; volume up 2.2x.
════════════════════
🟢 $PYTH 30-minute bearish signal
⚠️Technical analysis: 30-minute entry + 4-hour bearish trend, confirmed by multi-timeframe confluence: MACD bearish crossover below zero with expanding green histogram bars; moving averages bearishly aligned; KDJ entering oversold territory—watch for a rebound; volume up 1.8x.
════════════════════
🔔 Follow for first-hand market alerts 🔔
#多周期共振 #USELESS #VIRTUAL #PYTH
📌 When trading, watch whether the candlestick patterns match.
════════════════════
🟢 $USELESS 30-minute bearish signal
⚠️Technical analysis: Multi-timeframe confluence favors short positions: 30-minute MACD bearish crossover with rising volume; moving averages bearishly aligned and diverging downward; KDJ crossing downward in weak territory, not yet oversold. 4-hour bearish confluence confirmed, with rising volume in the same direction.
════════════════════
🟢 $VIRTUAL 30-minute bearish signal
⚠️Technical analysis: 4-hour + 30-minute bearish confluence confirms entry. 30-minute MACD bearish crossover below zero, with the green histogram bars continuing to expand; moving averages bearishly aligned and diverging downward; KDJ weak at low levels but not oversold; volume up 2.2x.
════════════════════
🟢 $PYTH 30-minute bearish signal
⚠️Technical analysis: 30-minute entry + 4-hour bearish trend, confirmed by multi-timeframe confluence: MACD bearish crossover below zero with expanding green histogram bars; moving averages bearishly aligned; KDJ entering oversold territory—watch for a rebound; volume up 1.8x.
════════════════════
🔔 Follow for first-hand market alerts 🔔
#多周期共振 #USELESS #VIRTUAL #PYTH
📌 When trading, watch whether the candlestick patterns match.
24

·
--
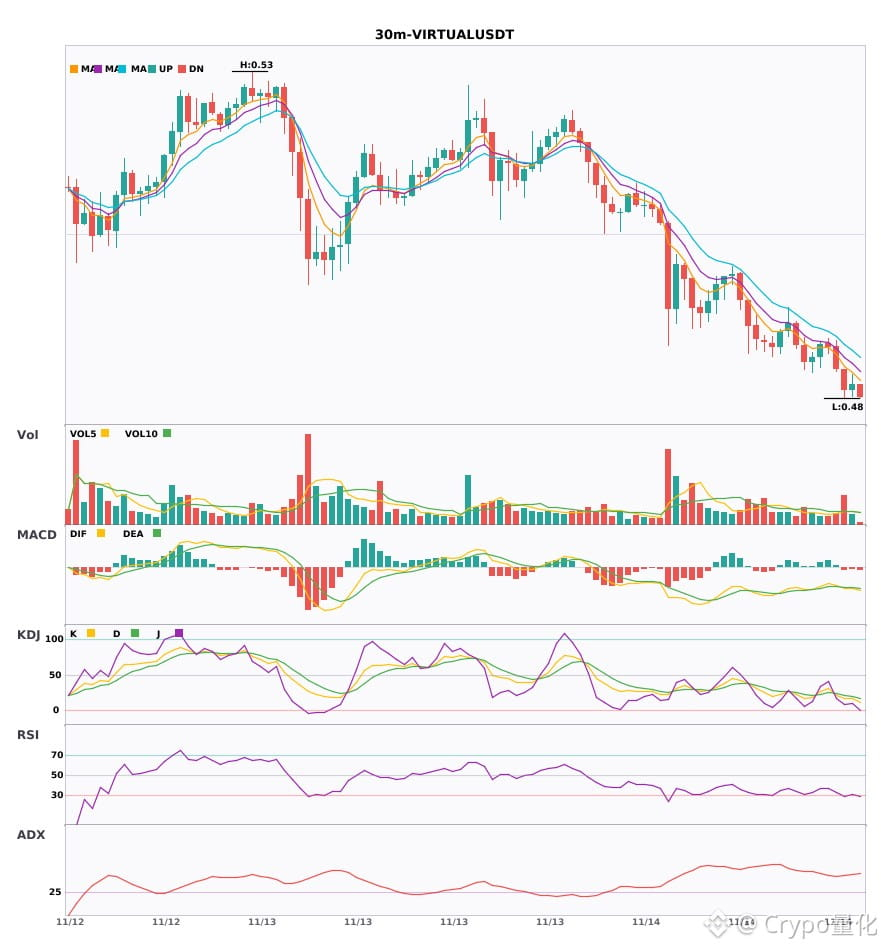
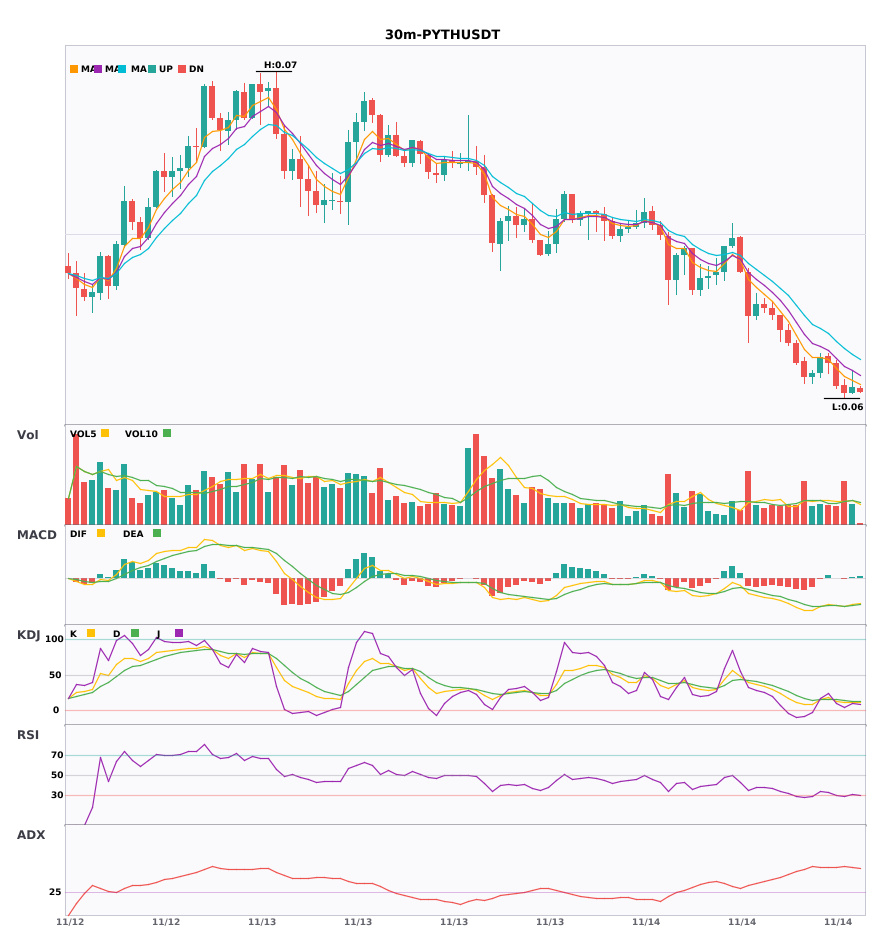
$USELESS/$VIRTUAL/$PYTH 30m all weakening 🔥
════════════════════
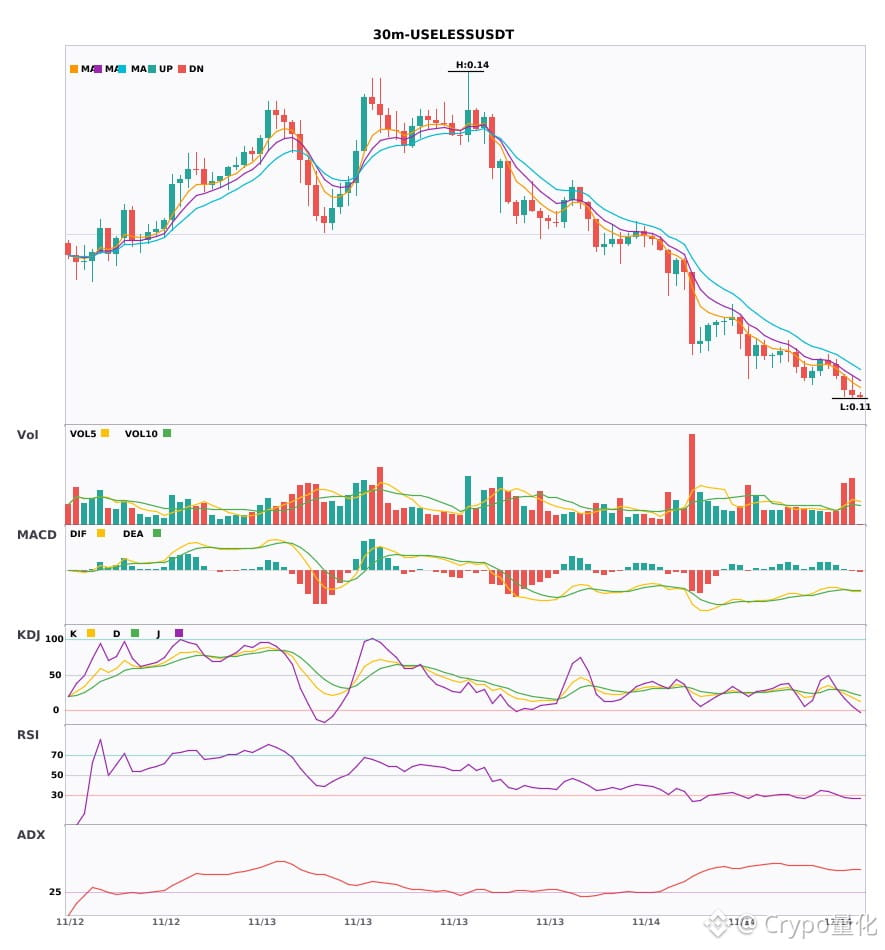
🟢 $USELESS 30-minute bearish signal
⚠️Technical analysis: ADX is at 49, indicating a very strong trend, but watch out for an overheated pullback. MACD bearish crossover, with bearish momentum accelerating. Moving averages are bearishly aligned and trending down. KDJ is weak, with bears in control. Trading volume surged 2.4x.
════════════════════
🟢 $VIRTUAL 30-minute bearish signal
⚠️Technical analysis: ADX is elevated, indicating a clear trend. After the MACD bearish crossover, the green bars are growing. Moving averages are bearishly aligned and diverging downward. KDJ is weak, with K crossing below D and not yet oversold. Trading volume increased 2.2x.
════════════════════
🟢 $PYTH 30-minute bearish signal
⚠️Technical analysis: ADX (56) indicates an extremely strong trend, but watch for a pullback | MACD bearish crossover, bearish momentum accelerating | Bearishly aligned moving averages | KDJ oversold (K10.8 D13.8), waiting for a rebound | Volume surged 1.8x
════════════════════
🔔 Follow for real-time market updates 🔔
#技术分析 #USELESS #VIRTUAL #PYTH
📌 When trading, pay attention to whether the candlestick patterns confirm the signal
$USELESS /$VIRTUAL /$PYTH 30m all weakening 🔥
════════════════════
🟢 $USELESS 30-minute bearish signal
⚠️Technical analysis: ADX is at 49, indicating a very strong trend, but watch out for an overheated pullback. MACD bearish crossover, with bearish momentum accelerating. Moving averages are bearishly aligned and trending down. KDJ is weak, with bears in control. Trading volume surged 2.4x.
════════════════════
🟢 $VIRTUAL 30-minute bearish signal
⚠️Technical analysis: ADX is elevated, indicating a clear trend. After the MACD bearish crossover, the green bars are growing. Moving averages are bearishly aligned and diverging downward. KDJ is weak, with K crossing below D and not yet oversold. Trading volume increased 2.2x.
════════════════════
🟢 $PYTH 30-minute bearish signal
⚠️Technical analysis: ADX (56) indicates an extremely strong trend, but watch for a pullback | MACD bearish crossover, bearish momentum accelerating | Bearishly aligned moving averages | KDJ oversold (K10.8 D13.8), waiting for a rebound | Volume surged 1.8x
════════════════════
🔔 Follow for real-time market updates 🔔
#技术分析 #USELESS #VIRTUAL #PYTH
📌 When trading, pay attention to whether the candlestick patterns confirm the signal
════════════════════
🟢 $USELESS 30-minute bearish signal
⚠️Technical analysis: ADX is at 49, indicating a very strong trend, but watch out for an overheated pullback. MACD bearish crossover, with bearish momentum accelerating. Moving averages are bearishly aligned and trending down. KDJ is weak, with bears in control. Trading volume surged 2.4x.
════════════════════
🟢 $VIRTUAL 30-minute bearish signal
⚠️Technical analysis: ADX is elevated, indicating a clear trend. After the MACD bearish crossover, the green bars are growing. Moving averages are bearishly aligned and diverging downward. KDJ is weak, with K crossing below D and not yet oversold. Trading volume increased 2.2x.
════════════════════
🟢 $PYTH 30-minute bearish signal
⚠️Technical analysis: ADX (56) indicates an extremely strong trend, but watch for a pullback | MACD bearish crossover, bearish momentum accelerating | Bearishly aligned moving averages | KDJ oversold (K10.8 D13.8), waiting for a rebound | Volume surged 1.8x
════════════════════
🔔 Follow for real-time market updates 🔔
#技术分析 #USELESS #VIRTUAL #PYTH
📌 When trading, pay attention to whether the candlestick patterns confirm the signal
26
·
--
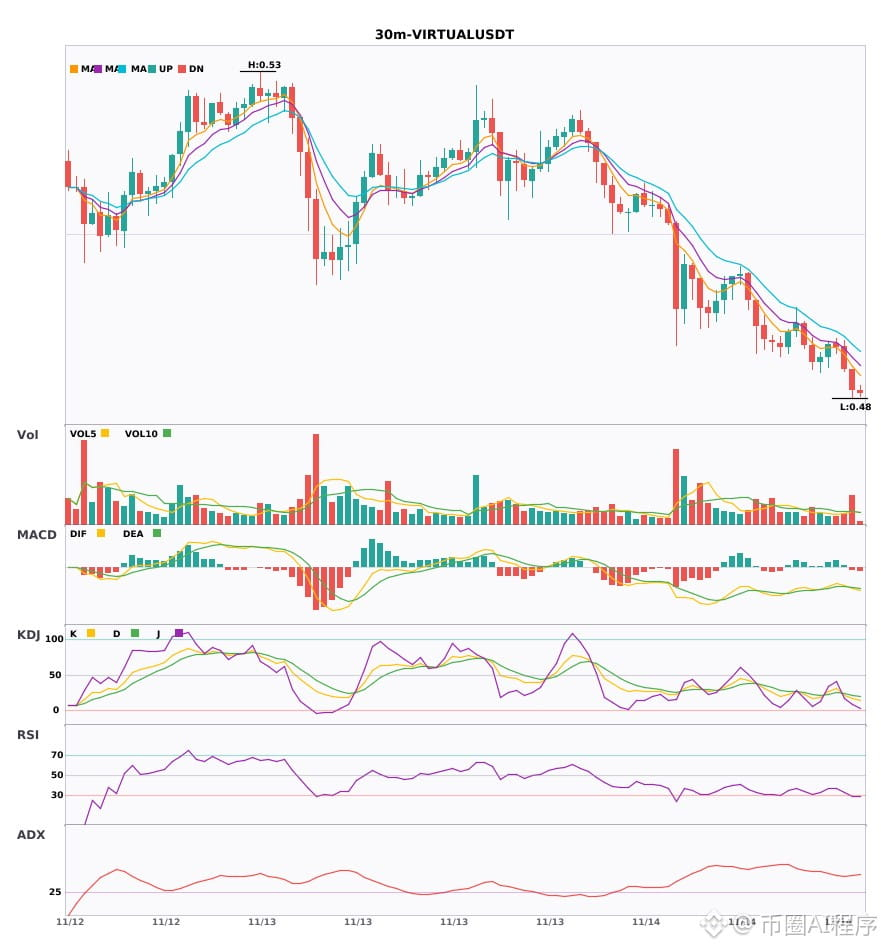
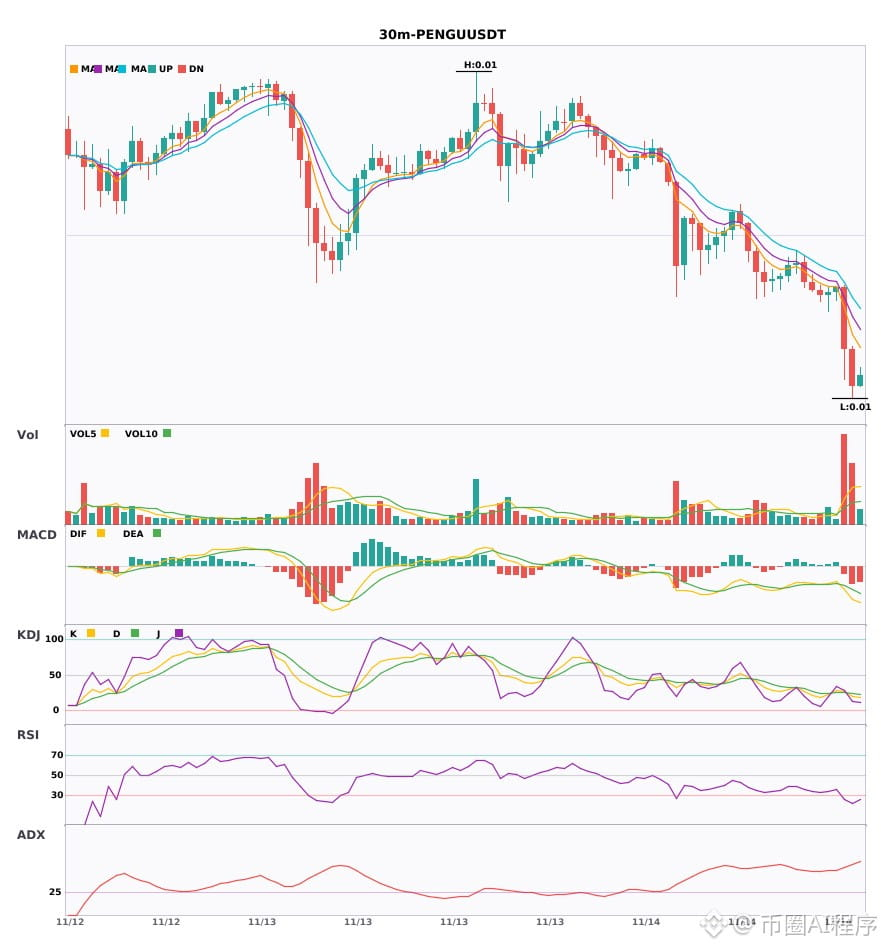
$VIRTUAL/$PENGU/$ZRO 30 minutes just turned bearish; 4-hour bearish trend confirmed 🔥
════════════════════
🟢 $VIRTUAL 30-minute bearish signal
⚠️Technical analysis: 4-hour bearish trend and 30-minute entry signal confirmed in confluence! MACD bearish crossover below zero with rising volume; green bars continue to grow. Moving averages have just formed a bearish alignment and are pointing downward. KDJ is weak, with bears in control. Volume is up 2.2x.
════════════════════
🟢 $PENGU 30-minute bearish signal
⚠️Technical analysis: 4-hour and 30-minute bearish signals confirmed in confluence | Green bars expand after MACD bearish crossover | Moving averages diverge downward in a bearish alignment | KDJ is weak, with K below D | Volume is up 5.1x
════════════════════
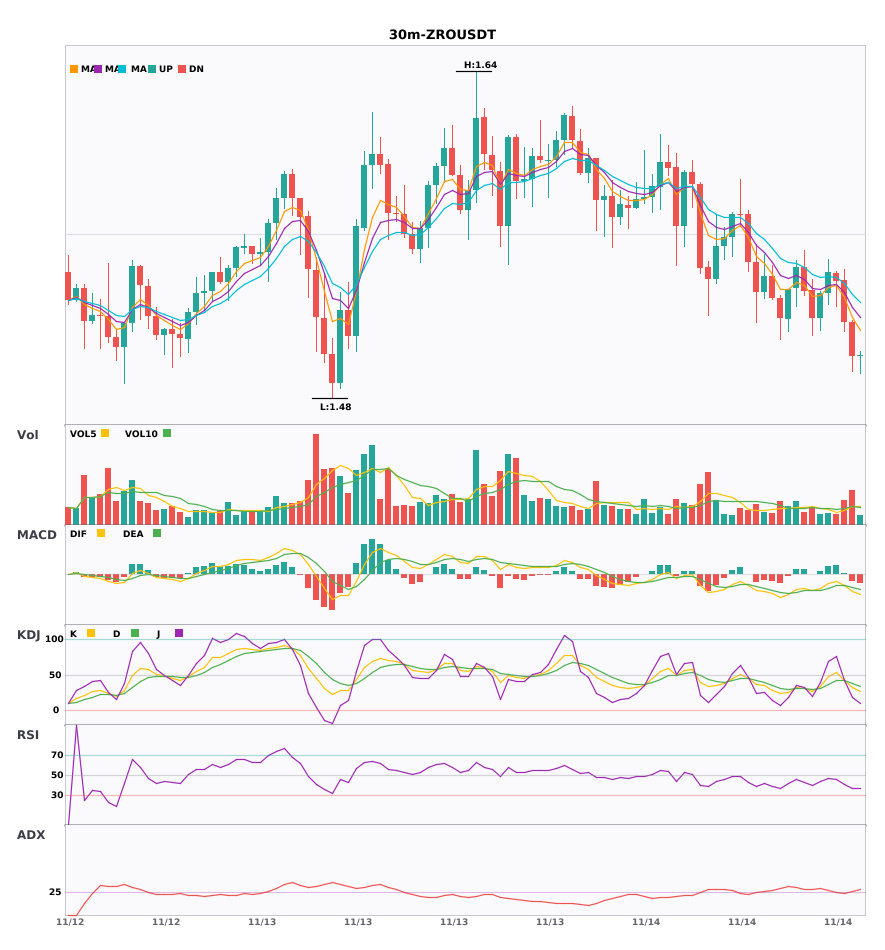
🟢 $ZRO 30-minute bearish signal
⚠️Technical analysis: 30-minute entry signal confirmed in confluence with the 4-hour bearish trend. Green bars expand after the MACD bearish crossover; moving averages diverge bearishly; KDJ is weak, with K crossing below D. Volume is up 1.9x.
📢Market update: Binance has completed the migration of Stargate Finance (STG) tokens to LayerZero (ZRO).
════════════════════
🔔 Follow for firsthand market alerts 🔔
#多周期共振 #VIRTUAL #PENGU #ZRO
📌 When trading, check whether the candlestick pattern meets your criteria
$VIRTUAL /$PENGU /$ZRO 30 minutes just turned bearish; 4-hour bearish trend confirmed 🔥
════════════════════
🟢 $VIRTUAL 30-minute bearish signal
⚠️Technical analysis: 4-hour bearish trend and 30-minute entry signal confirmed in confluence! MACD bearish crossover below zero with rising volume; green bars continue to grow. Moving averages have just formed a bearish alignment and are pointing downward. KDJ is weak, with bears in control. Volume is up 2.2x.
════════════════════
🟢 $PENGU 30-minute bearish signal
⚠️Technical analysis: 4-hour and 30-minute bearish signals confirmed in confluence | Green bars expand after MACD bearish crossover | Moving averages diverge downward in a bearish alignment | KDJ is weak, with K below D | Volume is up 5.1x
════════════════════
🟢 $ZRO 30-minute bearish signal
⚠️Technical analysis: 30-minute entry signal confirmed in confluence with the 4-hour bearish trend. Green bars expand after the MACD bearish crossover; moving averages diverge bearishly; KDJ is weak, with K crossing below D. Volume is up 1.9x.
📢Market update: Binance has completed the migration of Stargate Finance (STG) tokens to LayerZero (ZRO).
════════════════════
🔔 Follow for firsthand market alerts 🔔
#多周期共振 #VIRTUAL #PENGU #ZRO
📌 When trading, check whether the candlestick pattern meets your criteria
════════════════════
🟢 $VIRTUAL 30-minute bearish signal
⚠️Technical analysis: 4-hour bearish trend and 30-minute entry signal confirmed in confluence! MACD bearish crossover below zero with rising volume; green bars continue to grow. Moving averages have just formed a bearish alignment and are pointing downward. KDJ is weak, with bears in control. Volume is up 2.2x.
════════════════════
🟢 $PENGU 30-minute bearish signal
⚠️Technical analysis: 4-hour and 30-minute bearish signals confirmed in confluence | Green bars expand after MACD bearish crossover | Moving averages diverge downward in a bearish alignment | KDJ is weak, with K below D | Volume is up 5.1x
════════════════════
🟢 $ZRO 30-minute bearish signal
⚠️Technical analysis: 30-minute entry signal confirmed in confluence with the 4-hour bearish trend. Green bars expand after the MACD bearish crossover; moving averages diverge bearishly; KDJ is weak, with K crossing below D. Volume is up 1.9x.
📢Market update: Binance has completed the migration of Stargate Finance (STG) tokens to LayerZero (ZRO).
════════════════════
🔔 Follow for firsthand market alerts 🔔
#多周期共振 #VIRTUAL #PENGU #ZRO
📌 When trading, check whether the candlestick pattern meets your criteria
27
·
--
30-minute bearish alert for 3 coins: $VIRTUAL/$ZRO/$SOL🔥
════════════════════
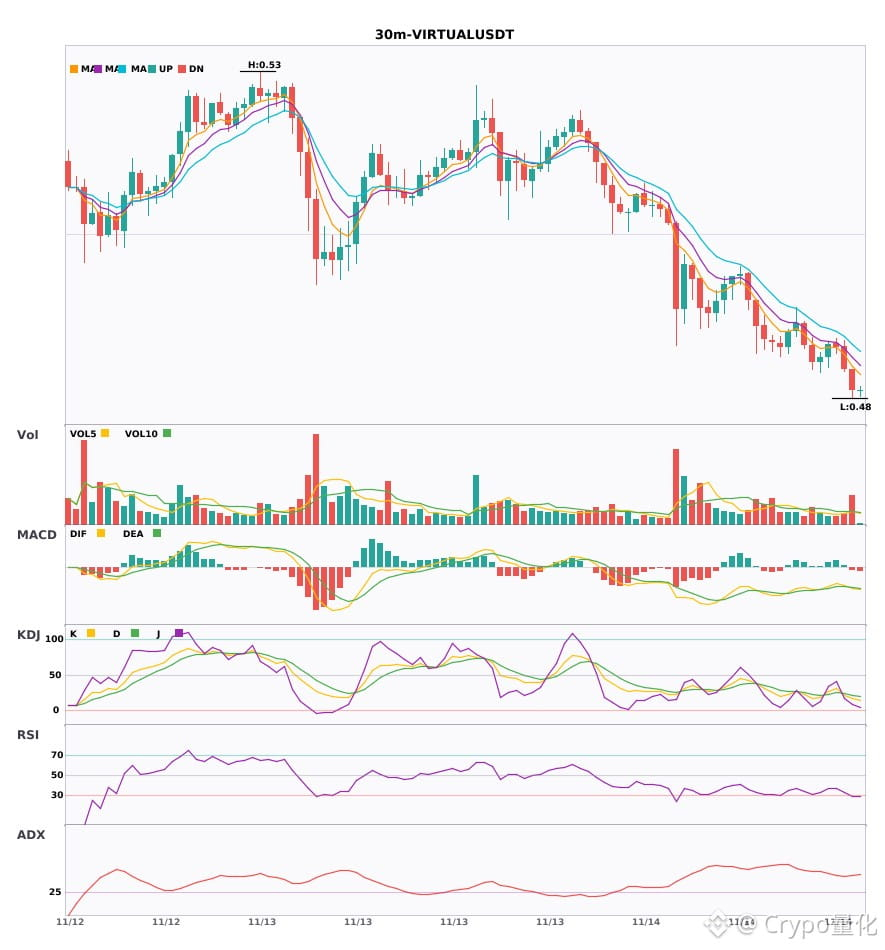
🟢 $VIRTUAL 30-minute bearish signal
⚠️Technical analysis: Strong trend (ADX 42), MACD bearish crossover below zero with rising volume, moving averages bearishly aligned and diverging downward, KDJ weak in the lower range (K17.6 D22.0), volume up 2.2x; bears are in control.
════════════════════
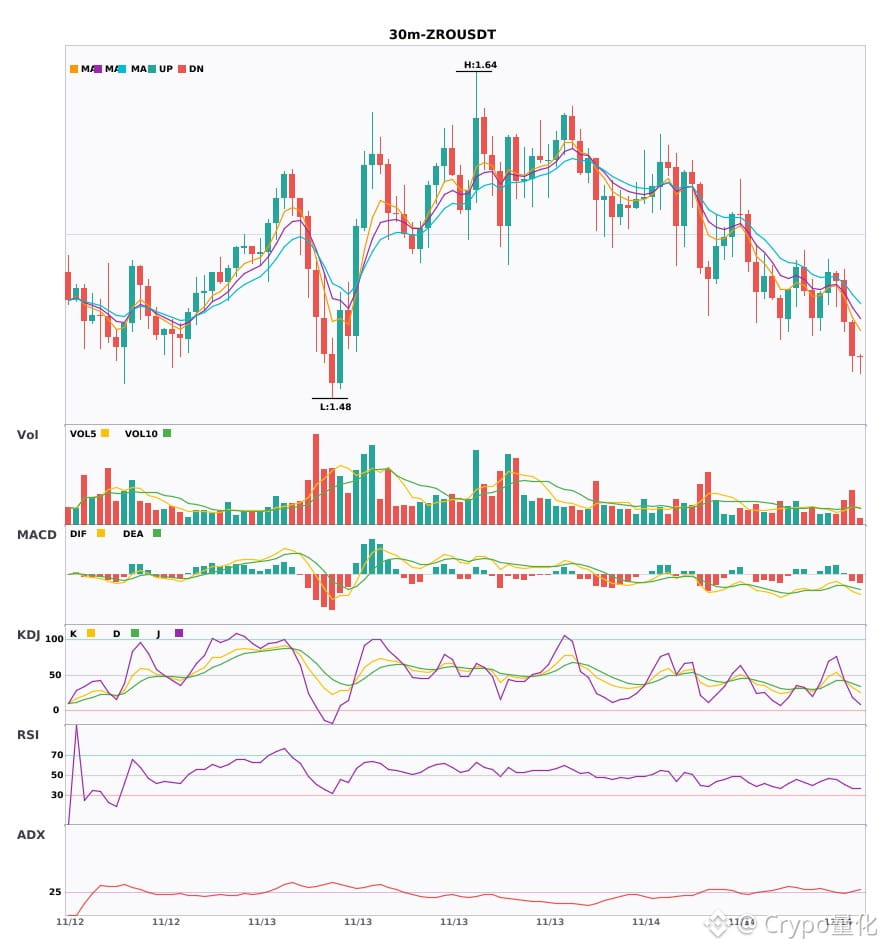
🟢 $ZRO 30-minute bearish signal
⚠️Technical analysis: The ADX trend has just formed and is tradeable. After the MACD bearish crossover, the green bars are getting longer, signaling stronger bearish momentum. Moving averages are bearishly aligned and trending downward. KDJ is weak (K32.2 D38.7), with volume up 1.9x.
📢Market update: Binance has completed the migration of Stargate Finance (STG) tokens to LayerZero (ZRO).
════════════════════
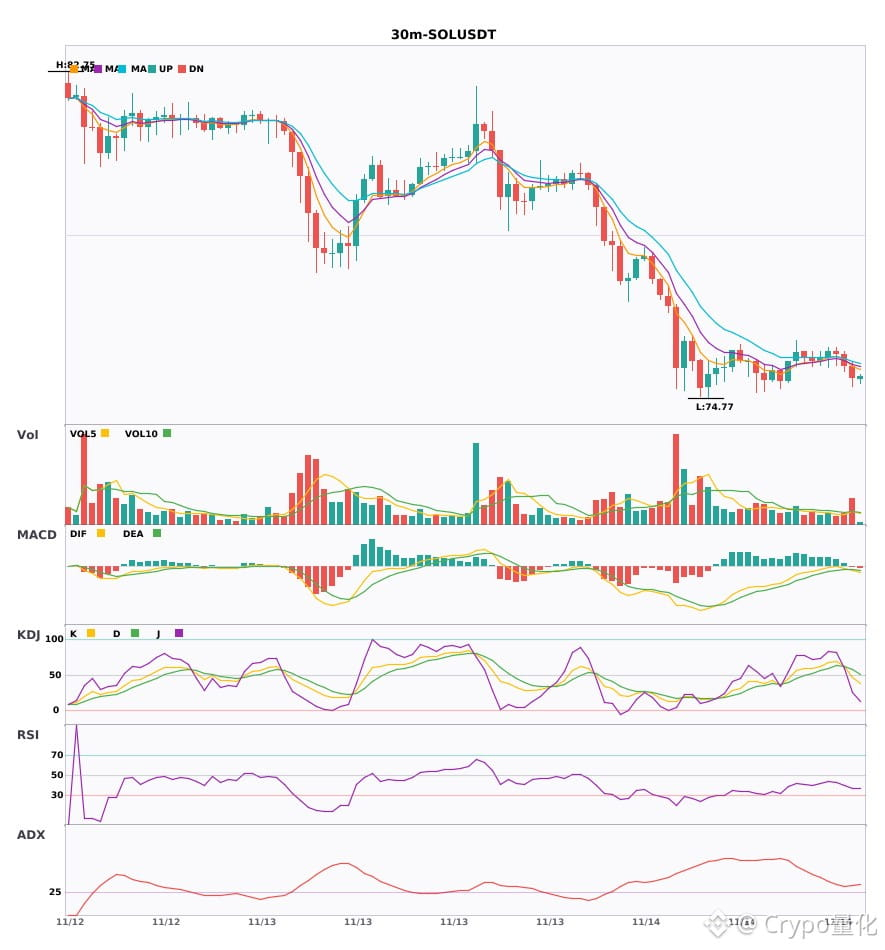
🟢 $SOL 30-minute bearish signal
⚠️Technical analysis: The ADX trend has just formed at 27 and is tradeable. MACD bearish crossover below zero signals accelerating bearish momentum. EMA5 crossed below EMA8, turning bearish in the short term. Volume is up 2x.
════════════════════
🔔 Follow for first-hand market movement alerts 🔔
#技术分析 #VIRTUAL #ZRO #SOL
📌 When trading, pay attention to whether the candlestick pattern confirms the signal
30-minute bearish alert for 3 coins: $VIRTUAL /$ZRO /$SOL 🔥
════════════════════
🟢 $VIRTUAL 30-minute bearish signal
⚠️Technical analysis: Strong trend (ADX 42), MACD bearish crossover below zero with rising volume, moving averages bearishly aligned and diverging downward, KDJ weak in the lower range (K17.6 D22.0), volume up 2.2x; bears are in control.
════════════════════
🟢 $ZRO 30-minute bearish signal
⚠️Technical analysis: The ADX trend has just formed and is tradeable. After the MACD bearish crossover, the green bars are getting longer, signaling stronger bearish momentum. Moving averages are bearishly aligned and trending downward. KDJ is weak (K32.2 D38.7), with volume up 1.9x.
📢Market update: Binance has completed the migration of Stargate Finance (STG) tokens to LayerZero (ZRO).
════════════════════
🟢 $SOL 30-minute bearish signal
⚠️Technical analysis: The ADX trend has just formed at 27 and is tradeable. MACD bearish crossover below zero signals accelerating bearish momentum. EMA5 crossed below EMA8, turning bearish in the short term. Volume is up 2x.
════════════════════
🔔 Follow for first-hand market movement alerts 🔔
#技术分析 #VIRTUAL #ZRO #SOL
📌 When trading, pay attention to whether the candlestick pattern confirms the signal
════════════════════
🟢 $VIRTUAL 30-minute bearish signal
⚠️Technical analysis: Strong trend (ADX 42), MACD bearish crossover below zero with rising volume, moving averages bearishly aligned and diverging downward, KDJ weak in the lower range (K17.6 D22.0), volume up 2.2x; bears are in control.
════════════════════
🟢 $ZRO 30-minute bearish signal
⚠️Technical analysis: The ADX trend has just formed and is tradeable. After the MACD bearish crossover, the green bars are getting longer, signaling stronger bearish momentum. Moving averages are bearishly aligned and trending downward. KDJ is weak (K32.2 D38.7), with volume up 1.9x.
📢Market update: Binance has completed the migration of Stargate Finance (STG) tokens to LayerZero (ZRO).
════════════════════
🟢 $SOL 30-minute bearish signal
⚠️Technical analysis: The ADX trend has just formed at 27 and is tradeable. MACD bearish crossover below zero signals accelerating bearish momentum. EMA5 crossed below EMA8, turning bearish in the short term. Volume is up 2x.
════════════════════
🔔 Follow for first-hand market movement alerts 🔔
#技术分析 #VIRTUAL #ZRO #SOL
📌 When trading, pay attention to whether the candlestick pattern confirms the signal
16
·
--
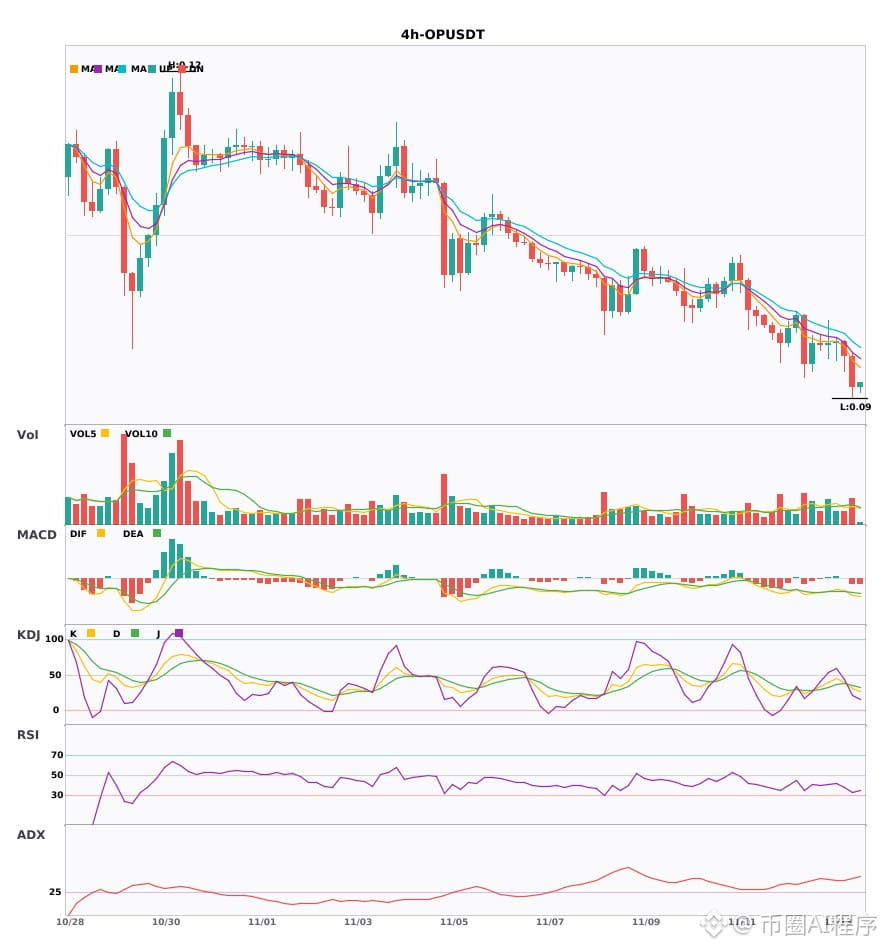
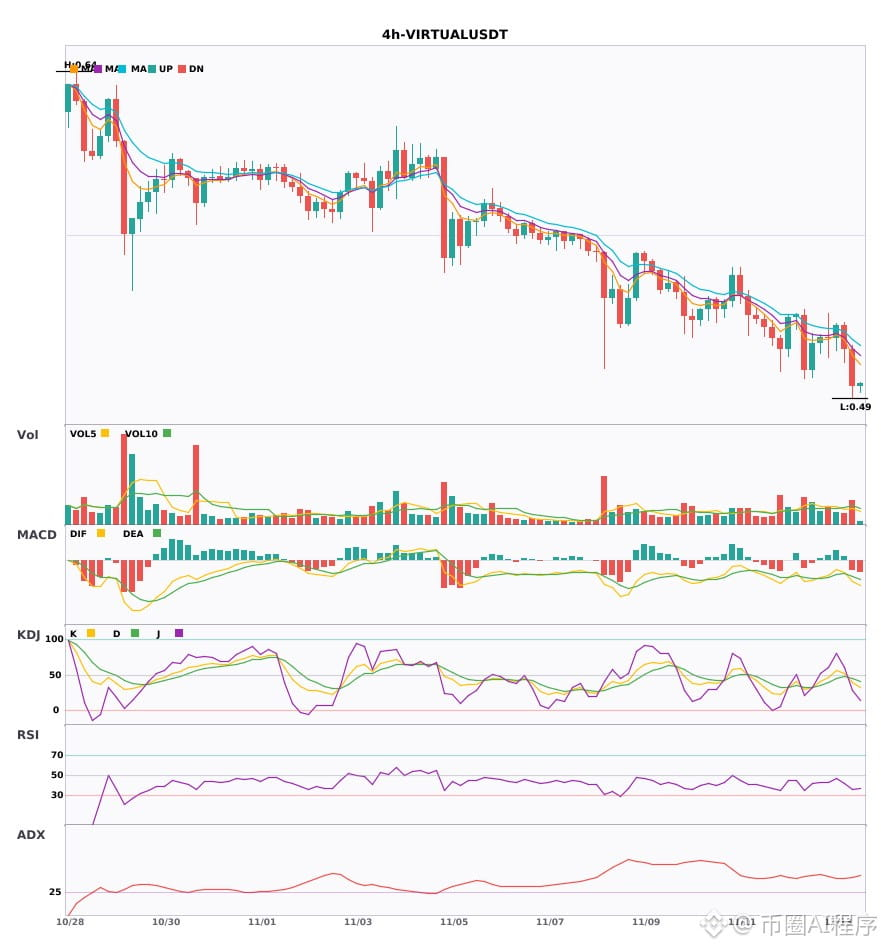
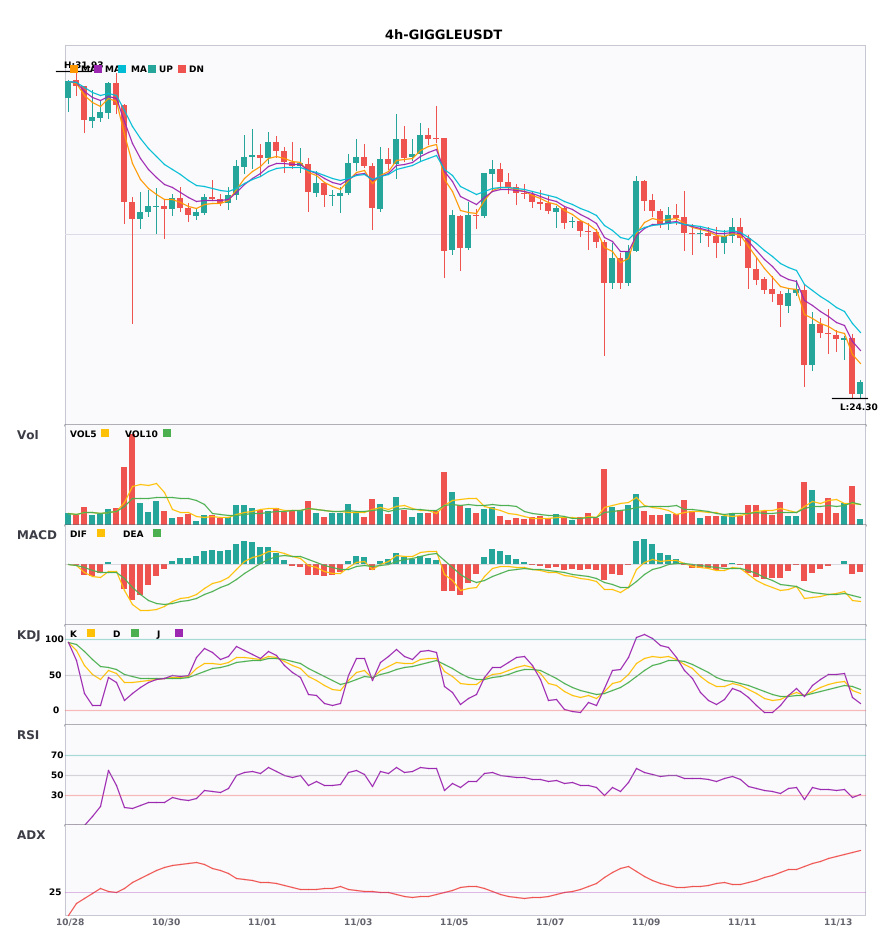
$OP $VIRTUAL $GIGGLE Both the daily and 4-hour charts have formed death crosses and turned bearish; multi-timeframe confluence points to further downside 🔥
════════════════════
🟢 $OP 4-hour bearish signal
⚠️ Technical analysis: Bearish confluence confirmed on the 4-hour and daily charts! MACD death cross with expanding green bars; moving averages are bearishly aligned and diverging downward. KDJ death cross, not yet oversold. Volume up 1.3x. The trend favors further downside.
════════════════════
🟢 $VIRTUAL 4-hour bearish signal
⚠️ Technical analysis: Multi-timeframe confluence points to further downside: 4-hour MACD death cross below zero, with expanding green bars accelerating downward; KDJ death cross, not yet oversold; moving averages bearishly aligned. Daily bearish confluence confirmed; bearish outlook in the short term.
════════════════════
🟢 $GIGGLE 4-hour bearish signal
⚠️ Technical analysis: Bearish confluence confirmed on the daily and 4-hour charts! MACD death cross on increased volume; moving averages are bearishly aligned and diverging downward. KDJ death cross, not yet oversold. Trading volume up 1.7x. Bearish outlook.
════════════════════
🔔 Follow for first-hand market updates 🔔
#多周期共振 #OP #VIRTUAL #GIGGLE
📌 When trading, watch for whether the candlestick patterns confirm the signal
$OP $VIRTUAL $GIGGLE Both the daily and 4-hour charts have formed death crosses and turned bearish; multi-timeframe confluence points to further downside 🔥
════════════════════
🟢 $OP 4-hour bearish signal
⚠️ Technical analysis: Bearish confluence confirmed on the 4-hour and daily charts! MACD death cross with expanding green bars; moving averages are bearishly aligned and diverging downward. KDJ death cross, not yet oversold. Volume up 1.3x. The trend favors further downside.
════════════════════
🟢 $VIRTUAL 4-hour bearish signal
⚠️ Technical analysis: Multi-timeframe confluence points to further downside: 4-hour MACD death cross below zero, with expanding green bars accelerating downward; KDJ death cross, not yet oversold; moving averages bearishly aligned. Daily bearish confluence confirmed; bearish outlook in the short term.
════════════════════
🟢 $GIGGLE 4-hour bearish signal
⚠️ Technical analysis: Bearish confluence confirmed on the daily and 4-hour charts! MACD death cross on increased volume; moving averages are bearishly aligned and diverging downward. KDJ death cross, not yet oversold. Trading volume up 1.7x. Bearish outlook.
════════════════════
🔔 Follow for first-hand market updates 🔔
#多周期共振 #OP #VIRTUAL #GIGGLE
📌 When trading, watch for whether the candlestick patterns confirm the signal
════════════════════
🟢 $OP 4-hour bearish signal
⚠️ Technical analysis: Bearish confluence confirmed on the 4-hour and daily charts! MACD death cross with expanding green bars; moving averages are bearishly aligned and diverging downward. KDJ death cross, not yet oversold. Volume up 1.3x. The trend favors further downside.
════════════════════
🟢 $VIRTUAL 4-hour bearish signal
⚠️ Technical analysis: Multi-timeframe confluence points to further downside: 4-hour MACD death cross below zero, with expanding green bars accelerating downward; KDJ death cross, not yet oversold; moving averages bearishly aligned. Daily bearish confluence confirmed; bearish outlook in the short term.
════════════════════
🟢 $GIGGLE 4-hour bearish signal
⚠️ Technical analysis: Bearish confluence confirmed on the daily and 4-hour charts! MACD death cross on increased volume; moving averages are bearishly aligned and diverging downward. KDJ death cross, not yet oversold. Trading volume up 1.7x. Bearish outlook.
════════════════════
🔔 Follow for first-hand market updates 🔔
#多周期共振 #OP #VIRTUAL #GIGGLE
📌 When trading, watch for whether the candlestick patterns confirm the signal
48

·
--
#VIRTUAL /USDT ( LONG )
$VIRTUAL
{future}(VIRTUALUSDT)
Leverage 👉 20X to 25X
Entry ➡️ 0.5355 - 0.5368
💠 Targets :- 0.5417 | 0.5468 | 0.5531 | 0.5583 | 0.5636 | 0.5708
Stoploss = 0.5204
#VIRTUAL /USDT ( LONG )
$VIRTUAL
Leverage 👉 20X to 25X
Entry ➡️ 0.5355 - 0.5368
💠 Targets :- 0.5417 | 0.5468 | 0.5531 | 0.5583 | 0.5636 | 0.5708
Stoploss = 0.5204
$VIRTUAL
Leverage 👉 20X to 25X
Entry ➡️ 0.5355 - 0.5368
💠 Targets :- 0.5417 | 0.5468 | 0.5531 | 0.5583 | 0.5636 | 0.5708
Stoploss = 0.5204
78
·
--
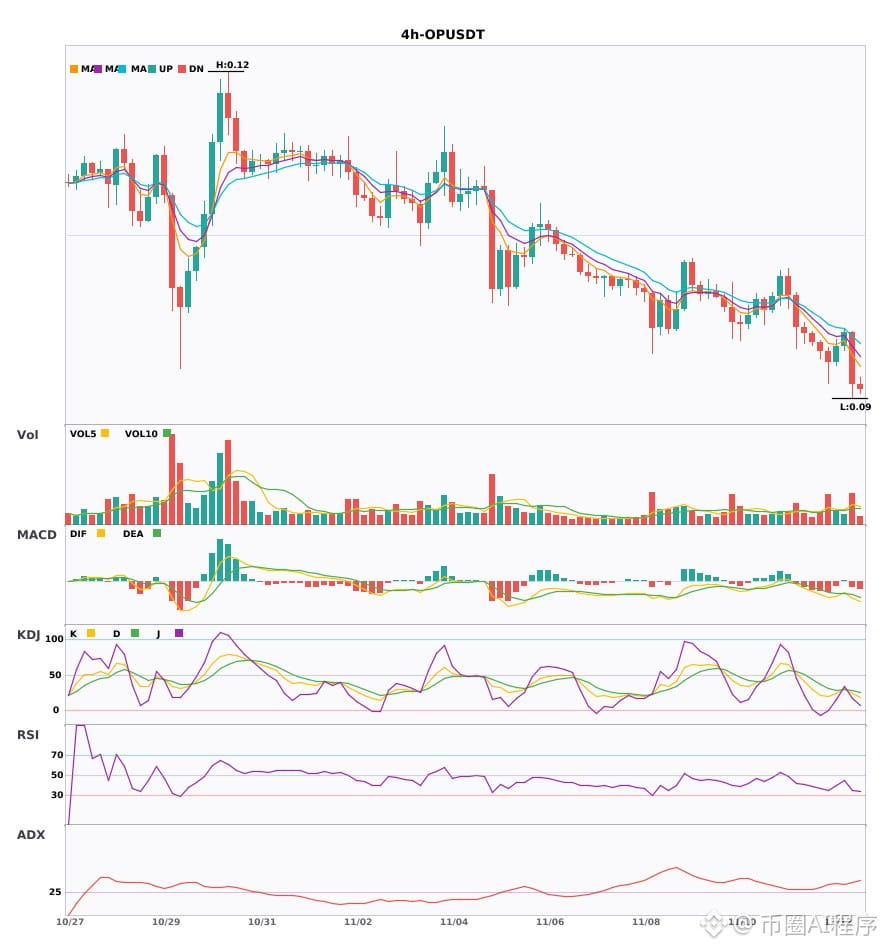
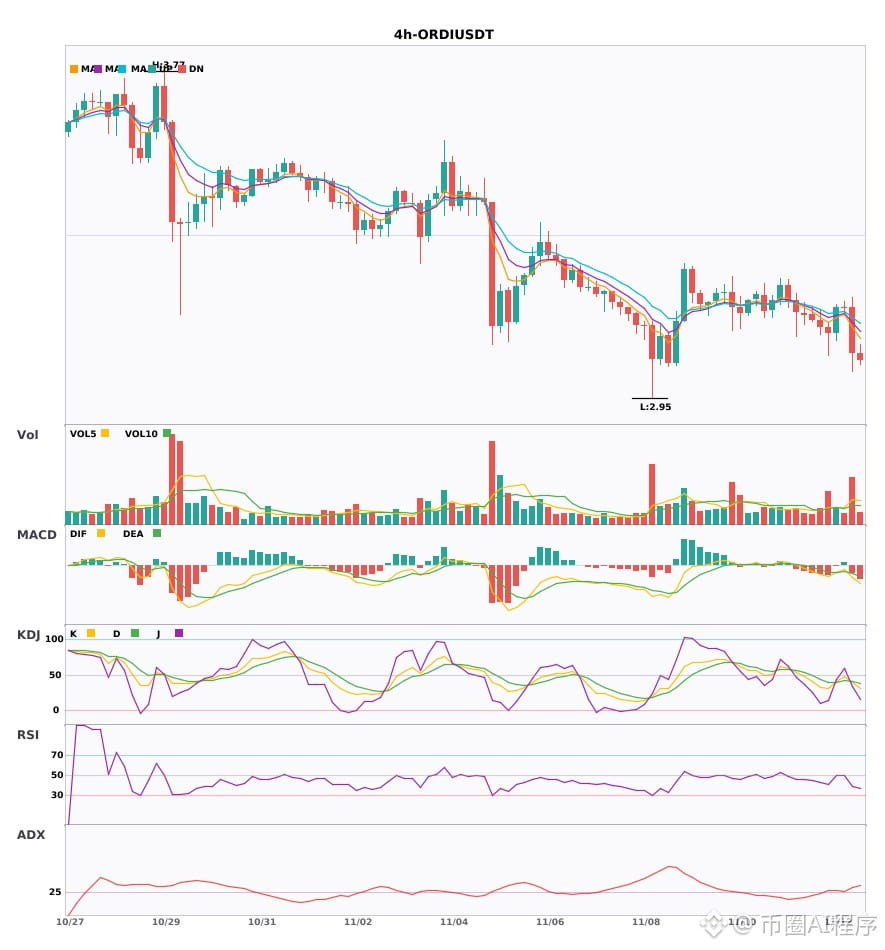
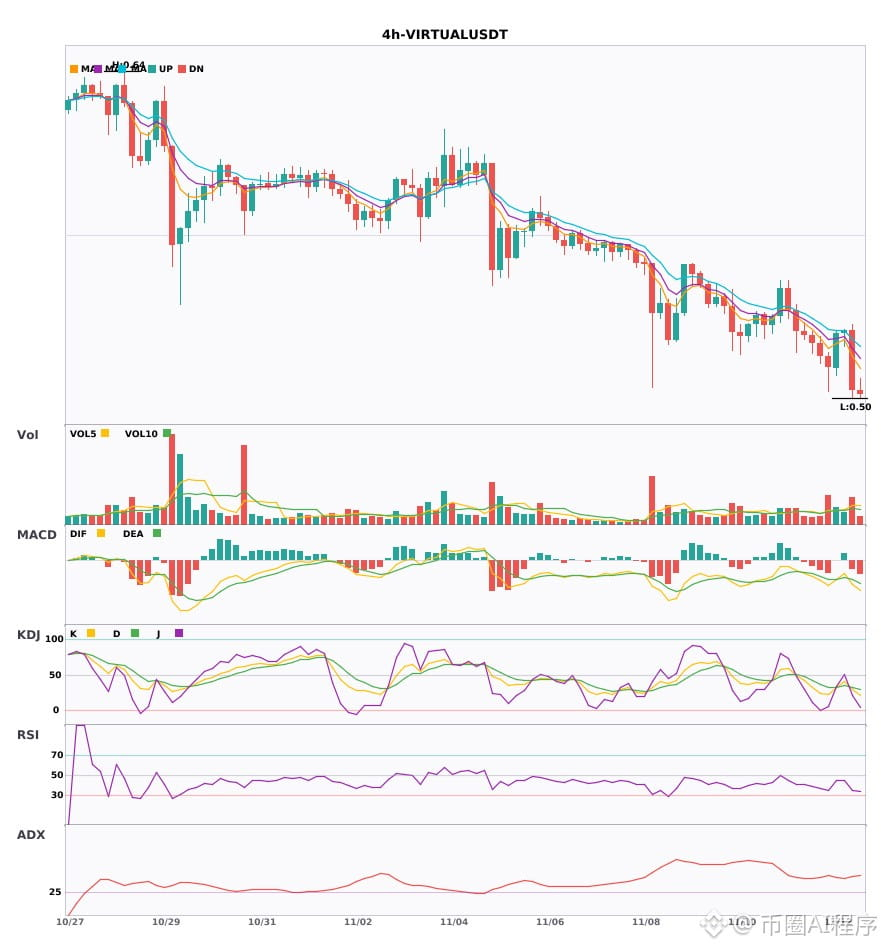
$OP/$ORDI/$VIRTUAL 4-hour weakness, daily bearish confirmation 🔥
════════════════════
🟢 $OP 4-hour bearish signal
⚠️Technical analysis: The 4-hour MACD bearish crossover below zero is accelerating; moving averages are bearishly aligned; the KDJ bearish crossover has not reached the oversold zone; volume is 1.9x higher. Daily bearish confluence confirmed; multiple timeframes align to the downside.
════════════════════
🟢 $ORDI 4-hour bearish signal
⚠️Technical analysis: Multi-timeframe confluence supports a short: the 4-hour MACD bearish crossover below zero is accompanied by increased volume; moving averages are bearishly aligned and diverging downward; the KDJ bearish crossover is not yet oversold; volume is 2.4x higher. Daily bearish confluence confirmed.
════════════════════
🟢 $VIRTUAL 4-hour bearish signal
⚠️Technical analysis: Multi-timeframe confluence points lower! Daily bearish conditions and a 4-hour entry are confirmed in confluence. The MACD bearish crossover below zero is accelerating; moving averages are bearishly aligned and diverging; the KDJ bearish crossover is not yet oversold; volume is 1.7x higher.
════════════════════
🔔 Follow for first-hand market alerts 🔔
#多周期共振 #OP #ORDI #VIRTUAL
📌 When trading, check whether the candlestick pattern matches
$OP /$ORDI /$VIRTUAL 4-hour weakness, daily bearish confirmation 🔥
════════════════════
🟢 $OP 4-hour bearish signal
⚠️Technical analysis: The 4-hour MACD bearish crossover below zero is accelerating; moving averages are bearishly aligned; the KDJ bearish crossover has not reached the oversold zone; volume is 1.9x higher. Daily bearish confluence confirmed; multiple timeframes align to the downside.
════════════════════
🟢 $ORDI 4-hour bearish signal
⚠️Technical analysis: Multi-timeframe confluence supports a short: the 4-hour MACD bearish crossover below zero is accompanied by increased volume; moving averages are bearishly aligned and diverging downward; the KDJ bearish crossover is not yet oversold; volume is 2.4x higher. Daily bearish confluence confirmed.
════════════════════
🟢 $VIRTUAL 4-hour bearish signal
⚠️Technical analysis: Multi-timeframe confluence points lower! Daily bearish conditions and a 4-hour entry are confirmed in confluence. The MACD bearish crossover below zero is accelerating; moving averages are bearishly aligned and diverging; the KDJ bearish crossover is not yet oversold; volume is 1.7x higher.
════════════════════
🔔 Follow for first-hand market alerts 🔔
#多周期共振 #OP #ORDI #VIRTUAL
📌 When trading, check whether the candlestick pattern matches
════════════════════
🟢 $OP 4-hour bearish signal
⚠️Technical analysis: The 4-hour MACD bearish crossover below zero is accelerating; moving averages are bearishly aligned; the KDJ bearish crossover has not reached the oversold zone; volume is 1.9x higher. Daily bearish confluence confirmed; multiple timeframes align to the downside.
════════════════════
🟢 $ORDI 4-hour bearish signal
⚠️Technical analysis: Multi-timeframe confluence supports a short: the 4-hour MACD bearish crossover below zero is accompanied by increased volume; moving averages are bearishly aligned and diverging downward; the KDJ bearish crossover is not yet oversold; volume is 2.4x higher. Daily bearish confluence confirmed.
════════════════════
🟢 $VIRTUAL 4-hour bearish signal
⚠️Technical analysis: Multi-timeframe confluence points lower! Daily bearish conditions and a 4-hour entry are confirmed in confluence. The MACD bearish crossover below zero is accelerating; moving averages are bearishly aligned and diverging; the KDJ bearish crossover is not yet oversold; volume is 1.7x higher.
════════════════════
🔔 Follow for first-hand market alerts 🔔
#多周期共振 #OP #ORDI #VIRTUAL
📌 When trading, check whether the candlestick pattern matches
23

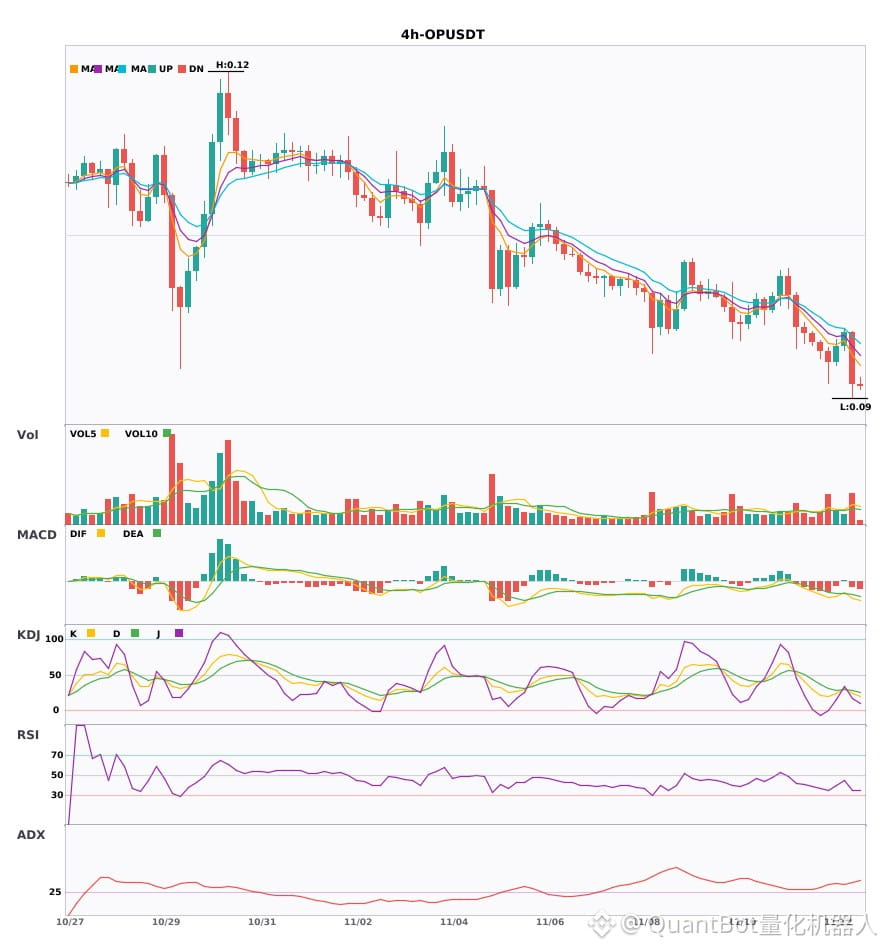
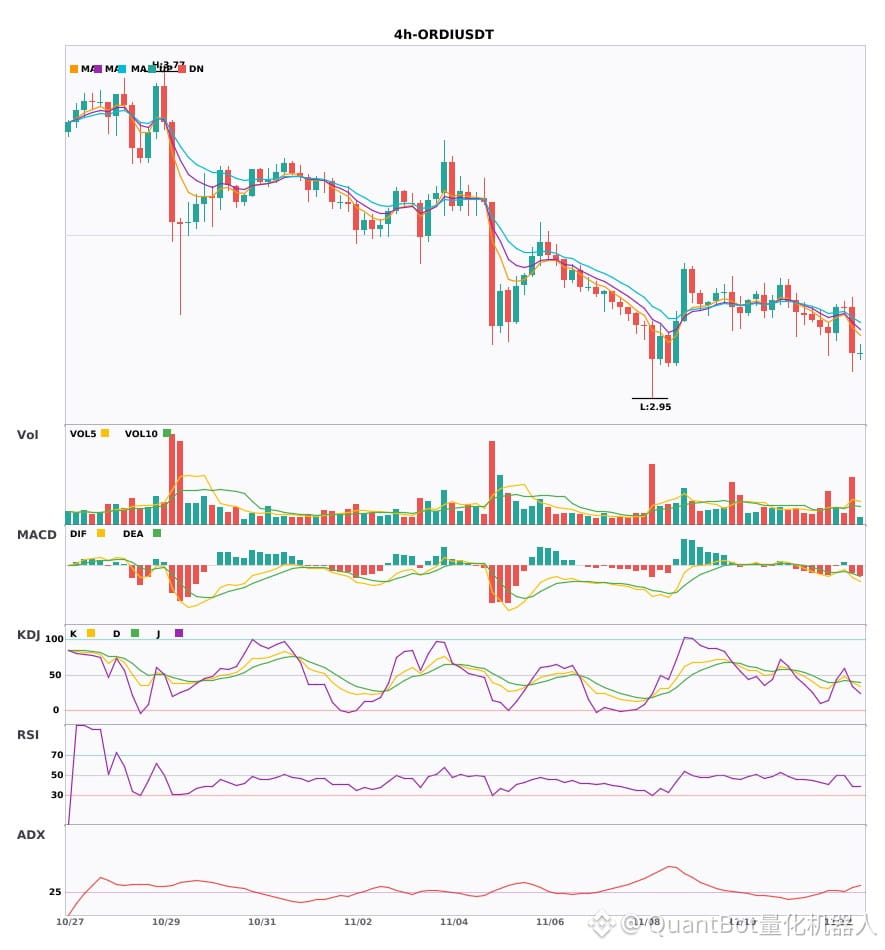
$OP/$ORDI/$VIRTUAL 4H-level multi-coin short confluence signal confirmed
📉 $OP | 4-hour short signal
━━━━━━━━━━━━━━━━━━
Technical analysis: ADX(38) indicates a strong trend, MACD has formed a bearish cross below zero, moving averages are bearishly aligned, KDJ has formed a bearish cross (K24.2/D27.7), and volume is up 1.9x; short-term outlook is bearish.
Price change: -5.2400%
📉 $ORDI | 4-hour short signal
━━━━━━━━━━━━━━━━━━
Technical analysis: ADX(32) indicates a clear trend, MACD's bearish cross below zero is accelerating downward, moving averages are bearishly aligned, KDJ has formed a bearish cross (K38.9/D41.5), and volume is up 2.4x; short-term outlook is bearish.
Price change: -3.5600%
📉 $VIRTUAL | 4-hour short signal
━━━━━━━━━━━━━━━━━━
Technical analysis: ADX(42) indicates a significant trend; MACD has formed a bearish cross below zero, accelerating downward; EMA5<EMA8<EMA13 are bearishly aligned; KDJ has formed a bearish cross (K29.2 D33.1), indicating a bearish short-term outlook; volume is up 1.7x.
Price change: -4.8400%
━━━━━━━━━━━━━━━━━━
#技术分析 #OP #ORDI #VIRTUAL
📌 The above content is for reference only and does not constitute investment advice
$OP /$ORDI /$VIRTUAL 4H-level multi-coin short confluence signal confirmed
📉 $OP | 4-hour short signal
━━━━━━━━━━━━━━━━━━
Technical analysis: ADX(38) indicates a strong trend, MACD has formed a bearish cross below zero, moving averages are bearishly aligned, KDJ has formed a bearish cross (K24.2/D27.7), and volume is up 1.9x; short-term outlook is bearish.
Price change: -5.2400%
📉 $ORDI | 4-hour short signal
━━━━━━━━━━━━━━━━━━
Technical analysis: ADX(32) indicates a clear trend, MACD's bearish cross below zero is accelerating downward, moving averages are bearishly aligned, KDJ has formed a bearish cross (K38.9/D41.5), and volume is up 2.4x; short-term outlook is bearish.
Price change: -3.5600%
📉 $VIRTUAL | 4-hour short signal
━━━━━━━━━━━━━━━━━━
Technical analysis: ADX(42) indicates a significant trend; MACD has formed a bearish cross below zero, accelerating downward; EMA5<EMA8<EMA13 are bearishly aligned; KDJ has formed a bearish cross (K29.2 D33.1), indicating a bearish short-term outlook; volume is up 1.7x.
Price change: -4.8400%
━━━━━━━━━━━━━━━━━━
#技术分析 #OP #ORDI #VIRTUAL
📌 The above content is for reference only and does not constitute investment advice
📉 $OP | 4-hour short signal
━━━━━━━━━━━━━━━━━━
Technical analysis: ADX(38) indicates a strong trend, MACD has formed a bearish cross below zero, moving averages are bearishly aligned, KDJ has formed a bearish cross (K24.2/D27.7), and volume is up 1.9x; short-term outlook is bearish.
Price change: -5.2400%
📉 $ORDI | 4-hour short signal
━━━━━━━━━━━━━━━━━━
Technical analysis: ADX(32) indicates a clear trend, MACD's bearish cross below zero is accelerating downward, moving averages are bearishly aligned, KDJ has formed a bearish cross (K38.9/D41.5), and volume is up 2.4x; short-term outlook is bearish.
Price change: -3.5600%
📉 $VIRTUAL | 4-hour short signal
━━━━━━━━━━━━━━━━━━
Technical analysis: ADX(42) indicates a significant trend; MACD has formed a bearish cross below zero, accelerating downward; EMA5<EMA8<EMA13 are bearishly aligned; KDJ has formed a bearish cross (K29.2 D33.1), indicating a bearish short-term outlook; volume is up 1.7x.
Price change: -4.8400%
━━━━━━━━━━━━━━━━━━
#技术分析 #OP #ORDI #VIRTUAL
📌 The above content is for reference only and does not constitute investment advice
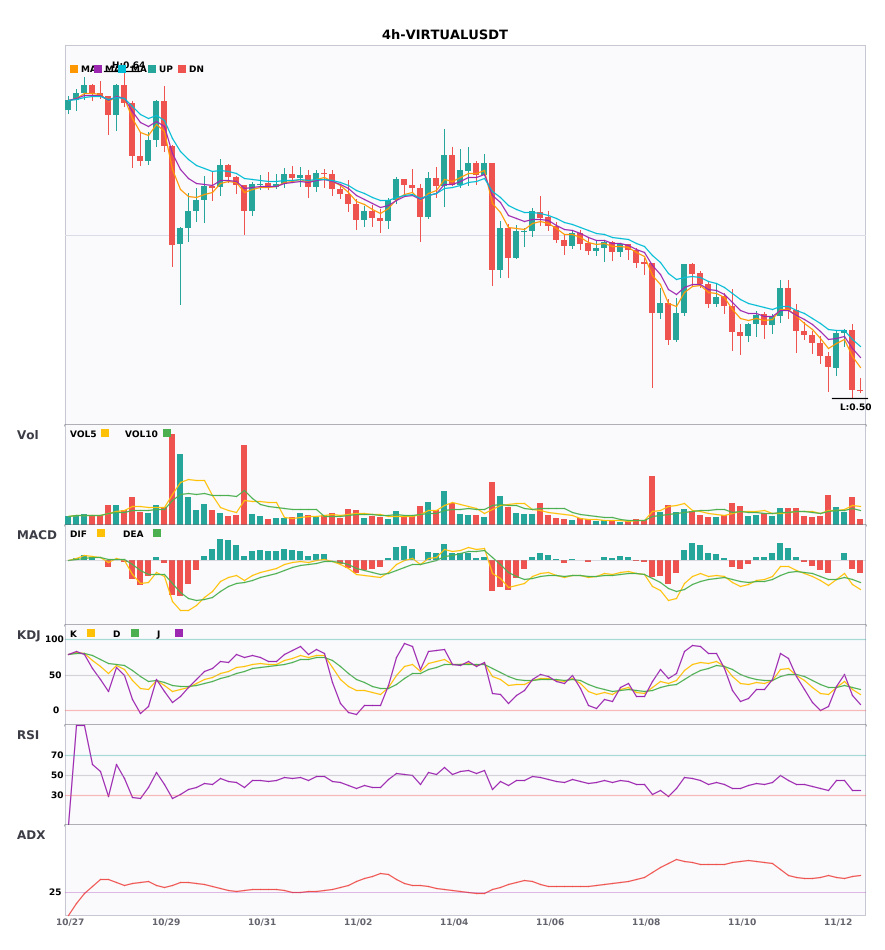
30

·
--
A whale spent $4.3 million buying altcoins from Binance, taking large positions in VIRTUAL, PEPE, and UNI—after the news broke, I checked the large orders first, then the price.
There may be a short-lived surge in interest, so think about your stop-loss before jumping in. When news breaks, the fastest money is often the first to react; institutions generally move a step later.
$VIRTUAL is currently trading at 0.5041.
#VIRTUAL
Personal notes, not investment advice.
A whale spent $4.3 million buying altcoins from Binance, taking large positions in VIRTUAL, PEPE, and UNI—after the news broke, I checked the large orders first, then the price.
There may be a short-lived surge in interest, so think about your stop-loss before jumping in. When news breaks, the fastest money is often the first to react; institutions generally move a step later.
$VIRTUAL is currently trading at 0.5041.
#VIRTUAL
Personal notes, not investment advice.
There may be a short-lived surge in interest, so think about your stop-loss before jumping in. When news breaks, the fastest money is often the first to react; institutions generally move a step later.
$VIRTUAL is currently trading at 0.5041.
#VIRTUAL
Personal notes, not investment advice.
37
·
--
$OP $ORDI $VIRTUAL 4-hour KDJ death cross, bearish moving average alignment, short-term pressure 🔥
════════════════════
🟢 $OP 4-hour bearish signal
⚠️ Technical analysis: ADX surged to 38, indicating a strong trend. MACD death cross with expanding green bars; moving averages are bearishly aligned and trending downward. KDJ has also formed a death cross and is not yet oversold. Volume increased 1.9x; overall outlook is bearish.
════════════════════
🟢 $ORDI 4-hour bearish signal
⚠️ Technical analysis: ADX 32, indicating a very strong trend. MACD death cross below zero, accelerating bearish momentum. Moving averages are bearishly aligned and diverging downward. KDJ death cross, with K crossing below D and not yet oversold. Volume increased 2.4x; short-term outlook is bearish.
════════════════════
🟢 $VIRTUAL 4-hour bearish signal
⚠️ Technical analysis: ADX 42, indicating a very strong trend | MACD death cross below zero, accelerating bearish momentum | EMA bearishly aligned and trending downward | KDJ death cross, bearish signal | Volume up 1.7x
════════════════════
🔔 Follow for first-hand market moves 🔔
#技术分析 #OP #ORDI #VIRTUAL
📌 When trading, pay attention to whether the candlestick patterns confirm the signal
$OP $ORDI $VIRTUAL 4-hour KDJ death cross, bearish moving average alignment, short-term pressure 🔥
════════════════════
🟢 $OP 4-hour bearish signal
⚠️ Technical analysis: ADX surged to 38, indicating a strong trend. MACD death cross with expanding green bars; moving averages are bearishly aligned and trending downward. KDJ has also formed a death cross and is not yet oversold. Volume increased 1.9x; overall outlook is bearish.
════════════════════
🟢 $ORDI 4-hour bearish signal
⚠️ Technical analysis: ADX 32, indicating a very strong trend. MACD death cross below zero, accelerating bearish momentum. Moving averages are bearishly aligned and diverging downward. KDJ death cross, with K crossing below D and not yet oversold. Volume increased 2.4x; short-term outlook is bearish.
════════════════════
🟢 $VIRTUAL 4-hour bearish signal
⚠️ Technical analysis: ADX 42, indicating a very strong trend | MACD death cross below zero, accelerating bearish momentum | EMA bearishly aligned and trending downward | KDJ death cross, bearish signal | Volume up 1.7x
════════════════════
🔔 Follow for first-hand market moves 🔔
#技术分析 #OP #ORDI #VIRTUAL
📌 When trading, pay attention to whether the candlestick patterns confirm the signal
════════════════════
🟢 $OP 4-hour bearish signal
⚠️ Technical analysis: ADX surged to 38, indicating a strong trend. MACD death cross with expanding green bars; moving averages are bearishly aligned and trending downward. KDJ has also formed a death cross and is not yet oversold. Volume increased 1.9x; overall outlook is bearish.
════════════════════
🟢 $ORDI 4-hour bearish signal
⚠️ Technical analysis: ADX 32, indicating a very strong trend. MACD death cross below zero, accelerating bearish momentum. Moving averages are bearishly aligned and diverging downward. KDJ death cross, with K crossing below D and not yet oversold. Volume increased 2.4x; short-term outlook is bearish.
════════════════════
🟢 $VIRTUAL 4-hour bearish signal
⚠️ Technical analysis: ADX 42, indicating a very strong trend | MACD death cross below zero, accelerating bearish momentum | EMA bearishly aligned and trending downward | KDJ death cross, bearish signal | Volume up 1.7x
════════════════════
🔔 Follow for first-hand market moves 🔔
#技术分析 #OP #ORDI #VIRTUAL
📌 When trading, pay attention to whether the candlestick patterns confirm the signal
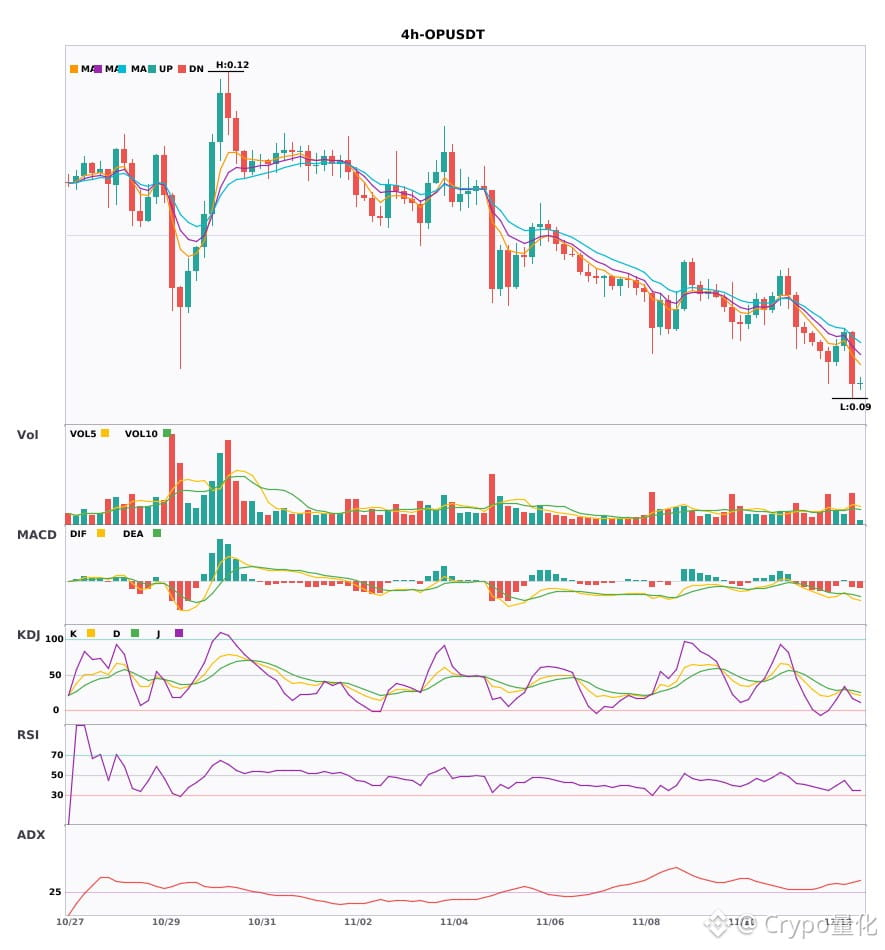
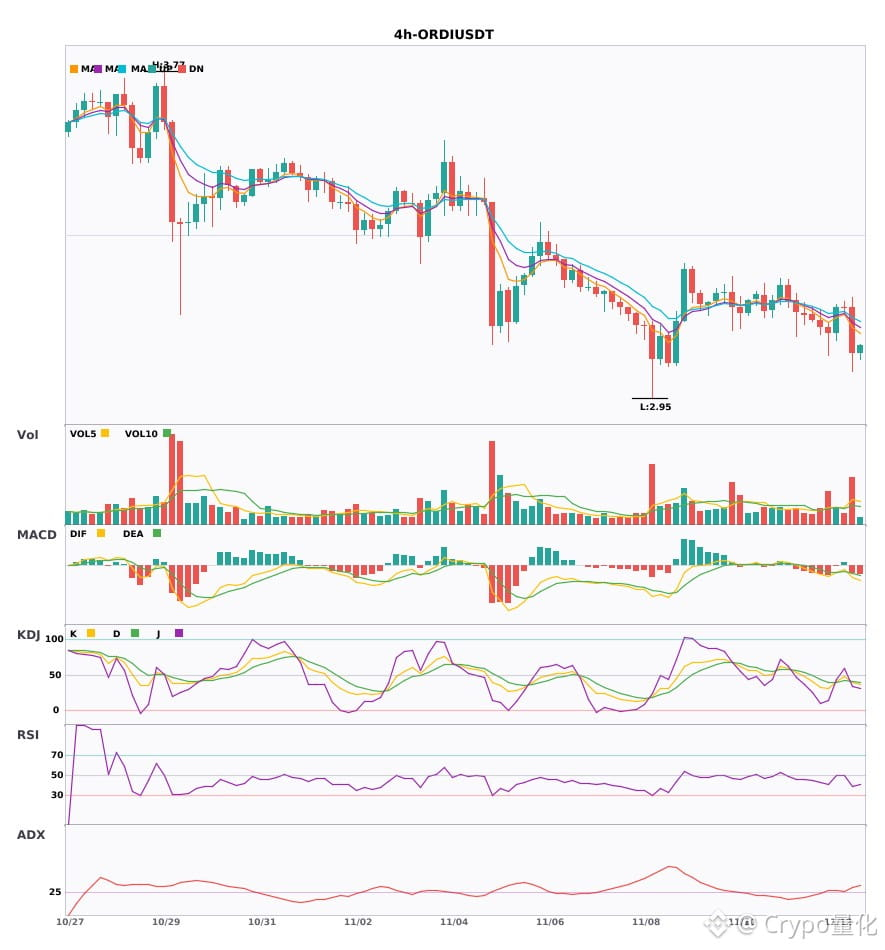
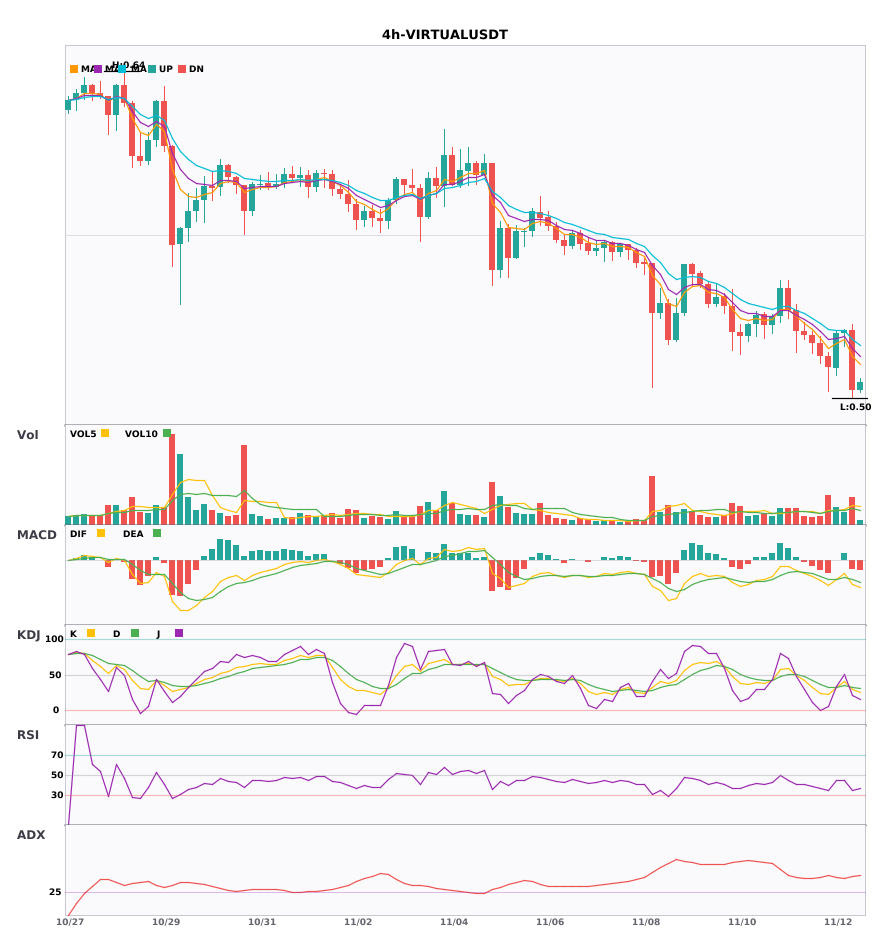
28
·
--
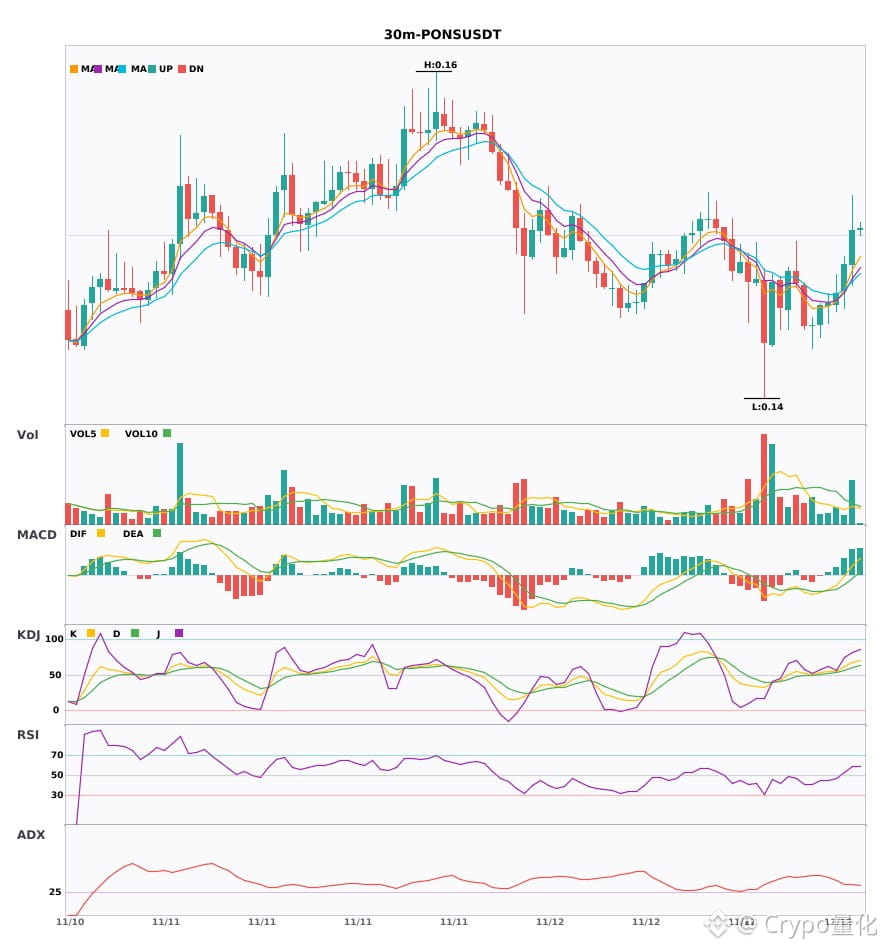
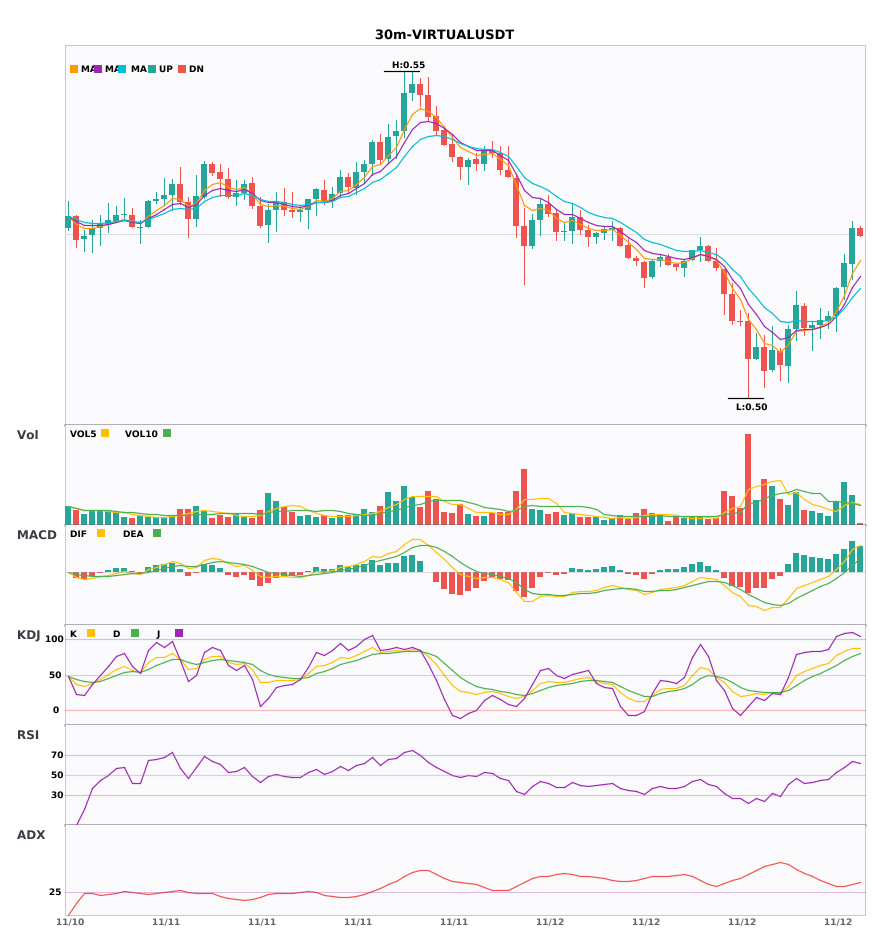
Two 30-minute bullish signals appeared simultaneously: $PONS / $VIRTUAL🔥
════════════════════
🔴 $PONS 30-minute bullish signal
⚠️Technical analysis: ADX(34) indicates a clear trending market | MACD DIF breaks above the zero line, signaling a bullish trend | EMA5 > EMA8 > EMA13, bullish alignment | KDJ is strong, with bulls in control (K: 67.2, D: 59.8) | Volume increased (2.0x)
════════════════════
🔴 $VIRTUAL 30-minute bullish signal
⚠️Technical analysis: ADX(30) indicates a trend is forming and may be worth trading | MACD is bullish, the trend is strong, and momentum is increasing | EMA5 > EMA8 > EMA13, bullish alignment | KDJ is strong, with bulls in control (K: 82.6, D: 70.2) | Volume increased (1.9x)
════════════════════
🔔 Follow for real-time market alerts 🔔
#技术分析 #PONS #VIRTUAL
📌 When trading, pay attention to whether the candlestick pattern confirms the signal
Two 30-minute bullish signals appeared simultaneously: $PONS / $VIRTUAL 🔥
════════════════════
🔴 $PONS 30-minute bullish signal
⚠️Technical analysis: ADX(34) indicates a clear trending market | MACD DIF breaks above the zero line, signaling a bullish trend | EMA5 > EMA8 > EMA13, bullish alignment | KDJ is strong, with bulls in control (K: 67.2, D: 59.8) | Volume increased (2.0x)
════════════════════
🔴 $VIRTUAL 30-minute bullish signal
⚠️Technical analysis: ADX(30) indicates a trend is forming and may be worth trading | MACD is bullish, the trend is strong, and momentum is increasing | EMA5 > EMA8 > EMA13, bullish alignment | KDJ is strong, with bulls in control (K: 82.6, D: 70.2) | Volume increased (1.9x)
════════════════════
🔔 Follow for real-time market alerts 🔔
#技术分析 #PONS #VIRTUAL
📌 When trading, pay attention to whether the candlestick pattern confirms the signal
════════════════════
🔴 $PONS 30-minute bullish signal
⚠️Technical analysis: ADX(34) indicates a clear trending market | MACD DIF breaks above the zero line, signaling a bullish trend | EMA5 > EMA8 > EMA13, bullish alignment | KDJ is strong, with bulls in control (K: 67.2, D: 59.8) | Volume increased (2.0x)
════════════════════
🔴 $VIRTUAL 30-minute bullish signal
⚠️Technical analysis: ADX(30) indicates a trend is forming and may be worth trading | MACD is bullish, the trend is strong, and momentum is increasing | EMA5 > EMA8 > EMA13, bullish alignment | KDJ is strong, with bulls in control (K: 82.6, D: 70.2) | Volume increased (1.9x)
════════════════════
🔔 Follow for real-time market alerts 🔔
#技术分析 #PONS #VIRTUAL
📌 When trading, pay attention to whether the candlestick pattern confirms the signal
15
Log in to explore more content
Join global crypto users on Binance Square
⚡️ Get latest and useful information about crypto.
💬 Trusted by the world’s largest crypto exchange.
👍 Discover real insights from verified creators.
Email / Phone number
Trending Topics
1
#WhoWillSucceedJensenHuangatNvidia?
141,210 views
1,530 Discussing
2
#WhatWillDriveCryptoandStocks’NextRebound?
532,013 views
3,371 Discussing
3
#BitcoinActiveSupplyInProfitDropsBelow45%
60,059 views
635 Discussing
4
#KavaSaysAbnormalActivityLimitedToKavaLend
32,711 views
357 Discussing
5
#USSpotXRPETFsSeeLargestWeeklyOutflowIn8Months
24,851 views
312 Discussing
6
#USPPIMissMayEaseBTCPressure
271,435 views
2,204 Discussing
7
#WORPTLetsTouristsConvertCryptoToThaiBaht
8,858 views
86 Discussing
8
#TONStrategyReports$23.97MQ3NetLoss
9,511 views
42 Discussing
9
#PolkadotCommunityApprovesNewStrategyWith97%Vote
25,441 views
284 Discussing
10
#dYdXPlansV9.9UpgradeToShiftUSDCToInjective
22,268 views
240 Discussing