

#ustradedefcitshrink
ustradedefcitshrink
1,347 views
13 Discussing
Hot
Latest

·
--
$ASTER ASTER short analysis
* Current price: roughly $0.67–$0.68 today, with different exchanges showing slightly different prices.
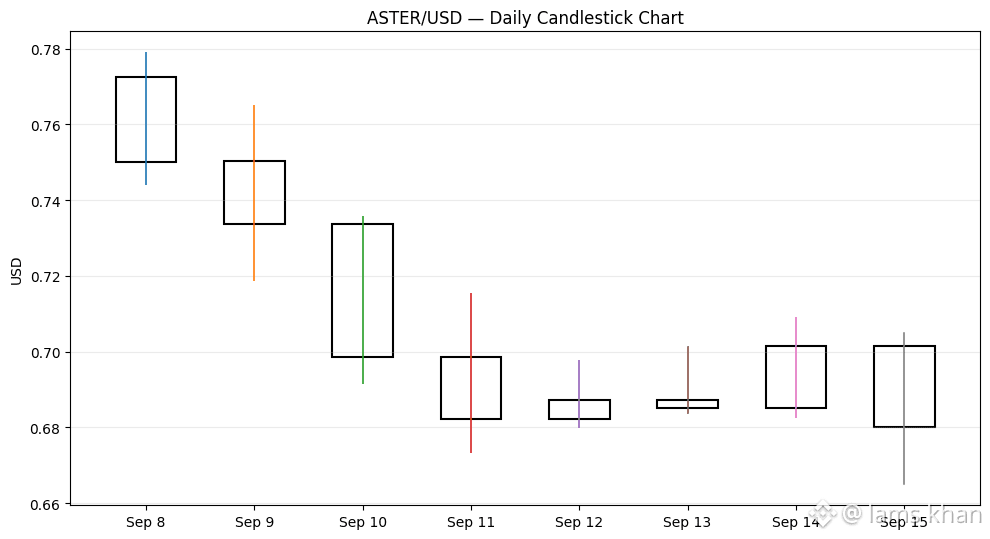
* ASTER has pulled back from around $0.77 on Sep 8 to about $0.68 on Sep 15, showing short-term selling pressure.
* The recent $0.665–$0.68 area is an important nearby price zone because recent lows have repeatedly appeared around there.
* The $0.70–$0.715 area is a nearby resistance zone based on recent daily highs. A move above it would change the short-term chart structure, but it would not by itself confirm a sustained trend.
* ASTER is still considerably below its reported $2.41 all-time high, so its historical volatility remains substantial.
ASTER/USDT on Binance
📊 ASTER candlestick chart
The chart above uses daily OHLC data for Sep 8–15, 2026 from Bitget.
1. ASTER is a cryptocurrency traded on major crypto exchanges.
2. Its recent price has been moving around the $0.67–$0.70 range.
3. The coin has experienced noticeable volatility in recent days.
4. ASTER fell from around $0.77 to below $0.70 during the recent period.
5. This indicates short-term selling pressure in the market.
6. The $0.665–$0.68 area can be observed as a recent support zone.
7. The $0.70–$0.715 area is a nearby resistance zone.
8. A break above resistance could indicate stronger short-term momentum.
9. A move below the recent support area could indicate further weakness.
10. ASTER has historically shown significant price volatility.
11. Its price remains well below its previous all-time high.
12. Overall, the current chart shows a short-term pullback with important support and resistance levels.
13. Traders should consider volume and broader market conditions along with the candlestick chart.
14. This analysis is for educational purposes and is not a buy or sell recommendation.
#USTradeDefcitShrink #ZTCBINANCETGE #WriteToEarnUpgrade #CPIWatch
$ASTER ASTER short analysis
* Current price: roughly $0.67–$0.68 today, with different exchanges showing slightly different prices.
* ASTER has pulled back from around $0.77 on Sep 8 to about $0.68 on Sep 15, showing short-term selling pressure.
* The recent $0.665–$0.68 area is an important nearby price zone because recent lows have repeatedly appeared around there.
* The $0.70–$0.715 area is a nearby resistance zone based on recent daily highs. A move above it would change the short-term chart structure, but it would not by itself confirm a sustained trend.
* ASTER is still considerably below its reported $2.41 all-time high, so its historical volatility remains substantial.
ASTER/USDT on Binance
📊 ASTER candlestick chart
The chart above uses daily OHLC data for Sep 8–15, 2026 from Bitget.
1. ASTER is a cryptocurrency traded on major crypto exchanges.
2. Its recent price has been moving around the $0.67–$0.70 range.
3. The coin has experienced noticeable volatility in recent days.
4. ASTER fell from around $0.77 to below $0.70 during the recent period.
5. This indicates short-term selling pressure in the market.
6. The $0.665–$0.68 area can be observed as a recent support zone.
7. The $0.70–$0.715 area is a nearby resistance zone.
8. A break above resistance could indicate stronger short-term momentum.
9. A move below the recent support area could indicate further weakness.
10. ASTER has historically shown significant price volatility.
11. Its price remains well below its previous all-time high.
12. Overall, the current chart shows a short-term pullback with important support and resistance levels.
13. Traders should consider volume and broader market conditions along with the candlestick chart.
14. This analysis is for educational purposes and is not a buy or sell recommendation.
#USTradeDefcitShrink #ZTCBINANCETGE #WriteToEarnUpgrade #CPIWatch
* Current price: roughly $0.67–$0.68 today, with different exchanges showing slightly different prices.
* ASTER has pulled back from around $0.77 on Sep 8 to about $0.68 on Sep 15, showing short-term selling pressure.
* The recent $0.665–$0.68 area is an important nearby price zone because recent lows have repeatedly appeared around there.
* The $0.70–$0.715 area is a nearby resistance zone based on recent daily highs. A move above it would change the short-term chart structure, but it would not by itself confirm a sustained trend.
* ASTER is still considerably below its reported $2.41 all-time high, so its historical volatility remains substantial.
ASTER/USDT on Binance
📊 ASTER candlestick chart
The chart above uses daily OHLC data for Sep 8–15, 2026 from Bitget.
1. ASTER is a cryptocurrency traded on major crypto exchanges.
2. Its recent price has been moving around the $0.67–$0.70 range.
3. The coin has experienced noticeable volatility in recent days.
4. ASTER fell from around $0.77 to below $0.70 during the recent period.
5. This indicates short-term selling pressure in the market.
6. The $0.665–$0.68 area can be observed as a recent support zone.
7. The $0.70–$0.715 area is a nearby resistance zone.
8. A break above resistance could indicate stronger short-term momentum.
9. A move below the recent support area could indicate further weakness.
10. ASTER has historically shown significant price volatility.
11. Its price remains well below its previous all-time high.
12. Overall, the current chart shows a short-term pullback with important support and resistance levels.
13. Traders should consider volume and broader market conditions along with the candlestick chart.
14. This analysis is for educational purposes and is not a buy or sell recommendation.
#USTradeDefcitShrink #ZTCBINANCETGE #WriteToEarnUpgrade #CPIWatch
239

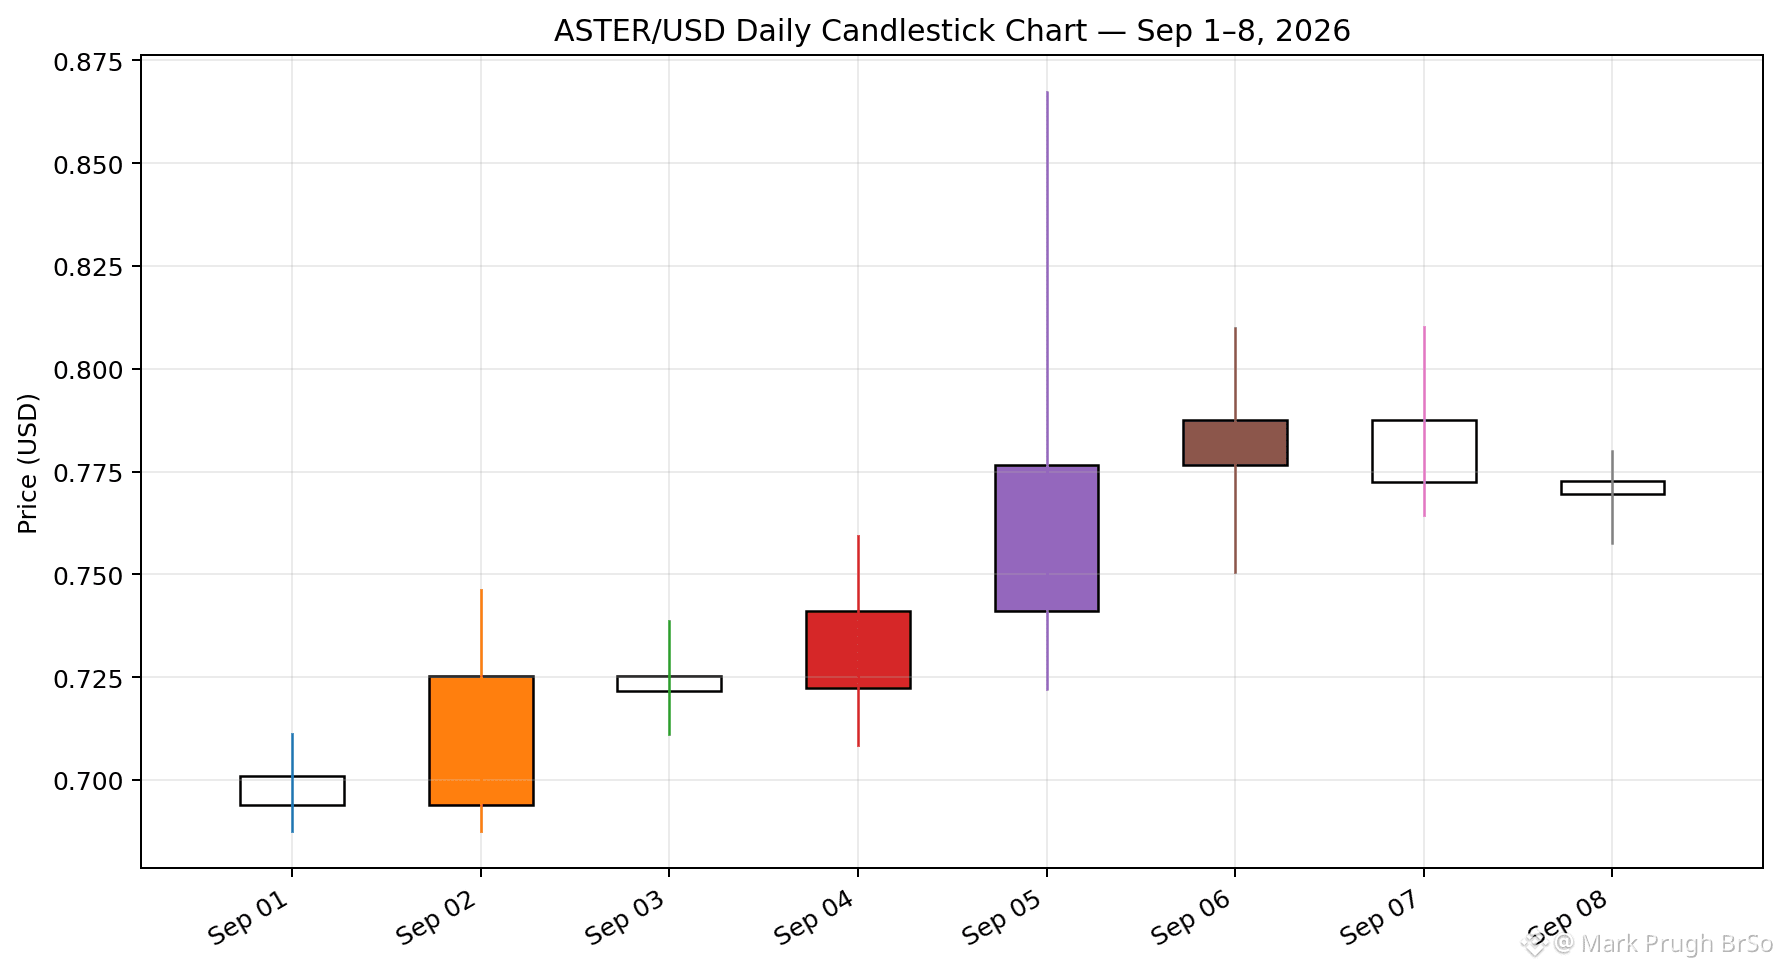
$ASTER Current price: around $0.77
Market cap: about $2.1B
Recent trend: ASTER has moved up strongly from around $0.69 on Sep 1 to the $0.77 area now.
Resistance: $0.80–$0.81 is an important near-term resistance zone.
Major resistance: around $0.86–$0.87, based on the Sep 5 high.
Support: around $0.75, then $0.72–$0.70.
Bullish scenario: If ASTER breaks and holds above $0.81, the next area to watch is roughly $0.86–$0.88.
Bearish scenario: A break below $0.75 could bring $0.72 and potentially $0.70 back into focus.
#USTradeDefcitShrink #ZTCBinanceTGE
$ASTER Current price: around $0.77
Market cap: about $2.1B
Recent trend: ASTER has moved up strongly from around $0.69 on Sep 1 to the $0.77 area now.
Resistance: $0.80–$0.81 is an important near-term resistance zone.
Major resistance: around $0.86–$0.87, based on the Sep 5 high.
Support: around $0.75, then $0.72–$0.70.
Bullish scenario: If ASTER breaks and holds above $0.81, the next area to watch is roughly $0.86–$0.88.
Bearish scenario: A break below $0.75 could bring $0.72 and potentially $0.70 back into focus.
#USTradeDefcitShrink #ZTCBinanceTGE
Market cap: about $2.1B
Recent trend: ASTER has moved up strongly from around $0.69 on Sep 1 to the $0.77 area now.
Resistance: $0.80–$0.81 is an important near-term resistance zone.
Major resistance: around $0.86–$0.87, based on the Sep 5 high.
Support: around $0.75, then $0.72–$0.70.
Bullish scenario: If ASTER breaks and holds above $0.81, the next area to watch is roughly $0.86–$0.88.
Bearish scenario: A break below $0.75 could bring $0.72 and potentially $0.70 back into focus.
#USTradeDefcitShrink #ZTCBinanceTGE
273

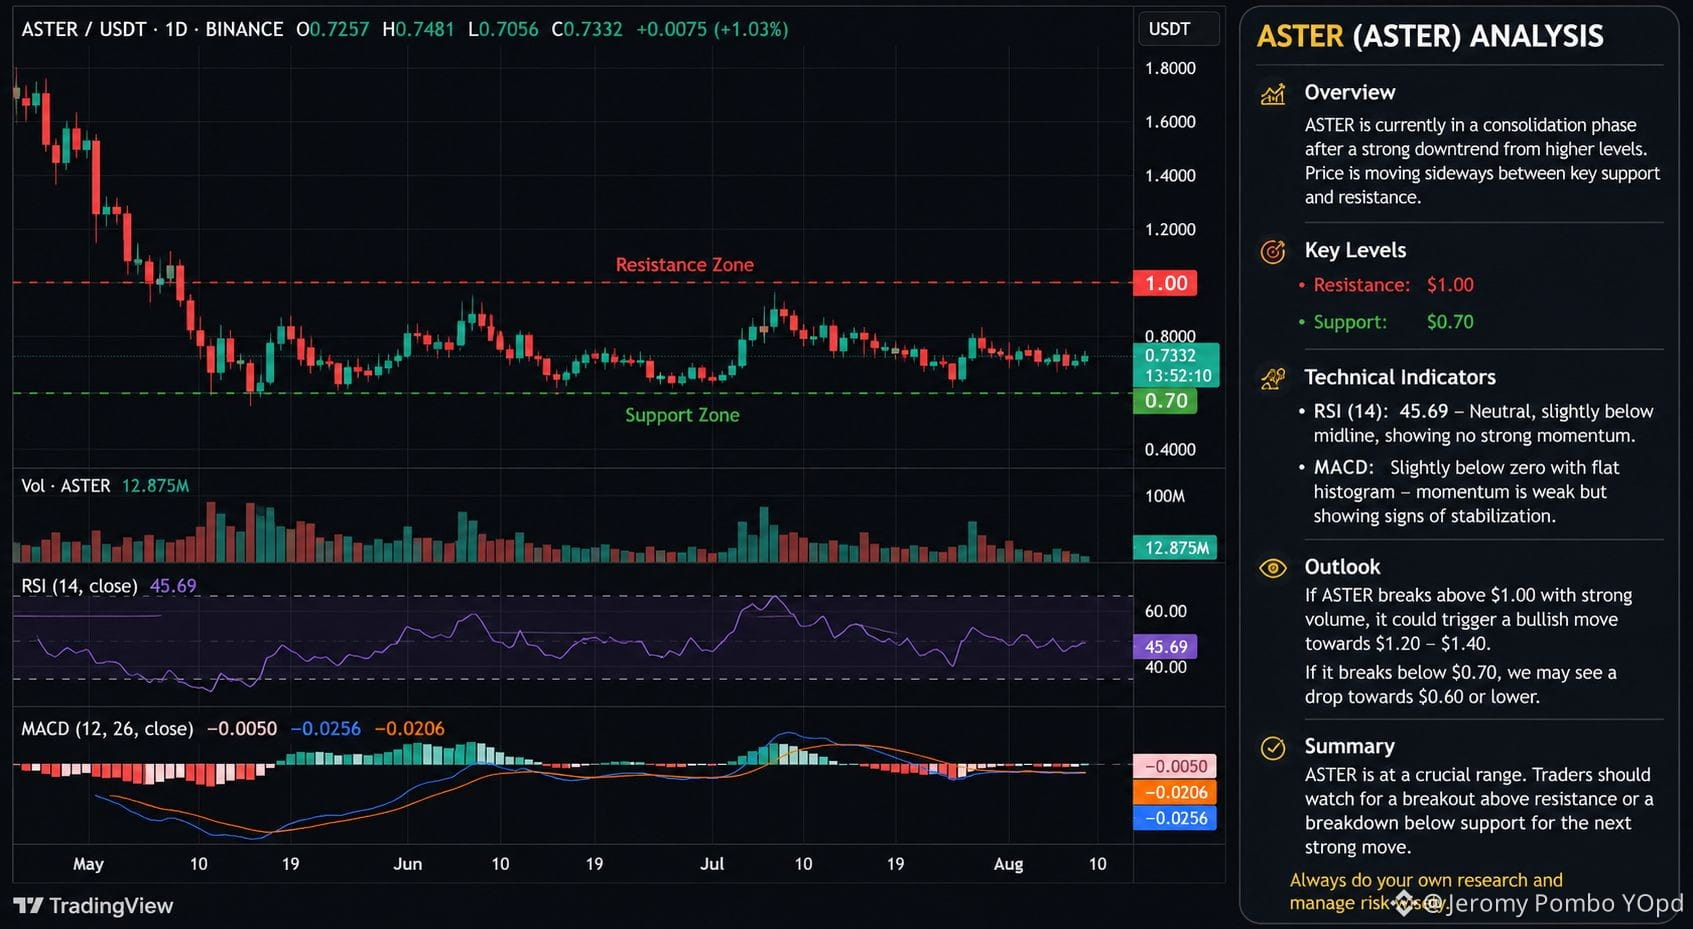
$ASTER ASTER is currently in a consolidation phase after a sharp decline. The price is trading around $0.70–0.75, with buyers and sellers in balance. �
CoinEx +1
Support: $0.70 is the key support level. A break below it could lead to further downside. �
CCN.com +1
Resistance: The first major resistance is around $1.00. A strong move above this level could signal renewed bullish momentum. �
CCN.com
Outlook: The project has strong DeFi and ecosystem development, but token unlocks and overall crypto market sentiment remain important risks. Short-term traders should watch for a breakout above resistance or a breakdown below support before entering. �
Price
1.05 ┤ │█│
1.00 ┤ │█│ █
0.95 ┤ █│ │█
0.90 ┤ │█│
0.85 ┤ █│
0.80 ┤ │█│
0.75 ┤ █│ █│ █│
0.70 ┼──────────────────────── Support
1 2 3 4 5 6 7
This sketch represents recent sideways price action around support. For a real-time candlestick chart with indicators (RSI, MACD, volume, etc.), you'll need data from a live exchange or charting platform.
#USTradeDefcitShrink
#ZTCBinanceTGE #writetoearnupgrate
$ASTER ASTER is currently in a consolidation phase after a sharp decline. The price is trading around $0.70–0.75, with buyers and sellers in balance. �
CoinEx +1
Support: $0.70 is the key support level. A break below it could lead to further downside. �
CCN.com +1
Resistance: The first major resistance is around $1.00. A strong move above this level could signal renewed bullish momentum. �
CCN.com
Outlook: The project has strong DeFi and ecosystem development, but token unlocks and overall crypto market sentiment remain important risks. Short-term traders should watch for a breakout above resistance or a breakdown below support before entering. �
Price
1.05 ┤ │█│
1.00 ┤ │█│ █
0.95 ┤ █│ │█
0.90 ┤ │█│
0.85 ┤ █│
0.80 ┤ │█│
0.75 ┤ █│ █│ █│
0.70 ┼──────────────────────── Support
1 2 3 4 5 6 7
This sketch represents recent sideways price action around support. For a real-time candlestick chart with indicators (RSI, MACD, volume, etc.), you'll need data from a live exchange or charting platform.
#USTradeDefcitShrink
#ZTCBinanceTGE #writetoearnupgrate
CoinEx +1
Support: $0.70 is the key support level. A break below it could lead to further downside. �
CCN.com +1
Resistance: The first major resistance is around $1.00. A strong move above this level could signal renewed bullish momentum. �
CCN.com
Outlook: The project has strong DeFi and ecosystem development, but token unlocks and overall crypto market sentiment remain important risks. Short-term traders should watch for a breakout above resistance or a breakdown below support before entering. �
Price
1.05 ┤ │█│
1.00 ┤ │█│ █
0.95 ┤ █│ │█
0.90 ┤ │█│
0.85 ┤ █│
0.80 ┤ │█│
0.75 ┤ █│ █│ █│
0.70 ┼──────────────────────── Support
1 2 3 4 5 6 7
This sketch represents recent sideways price action around support. For a real-time candlestick chart with indicators (RSI, MACD, volume, etc.), you'll need data from a live exchange or charting platform.
#USTradeDefcitShrink
#ZTCBinanceTGE #writetoearnupgrate
1
225

$ASTR
{spot}(ASTRUSDT)
ASTR coin is currently navigating a stabilization phase in May 2026, showing a steady recovery from its yearly lows of $0.0065. Market analytics indicate that the price is consolidating around the $0.0084 to $0.0089 range, supported by a neutral Relative Strength Index (RSI) that suggests a balanced momentum between buyers and sellers. The long-term outlook has improved following the implementation of Tokenomics 3.0, which slashed inflation rates to around 5.8%, making the asset more attractive for long-term holders. Technically, the coin is facing a key resistance level at $0.010, and breaking above this point could signal a bullish trend toward previous highs.
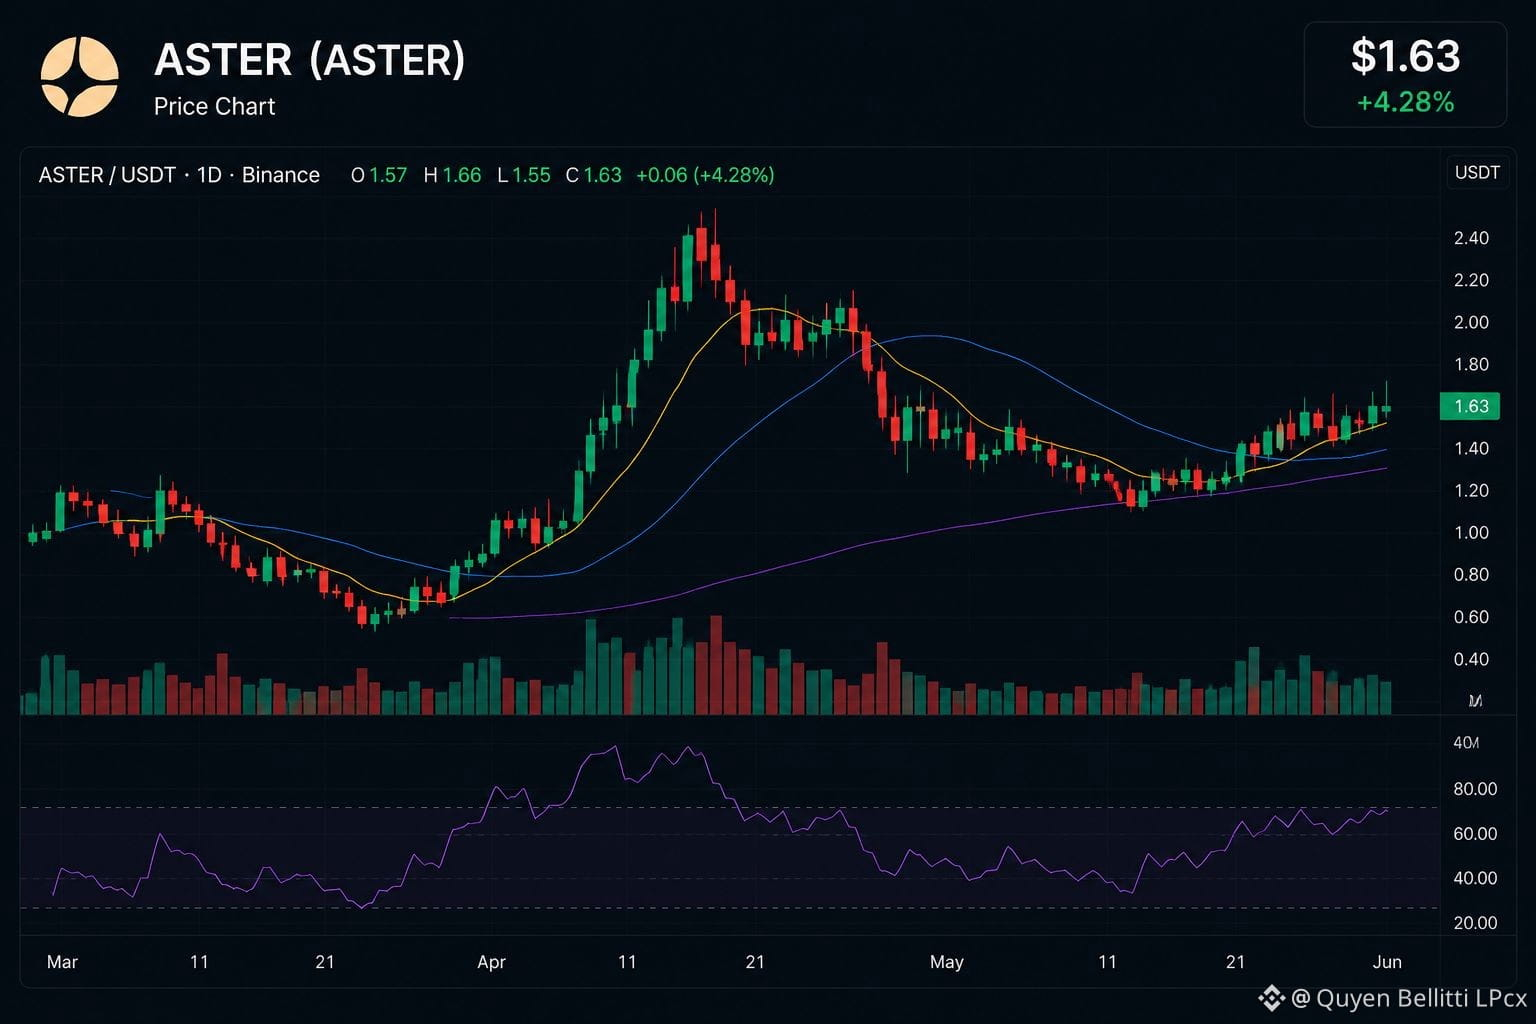
Regarding the visual representation, here is a candle chart showing the price movement over the last few months..
#USTradeDefcitShrink #ZTCBinaceTGE #WriteToEarnUpgrade
$ASTR
ASTR coin is currently navigating a stabilization phase in May 2026, showing a steady recovery from its yearly lows of $0.0065. Market analytics indicate that the price is consolidating around the $0.0084 to $0.0089 range, supported by a neutral Relative Strength Index (RSI) that suggests a balanced momentum between buyers and sellers. The long-term outlook has improved following the implementation of Tokenomics 3.0, which slashed inflation rates to around 5.8%, making the asset more attractive for long-term holders. Technically, the coin is facing a key resistance level at $0.010, and breaking above this point could signal a bullish trend toward previous highs.
Regarding the visual representation, here is a candle chart showing the price movement over the last few months..
#USTradeDefcitShrink #ZTCBinaceTGE #WriteToEarnUpgrade
ASTR coin is currently navigating a stabilization phase in May 2026, showing a steady recovery from its yearly lows of $0.0065. Market analytics indicate that the price is consolidating around the $0.0084 to $0.0089 range, supported by a neutral Relative Strength Index (RSI) that suggests a balanced momentum between buyers and sellers. The long-term outlook has improved following the implementation of Tokenomics 3.0, which slashed inflation rates to around 5.8%, making the asset more attractive for long-term holders. Technically, the coin is facing a key resistance level at $0.010, and breaking above this point could signal a bullish trend toward previous highs.
Regarding the visual representation, here is a candle chart showing the price movement over the last few months..
#USTradeDefcitShrink #ZTCBinaceTGE #WriteToEarnUpgrade
5
197
Log in to explore more content
Join global crypto users on Binance Square
⚡️ Get latest and useful information about crypto.
💬 Trusted by the world’s largest crypto exchange.
👍 Discover real insights from verified creators.
Email / Phone number
Trending Topics
1
#FedProposesPaymentStablecoinRules
0 views
2 Discussing
2
#ChinaMayLetAlibabaByteDanceBuyNvidiaChips
1,734 views
126 Discussing
3
#USChinaRelease$30BTariffCutProductLists
143 views
13 Discussing
4
#SKoreaFSCConsidersVirtualAssetMarketMaker
2,959 views
133 Discussing
5
#ChinaIndustrialProfitGrowthSlowsFourthMonth
3,703 views
151 Discussing
6
#BitwiseFilesFinalNEARSpotETFProspectus
112,420 views
1,670 Discussing
7
#BitgetHackerMoves$83MStolenXRP
38,566 views
176 Discussing
8
#SOLSpotETFWeeklyInflow$188M
24,527 views
139 Discussing
9
#DogecoinETFsPostBiggestWeekSinceLaunch
65,533 views
1,095 Discussing
10
#StrategyStriveAdd2305BitcoinThisWeek
163,409 views
2,356 Discussing