$ASTER ASTER short analysis
* Current price: roughly $0.67–$0.68 today, with different exchanges showing slightly different prices.
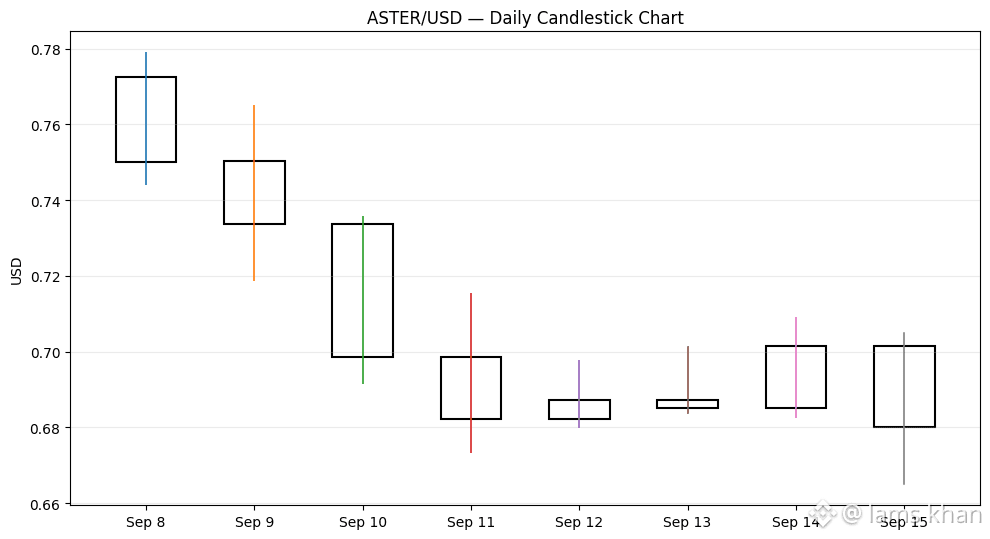
* ASTER has pulled back from around $0.77 on Sep 8 to about $0.68 on Sep 15, showing short-term selling pressure.
* The recent $0.665–$0.68 area is an important nearby price zone because recent lows have repeatedly appeared around there.
* The $0.70–$0.715 area is a nearby resistance zone based on recent daily highs. A move above it would change the short-term chart structure, but it would not by itself confirm a sustained trend.
* ASTER is still considerably below its reported $2.41 all-time high, so its historical volatility remains substantial.
ASTER/USDT on Binance
📊 ASTER candlestick chart
The chart above uses daily OHLC data for Sep 8–15, 2026 from Bitget.
1. ASTER is a cryptocurrency traded on major crypto exchanges.
2. Its recent price has been moving around the $0.67–$0.70 range.
3. The coin has experienced noticeable volatility in recent days.
4. ASTER fell from around $0.77 to below $0.70 during the recent period.
5. This indicates short-term selling pressure in the market.
6. The $0.665–$0.68 area can be observed as a recent support zone.
7. The $0.70–$0.715 area is a nearby resistance zone.
8. A break above resistance could indicate stronger short-term momentum.
9. A move below the recent support area could indicate further weakness.
10. ASTER has historically shown significant price volatility.
11. Its price remains well below its previous all-time high.
12. Overall, the current chart shows a short-term pullback with important support and resistance levels.
13. Traders should consider volume and broader market conditions along with the candlestick chart.
14. This analysis is for educational purposes and is not a buy or sell recommendation.
#USTradeDefcitShrink #ZTCBINANCETGE #WriteToEarnUpgrade #CPIWatch
* Current price: roughly $0.67–$0.68 today, with different exchanges showing slightly different prices.
* ASTER has pulled back from around $0.77 on Sep 8 to about $0.68 on Sep 15, showing short-term selling pressure.
* The recent $0.665–$0.68 area is an important nearby price zone because recent lows have repeatedly appeared around there.
* The $0.70–$0.715 area is a nearby resistance zone based on recent daily highs. A move above it would change the short-term chart structure, but it would not by itself confirm a sustained trend.
* ASTER is still considerably below its reported $2.41 all-time high, so its historical volatility remains substantial.
ASTER/USDT on Binance
📊 ASTER candlestick chart
The chart above uses daily OHLC data for Sep 8–15, 2026 from Bitget.
1. ASTER is a cryptocurrency traded on major crypto exchanges.
2. Its recent price has been moving around the $0.67–$0.70 range.
3. The coin has experienced noticeable volatility in recent days.
4. ASTER fell from around $0.77 to below $0.70 during the recent period.
5. This indicates short-term selling pressure in the market.
6. The $0.665–$0.68 area can be observed as a recent support zone.
7. The $0.70–$0.715 area is a nearby resistance zone.
8. A break above resistance could indicate stronger short-term momentum.
9. A move below the recent support area could indicate further weakness.
10. ASTER has historically shown significant price volatility.
11. Its price remains well below its previous all-time high.
12. Overall, the current chart shows a short-term pullback with important support and resistance levels.
13. Traders should consider volume and broader market conditions along with the candlestick chart.
14. This analysis is for educational purposes and is not a buy or sell recommendation.
#USTradeDefcitShrink #ZTCBINANCETGE #WriteToEarnUpgrade #CPIWatch