
#spaceandtimen
spaceandtimen
55,449 views
125 Discussing
Hot
Latest

🚀 $SXT SHOWING BULLISH MOMENTUM! Bulls Eye $0.0100 🚀
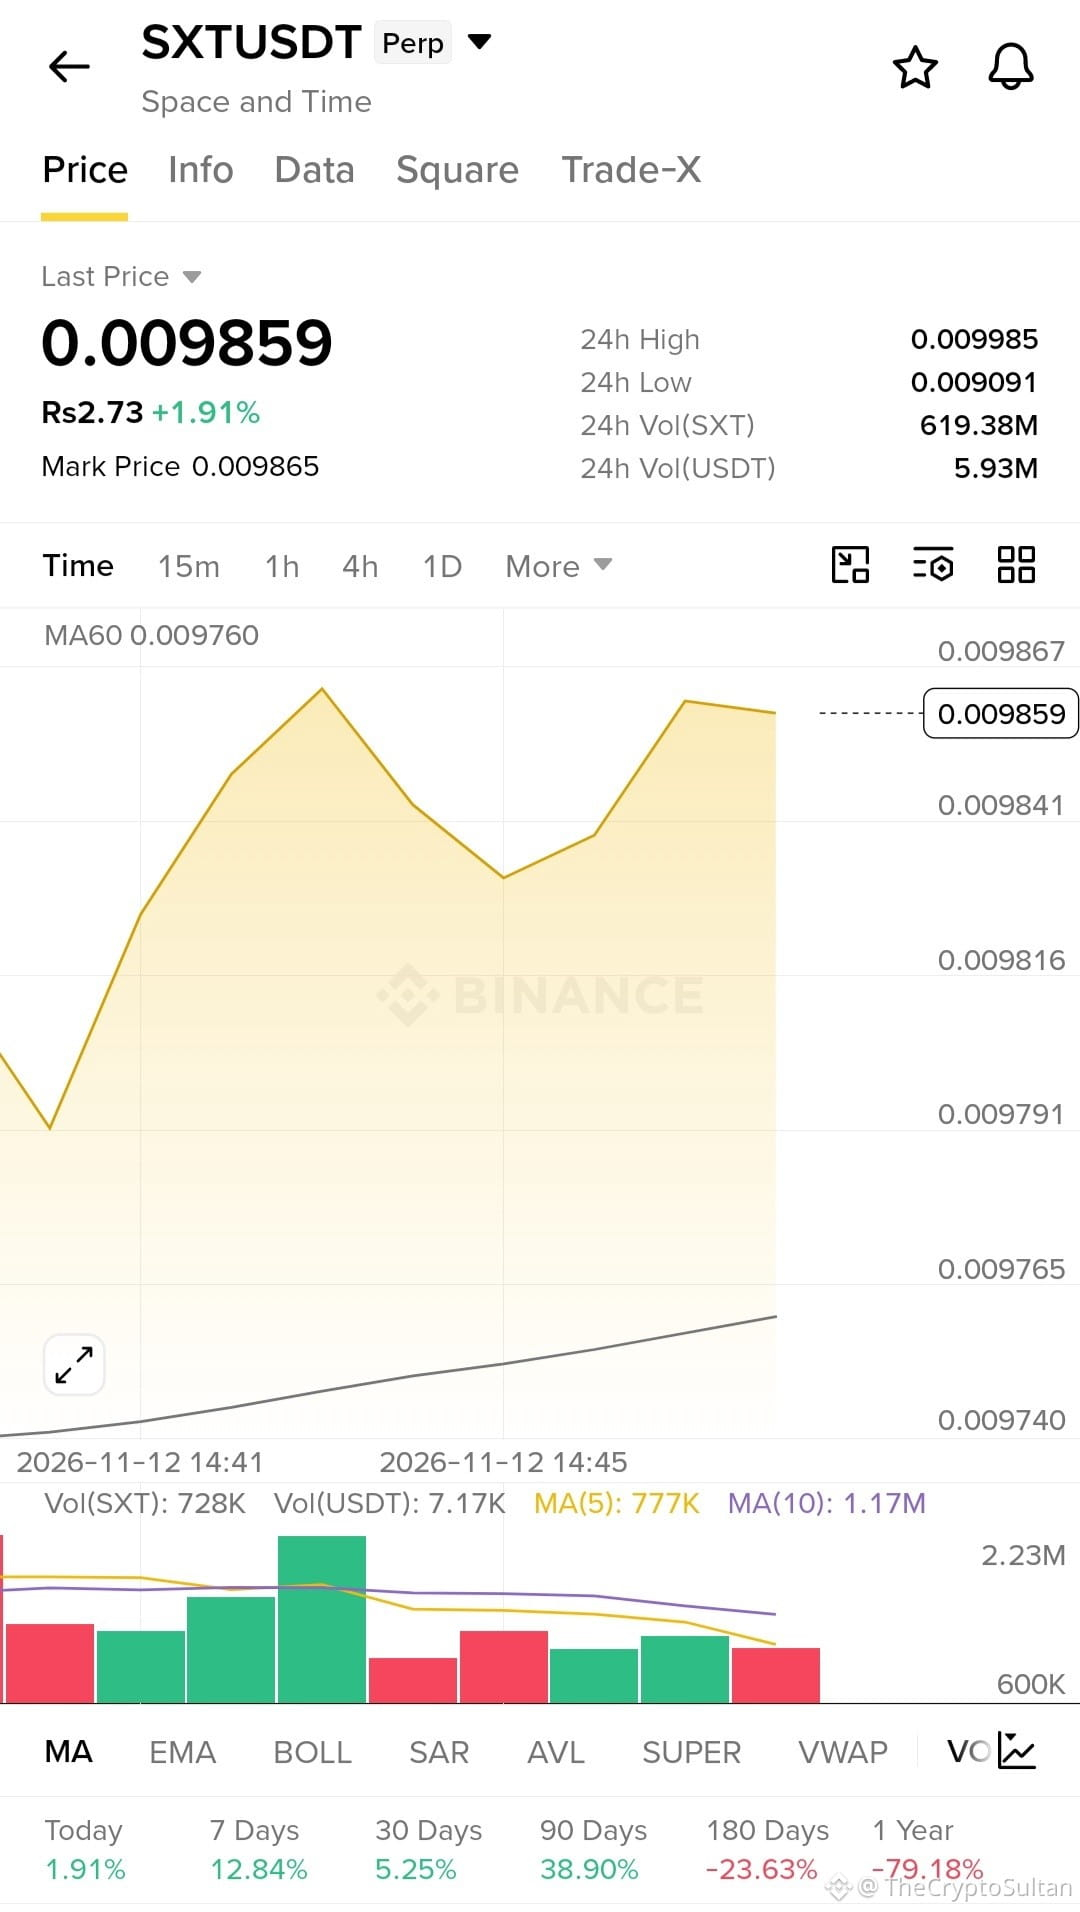
$SXT (Space and Time) is gaining momentum, currently trading around $0.009859, up 1.91% in the last 24 hours. Price is holding above the MA60, while recent performance shows continued strength.
📊 Key Levels:
Current Price: $0.009859
Resistance: $0.009985
Support: $0.009760
Target 1: $0.01000
Target 2: $0.01020
A breakout above $0.009985 with strong buying volume could open the door for further upside. Watch the resistance carefully and manage your risk.
🔥 Can $SXT break above $0.0100?
#SXTspot #SpaceandTimen #cryptotrading
{spot}(SXTUSDT)
🚀 $SXT SHOWING BULLISH MOMENTUM! Bulls Eye $0.0100 🚀
$SXT (Space and Time) is gaining momentum, currently trading around $0.009859, up 1.91% in the last 24 hours. Price is holding above the MA60, while recent performance shows continued strength.
📊 Key Levels:
Current Price: $0.009859
Resistance: $0.009985
Support: $0.009760
Target 1: $0.01000
Target 2: $0.01020
A breakout above $0.009985 with strong buying volume could open the door for further upside. Watch the resistance carefully and manage your risk.
🔥 Can $SXT break above $0.0100?
#SXTspot #SpaceandTimen #cryptotrading
$SXT (Space and Time) is gaining momentum, currently trading around $0.009859, up 1.91% in the last 24 hours. Price is holding above the MA60, while recent performance shows continued strength.
📊 Key Levels:
Current Price: $0.009859
Resistance: $0.009985
Support: $0.009760
Target 1: $0.01000
Target 2: $0.01020
A breakout above $0.009985 with strong buying volume could open the door for further upside. Watch the resistance carefully and manage your risk.
🔥 Can $SXT break above $0.0100?
#SXTspot #SpaceandTimen #cryptotrading
62

·
--
Bullish
As of May 29, 2026, the Space and Time token (SXT) is trading on Binance in a consolidation range close to $0.011 - $0.012 USD, exhibiting lateral movement and technical stabilization after weeks of high volatility.
Earlier in May 2026, the SXT protocol experienced a massive token unlock event equivalent to 27.6% of its market value (approximately $6 million in incentives and distribution for investors/team).
This drastic increase in supply triggered a sharp correction in price weeks ago. As of May 29, the token is showing signs of absorbing that surplus supply, stabilizing above the critical support level of $0.011 USD.
Neutral RSI: The Relative Strength Index (RSI) has exited the extreme oversold zone recorded mid-month and is currently in a neutral range (30-70). This indicates that the massive sell pressure has paused and the price is building momentum.
Crossed Moving Averages: On short-term charts (4 hours), the 50-day moving average shows a slight upward slope. However, the macro trend (200-day moving average) continues to point downwards due to the impact of the unlock, suggesting that the asset will remain lateral in the coming hours.
$SXT
{spot}(SXTUSDT)
$USDT
{future}(SXTUSDT)
#SXT #SXTUSDT #SpaceandTimen
Follow me and give a like. Thanks.
As of May 29, 2026, the Space and Time token (SXT) is trading on Binance in a consolidation range close to $0.011 - $0.012 USD, exhibiting lateral movement and technical stabilization after weeks of high volatility.
Earlier in May 2026, the SXT protocol experienced a massive token unlock event equivalent to 27.6% of its market value (approximately $6 million in incentives and distribution for investors/team).
This drastic increase in supply triggered a sharp correction in price weeks ago. As of May 29, the token is showing signs of absorbing that surplus supply, stabilizing above the critical support level of $0.011 USD.
Neutral RSI: The Relative Strength Index (RSI) has exited the extreme oversold zone recorded mid-month and is currently in a neutral range (30-70). This indicates that the massive sell pressure has paused and the price is building momentum.
Crossed Moving Averages: On short-term charts (4 hours), the 50-day moving average shows a slight upward slope. However, the macro trend (200-day moving average) continues to point downwards due to the impact of the unlock, suggesting that the asset will remain lateral in the coming hours.
$SXT
$USDT
#SXT #SXTUSDT #SpaceandTimen
Follow me and give a like. Thanks.
Earlier in May 2026, the SXT protocol experienced a massive token unlock event equivalent to 27.6% of its market value (approximately $6 million in incentives and distribution for investors/team).
This drastic increase in supply triggered a sharp correction in price weeks ago. As of May 29, the token is showing signs of absorbing that surplus supply, stabilizing above the critical support level of $0.011 USD.
Neutral RSI: The Relative Strength Index (RSI) has exited the extreme oversold zone recorded mid-month and is currently in a neutral range (30-70). This indicates that the massive sell pressure has paused and the price is building momentum.
Crossed Moving Averages: On short-term charts (4 hours), the 50-day moving average shows a slight upward slope. However, the macro trend (200-day moving average) continues to point downwards due to the impact of the unlock, suggesting that the asset will remain lateral in the coming hours.
$SXT
$USDT
#SXT #SXTUSDT #SpaceandTimen
Follow me and give a like. Thanks.
181

·
--
Bullish
📊 $SXT: The Decentralized Data Warehouse Powering Web3 🌌
As Web3 scales, smart contracts face a massive hurdle: how do they query complex off-chain data securely? Enter Space and Time ($SXT
{spot}(SXTUSDT)
), a verifiable decentralized data warehouse.
By utilizing innovative Proof-of-SQL cryptography, SXT allows dApps to run complex database queries and cryptographically prove the results back to the blockchain without trusting a centralized server. Whether it's DeFi protocols, on-chain gaming, or AI dApps, Space and Time is building the essential backend infrastructure for the next generation of the internet.
Infrastructure tokens are the backbone of a healthy market. Are you bullish on the future of SXT? 🛰️
#SXTToken #SpaceandTimen #Web3 #BinanceSquare #WriteToEarn
📊 $SXT : The Decentralized Data Warehouse Powering Web3 🌌
As Web3 scales, smart contracts face a massive hurdle: how do they query complex off-chain data securely? Enter Space and Time ($SXT
), a verifiable decentralized data warehouse.
By utilizing innovative Proof-of-SQL cryptography, SXT allows dApps to run complex database queries and cryptographically prove the results back to the blockchain without trusting a centralized server. Whether it's DeFi protocols, on-chain gaming, or AI dApps, Space and Time is building the essential backend infrastructure for the next generation of the internet.
Infrastructure tokens are the backbone of a healthy market. Are you bullish on the future of SXT? 🛰️
#SXTToken #SpaceandTimen #Web3 #BinanceSquare #WriteToEarn
As Web3 scales, smart contracts face a massive hurdle: how do they query complex off-chain data securely? Enter Space and Time ($SXT
), a verifiable decentralized data warehouse.
By utilizing innovative Proof-of-SQL cryptography, SXT allows dApps to run complex database queries and cryptographically prove the results back to the blockchain without trusting a centralized server. Whether it's DeFi protocols, on-chain gaming, or AI dApps, Space and Time is building the essential backend infrastructure for the next generation of the internet.
Infrastructure tokens are the backbone of a healthy market. Are you bullish on the future of SXT? 🛰️
#SXTToken #SpaceandTimen #Web3 #BinanceSquare #WriteToEarn
1
2
183
·
--
Bearish
SXT Holds Strong Above Crucial Support Block! Will AI-Native Data Demand Trigger the Next Leg Up? 🌐
The Analysis: Space and Time ($SXT
{spot}(SXTUSDT)
) continues to demonstrate clean structural resilience, stabilizing robustly near the $0.0073 level within a well-defined value accumulation band. As an AI-native decentralized data warehouse using Zero-Knowledge (ZK) proofs to link tamper-proof data directly to smart contracts, SXT sits at a highly valuable technical intersection.
The Alpha: On the daily chart, SXT has registered steady positive daily moves (+4.98%), showing active accumulation underneath local descending resistance. Derivative desks highlight a complete reset in funding metrics, indicating that the current horizontal base is entirely free of speculative retail froth. A decisive push in spot trading velocity above the immediate local resistance block will easily clear the runway toward higher historical targets.
The Trade: Positioning looks highly asymmetric when building exposure inside the $0.0068–$0.0072 demand zone. Set primary profit targets near local overhead liquidity nodes, and manage downstream capital risk with an automated invalidation close stop directly underneath the $0.0063 local swing floor.
Data infrastructure is quietly being accumulated by long-term holders while retail waits for price expansion. Are you stacking SXT bags here? 👇
#SXT #SpaceandTimen #ZeroKnowledgeProofs #Web3Data #cryptosignals
SXT Holds Strong Above Crucial Support Block! Will AI-Native Data Demand Trigger the Next Leg Up? 🌐
The Analysis: Space and Time ($SXT
) continues to demonstrate clean structural resilience, stabilizing robustly near the $0.0073 level within a well-defined value accumulation band. As an AI-native decentralized data warehouse using Zero-Knowledge (ZK) proofs to link tamper-proof data directly to smart contracts, SXT sits at a highly valuable technical intersection.
The Alpha: On the daily chart, SXT has registered steady positive daily moves (+4.98%), showing active accumulation underneath local descending resistance. Derivative desks highlight a complete reset in funding metrics, indicating that the current horizontal base is entirely free of speculative retail froth. A decisive push in spot trading velocity above the immediate local resistance block will easily clear the runway toward higher historical targets.
The Trade: Positioning looks highly asymmetric when building exposure inside the $0.0068–$0.0072 demand zone. Set primary profit targets near local overhead liquidity nodes, and manage downstream capital risk with an automated invalidation close stop directly underneath the $0.0063 local swing floor.
Data infrastructure is quietly being accumulated by long-term holders while retail waits for price expansion. Are you stacking SXT bags here? 👇
#SXT #SpaceandTimen #ZeroKnowledgeProofs #Web3Data #cryptosignals
The Analysis: Space and Time ($SXT
) continues to demonstrate clean structural resilience, stabilizing robustly near the $0.0073 level within a well-defined value accumulation band. As an AI-native decentralized data warehouse using Zero-Knowledge (ZK) proofs to link tamper-proof data directly to smart contracts, SXT sits at a highly valuable technical intersection.
The Alpha: On the daily chart, SXT has registered steady positive daily moves (+4.98%), showing active accumulation underneath local descending resistance. Derivative desks highlight a complete reset in funding metrics, indicating that the current horizontal base is entirely free of speculative retail froth. A decisive push in spot trading velocity above the immediate local resistance block will easily clear the runway toward higher historical targets.
The Trade: Positioning looks highly asymmetric when building exposure inside the $0.0068–$0.0072 demand zone. Set primary profit targets near local overhead liquidity nodes, and manage downstream capital risk with an automated invalidation close stop directly underneath the $0.0063 local swing floor.
Data infrastructure is quietly being accumulated by long-term holders while retail waits for price expansion. Are you stacking SXT bags here? 👇
#SXT #SpaceandTimen #ZeroKnowledgeProofs #Web3Data #cryptosignals
1
192


Article
SXT rockets +23% in 24h! But is it worth investing in Space and Time now? 🤔If you opened Binance today, you’ve certainly seen Space and Time (SXT) shining at the top of the biggest winners of the day, with an impressive +23% gain over the last 24 hours.
But is this move sustainable or just another "flash in the pan"? To help you decide whether it’s worth putting your money into it, let’s analyze the chart from the last month and weigh the pros and cons.
📊 Chart Analysis: The Last 24h vs. The Last Month
To understand where SXT is headed, we need to take a step back and look at the medium-term chart.
SXT rockets +23% in 24h! But is it worth investing in Space and Time now? 🤔
If you opened Binance today, you’ve certainly seen Space and Time (SXT) shining at the top of the biggest winners of the day, with an impressive +23% gain over the last 24 hours.
But is this move sustainable or just another "flash in the pan"? To help you decide whether it’s worth putting your money into it, let’s analyze the chart from the last month and weigh the pros and cons.
📊 Chart Analysis: The Last 24h vs. The Last Month
To understand where SXT is headed, we need to take a step back and look at the medium-term chart.
But is this move sustainable or just another "flash in the pan"? To help you decide whether it’s worth putting your money into it, let’s analyze the chart from the last month and weigh the pros and cons.
📊 Chart Analysis: The Last 24h vs. The Last Month
To understand where SXT is headed, we need to take a step back and look at the medium-term chart.
1
161


🎉 Binance Creators, Another Good News for You!
The $SXT CreatorPad Campaign by @SpaceandTimeDB is live on Binance Square, featuring a massive 50,000 USDC reward pool! 💰
🏆 Track A – 40,000 USDC
Complete the campaign tasks, follow @SpaceandTime, publish one qualifying post through the campaign page, and share your SXT Spot or Futures trade history with a minimum trade value of $20. Eligible creators will share 40,000 USDC equally.
🚀 Track B – 10,000 USDC
The Top 100 creators ranked by SXT PnL will share an additional 10,000 USDC equally. Your SXT PnL must be positive at the campaign snapshot.
📅 Campaign ends: November 22, 2026.
Creators, prepare your best content, trade $SXT, work hard and grab this opportunity!
Thank you, $SXT! Thank you, Binance! ❤️
#SXT #SpaceAndTime #Bina#BinanceSquare torPad #CryptoRewards
Let's make the most of this opportunity! 🚀
Thank you, @SpaceandTimeDB ! ❤️
Thank you, Binance! 💛
#SXT #SpaceandTimen #BinanceSquare #creatorpad #CryptoRewards [SXT compaign](https://app.binance.com/uni-qr/cart/387436708833613?l=en&r=UCIPZ4L0&uc=web_square_share_link&uco=UIBW2BqiC5YRwkKnx8S33A&us=copylink)
🎉 Binance Creators, Another Good News for You!
The $SXT CreatorPad Campaign by @SpaceandTime is live on Binance Square, featuring a massive 50,000 USDC reward pool! 💰
🏆 Track A – 40,000 USDC
Complete the campaign tasks, follow @SpaceandTime, publish one qualifying post through the campaign page, and share your SXT Spot or Futures trade history with a minimum trade value of $20. Eligible creators will share 40,000 USDC equally.
🚀 Track B – 10,000 USDC
The Top 100 creators ranked by SXT PnL will share an additional 10,000 USDC equally. Your SXT PnL must be positive at the campaign snapshot.
📅 Campaign ends: November 22, 2026.
Creators, prepare your best content, trade $SXT, work hard and grab this opportunity!
Thank you, $SXT! Thank you, Binance! ❤️
#SXT #SpaceAndTime #Bina#BinanceSquare torPad #CryptoRewards
Let's make the most of this opportunity! 🚀
Thank you, @SpaceandTime ! ❤️
Thank you, Binance! 💛
#SXT #SpaceandTimen #BinanceSquare #creatorpad #CryptoRewards SXT compaign
The $SXT CreatorPad Campaign by @SpaceandTime is live on Binance Square, featuring a massive 50,000 USDC reward pool! 💰
🏆 Track A – 40,000 USDC
Complete the campaign tasks, follow @SpaceandTime, publish one qualifying post through the campaign page, and share your SXT Spot or Futures trade history with a minimum trade value of $20. Eligible creators will share 40,000 USDC equally.
🚀 Track B – 10,000 USDC
The Top 100 creators ranked by SXT PnL will share an additional 10,000 USDC equally. Your SXT PnL must be positive at the campaign snapshot.
📅 Campaign ends: November 22, 2026.
Creators, prepare your best content, trade $SXT, work hard and grab this opportunity!
Thank you, $SXT! Thank you, Binance! ❤️
#SXT #SpaceAndTime #Bina#BinanceSquare torPad #CryptoRewards
Let's make the most of this opportunity! 🚀
Thank you, @SpaceandTime ! ❤️
Thank you, Binance! 💛
#SXT #SpaceandTimen #BinanceSquare #creatorpad #CryptoRewards SXT compaign

Shae Malouf kLk1:
a binnace já era depois que veio pro brasil pode olhar as reclamações não sou eu que tô falando não são os números kkkk
3
13
4.9k

·
--
Article
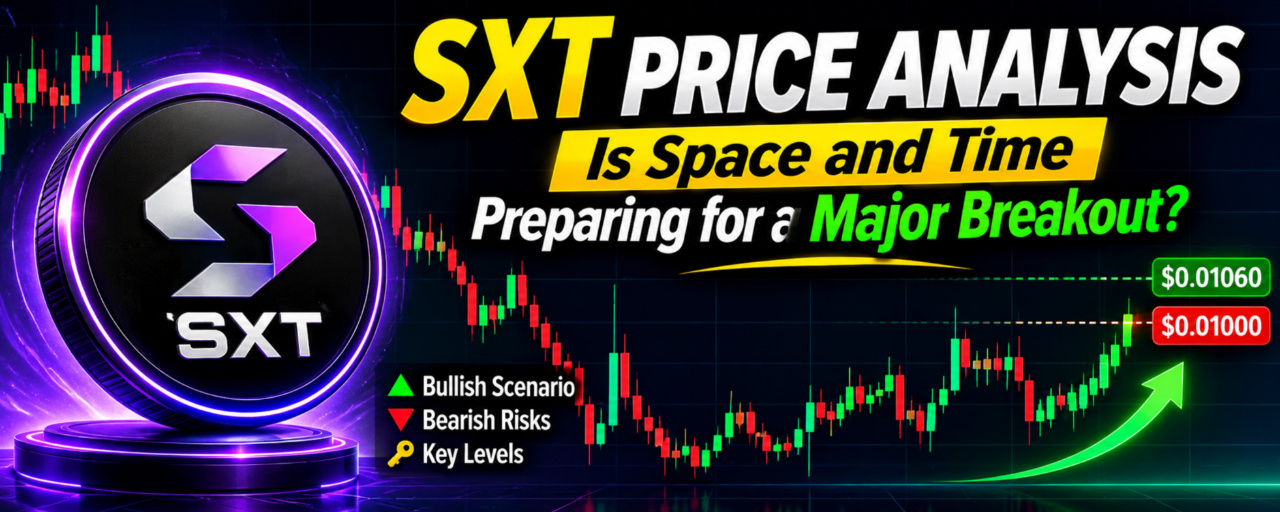
SXT Price Analysis: Is Space and Time Preparing for a Major Breakout?Technical Analysis | SXT/USDT Perpetual | 1D
SXT is approaching an important resistance zone after months of consolidation. Could this be the beginning of a stronger recovery?
The daily chart of SXT/USDT shows an interesting change in market structure. After a prolonged decline from the April highs near $0.019, the price found a bottom around $0.0065–$0.0070 in June and July. Since then, buyers have gradually pushed the market into a broader recovery and established a consolidation range.
Now SXT is trading around $0.009636, bringing price back toward the important $0.0100 resistance area.
Technical Analysis: Key Levels to Watch
The current price action suggests that buyers are attempting to regain control, but confirmation is still needed.
Price level Technical importance $0.0100–$0.01035 Major resistance $0.01060 Next upside target $0.00920–$0.00930 Immediate support $0.00880–$0.00900 Secondary support $0.00800–$0.00830 Stronger support zone $0.00700 Major historical support
Bullish Scenario
If SXT successfully breaks above $0.0100–$0.01035 with strong buying volume and a daily candle close above resistance, it could open the door toward $0.01060.
A sustained breakout could attract additional momentum traders and potentially push price toward higher resistance zones.
Bearish Scenario
However, rejection around $0.0100–$0.01035 could trigger another pullback. Losing the $0.00920 support area would weaken the short-term recovery structure and could expose $0.00880–$0.00900.
A deeper correction toward $0.00800 cannot be ruled out if selling pressure increases.
Volume: The Important Factor
One interesting development is the latest trading activity. Binance Futures data shows approximately 1.29 billion SXT in volume for the current daily candle, while the price has approached the $0.010 resistance region.
This makes the current test particularly important. Traders should watch whether buying pressure continues and whether the breakout receives confirmation rather than relying on a temporary price spike.
Final Verdict
SXT is showing signs of recovery after spending several months near its historical bottoming range. The overall structure is improving, but the market has not yet confirmed a full bullish breakout.
The $0.01035 level is the key area to watch. A confirmed breakout could strengthen bullish momentum, while another rejection may keep SXT inside its existing consolidation range.
The next move could be important for SXT holders. Patience and confirmation matter more than chasing green candles.
What do you think? Can SXT finally break above $0.01035, or will sellers defend this resistance again?
#SpaceandTimen #SXTspot #HuangExitNvidiaStrategyInFocus #TradFiForBeginners
$SXT @SpaceandTimeDB #AnthropicRejectsIPODelayValuationinQuestion
{future}(SXTUSDT)
Analysis based on the supplied November 13, 2026 daily chart and Binance public futures market data. These are technical scenarios, not guaranteed price targets or financial advice.
SXT Price Analysis: Is Space and Time Preparing for a Major Breakout?
Technical Analysis | SXT/USDT Perpetual | 1D
SXT is approaching an important resistance zone after months of consolidation. Could this be the beginning of a stronger recovery?
The daily chart of SXT/USDT shows an interesting change in market structure. After a prolonged decline from the April highs near $0.019, the price found a bottom around $0.0065–$0.0070 in June and July. Since then, buyers have gradually pushed the market into a broader recovery and established a consolidation range.
Now SXT is trading around $0.009636, bringing price back toward the important $0.0100 resistance area.
Technical Analysis: Key Levels to Watch
The current price action suggests that buyers are attempting to regain control, but confirmation is still needed.
Price level Technical importance $0.0100–$0.01035 Major resistance $0.01060 Next upside target $0.00920–$0.00930 Immediate support $0.00880–$0.00900 Secondary support $0.00800–$0.00830 Stronger support zone $0.00700 Major historical support
Bullish Scenario
If SXT successfully breaks above $0.0100–$0.01035 with strong buying volume and a daily candle close above resistance, it could open the door toward $0.01060.
A sustained breakout could attract additional momentum traders and potentially push price toward higher resistance zones.
Bearish Scenario
However, rejection around $0.0100–$0.01035 could trigger another pullback. Losing the $0.00920 support area would weaken the short-term recovery structure and could expose $0.00880–$0.00900.
A deeper correction toward $0.00800 cannot be ruled out if selling pressure increases.
Volume: The Important Factor
One interesting development is the latest trading activity. Binance Futures data shows approximately 1.29 billion SXT in volume for the current daily candle, while the price has approached the $0.010 resistance region.
This makes the current test particularly important. Traders should watch whether buying pressure continues and whether the breakout receives confirmation rather than relying on a temporary price spike.
Final Verdict
SXT is showing signs of recovery after spending several months near its historical bottoming range. The overall structure is improving, but the market has not yet confirmed a full bullish breakout.
The $0.01035 level is the key area to watch. A confirmed breakout could strengthen bullish momentum, while another rejection may keep SXT inside its existing consolidation range.
The next move could be important for SXT holders. Patience and confirmation matter more than chasing green candles.
What do you think? Can SXT finally break above $0.01035, or will sellers defend this resistance again?
#SpaceandTimen #SXTspot #HuangExitNvidiaStrategyInFocus #TradFiForBeginners
$SXT @SpaceandTime #AnthropicRejectsIPODelayValuationinQuestion
Analysis based on the supplied November 13, 2026 daily chart and Binance public futures market data. These are technical scenarios, not guaranteed price targets or financial advice.
SXT is approaching an important resistance zone after months of consolidation. Could this be the beginning of a stronger recovery?
The daily chart of SXT/USDT shows an interesting change in market structure. After a prolonged decline from the April highs near $0.019, the price found a bottom around $0.0065–$0.0070 in June and July. Since then, buyers have gradually pushed the market into a broader recovery and established a consolidation range.
Now SXT is trading around $0.009636, bringing price back toward the important $0.0100 resistance area.
Technical Analysis: Key Levels to Watch
The current price action suggests that buyers are attempting to regain control, but confirmation is still needed.
Price level Technical importance $0.0100–$0.01035 Major resistance $0.01060 Next upside target $0.00920–$0.00930 Immediate support $0.00880–$0.00900 Secondary support $0.00800–$0.00830 Stronger support zone $0.00700 Major historical support
Bullish Scenario
If SXT successfully breaks above $0.0100–$0.01035 with strong buying volume and a daily candle close above resistance, it could open the door toward $0.01060.
A sustained breakout could attract additional momentum traders and potentially push price toward higher resistance zones.
Bearish Scenario
However, rejection around $0.0100–$0.01035 could trigger another pullback. Losing the $0.00920 support area would weaken the short-term recovery structure and could expose $0.00880–$0.00900.
A deeper correction toward $0.00800 cannot be ruled out if selling pressure increases.
Volume: The Important Factor
One interesting development is the latest trading activity. Binance Futures data shows approximately 1.29 billion SXT in volume for the current daily candle, while the price has approached the $0.010 resistance region.
This makes the current test particularly important. Traders should watch whether buying pressure continues and whether the breakout receives confirmation rather than relying on a temporary price spike.
Final Verdict
SXT is showing signs of recovery after spending several months near its historical bottoming range. The overall structure is improving, but the market has not yet confirmed a full bullish breakout.
The $0.01035 level is the key area to watch. A confirmed breakout could strengthen bullish momentum, while another rejection may keep SXT inside its existing consolidation range.
The next move could be important for SXT holders. Patience and confirmation matter more than chasing green candles.
What do you think? Can SXT finally break above $0.01035, or will sellers defend this resistance again?
#SpaceandTimen #SXTspot #HuangExitNvidiaStrategyInFocus #TradFiForBeginners
$SXT @SpaceandTime #AnthropicRejectsIPODelayValuationinQuestion
Analysis based on the supplied November 13, 2026 daily chart and Binance public futures market data. These are technical scenarios, not guaranteed price targets or financial advice.
40

·
--
Verified
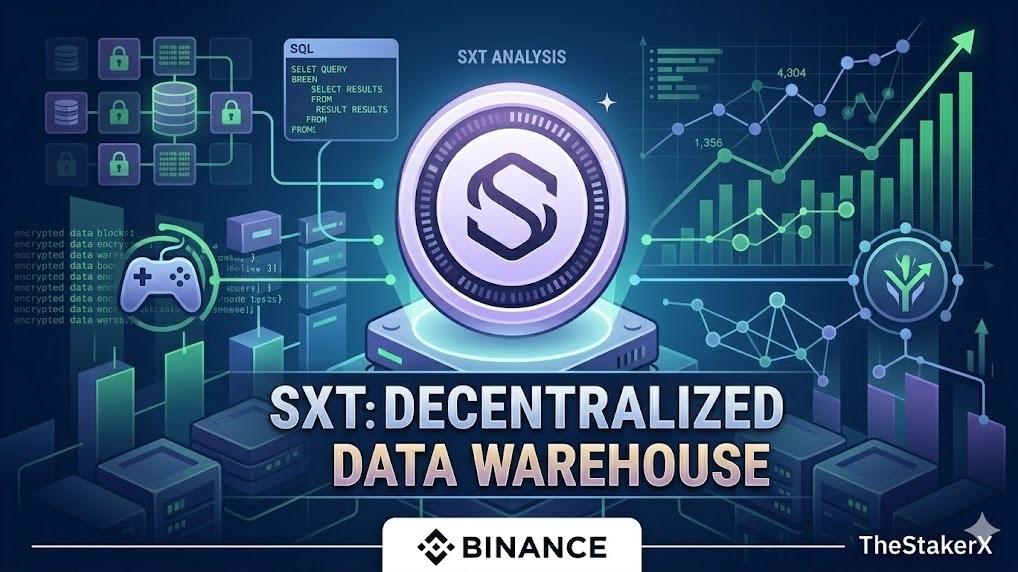
🚀 Decoding Space and Time ($SXT ): The Decentralized Data Warehouse Powering Web3 Gaming & DeFi! 📊
Post Body:
The landscape of Web3 infrastructure is undergoing a massive transformation in June 2026, and Space and Time ($SXT ) is right at the center of it. As decentralized applications (dApps) demand faster, tamper-proof data processing, SXT's Proof of SQL technology is proving to be a game-changer for smart contracts.
For crypto traders and long-term investors, infrastructure tokens like SXT offer a unique proposition. Unlike pure hype-driven meme coins, ecosystem pillars that connect major enterprise blockchains with relational databases tend to build solid, long-term valuation.
Looking at the current market structure, high-volume data protocols are quietly accumulating liquidity. Whether you are analyzing spot trading limits or tracking ecosystem rewards, keeping an eye on fundamental infrastructure metrics is what separates disciplined traders from the crowd.
Are you currently holding $SXT in your portfolio, or did you explore it through the recent educational rewards program? Let’s discuss its structural potential in the comments below! 👇
#SpaceandTimen #CryptoInfrastructure #tradingStrategy #BinanceSquare #TheStakerX
{future}(SXTUSDT)
🚀 Decoding Space and Time ($SXT ): The Decentralized Data Warehouse Powering Web3 Gaming & DeFi! 📊
Post Body:
The landscape of Web3 infrastructure is undergoing a massive transformation in June 2026, and Space and Time ($SXT ) is right at the center of it. As decentralized applications (dApps) demand faster, tamper-proof data processing, SXT's Proof of SQL technology is proving to be a game-changer for smart contracts.
For crypto traders and long-term investors, infrastructure tokens like SXT offer a unique proposition. Unlike pure hype-driven meme coins, ecosystem pillars that connect major enterprise blockchains with relational databases tend to build solid, long-term valuation.
Looking at the current market structure, high-volume data protocols are quietly accumulating liquidity. Whether you are analyzing spot trading limits or tracking ecosystem rewards, keeping an eye on fundamental infrastructure metrics is what separates disciplined traders from the crowd.
Are you currently holding $SXT in your portfolio, or did you explore it through the recent educational rewards program? Let’s discuss its structural potential in the comments below! 👇
#SpaceandTimen #CryptoInfrastructure #tradingStrategy #BinanceSquare #TheStakerX
Post Body:
The landscape of Web3 infrastructure is undergoing a massive transformation in June 2026, and Space and Time ($SXT ) is right at the center of it. As decentralized applications (dApps) demand faster, tamper-proof data processing, SXT's Proof of SQL technology is proving to be a game-changer for smart contracts.
For crypto traders and long-term investors, infrastructure tokens like SXT offer a unique proposition. Unlike pure hype-driven meme coins, ecosystem pillars that connect major enterprise blockchains with relational databases tend to build solid, long-term valuation.
Looking at the current market structure, high-volume data protocols are quietly accumulating liquidity. Whether you are analyzing spot trading limits or tracking ecosystem rewards, keeping an eye on fundamental infrastructure metrics is what separates disciplined traders from the crowd.
Are you currently holding $SXT in your portfolio, or did you explore it through the recent educational rewards program? Let’s discuss its structural potential in the comments below! 👇
#SpaceandTimen #CryptoInfrastructure #tradingStrategy #BinanceSquare #TheStakerX
422
1
13
484

·
--
Bullish
🚨 $SXT IS COILING AT THE ABSOLUTE
BOTTOM — EARLY POSITIONING ZONE 🚨
This is not a bounce… this is accumulation after a full reset.
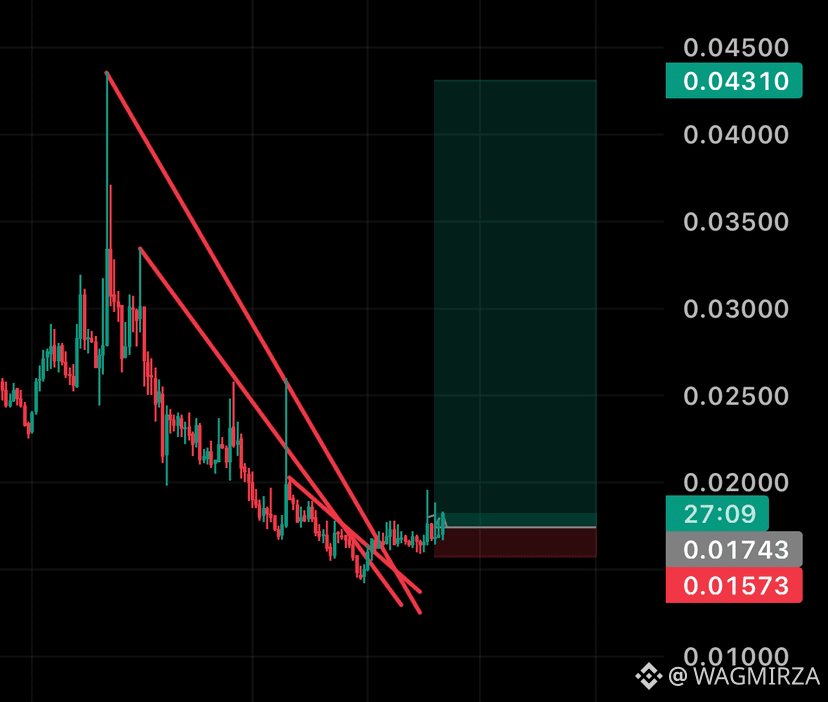
💎 SPOT ENTRY: 0.01820 - 0.01830
🎯 TARGET: 0.0335 (2X+)
🛑 SL: 0.0140
💭 This is where no one wants to buy…
then everyone wants it after it runs.
$SXT is in early accumulation — next leg can hit fast once it wakes up 🚀
#SpaceandTimen #cryptotrading #altcoins #bullish #BinanceSquare $RAVE
{spot}(SXTUSDT)
🚨 $SXT IS COILING AT THE ABSOLUTE
BOTTOM — EARLY POSITIONING ZONE 🚨
This is not a bounce… this is accumulation after a full reset.
💎 SPOT ENTRY: 0.01820 - 0.01830
🎯 TARGET: 0.0335 (2X+)
🛑 SL: 0.0140
💭 This is where no one wants to buy…
then everyone wants it after it runs.
$SXT is in early accumulation — next leg can hit fast once it wakes up 🚀
#SpaceandTimen #cryptotrading #altcoins #bullish #BinanceSquare $RAVE
BOTTOM — EARLY POSITIONING ZONE 🚨
This is not a bounce… this is accumulation after a full reset.
💎 SPOT ENTRY: 0.01820 - 0.01830
🎯 TARGET: 0.0335 (2X+)
🛑 SL: 0.0140
💭 This is where no one wants to buy…
then everyone wants it after it runs.
$SXT is in early accumulation — next leg can hit fast once it wakes up 🚀
#SpaceandTimen #cryptotrading #altcoins #bullish #BinanceSquare $RAVE
2
588

·
--
Bearish
🔴 $SXT
{future}(SXTUSDT)
Long Liquidation Alert
💰 Liquidated Amount:
$1.2543K
📍 Liquidation Price:
$0.00910 (BINANCE)
━━━━━━━━━━━━━━
📊 Trade Outlook
🎯 Target:
$0.00895
📥 Entry Zone:
$0.00906–$0.00903
📈 Take Profit:
$0.00899
🛑 Stop Loss:
$0.00920
━━━━━━━━━━━━━━
⚡ ELITE TRADE INSIGHT ⚡
The latest long liquidation suggests sellers have regained short-term control while downside liquidity remains active. A confirmed rejection below nearby resistance would provide a stronger technical signal than entering immediately. Maintain prudent position sizing throughout.
#SXT #SpaceandTimen #AI
🔴 $SXT
Long Liquidation Alert
💰 Liquidated Amount:
$1.2543K
📍 Liquidation Price:
$0.00910 (BINANCE)
━━━━━━━━━━━━━━
📊 Trade Outlook
🎯 Target:
$0.00895
📥 Entry Zone:
$0.00906–$0.00903
📈 Take Profit:
$0.00899
🛑 Stop Loss:
$0.00920
━━━━━━━━━━━━━━
⚡ ELITE TRADE INSIGHT ⚡
The latest long liquidation suggests sellers have regained short-term control while downside liquidity remains active. A confirmed rejection below nearby resistance would provide a stronger technical signal than entering immediately. Maintain prudent position sizing throughout.
#SXT #SpaceandTimen #AI
Long Liquidation Alert
💰 Liquidated Amount:
$1.2543K
📍 Liquidation Price:
$0.00910 (BINANCE)
━━━━━━━━━━━━━━
📊 Trade Outlook
🎯 Target:
$0.00895
📥 Entry Zone:
$0.00906–$0.00903
📈 Take Profit:
$0.00899
🛑 Stop Loss:
$0.00920
━━━━━━━━━━━━━━
⚡ ELITE TRADE INSIGHT ⚡
The latest long liquidation suggests sellers have regained short-term control while downside liquidity remains active. A confirmed rejection below nearby resistance would provide a stronger technical signal than entering immediately. Maintain prudent position sizing throughout.
#SXT #SpaceandTimen #AI
85
Log in to explore more content
Join global crypto users on Binance Square
⚡️ Get latest and useful information about crypto.
💬 Trusted by the world’s largest crypto exchange.
👍 Discover real insights from verified creators.
Email / Phone number
Trending Topics
1
#HuangExitNvidiaStrategyInFocus
84,196 views
942 Discussing
2
#AnthropicRejectsIPODelayValuationinQuestion
684,188 views
5,217 Discussing
3
#BitMineReports$6.3BNetLossForFiscal2026
10,604 views
115 Discussing
4
#ChipStocksExtendLossesAfterNvidiaCEOChange
32,944 views
417 Discussing
5
#ThailandProposes$148KDailyStablecoinDepositWithdrawalCaps
3,035 views
45 Discussing
6
#CoreWeaveJumps10%On168%RevenueGrowth
186,547 views
1,650 Discussing
7
#ZcashFallsBelow$1000ForFirstTimeSinceSeptember
87,637 views
260 Discussing
8
#MSCIRemovalMayCurbStrategy’sBitcoinBuying
53,666 views
588 Discussing
9
#TradFiForBeginners
531,552 views
3,687 Discussing
10
#USJoblessClaimsRise
19.1M views
7,797 Discussing