
#stxx
stxx
13,301 views
273 Discussing
Hot
Latest

·
--
$STXX daily line dropped 5.446% to 766.16. While the price is weakening, the funding rate is still positive at 0.00037033. When the price falls and longs are the ones paying, this is a typical long-squeeze trap plus averaging-in structure.
This divergence is dangerous. In a downward price channel, the longs are still paying to maintain their positions—essentially stubbornly holding against the trend. Once buy-side liquidity dries up, it can easily turn into a long-squeeze.
Right now, there isn’t a clear geopolitical escalation event seen in the market that would trigger a flight-to-safety move. The selling pressure on U.S. stock index futures contracts may simply come from long liquidation.
On the other hand, the open interest at 2030.32 isn’t that high, suggesting that long leverage buildup hasn’t reached an extreme level yet. If things really collapse, it may still take a bearish candle to trigger a chain reaction. But positive funding is steadily bleeding—your holding cost is accumulating day by day.
My view: Until the price stabilizes or the funding rate turns negative, the long setup here has very poor cost-effectiveness. This isn’t a time to catch a falling knife; it’s mainly a wait-and-see situation.
Invalidation condition: If <STXX> can reclaim above 780 and the funding rate returns to zero, it would mean the longs managed to hold on—then I’d consider trying longs again. If it breaks below 750, the longs’ surrender orders will come out; don’t catch the knife.
Trading tag: #TradFi #链上美股 #STXX
Where do you think this thesis is most likely to be wrong?
$STXX daily line dropped 5.446% to 766.16. While the price is weakening, the funding rate is still positive at 0.00037033. When the price falls and longs are the ones paying, this is a typical long-squeeze trap plus averaging-in structure.
This divergence is dangerous. In a downward price channel, the longs are still paying to maintain their positions—essentially stubbornly holding against the trend. Once buy-side liquidity dries up, it can easily turn into a long-squeeze.
Right now, there isn’t a clear geopolitical escalation event seen in the market that would trigger a flight-to-safety move. The selling pressure on U.S. stock index futures contracts may simply come from long liquidation.
On the other hand, the open interest at 2030.32 isn’t that high, suggesting that long leverage buildup hasn’t reached an extreme level yet. If things really collapse, it may still take a bearish candle to trigger a chain reaction. But positive funding is steadily bleeding—your holding cost is accumulating day by day.
My view: Until the price stabilizes or the funding rate turns negative, the long setup here has very poor cost-effectiveness. This isn’t a time to catch a falling knife; it’s mainly a wait-and-see situation.
Invalidation condition: If <STXX> can reclaim above 780 and the funding rate returns to zero, it would mean the longs managed to hold on—then I’d consider trying longs again. If it breaks below 750, the longs’ surrender orders will come out; don’t catch the knife.
Trading tag: #TradFi #链上美股 #STXX
Where do you think this thesis is most likely to be wrong?
This divergence is dangerous. In a downward price channel, the longs are still paying to maintain their positions—essentially stubbornly holding against the trend. Once buy-side liquidity dries up, it can easily turn into a long-squeeze.
Right now, there isn’t a clear geopolitical escalation event seen in the market that would trigger a flight-to-safety move. The selling pressure on U.S. stock index futures contracts may simply come from long liquidation.
On the other hand, the open interest at 2030.32 isn’t that high, suggesting that long leverage buildup hasn’t reached an extreme level yet. If things really collapse, it may still take a bearish candle to trigger a chain reaction. But positive funding is steadily bleeding—your holding cost is accumulating day by day.
My view: Until the price stabilizes or the funding rate turns negative, the long setup here has very poor cost-effectiveness. This isn’t a time to catch a falling knife; it’s mainly a wait-and-see situation.
Invalidation condition: If <STXX> can reclaim above 780 and the funding rate returns to zero, it would mean the longs managed to hold on—then I’d consider trying longs again. If it breaks below 750, the longs’ surrender orders will come out; don’t catch the knife.
Trading tag: #TradFi #链上美股 #STXX
Where do you think this thesis is most likely to be wrong?
23

·
--
$STXX in the past 24 hours fell 3.425%, while the funding rate was -0.00029251. This is a typical structure of falling prices layered with a negative funding rate—short positions are paying, and bearish consensus is strong.
Shorts are crowded, but the price is still falling, which suggests the selling pressure is real, not just liquidations of long positions. A negative funding rate means shorts are paying to maintain their positions; they’re betting on further downside. The position size of 1520.88 isn’t an extreme value—if the price rebounds quickly, these shorts could be squeezed.
The strongest counter-evidence is that the project team or long-term holders have low-cost inventory and are taking bids at the current level.
Trading tag: #TradFi #链上美股 #STXX
Where do you think this analysis is most likely to be wrong?
$STXX in the past 24 hours fell 3.425%, while the funding rate was -0.00029251. This is a typical structure of falling prices layered with a negative funding rate—short positions are paying, and bearish consensus is strong.
Shorts are crowded, but the price is still falling, which suggests the selling pressure is real, not just liquidations of long positions. A negative funding rate means shorts are paying to maintain their positions; they’re betting on further downside. The position size of 1520.88 isn’t an extreme value—if the price rebounds quickly, these shorts could be squeezed.
The strongest counter-evidence is that the project team or long-term holders have low-cost inventory and are taking bids at the current level.
Trading tag: #TradFi #链上美股 #STXX
Where do you think this analysis is most likely to be wrong?
Shorts are crowded, but the price is still falling, which suggests the selling pressure is real, not just liquidations of long positions. A negative funding rate means shorts are paying to maintain their positions; they’re betting on further downside. The position size of 1520.88 isn’t an extreme value—if the price rebounds quickly, these shorts could be squeezed.
The strongest counter-evidence is that the project team or long-term holders have low-cost inventory and are taking bids at the current level.
Trading tag: #TradFi #链上美股 #STXX
Where do you think this analysis is most likely to be wrong?
·
--
$STXX has fallen 3.425% over the past 24 hours; the price is around 808. The funding rate is -0.00029251, meaning the shorts are paying the longs. The price drop combined with negative funding is a typical sign of short accumulation, strengthening the bearish consensus.
If the price continues to drift downward, long position holders will face a double hit—losing on both price and funding fees—forcing them to stop out and exit. Currently, the open interest is 1520.88. If the price rebounds to the prior high, these shorts’ stop-loss orders could be triggered, potentially sparking a short squeeze.
Trading tag: #TradFi #链上美股 #STXX
Where do you think this analysis is most likely to be wrong?
$STXX has fallen 3.425% over the past 24 hours; the price is around 808. The funding rate is -0.00029251, meaning the shorts are paying the longs. The price drop combined with negative funding is a typical sign of short accumulation, strengthening the bearish consensus.
If the price continues to drift downward, long position holders will face a double hit—losing on both price and funding fees—forcing them to stop out and exit. Currently, the open interest is 1520.88. If the price rebounds to the prior high, these shorts’ stop-loss orders could be triggered, potentially sparking a short squeeze.
Trading tag: #TradFi #链上美股 #STXX
Where do you think this analysis is most likely to be wrong?
If the price continues to drift downward, long position holders will face a double hit—losing on both price and funding fees—forcing them to stop out and exit. Currently, the open interest is 1520.88. If the price rebounds to the prior high, these shorts’ stop-loss orders could be triggered, potentially sparking a short squeeze.
Trading tag: #TradFi #链上美股 #STXX
Where do you think this analysis is most likely to be wrong?
2

·
--
STXX current price 836.53, down 3.939% over the past 24 hours. This pullback isn’t small compared to assets in the semiconductor/AI chain. Old Dog took a look at the order-book data: the funding rate is 0, which means neither bulls nor bears are currently paying an obvious premium to hold positions—it's a fairly balanced tug-of-war. However, the open interest is 1440.45, and the trading volume exceeds 3.22 million. This combination of heavy-volume decline suggests there are spot sell orders putting pressure in real time; it’s not that kind of low-volume, slow grind lower.
Why are assets on the semiconductor chain under collective pressure today? Looking only at STXX, its funding rate is zero while the price is falling—this structure is quite rare. Typically, a decline with a positive funding rate indicates longs are “dying hard” to hold their ground; a decline with a negative funding rate indicates shorts are adding aggressively. A zero-funding-rate drop looks more like the market losing its direction, leading some position holders to choose to step out and observe. Even though specific peer-comparison data hasn’t been provided, STXX’s move reflects that the market’s near-term sentiment toward the semiconductor/AI sector has become split: money is looking for certainty rather than stubbornly holding positions.
My view is that STXX is testing the market’s patience—not fundamentals. With the funding rate flat and the price probing lower, there hasn’t been a panic-like short squeeze or a frenzy of long dip-buying. The market is in an “unanchored” state. The cost of that state is that volatility is suppressed; once new information arrives (whether good or bad), the breakout momentum will be stronger than usual. Old Dog’s current stance is to observe with a light position; I won’t add at this level. If the price can stabilize above 836 and the funding rate turns positive (even just 0.0001), that may mean new long forces are starting to enter and absorb supply—then I’d consider trying a small long. Conversely, if the price keeps falling and the funding rate turns negative, it means shorts are taking the lead; then I would completely avoid this contract.
Where is this judgment most likely to be wrong? If the whole semiconductor/AI narrative suddenly gets ignited by some external macro data (for example, changes in rate-cut expectations), and all assets surge together, then STXX’s current unanchored state would be immediately broken. Shorts would quickly cover, and the price could rebound in a V-shape. In that scenario, holding to the low-funding-rate logic would cause you to miss the move. So the invalidation condition is: when other assets in the same sector show broad-based, volume-supported rallies, and STXX’s funding rate rapidly flips from zero to positive.
Trading tag: #BinanceFutures #TradFi #USDⓈM #STXX #STXXUSDT $STXX
STXX current price 836.53, down 3.939% over the past 24 hours. This pullback isn’t small compared to assets in the semiconductor/AI chain. Old Dog took a look at the order-book data: the funding rate is 0, which means neither bulls nor bears are currently paying an obvious premium to hold positions—it's a fairly balanced tug-of-war. However, the open interest is 1440.45, and the trading volume exceeds 3.22 million. This combination of heavy-volume decline suggests there are spot sell orders putting pressure in real time; it’s not that kind of low-volume, slow grind lower.
Why are assets on the semiconductor chain under collective pressure today? Looking only at STXX, its funding rate is zero while the price is falling—this structure is quite rare. Typically, a decline with a positive funding rate indicates longs are “dying hard” to hold their ground; a decline with a negative funding rate indicates shorts are adding aggressively. A zero-funding-rate drop looks more like the market losing its direction, leading some position holders to choose to step out and observe. Even though specific peer-comparison data hasn’t been provided, STXX’s move reflects that the market’s near-term sentiment toward the semiconductor/AI sector has become split: money is looking for certainty rather than stubbornly holding positions.
My view is that STXX is testing the market’s patience—not fundamentals. With the funding rate flat and the price probing lower, there hasn’t been a panic-like short squeeze or a frenzy of long dip-buying. The market is in an “unanchored” state. The cost of that state is that volatility is suppressed; once new information arrives (whether good or bad), the breakout momentum will be stronger than usual. Old Dog’s current stance is to observe with a light position; I won’t add at this level. If the price can stabilize above 836 and the funding rate turns positive (even just 0.0001), that may mean new long forces are starting to enter and absorb supply—then I’d consider trying a small long. Conversely, if the price keeps falling and the funding rate turns negative, it means shorts are taking the lead; then I would completely avoid this contract.
Where is this judgment most likely to be wrong? If the whole semiconductor/AI narrative suddenly gets ignited by some external macro data (for example, changes in rate-cut expectations), and all assets surge together, then STXX’s current unanchored state would be immediately broken. Shorts would quickly cover, and the price could rebound in a V-shape. In that scenario, holding to the low-funding-rate logic would cause you to miss the move. So the invalidation condition is: when other assets in the same sector show broad-based, volume-supported rallies, and STXX’s funding rate rapidly flips from zero to positive.
Trading tag: #BinanceFutures #TradFi #USDⓈM #STXX #STXXUSDT $STXX
Why are assets on the semiconductor chain under collective pressure today? Looking only at STXX, its funding rate is zero while the price is falling—this structure is quite rare. Typically, a decline with a positive funding rate indicates longs are “dying hard” to hold their ground; a decline with a negative funding rate indicates shorts are adding aggressively. A zero-funding-rate drop looks more like the market losing its direction, leading some position holders to choose to step out and observe. Even though specific peer-comparison data hasn’t been provided, STXX’s move reflects that the market’s near-term sentiment toward the semiconductor/AI sector has become split: money is looking for certainty rather than stubbornly holding positions.
My view is that STXX is testing the market’s patience—not fundamentals. With the funding rate flat and the price probing lower, there hasn’t been a panic-like short squeeze or a frenzy of long dip-buying. The market is in an “unanchored” state. The cost of that state is that volatility is suppressed; once new information arrives (whether good or bad), the breakout momentum will be stronger than usual. Old Dog’s current stance is to observe with a light position; I won’t add at this level. If the price can stabilize above 836 and the funding rate turns positive (even just 0.0001), that may mean new long forces are starting to enter and absorb supply—then I’d consider trying a small long. Conversely, if the price keeps falling and the funding rate turns negative, it means shorts are taking the lead; then I would completely avoid this contract.
Where is this judgment most likely to be wrong? If the whole semiconductor/AI narrative suddenly gets ignited by some external macro data (for example, changes in rate-cut expectations), and all assets surge together, then STXX’s current unanchored state would be immediately broken. Shorts would quickly cover, and the price could rebound in a V-shape. In that scenario, holding to the low-funding-rate logic would cause you to miss the move. So the invalidation condition is: when other assets in the same sector show broad-based, volume-supported rallies, and STXX’s funding rate rapidly flips from zero to positive.
Trading tag: #BinanceFutures #TradFi #USDⓈM #STXX #STXXUSDT $STXX
16
·
--
[M1_mag7]
The old dog glanced at $STXX: over the past 24 hours it’s down 4.53%, with the price pinned at 832.06, while the funding rate stays completely unchanged at 0. Open interest is 1428.43. In on-chain US stock futures, this set of data clearly shows that both longs and shorts can’t be bothered to move.
What matters is that this is anchored to the Mag7 market, but with the dip of $STXX , I think it has limited relation to overall market beta; more likely it’s the result of the contract’s own liquidity drying up, with volumes shrinking. A zero funding rate means longs haven’t paid shorts, so there’s no squeeze pressure from shorts. And since open interest hasn’t shrunk noticeably, it suggests old positions didn’t really exit—only the price drifted down a bit due to relatively light sell orders. Trading volume is around 3.21 million; compared with price conversion, the position cost should be concentrated around the 830 area and oscillating there.
My take: with the zero funding rate plus stable open interest, this is likely just a choppy range in the near term. The direction will depend on the funding rate flipping sign or the price breaking out of the range. If the price breaks below 830, I’ll cut 30% of my position. If the funding rate turns negative instead, you could even try going long with a light position, because that would mean shorts have started to enter and the probability of a short-term rebound increases. What the market is ignoring right now is that a zero funding rate often isn’t true balance—it’s a stalemate. Once it breaks, it can easily turn into a one-way move.
The counterargument says this spot might be a top; I disagree, and my reason is that open interest hasn’t collapsed.
Trading tag: #BinanceFutures #TradFi #USDⓈM #STXX #STXXUSDT $STXX
[M1_mag7]
The old dog glanced at $STXX : over the past 24 hours it’s down 4.53%, with the price pinned at 832.06, while the funding rate stays completely unchanged at 0. Open interest is 1428.43. In on-chain US stock futures, this set of data clearly shows that both longs and shorts can’t be bothered to move.
What matters is that this is anchored to the Mag7 market, but with the dip of $STXX , I think it has limited relation to overall market beta; more likely it’s the result of the contract’s own liquidity drying up, with volumes shrinking. A zero funding rate means longs haven’t paid shorts, so there’s no squeeze pressure from shorts. And since open interest hasn’t shrunk noticeably, it suggests old positions didn’t really exit—only the price drifted down a bit due to relatively light sell orders. Trading volume is around 3.21 million; compared with price conversion, the position cost should be concentrated around the 830 area and oscillating there.
My take: with the zero funding rate plus stable open interest, this is likely just a choppy range in the near term. The direction will depend on the funding rate flipping sign or the price breaking out of the range. If the price breaks below 830, I’ll cut 30% of my position. If the funding rate turns negative instead, you could even try going long with a light position, because that would mean shorts have started to enter and the probability of a short-term rebound increases. What the market is ignoring right now is that a zero funding rate often isn’t true balance—it’s a stalemate. Once it breaks, it can easily turn into a one-way move.
The counterargument says this spot might be a top; I disagree, and my reason is that open interest hasn’t collapsed.
Trading tag: #BinanceFutures #TradFi #USDⓈM #STXX #STXXUSDT $STXX
The old dog glanced at $STXX : over the past 24 hours it’s down 4.53%, with the price pinned at 832.06, while the funding rate stays completely unchanged at 0. Open interest is 1428.43. In on-chain US stock futures, this set of data clearly shows that both longs and shorts can’t be bothered to move.
What matters is that this is anchored to the Mag7 market, but with the dip of $STXX , I think it has limited relation to overall market beta; more likely it’s the result of the contract’s own liquidity drying up, with volumes shrinking. A zero funding rate means longs haven’t paid shorts, so there’s no squeeze pressure from shorts. And since open interest hasn’t shrunk noticeably, it suggests old positions didn’t really exit—only the price drifted down a bit due to relatively light sell orders. Trading volume is around 3.21 million; compared with price conversion, the position cost should be concentrated around the 830 area and oscillating there.
My take: with the zero funding rate plus stable open interest, this is likely just a choppy range in the near term. The direction will depend on the funding rate flipping sign or the price breaking out of the range. If the price breaks below 830, I’ll cut 30% of my position. If the funding rate turns negative instead, you could even try going long with a light position, because that would mean shorts have started to enter and the probability of a short-term rebound increases. What the market is ignoring right now is that a zero funding rate often isn’t true balance—it’s a stalemate. Once it breaks, it can easily turn into a one-way move.
The counterargument says this spot might be a top; I disagree, and my reason is that open interest hasn’t collapsed.
Trading tag: #BinanceFutures #TradFi #USDⓈM #STXX #STXXUSDT $STXX
13
·
--
$STXX in the past 24 hours has fallen by 6.143%. Current quote: 822.03. The price is trending downward, but the funding rate is positive: 0.00037627.
This combination is a clear warning signal in microstructure. When the price drops and the funding rate is positive, it means longs are absorbing losses while also paying shorts every 8 hours. This is a typical long-squeeze-with-additional-shorts-behind structure. The position size of 1458.37, combined with the current price, suggests that longs are maintaining their position with a higher average cost. They are betting on a rebound. But every payment of funding drains their margin. If the price continues to probe lower, these positions will be forced out due to the dual pressure of expanding losses and funding-rate cash extraction, resulting in a cascade.
The strongest counter-argument is: maybe there is a firm long-term long position consistently absorbing the supply. If the position size does not show a significant decline during the price drop, and instead stays level or even ticks up slightly, that would indicate that the counterparty is indeed buying. This could slow down the rate of decline, and might even form a short-term bottom.
The second-order effects are also clear. Those who need to rebalance—specifically traders who opened longs at higher levels and whose margin is now tight—will reduce positions, creating new sell pressure. Shorts, on the other hand, have the initiative: they are collecting funding fees, have a lower cost basis, and can be more patient while waiting for the price to probe lower.
My view is that this microstructure of falling prices combined with a positive funding rate makes the price more likely to drop than rise in the short term. This is not a conclusion drawn from looking at price alone or funding rate alone; it’s the resonance between the two that shows longs are in a passive position.
When would this view be invalidated? Two conditions: first, if the price regains stability above 830 and the funding rate rapidly turns negative, that would mean longs are starting to squeeze shorts; second, if the price keeps falling but the funding rate suddenly turns significantly negative, that would signal a shift in market sentiment toward bearish consensus, crowding shorts and changing the structure.
So my action is straightforward: I will not go long now. I’ll wait for one of the two signals. If the price breaks below the 800 psychological level, I’ll consider following the move to short with a small position size, with a stop-loss above 830. If the funding rate turns into a significantly negative value, I’ll pay attention to potential long opportunities, because that would mean shorts may be getting overheated. For now, I’ll just watch and stay put.
Aggressive scenario: if the price breaks below 800 with a surge in volume, you can cautiously chase a short position with low exposure, targeting the previous low.
Trading tag: #TradFi #链上美股 #STXX
Where do you think this judgment is most likely to be wrong?
$STXX in the past 24 hours has fallen by 6.143%. Current quote: 822.03. The price is trending downward, but the funding rate is positive: 0.00037627.
This combination is a clear warning signal in microstructure. When the price drops and the funding rate is positive, it means longs are absorbing losses while also paying shorts every 8 hours. This is a typical long-squeeze-with-additional-shorts-behind structure. The position size of 1458.37, combined with the current price, suggests that longs are maintaining their position with a higher average cost. They are betting on a rebound. But every payment of funding drains their margin. If the price continues to probe lower, these positions will be forced out due to the dual pressure of expanding losses and funding-rate cash extraction, resulting in a cascade.
The strongest counter-argument is: maybe there is a firm long-term long position consistently absorbing the supply. If the position size does not show a significant decline during the price drop, and instead stays level or even ticks up slightly, that would indicate that the counterparty is indeed buying. This could slow down the rate of decline, and might even form a short-term bottom.
The second-order effects are also clear. Those who need to rebalance—specifically traders who opened longs at higher levels and whose margin is now tight—will reduce positions, creating new sell pressure. Shorts, on the other hand, have the initiative: they are collecting funding fees, have a lower cost basis, and can be more patient while waiting for the price to probe lower.
My view is that this microstructure of falling prices combined with a positive funding rate makes the price more likely to drop than rise in the short term. This is not a conclusion drawn from looking at price alone or funding rate alone; it’s the resonance between the two that shows longs are in a passive position.
When would this view be invalidated? Two conditions: first, if the price regains stability above 830 and the funding rate rapidly turns negative, that would mean longs are starting to squeeze shorts; second, if the price keeps falling but the funding rate suddenly turns significantly negative, that would signal a shift in market sentiment toward bearish consensus, crowding shorts and changing the structure.
So my action is straightforward: I will not go long now. I’ll wait for one of the two signals. If the price breaks below the 800 psychological level, I’ll consider following the move to short with a small position size, with a stop-loss above 830. If the funding rate turns into a significantly negative value, I’ll pay attention to potential long opportunities, because that would mean shorts may be getting overheated. For now, I’ll just watch and stay put.
Aggressive scenario: if the price breaks below 800 with a surge in volume, you can cautiously chase a short position with low exposure, targeting the previous low.
Trading tag: #TradFi #链上美股 #STXX
Where do you think this judgment is most likely to be wrong?
This combination is a clear warning signal in microstructure. When the price drops and the funding rate is positive, it means longs are absorbing losses while also paying shorts every 8 hours. This is a typical long-squeeze-with-additional-shorts-behind structure. The position size of 1458.37, combined with the current price, suggests that longs are maintaining their position with a higher average cost. They are betting on a rebound. But every payment of funding drains their margin. If the price continues to probe lower, these positions will be forced out due to the dual pressure of expanding losses and funding-rate cash extraction, resulting in a cascade.
The strongest counter-argument is: maybe there is a firm long-term long position consistently absorbing the supply. If the position size does not show a significant decline during the price drop, and instead stays level or even ticks up slightly, that would indicate that the counterparty is indeed buying. This could slow down the rate of decline, and might even form a short-term bottom.
The second-order effects are also clear. Those who need to rebalance—specifically traders who opened longs at higher levels and whose margin is now tight—will reduce positions, creating new sell pressure. Shorts, on the other hand, have the initiative: they are collecting funding fees, have a lower cost basis, and can be more patient while waiting for the price to probe lower.
My view is that this microstructure of falling prices combined with a positive funding rate makes the price more likely to drop than rise in the short term. This is not a conclusion drawn from looking at price alone or funding rate alone; it’s the resonance between the two that shows longs are in a passive position.
When would this view be invalidated? Two conditions: first, if the price regains stability above 830 and the funding rate rapidly turns negative, that would mean longs are starting to squeeze shorts; second, if the price keeps falling but the funding rate suddenly turns significantly negative, that would signal a shift in market sentiment toward bearish consensus, crowding shorts and changing the structure.
So my action is straightforward: I will not go long now. I’ll wait for one of the two signals. If the price breaks below the 800 psychological level, I’ll consider following the move to short with a small position size, with a stop-loss above 830. If the funding rate turns into a significantly negative value, I’ll pay attention to potential long opportunities, because that would mean shorts may be getting overheated. For now, I’ll just watch and stay put.
Aggressive scenario: if the price breaks below 800 with a surge in volume, you can cautiously chase a short position with low exposure, targeting the previous low.
Trading tag: #TradFi #链上美股 #STXX
Where do you think this judgment is most likely to be wrong?
31
·
--
24-hour drop of 6.14%, while the funding rate is still hanging at 0.000376%—this TradFi contract $STXX is playing out a classic long-squeeze-and-add-more drama.
As price falls, the longs are still paying the shorts. There’s only one explanation for this combo: either early positions are trapped and stubbornly held, diluting cost while continuing to pay funding fees; or the short-term longs refuse to believe it—buying more the further it drops. Either way, the direction of the fund flow is clear: the longs are bearing the net cost.
Next, look at open positions: open interest is 1458.37, which at the current price is about a $1.2 million notional position. The size isn’t huge, but the burn from financing costs is real.
The strongest counter-evidence would be a high-volume green candle that directly engulfs yesterday’s red candle, with the funding rate simultaneously flipping to negative—meaning the shorts have a traitor and the longs get some breathing room. But based on current data, there’s no sign of that.
The second-order impact is straightforward. This kind of drop + positive funding rate structure will keep draining long cash flow. If price continues to bleed lower, long accounts’ maintenance margin will be eroded twice—part from price movement and part from the daily funding fees. This will force some highly leveraged longs, at some level, to choose to close to cut losses, and their closing actions themselves will increase sell pressure. Shorts, meanwhile, are relatively comfortable: they collect funding fees while waiting for prices to fall.
My view is that until the funding rate turns negative or there’s a strong single-day rebound of more than 3%, the microstructure of $STXX favors the shorts. In a negative feedback loop, every extra day the longs hold means each day their cost rises.
Invalidation conditions are simple: if $STXX breaks above 850 and holds steady, and meanwhile the funding rate falls back below 0.01%, then the current short-squeeze logic fails, and I might switch to watching rather than trading.
In terms of execution, I won’t touch any directional leveraged long. If I have idle capital and want to participate, I’ll wait for a clear reversal signal—such as a significant drop in OI alongside price stabilizing—before considering whether to try a small long position. Now? Wait.
Aggressive scenario: if price breaks below 800 and OI doesn’t meaningfully decline, you can attempt an extremely small short with a stop loss at 830.
Conservative scenario: continue holding cash and observe whether funding rate and price can show a bullish divergence at the bottom.
Avoid scenario: any attempt to open longs in the 820–830 range is a contrarian move—very high risk.
Trading tag: #TradFi #链上美股 #STXX
Where do you think this set of judgments is most likely to be wrong?
24-hour drop of 6.14%, while the funding rate is still hanging at 0.000376%—this TradFi contract $STXX is playing out a classic long-squeeze-and-add-more drama.
As price falls, the longs are still paying the shorts. There’s only one explanation for this combo: either early positions are trapped and stubbornly held, diluting cost while continuing to pay funding fees; or the short-term longs refuse to believe it—buying more the further it drops. Either way, the direction of the fund flow is clear: the longs are bearing the net cost.
Next, look at open positions: open interest is 1458.37, which at the current price is about a $1.2 million notional position. The size isn’t huge, but the burn from financing costs is real.
The strongest counter-evidence would be a high-volume green candle that directly engulfs yesterday’s red candle, with the funding rate simultaneously flipping to negative—meaning the shorts have a traitor and the longs get some breathing room. But based on current data, there’s no sign of that.
The second-order impact is straightforward. This kind of drop + positive funding rate structure will keep draining long cash flow. If price continues to bleed lower, long accounts’ maintenance margin will be eroded twice—part from price movement and part from the daily funding fees. This will force some highly leveraged longs, at some level, to choose to close to cut losses, and their closing actions themselves will increase sell pressure. Shorts, meanwhile, are relatively comfortable: they collect funding fees while waiting for prices to fall.
My view is that until the funding rate turns negative or there’s a strong single-day rebound of more than 3%, the microstructure of $STXX favors the shorts. In a negative feedback loop, every extra day the longs hold means each day their cost rises.
Invalidation conditions are simple: if $STXX breaks above 850 and holds steady, and meanwhile the funding rate falls back below 0.01%, then the current short-squeeze logic fails, and I might switch to watching rather than trading.
In terms of execution, I won’t touch any directional leveraged long. If I have idle capital and want to participate, I’ll wait for a clear reversal signal—such as a significant drop in OI alongside price stabilizing—before considering whether to try a small long position. Now? Wait.
Aggressive scenario: if price breaks below 800 and OI doesn’t meaningfully decline, you can attempt an extremely small short with a stop loss at 830.
Conservative scenario: continue holding cash and observe whether funding rate and price can show a bullish divergence at the bottom.
Avoid scenario: any attempt to open longs in the 820–830 range is a contrarian move—very high risk.
Trading tag: #TradFi #链上美股 #STXX
Where do you think this set of judgments is most likely to be wrong?
As price falls, the longs are still paying the shorts. There’s only one explanation for this combo: either early positions are trapped and stubbornly held, diluting cost while continuing to pay funding fees; or the short-term longs refuse to believe it—buying more the further it drops. Either way, the direction of the fund flow is clear: the longs are bearing the net cost.
Next, look at open positions: open interest is 1458.37, which at the current price is about a $1.2 million notional position. The size isn’t huge, but the burn from financing costs is real.
The strongest counter-evidence would be a high-volume green candle that directly engulfs yesterday’s red candle, with the funding rate simultaneously flipping to negative—meaning the shorts have a traitor and the longs get some breathing room. But based on current data, there’s no sign of that.
The second-order impact is straightforward. This kind of drop + positive funding rate structure will keep draining long cash flow. If price continues to bleed lower, long accounts’ maintenance margin will be eroded twice—part from price movement and part from the daily funding fees. This will force some highly leveraged longs, at some level, to choose to close to cut losses, and their closing actions themselves will increase sell pressure. Shorts, meanwhile, are relatively comfortable: they collect funding fees while waiting for prices to fall.
My view is that until the funding rate turns negative or there’s a strong single-day rebound of more than 3%, the microstructure of $STXX favors the shorts. In a negative feedback loop, every extra day the longs hold means each day their cost rises.
Invalidation conditions are simple: if $STXX breaks above 850 and holds steady, and meanwhile the funding rate falls back below 0.01%, then the current short-squeeze logic fails, and I might switch to watching rather than trading.
In terms of execution, I won’t touch any directional leveraged long. If I have idle capital and want to participate, I’ll wait for a clear reversal signal—such as a significant drop in OI alongside price stabilizing—before considering whether to try a small long position. Now? Wait.
Aggressive scenario: if price breaks below 800 and OI doesn’t meaningfully decline, you can attempt an extremely small short with a stop loss at 830.
Conservative scenario: continue holding cash and observe whether funding rate and price can show a bullish divergence at the bottom.
Avoid scenario: any attempt to open longs in the 820–830 range is a contrarian move—very high risk.
Trading tag: #TradFi #链上美股 #STXX
Where do you think this set of judgments is most likely to be wrong?
9
·
--
$STXX fell 5.9% over the past 24 hours, with the price hovering near 857.37. The funding rate is shown as zero, and open positions total 1116.
This is a single-signal interpretation: when price is falling but the funding rate is zero, it indicates there is no urgency for either longs or shorts to pay financing costs. There is no obvious intention in the market to trigger a leveraged squeeze. This round of decline looks more like a short-term, sentiment-driven correction rather than passive deleveraging caused directly by macro liquidity tightening. With the funding rate flat, longs are not paying for their positions, and shorts are not receiving income—so the market is relatively neutral but slightly cautious and bearish.
The strongest counterargument is a sudden shift in macro data. If the next U.S. core inflation data unexpectedly comes in softer, leading to stronger expectations of Fed rate cuts and a rebound in risk appetite, it could quickly reverse $STXX’s downtrend. At present, there is a lack of such macro catalysts, so price action depends more on its own sentiment.
If the price continues to fall, but the funding rate remains near zero or turns positive, then be alert: longs may be adding to positions against the trend. If a rebound lacks strength, this added positioning could become new selling pressure. Conversely, if the funding rate turns negative, it would suggest that shorts have begun paying funding costs, and the persistence of the decline may weaken.
For now, you should wait.
Trading tag: #TradFi #链上美股 #STXX
Where do you think this set of judgments is most likely to be wrong?
$STXX fell 5.9% over the past 24 hours, with the price hovering near 857.37. The funding rate is shown as zero, and open positions total 1116.
This is a single-signal interpretation: when price is falling but the funding rate is zero, it indicates there is no urgency for either longs or shorts to pay financing costs. There is no obvious intention in the market to trigger a leveraged squeeze. This round of decline looks more like a short-term, sentiment-driven correction rather than passive deleveraging caused directly by macro liquidity tightening. With the funding rate flat, longs are not paying for their positions, and shorts are not receiving income—so the market is relatively neutral but slightly cautious and bearish.
The strongest counterargument is a sudden shift in macro data. If the next U.S. core inflation data unexpectedly comes in softer, leading to stronger expectations of Fed rate cuts and a rebound in risk appetite, it could quickly reverse $STXX ’s downtrend. At present, there is a lack of such macro catalysts, so price action depends more on its own sentiment.
If the price continues to fall, but the funding rate remains near zero or turns positive, then be alert: longs may be adding to positions against the trend. If a rebound lacks strength, this added positioning could become new selling pressure. Conversely, if the funding rate turns negative, it would suggest that shorts have begun paying funding costs, and the persistence of the decline may weaken.
For now, you should wait.
Trading tag: #TradFi #链上美股 #STXX
Where do you think this set of judgments is most likely to be wrong?
This is a single-signal interpretation: when price is falling but the funding rate is zero, it indicates there is no urgency for either longs or shorts to pay financing costs. There is no obvious intention in the market to trigger a leveraged squeeze. This round of decline looks more like a short-term, sentiment-driven correction rather than passive deleveraging caused directly by macro liquidity tightening. With the funding rate flat, longs are not paying for their positions, and shorts are not receiving income—so the market is relatively neutral but slightly cautious and bearish.
The strongest counterargument is a sudden shift in macro data. If the next U.S. core inflation data unexpectedly comes in softer, leading to stronger expectations of Fed rate cuts and a rebound in risk appetite, it could quickly reverse $STXX ’s downtrend. At present, there is a lack of such macro catalysts, so price action depends more on its own sentiment.
If the price continues to fall, but the funding rate remains near zero or turns positive, then be alert: longs may be adding to positions against the trend. If a rebound lacks strength, this added positioning could become new selling pressure. Conversely, if the funding rate turns negative, it would suggest that shorts have begun paying funding costs, and the persistence of the decline may weaken.
For now, you should wait.
Trading tag: #TradFi #链上美股 #STXX
Where do you think this set of judgments is most likely to be wrong?
7
·
--
$STXX current price 857.37, down 5.902% over the past 24 hours. The funding rate for perpetual contracts is zero, and the open interest is only 1116.03 contracts. When the price is falling, the funding rate doesn’t budge at all, and the open interest is so low there’s almost no sign of leverage-driven positioning in either direction.
This combination points to a conclusion: the drop is driven by sell pressure on the spot market, and the long vs. short forces in the perpetual market have not stepped in. A zero funding rate means neither side is paying to maintain positions, and such extremely low open interest suggests there are hardly any leveraged longs or shorts accumulating here. This doesn’t look like a defeat after a fierce long-vs-short battle—it looks more like a retreat on an abandoned battlefield that major players have largely ignored.
The counterevidence is: if, when the price rebounds, the open interest suddenly expands and the funding rate turns positive, that would indicate leveraged longs are starting to enter and buy the dip, weakening the spot sell-pressure narrative. The next step in the transmission chain would be that if spot sell orders keep coming, it may lure arbitrageurs in the contract market to open shorts at low levels—but with funding currently at zero, opening shorts has no cost advantage, so the motivation for arbitrage shorts is not strong either.
The spot sell pressure hasn’t stopped, and contract liquidity has dried up. With perpetual open interest so low, the price-discovery function has effectively failed—this isn’t a place to do short-term trading.
Trading tag: #TradFi #链上美股 #STXX
Where do you think this assessment is most likely to be wrong?
$STXX current price 857.37, down 5.902% over the past 24 hours. The funding rate for perpetual contracts is zero, and the open interest is only 1116.03 contracts. When the price is falling, the funding rate doesn’t budge at all, and the open interest is so low there’s almost no sign of leverage-driven positioning in either direction.
This combination points to a conclusion: the drop is driven by sell pressure on the spot market, and the long vs. short forces in the perpetual market have not stepped in. A zero funding rate means neither side is paying to maintain positions, and such extremely low open interest suggests there are hardly any leveraged longs or shorts accumulating here. This doesn’t look like a defeat after a fierce long-vs-short battle—it looks more like a retreat on an abandoned battlefield that major players have largely ignored.
The counterevidence is: if, when the price rebounds, the open interest suddenly expands and the funding rate turns positive, that would indicate leveraged longs are starting to enter and buy the dip, weakening the spot sell-pressure narrative. The next step in the transmission chain would be that if spot sell orders keep coming, it may lure arbitrageurs in the contract market to open shorts at low levels—but with funding currently at zero, opening shorts has no cost advantage, so the motivation for arbitrage shorts is not strong either.
The spot sell pressure hasn’t stopped, and contract liquidity has dried up. With perpetual open interest so low, the price-discovery function has effectively failed—this isn’t a place to do short-term trading.
Trading tag: #TradFi #链上美股 #STXX
Where do you think this assessment is most likely to be wrong?
This combination points to a conclusion: the drop is driven by sell pressure on the spot market, and the long vs. short forces in the perpetual market have not stepped in. A zero funding rate means neither side is paying to maintain positions, and such extremely low open interest suggests there are hardly any leveraged longs or shorts accumulating here. This doesn’t look like a defeat after a fierce long-vs-short battle—it looks more like a retreat on an abandoned battlefield that major players have largely ignored.
The counterevidence is: if, when the price rebounds, the open interest suddenly expands and the funding rate turns positive, that would indicate leveraged longs are starting to enter and buy the dip, weakening the spot sell-pressure narrative. The next step in the transmission chain would be that if spot sell orders keep coming, it may lure arbitrageurs in the contract market to open shorts at low levels—but with funding currently at zero, opening shorts has no cost advantage, so the motivation for arbitrage shorts is not strong either.
The spot sell pressure hasn’t stopped, and contract liquidity has dried up. With perpetual open interest so low, the price-discovery function has effectively failed—this isn’t a place to do short-term trading.
Trading tag: #TradFi #链上美股 #STXX
Where do you think this assessment is most likely to be wrong?
7

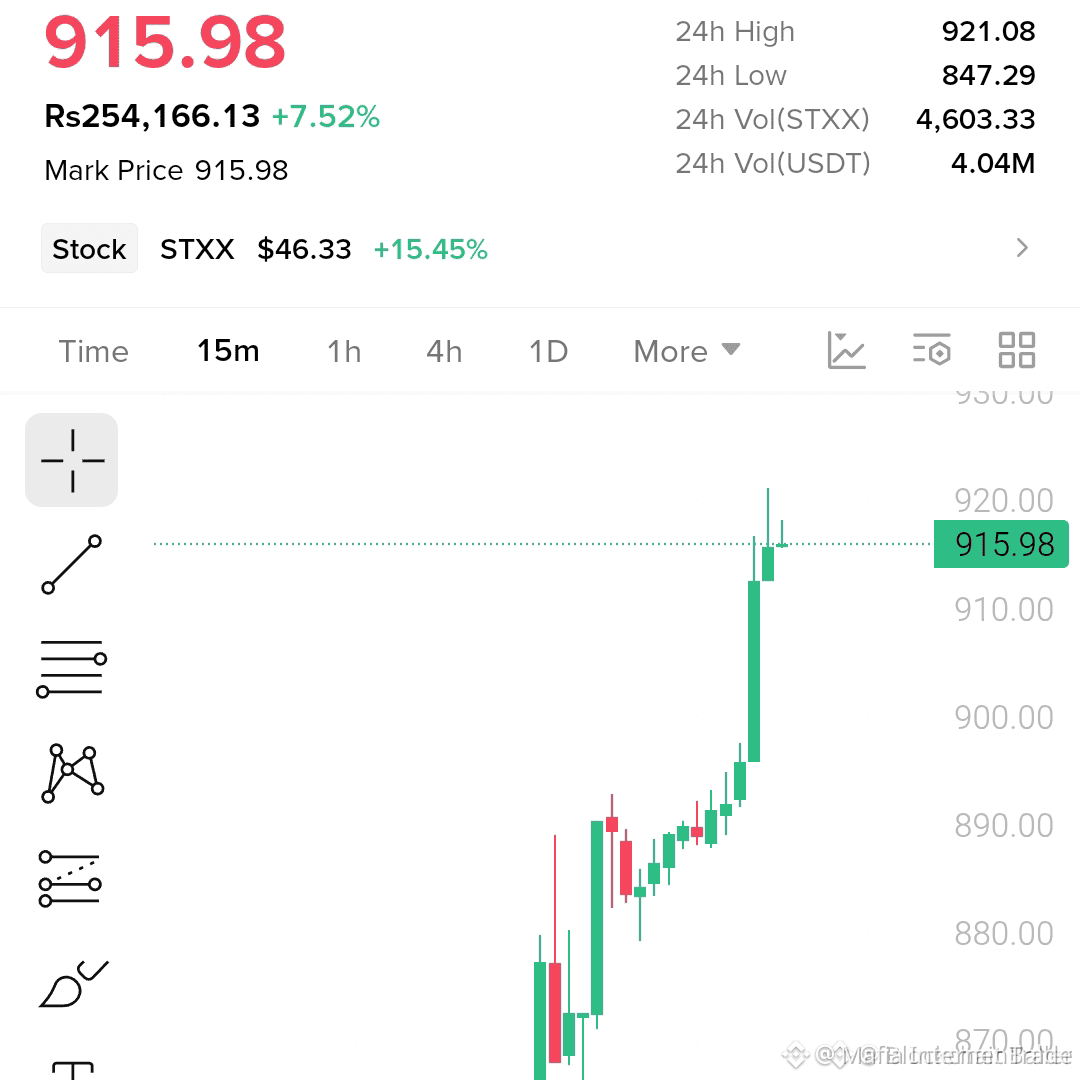
🚀 $STXX SURFING A LIQUIDITY SWEEP—READY TO BREAK $925? 📈
Entry: 910-916 ⚡
Target: 925/935 🚀
Stop Loss: 898 ⚠️
🦈 Smart money has been gobbling liquidity around the $910‑$916 zone, forcing sellers to capitulate. 📊 Volume spikes on the 4H chart confirm a fresh buying surge, while the order block holds firm like a steel wall. 💡 With the next resistance at $925 and a secondary push to $935, the upside runway feels almost unstoppable.
💬 Are you stacking bids now or waiting for the next liquidity dump to flip the game? 👇
⚠️ Not financial advice. Always manage your risk. 🛡️
🏷️ #STXX #LongSetup #Bullish #Crypto
🔥 💎
🚀 $STXX SURFING A LIQUIDITY SWEEP—READY TO BREAK $925? 📈
Entry: 910-916 ⚡
Target: 925/935 🚀
Stop Loss: 898 ⚠️
🦈 Smart money has been gobbling liquidity around the $910‑$916 zone, forcing sellers to capitulate. 📊 Volume spikes on the 4H chart confirm a fresh buying surge, while the order block holds firm like a steel wall. 💡 With the next resistance at $925 and a secondary push to $935, the upside runway feels almost unstoppable.
💬 Are you stacking bids now or waiting for the next liquidity dump to flip the game? 👇
⚠️ Not financial advice. Always manage your risk. 🛡️
🏷️ #STXX #LongSetup #Bullish #Crypto
🔥 💎
Entry: 910-916 ⚡
Target: 925/935 🚀
Stop Loss: 898 ⚠️
🦈 Smart money has been gobbling liquidity around the $910‑$916 zone, forcing sellers to capitulate. 📊 Volume spikes on the 4H chart confirm a fresh buying surge, while the order block holds firm like a steel wall. 💡 With the next resistance at $925 and a secondary push to $935, the upside runway feels almost unstoppable.
💬 Are you stacking bids now or waiting for the next liquidity dump to flip the game? 👇
⚠️ Not financial advice. Always manage your risk. 🛡️
🏷️ #STXX #LongSetup #Bullish #Crypto
🔥 💎
49

·
--
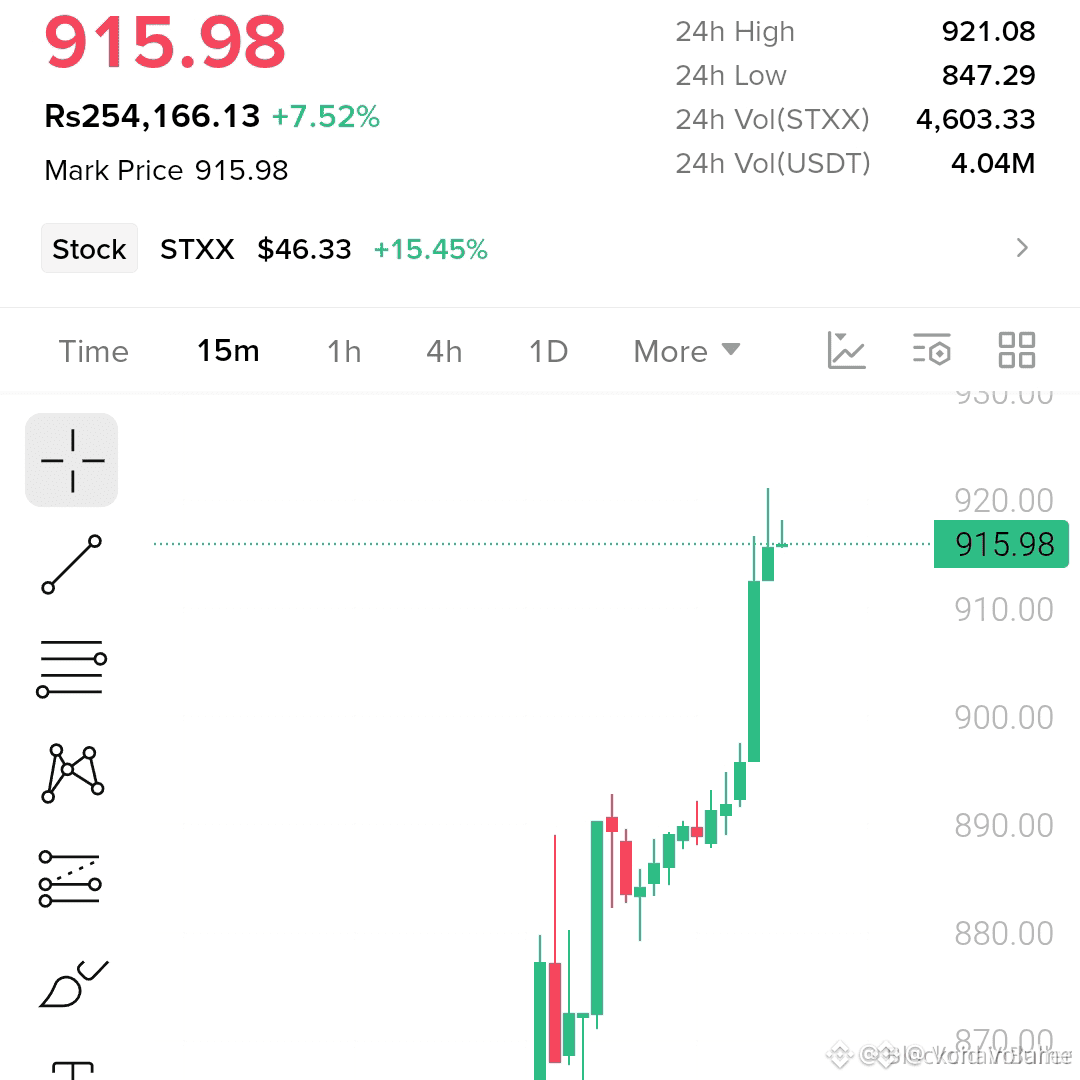
🚨 $STXX POISED FOR QUICK SURGE FROM LIQUIDITY SWEEP! 📈
Entry: 910‑916 ⚡
Target: 925‑935 🚀
Stop Loss: 898 ⚠️
📊 The demand block anchored at $910‑$916 has absorbed aggressive selling three times this week, signaling smart‑money accumulation. 🦈 Volume on the 4H chart is expanding, and the price is testing a narrow range that historically precedes a breakout. 💡 A clean 1:4 R‑R emerges as the market reclaims the gap, setting the stage for a swift upward thrust.
💬 Are you ready to ride the next liquidity‑driven rally? 👇
⚠️ Not financial advice. Always manage your risk. 🛡️
🏷️ #STXX #LongSetup #Liquidity #Crypto
🔥 💎
🚨 $STXX POISED FOR QUICK SURGE FROM LIQUIDITY SWEEP! 📈
Entry: 910‑916 ⚡
Target: 925‑935 🚀
Stop Loss: 898 ⚠️
📊 The demand block anchored at $910‑$916 has absorbed aggressive selling three times this week, signaling smart‑money accumulation. 🦈 Volume on the 4H chart is expanding, and the price is testing a narrow range that historically precedes a breakout. 💡 A clean 1:4 R‑R emerges as the market reclaims the gap, setting the stage for a swift upward thrust.
💬 Are you ready to ride the next liquidity‑driven rally? 👇
⚠️ Not financial advice. Always manage your risk. 🛡️
🏷️ #STXX #LongSetup #Liquidity #Crypto
🔥 💎
Entry: 910‑916 ⚡
Target: 925‑935 🚀
Stop Loss: 898 ⚠️
📊 The demand block anchored at $910‑$916 has absorbed aggressive selling three times this week, signaling smart‑money accumulation. 🦈 Volume on the 4H chart is expanding, and the price is testing a narrow range that historically precedes a breakout. 💡 A clean 1:4 R‑R emerges as the market reclaims the gap, setting the stage for a swift upward thrust.
💬 Are you ready to ride the next liquidity‑driven rally? 👇
⚠️ Not financial advice. Always manage your risk. 🛡️
🏷️ #STXX #LongSetup #Liquidity #Crypto
🔥 💎
56


·
--
Bullish
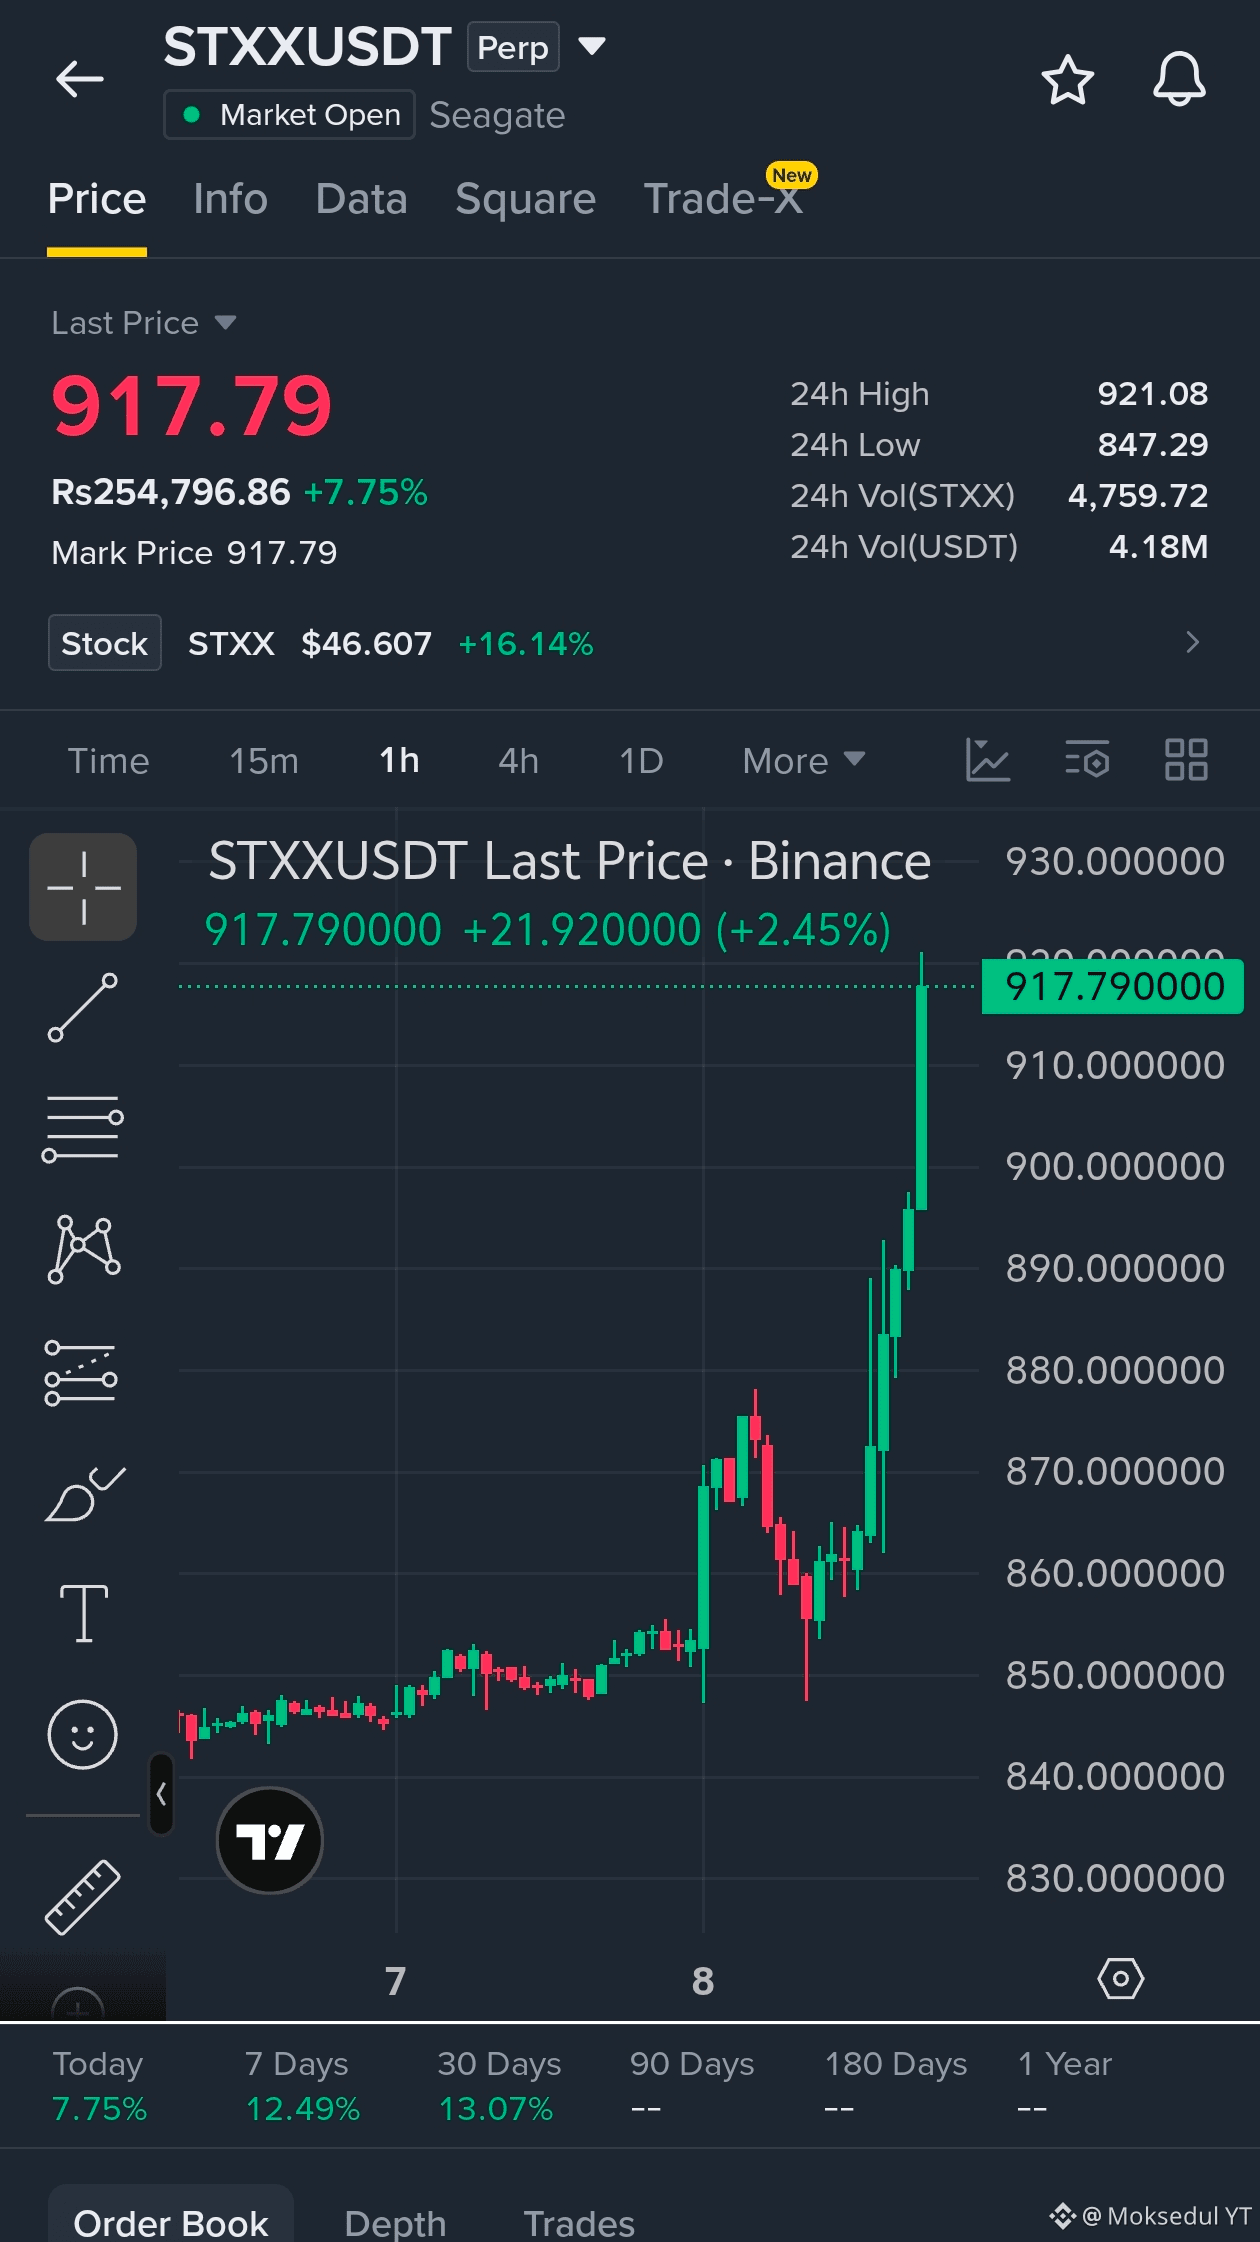
Guys, I have just opened a long position on $STXX with 25x leverage....
#STXX is outperforming the market with 7.75% gains today, showing strong relative strength against other assets.
Breaking $921.08 could send it flying toward $950.00 → $980.00, while a dip below $890.00 would be a temporary setback.
Entry: $910.00–$920.00
TP: $950.00 → $980.00 → $1000.00
SL: $880.00
Buy and Trade
{future}(STXXUSDT)
$BULLA
{future}(BULLAUSDT)
$ZEC
{future}(ZECUSDT)
Guys, I have just opened a long position on $STXX with 25x leverage....
#STXX is outperforming the market with 7.75% gains today, showing strong relative strength against other assets.
Breaking $921.08 could send it flying toward $950.00 → $980.00, while a dip below $890.00 would be a temporary setback.
Entry: $910.00–$920.00
TP: $950.00 → $980.00 → $1000.00
SL: $880.00
Buy and Trade
$BULLA
$ZEC
#STXX is outperforming the market with 7.75% gains today, showing strong relative strength against other assets.
Breaking $921.08 could send it flying toward $950.00 → $980.00, while a dip below $890.00 would be a temporary setback.
Entry: $910.00–$920.00
TP: $950.00 → $980.00 → $1000.00
SL: $880.00
Buy and Trade
$BULLA
$ZEC
1
3
482

·
--
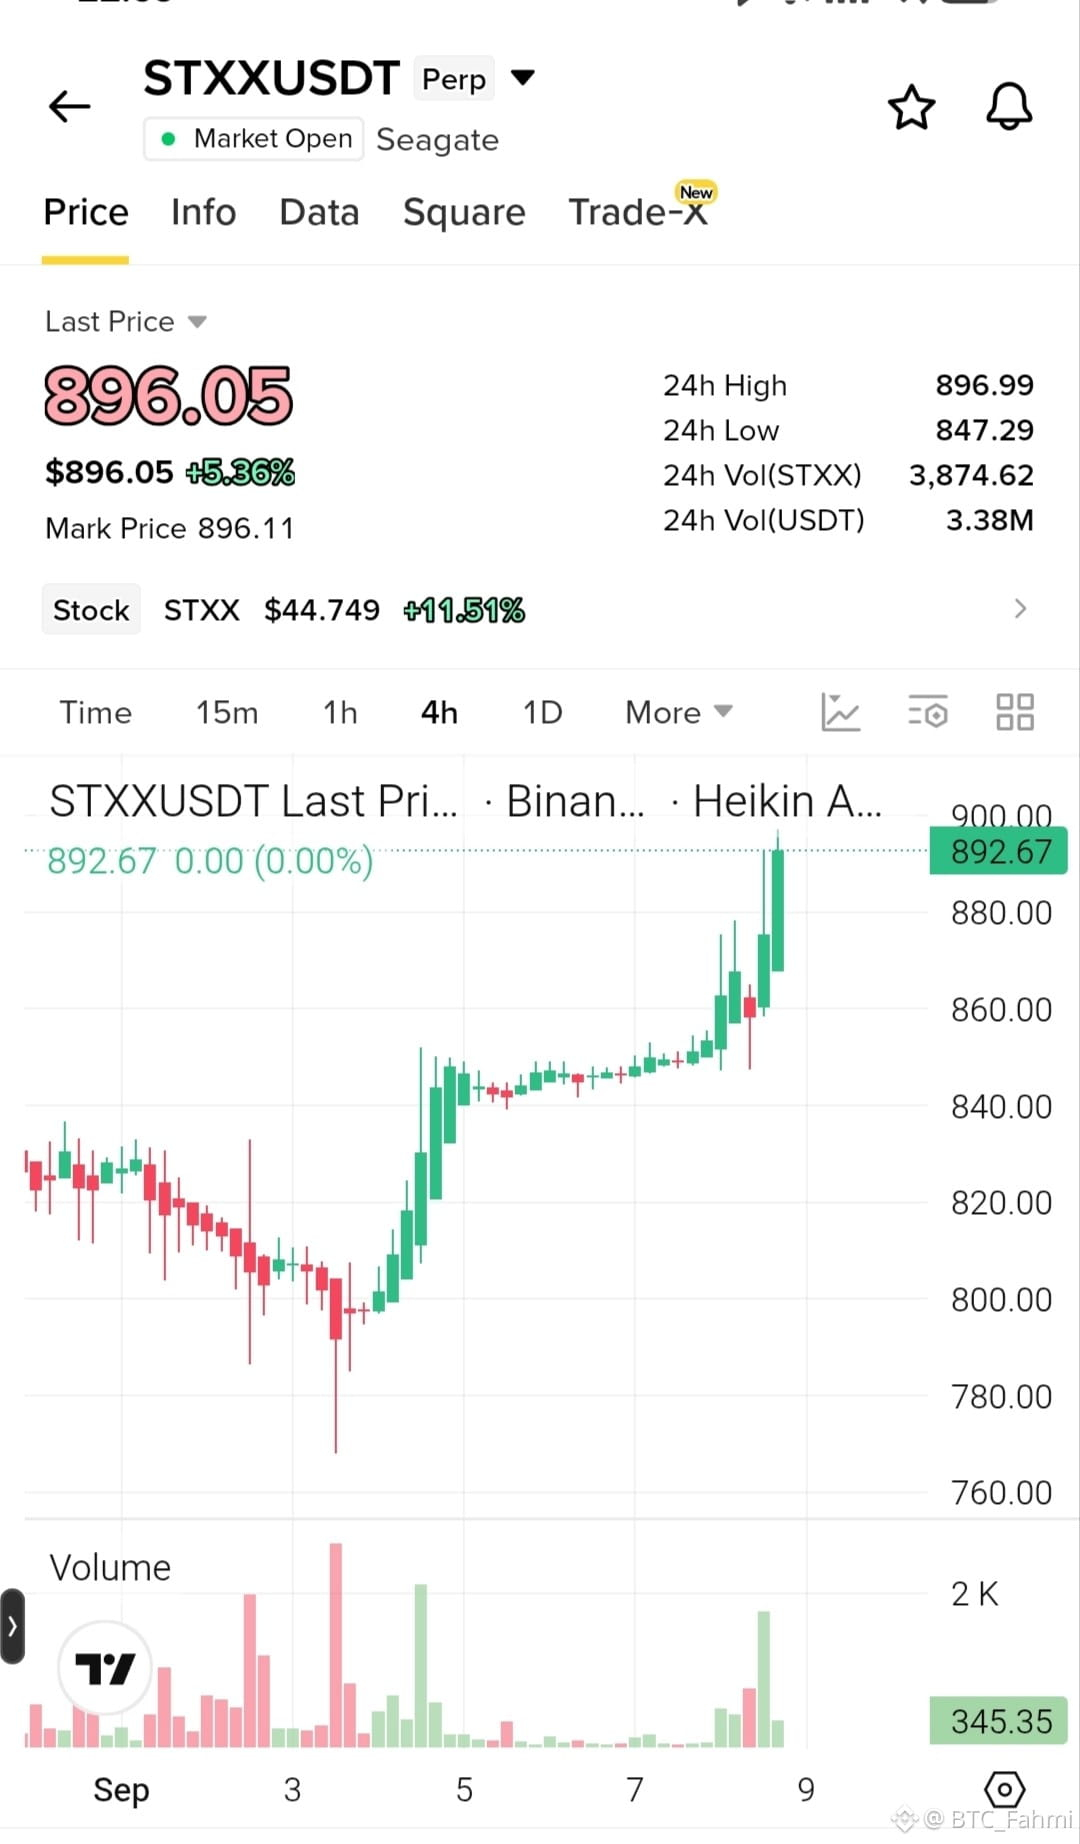
🟢 LONG $STXX (⏱️ Timeframe: 4H)
📍 Entry: 895.00 - 897.00
🛑 SL: 880.00
🎯 TP1: 915.00
🎯 TP2: 935.00
🎯 TP3: 960.00
The market is decisively reclaiming supply above 890 with massive volume confirmation, clearing yesterday's highs and igniting a fresh leg up. Price has already broken above the weekly resistance and is compressing against the daily high, suggesting a strong continuation structure is forming. With the stock component (STXX $44.75) also racing higher, this is a liquidity sweep setup targeting the extension levels.
Trade Here 👉
{future}(STXXUSDT)
$ZEC
{future}(ZECUSDT)
$BULLA
{future}(BULLAUSDT)
#STXX #TradeSetup #TechnicalAnalysis #WriteToEarnUpgrade #Write2Earn
⚠️ Not financial advice. Always manage your risk.
🟢 LONG $STXX (⏱️ Timeframe: 4H)
📍 Entry: 895.00 - 897.00
🛑 SL: 880.00
🎯 TP1: 915.00
🎯 TP2: 935.00
🎯 TP3: 960.00
The market is decisively reclaiming supply above 890 with massive volume confirmation, clearing yesterday's highs and igniting a fresh leg up. Price has already broken above the weekly resistance and is compressing against the daily high, suggesting a strong continuation structure is forming. With the stock component (STXX $44.75) also racing higher, this is a liquidity sweep setup targeting the extension levels.
Trade Here 👉
$ZEC
$BULLA
#STXX #TradeSetup #TechnicalAnalysis #WriteToEarnUpgrade #Write2Earn
⚠️ Not financial advice. Always manage your risk.
📍 Entry: 895.00 - 897.00
🛑 SL: 880.00
🎯 TP1: 915.00
🎯 TP2: 935.00
🎯 TP3: 960.00
The market is decisively reclaiming supply above 890 with massive volume confirmation, clearing yesterday's highs and igniting a fresh leg up. Price has already broken above the weekly resistance and is compressing against the daily high, suggesting a strong continuation structure is forming. With the stock component (STXX $44.75) also racing higher, this is a liquidity sweep setup targeting the extension levels.
Trade Here 👉
$ZEC
$BULLA
#STXX #TradeSetup #TechnicalAnalysis #WriteToEarnUpgrade #Write2Earn
⚠️ Not financial advice. Always manage your risk.
1
296
·
--
$STXX rose 4.632% over the past 24 hours. This rally came against a backdrop of negative funding rates, where short-position holders have continued to pay fees to long-position holders. The combination of price moving up and a negative funding rate forms a classic short squeeze structure. The current funding rate of -0.0019 indicates that shorts have not yet accepted defeat and exited; they’re still holding on. If this negative funding rate and the upward price pattern persist, it could trigger a wave of short stop-outs, pushing the price to further test higher levels. Conversely, if the price falls back below 900 and the negative funding rate turns positive, the squeeze logic would fail.
Trading tag: #TradFi #链上美股 #STXX
Where do you think this thesis is most likely to be wrong?
$STXX rose 4.632% over the past 24 hours. This rally came against a backdrop of negative funding rates, where short-position holders have continued to pay fees to long-position holders. The combination of price moving up and a negative funding rate forms a classic short squeeze structure. The current funding rate of -0.0019 indicates that shorts have not yet accepted defeat and exited; they’re still holding on. If this negative funding rate and the upward price pattern persist, it could trigger a wave of short stop-outs, pushing the price to further test higher levels. Conversely, if the price falls back below 900 and the negative funding rate turns positive, the squeeze logic would fail.
Trading tag: #TradFi #链上美股 #STXX
Where do you think this thesis is most likely to be wrong?
Trading tag: #TradFi #链上美股 #STXX
Where do you think this thesis is most likely to be wrong?
15

$STXX 24 hours rose 5.24%, price 895.44. The on-chain US stock concept driven by Trump trading sentiment is moving.
Funding rate is 0, meaning longs and shorts are currently balanced with no one-sided positioning. This rise looks more like an event-driven pulse rather than a trend confirmation. In these kinds of event-driven pumps on contracts, it’s usually the first wave eating the later wave.
I believe most of the event premium has already been priced in. I’m taking a short bias: 5x leverage, stop-loss at 909 (at 1.5x the move), take-profit at 876 (at half the move), position size 10%.
Trading tag: #TradFi #链上美股 #STXX
Where do you think this setup is most likely to be wrong?
$STXX 24 hours rose 5.24%, price 895.44. The on-chain US stock concept driven by Trump trading sentiment is moving.
Funding rate is 0, meaning longs and shorts are currently balanced with no one-sided positioning. This rise looks more like an event-driven pulse rather than a trend confirmation. In these kinds of event-driven pumps on contracts, it’s usually the first wave eating the later wave.
I believe most of the event premium has already been priced in. I’m taking a short bias: 5x leverage, stop-loss at 909 (at 1.5x the move), take-profit at 876 (at half the move), position size 10%.
Trading tag: #TradFi #链上美股 #STXX
Where do you think this setup is most likely to be wrong?
Funding rate is 0, meaning longs and shorts are currently balanced with no one-sided positioning. This rise looks more like an event-driven pulse rather than a trend confirmation. In these kinds of event-driven pumps on contracts, it’s usually the first wave eating the later wave.
I believe most of the event premium has already been priced in. I’m taking a short bias: 5x leverage, stop-loss at 909 (at 1.5x the move), take-profit at 876 (at half the move), position size 10%.
Trading tag: #TradFi #链上美股 #STXX
Where do you think this setup is most likely to be wrong?
14
STXX opens at 895.44, up 5.241% in 24 hours, but the funding is zero. This kind of upside looks more like pricing in expectations of Trump’s tax cuts, not something pushed up by contract/speculative positioning. Zero fees suggest neither the long nor short side has taken meaningful positions; once the trend starts, the counterforce is small. I’m bullish, but I keep a tight stop-loss. If Trump publicly mentions policies that are favorable to traditional businesses, this trade could spike. If it fails, I’ll look for a drop below 880; that would mean the expectation has been missed, and I’ll exit immediately. Direction: go long STXX, 2x leverage, stop-loss at 880, take-profit at 920, position size 10%.
Trading tag: #TradFi #链上美股 #STXX
Where do you think this assessment is most likely to be wrong?
STXX opens at 895.44, up 5.241% in 24 hours, but the funding is zero. This kind of upside looks more like pricing in expectations of Trump’s tax cuts, not something pushed up by contract/speculative positioning. Zero fees suggest neither the long nor short side has taken meaningful positions; once the trend starts, the counterforce is small. I’m bullish, but I keep a tight stop-loss. If Trump publicly mentions policies that are favorable to traditional businesses, this trade could spike. If it fails, I’ll look for a drop below 880; that would mean the expectation has been missed, and I’ll exit immediately. Direction: go long STXX, 2x leverage, stop-loss at 880, take-profit at 920, position size 10%.
Trading tag: #TradFi #链上美股 #STXX
Where do you think this assessment is most likely to be wrong?
Trading tag: #TradFi #链上美股 #STXX
Where do you think this assessment is most likely to be wrong?
12
$STXX rose 5.24% but the funding rate stayed completely unchanged at 0; the position size at 1340.13 also hasn’t changed much. This data is quite interesting—price moved, but the long/short funding didn’t go crazy; everyone is waiting for some signal from Trump’s side. On-chain US stocks are sensitive to statements from political leaders; right now it’s basically a wait-and-see market.
Everyone is betting on the next steps of the Trump trade, but until specific policies are actually rolled out, neither the longs nor the shorts dare to go heavy. A flat funding rate suggests the two sides are evenly matched, and both are waiting for a breakthrough point.
My plan is to wait.
Trading tag: #TradFi #链上美股 #STXX
Where do you think this assessment is most likely to be wrong?
$STXX rose 5.24% but the funding rate stayed completely unchanged at 0; the position size at 1340.13 also hasn’t changed much. This data is quite interesting—price moved, but the long/short funding didn’t go crazy; everyone is waiting for some signal from Trump’s side. On-chain US stocks are sensitive to statements from political leaders; right now it’s basically a wait-and-see market.
Everyone is betting on the next steps of the Trump trade, but until specific policies are actually rolled out, neither the longs nor the shorts dare to go heavy. A flat funding rate suggests the two sides are evenly matched, and both are waiting for a breakthrough point.
My plan is to wait.
Trading tag: #TradFi #链上美股 #STXX
Where do you think this assessment is most likely to be wrong?
Everyone is betting on the next steps of the Trump trade, but until specific policies are actually rolled out, neither the longs nor the shorts dare to go heavy. A flat funding rate suggests the two sides are evenly matched, and both are waiting for a breakthrough point.
My plan is to wait.
Trading tag: #TradFi #链上美股 #STXX
Where do you think this assessment is most likely to be wrong?
21
$STXX 24 hours rose 5.24%, and the price climbed above 895. The Trump trade is heating up, with money betting on policy direction via TradFi equity futures—this is a single, sentiment-driven signal-driven market.
The funding rate is 0, so the long and short sides are temporarily balanced, but the price is pushing upward, suggesting buy orders are betting that the event will materialize. The counterargument is that the actual policy rollout may come in less than expected. This kind of sentiment-driven trading can be volatile. If there is no real policy follow-through afterward, this speculative capital will quickly withdraw.
The invalidation condition is if the price falls back below the prior low of 880, which would disprove the event-trading thesis.
Trading tag: #TradFi #链上美股 #STXX
Where do you think this set of judgments is most likely to be wrong?
$STXX 24 hours rose 5.24%, and the price climbed above 895. The Trump trade is heating up, with money betting on policy direction via TradFi equity futures—this is a single, sentiment-driven signal-driven market.
The funding rate is 0, so the long and short sides are temporarily balanced, but the price is pushing upward, suggesting buy orders are betting that the event will materialize. The counterargument is that the actual policy rollout may come in less than expected. This kind of sentiment-driven trading can be volatile. If there is no real policy follow-through afterward, this speculative capital will quickly withdraw.
The invalidation condition is if the price falls back below the prior low of 880, which would disprove the event-trading thesis.
Trading tag: #TradFi #链上美股 #STXX
Where do you think this set of judgments is most likely to be wrong?
The funding rate is 0, so the long and short sides are temporarily balanced, but the price is pushing upward, suggesting buy orders are betting that the event will materialize. The counterargument is that the actual policy rollout may come in less than expected. This kind of sentiment-driven trading can be volatile. If there is no real policy follow-through afterward, this speculative capital will quickly withdraw.
The invalidation condition is if the price falls back below the prior low of 880, which would disprove the event-trading thesis.
Trading tag: #TradFi #链上美股 #STXX
Where do you think this set of judgments is most likely to be wrong?
11
·
--
The price of $STXX is at 867.1, up 2.47% over the past 24 hours, but the funding rate is zero. This combination is a bit unusual: the market is rising, yet no one is paying for it. Position cost is effectively zero, and traders are all watching from the sidelines.
From a semiconductor/AI chain perspective, the funding for $STXX being zero means there’s no payment pressure on either longs or shorts, and market sentiment is balanced. Open interest is 1308.52, not very high, suggesting leverage capital hasn’t made a large bet. The price is only slightly up, yet funding is completely unchanged—this hints that the rise may be coming from spot buying rather than being driven by leveraged longs. As an on-chain U.S. stock–type token, when funding is zero, short-term traders often lose their direction and retail followers tend to chase in a scattered way. The input doesn’t include any on-chain position data, so I won’t speculate about whale activity. But the funding-rate signal is already strong enough: it directly tells me that neither side is crowded right now.
Old dog’s take is that this leg up in $STXX lacks funding support. It’s like walking on one leg, so the continuity is in question. If the price can break above 870 and hold, and meanwhile funding turns positive—then it would indicate longs are starting to step in and are willing to pay the cost, and I’d follow with a small position. On the other hand, if it breaks below 860 and spot buying retreats, I would exit directly. The part that goes against consensus is that when people see the price rising, they easily get FOMO, but the funding being zero exposes the weakness: the leveraged crowd hasn’t moved, so this pump may just be a game of existing liquidity.
The invalidation conditions are very clear: if funding suddenly turns negative and the price falls, it means shorts are gaining strength and squeezing longs—my view would need to be adjusted. Or if OI increases sharply alongside wild price swings, it would indicate new capital entering and breaking the balance. Since there’s no data on other coins in the same sector, I can’t judge the overall strength of the semiconductor/AI chain. So the signal for $STXX is relatively isolated. For now, I’ll stay on the sidelines and wait for funding and price to give a clear direction before acting.
Trading tag: #BinanceFutures #TradFi #USDⓈM #STXX #STXXUSDT $STXX
The price of $STXX is at 867.1, up 2.47% over the past 24 hours, but the funding rate is zero. This combination is a bit unusual: the market is rising, yet no one is paying for it. Position cost is effectively zero, and traders are all watching from the sidelines.
From a semiconductor/AI chain perspective, the funding for $STXX being zero means there’s no payment pressure on either longs or shorts, and market sentiment is balanced. Open interest is 1308.52, not very high, suggesting leverage capital hasn’t made a large bet. The price is only slightly up, yet funding is completely unchanged—this hints that the rise may be coming from spot buying rather than being driven by leveraged longs. As an on-chain U.S. stock–type token, when funding is zero, short-term traders often lose their direction and retail followers tend to chase in a scattered way. The input doesn’t include any on-chain position data, so I won’t speculate about whale activity. But the funding-rate signal is already strong enough: it directly tells me that neither side is crowded right now.
Old dog’s take is that this leg up in $STXX lacks funding support. It’s like walking on one leg, so the continuity is in question. If the price can break above 870 and hold, and meanwhile funding turns positive—then it would indicate longs are starting to step in and are willing to pay the cost, and I’d follow with a small position. On the other hand, if it breaks below 860 and spot buying retreats, I would exit directly. The part that goes against consensus is that when people see the price rising, they easily get FOMO, but the funding being zero exposes the weakness: the leveraged crowd hasn’t moved, so this pump may just be a game of existing liquidity.
The invalidation conditions are very clear: if funding suddenly turns negative and the price falls, it means shorts are gaining strength and squeezing longs—my view would need to be adjusted. Or if OI increases sharply alongside wild price swings, it would indicate new capital entering and breaking the balance. Since there’s no data on other coins in the same sector, I can’t judge the overall strength of the semiconductor/AI chain. So the signal for $STXX is relatively isolated. For now, I’ll stay on the sidelines and wait for funding and price to give a clear direction before acting.
Trading tag: #BinanceFutures #TradFi #USDⓈM #STXX #STXXUSDT $STXX
From a semiconductor/AI chain perspective, the funding for $STXX being zero means there’s no payment pressure on either longs or shorts, and market sentiment is balanced. Open interest is 1308.52, not very high, suggesting leverage capital hasn’t made a large bet. The price is only slightly up, yet funding is completely unchanged—this hints that the rise may be coming from spot buying rather than being driven by leveraged longs. As an on-chain U.S. stock–type token, when funding is zero, short-term traders often lose their direction and retail followers tend to chase in a scattered way. The input doesn’t include any on-chain position data, so I won’t speculate about whale activity. But the funding-rate signal is already strong enough: it directly tells me that neither side is crowded right now.
Old dog’s take is that this leg up in $STXX lacks funding support. It’s like walking on one leg, so the continuity is in question. If the price can break above 870 and hold, and meanwhile funding turns positive—then it would indicate longs are starting to step in and are willing to pay the cost, and I’d follow with a small position. On the other hand, if it breaks below 860 and spot buying retreats, I would exit directly. The part that goes against consensus is that when people see the price rising, they easily get FOMO, but the funding being zero exposes the weakness: the leveraged crowd hasn’t moved, so this pump may just be a game of existing liquidity.
The invalidation conditions are very clear: if funding suddenly turns negative and the price falls, it means shorts are gaining strength and squeezing longs—my view would need to be adjusted. Or if OI increases sharply alongside wild price swings, it would indicate new capital entering and breaking the balance. Since there’s no data on other coins in the same sector, I can’t judge the overall strength of the semiconductor/AI chain. So the signal for $STXX is relatively isolated. For now, I’ll stay on the sidelines and wait for funding and price to give a clear direction before acting.
Trading tag: #BinanceFutures #TradFi #USDⓈM #STXX #STXXUSDT $STXX
63
·
--
Old Dog scanned the board. $STXX has gained 6.235% over the past 24 hours, with the price pinned at 846.93, but the funding rate hasn’t budged and is sitting at zero. That combination is interesting: the price is rising pretty sharply, yet neither bulls nor bears are paying the other side.
From the perspective of the semiconductor/AI chain, $STXX , as an on-chain U.S. stock perp, having zero funding directly suggests that bullish and bearish forces are temporarily balanced, with neither side crowded enough to force extreme fee payments. The trading volume is a bit over 3.56 million, while OI is only 1,365.74 units, but Old Dog has to note here that OI and trading volume are denominated in different units, so directly comparing their magnitudes is meaningless. Looking only at the OI number, it isn’t high in the perp market, which means leveraged positions have not piled up yet. A 6.235% price rise paired with zero funding looks more like a spot-driven move or a short-covering move, rather than a leveraged long squeeze.
My judgment is that $STXX has short-term upward momentum, but lacks support from leveraged capital, so the sustainability of the move is questionable. Funding staying at zero means the market has not yet formed a consensus on the short-term direction of the semiconductor/AI chain, and neither side is carrying the position alone. If the price continues to rise but funding remains zero or even turns negative, then it is more likely to be shorts stopping out and covering, rather than new longs entering. Moves like that often start strong but fade quickly.
In practice, Old Dog will stay lightly positioned and watch. The condition to add is: funding suddenly turns positive and holds above 0.01%, while OI expands clearly, which would indicate that longs are starting to come in and lift the market. On the other hand, if the price breaks below the 800 psychological level (current price 846.93), or if funding turns negative and the price can no longer rise, I may consider reducing exposure. The most counterintuitive point is that if the market starts touting $STXX as the leader of a semiconductor-sector reversal, I would actually become cautious, because in a zero-funding environment, the absence of leveraged longs means that narrative lacks capital support.
The invalidation condition is simple: if over the next two trading days funding shows a directional shift, whether positive or negative, and it comes with a large change in OI, then Old Dog’s judgment based on a balanced state has to be reworked from scratch. Another case is if the price drops directly below 800 on strong volume, then the short-term bullish structure is broken, so don’t stubbornly hold.
Trading tags: #BinanceFutures #TradFi #USDⓈM #STXX #STXXUSDT $STXX
Old Dog scanned the board. $STXX has gained 6.235% over the past 24 hours, with the price pinned at 846.93, but the funding rate hasn’t budged and is sitting at zero. That combination is interesting: the price is rising pretty sharply, yet neither bulls nor bears are paying the other side.
From the perspective of the semiconductor/AI chain, $STXX , as an on-chain U.S. stock perp, having zero funding directly suggests that bullish and bearish forces are temporarily balanced, with neither side crowded enough to force extreme fee payments. The trading volume is a bit over 3.56 million, while OI is only 1,365.74 units, but Old Dog has to note here that OI and trading volume are denominated in different units, so directly comparing their magnitudes is meaningless. Looking only at the OI number, it isn’t high in the perp market, which means leveraged positions have not piled up yet. A 6.235% price rise paired with zero funding looks more like a spot-driven move or a short-covering move, rather than a leveraged long squeeze.
My judgment is that $STXX has short-term upward momentum, but lacks support from leveraged capital, so the sustainability of the move is questionable. Funding staying at zero means the market has not yet formed a consensus on the short-term direction of the semiconductor/AI chain, and neither side is carrying the position alone. If the price continues to rise but funding remains zero or even turns negative, then it is more likely to be shorts stopping out and covering, rather than new longs entering. Moves like that often start strong but fade quickly.
In practice, Old Dog will stay lightly positioned and watch. The condition to add is: funding suddenly turns positive and holds above 0.01%, while OI expands clearly, which would indicate that longs are starting to come in and lift the market. On the other hand, if the price breaks below the 800 psychological level (current price 846.93), or if funding turns negative and the price can no longer rise, I may consider reducing exposure. The most counterintuitive point is that if the market starts touting $STXX as the leader of a semiconductor-sector reversal, I would actually become cautious, because in a zero-funding environment, the absence of leveraged longs means that narrative lacks capital support.
The invalidation condition is simple: if over the next two trading days funding shows a directional shift, whether positive or negative, and it comes with a large change in OI, then Old Dog’s judgment based on a balanced state has to be reworked from scratch. Another case is if the price drops directly below 800 on strong volume, then the short-term bullish structure is broken, so don’t stubbornly hold.
Trading tags: #BinanceFutures #TradFi #USDⓈM #STXX #STXXUSDT $STXX
From the perspective of the semiconductor/AI chain, $STXX , as an on-chain U.S. stock perp, having zero funding directly suggests that bullish and bearish forces are temporarily balanced, with neither side crowded enough to force extreme fee payments. The trading volume is a bit over 3.56 million, while OI is only 1,365.74 units, but Old Dog has to note here that OI and trading volume are denominated in different units, so directly comparing their magnitudes is meaningless. Looking only at the OI number, it isn’t high in the perp market, which means leveraged positions have not piled up yet. A 6.235% price rise paired with zero funding looks more like a spot-driven move or a short-covering move, rather than a leveraged long squeeze.
My judgment is that $STXX has short-term upward momentum, but lacks support from leveraged capital, so the sustainability of the move is questionable. Funding staying at zero means the market has not yet formed a consensus on the short-term direction of the semiconductor/AI chain, and neither side is carrying the position alone. If the price continues to rise but funding remains zero or even turns negative, then it is more likely to be shorts stopping out and covering, rather than new longs entering. Moves like that often start strong but fade quickly.
In practice, Old Dog will stay lightly positioned and watch. The condition to add is: funding suddenly turns positive and holds above 0.01%, while OI expands clearly, which would indicate that longs are starting to come in and lift the market. On the other hand, if the price breaks below the 800 psychological level (current price 846.93), or if funding turns negative and the price can no longer rise, I may consider reducing exposure. The most counterintuitive point is that if the market starts touting $STXX as the leader of a semiconductor-sector reversal, I would actually become cautious, because in a zero-funding environment, the absence of leveraged longs means that narrative lacks capital support.
The invalidation condition is simple: if over the next two trading days funding shows a directional shift, whether positive or negative, and it comes with a large change in OI, then Old Dog’s judgment based on a balanced state has to be reworked from scratch. Another case is if the price drops directly below 800 on strong volume, then the short-term bullish structure is broken, so don’t stubbornly hold.
Trading tags: #BinanceFutures #TradFi #USDⓈM #STXX #STXXUSDT $STXX
135
Log in to explore more content
Join global crypto users on Binance Square
⚡️ Get latest and useful information about crypto.
💬 Trusted by the world’s largest crypto exchange.
👍 Discover real insights from verified creators.
Email / Phone number
Trending Topics
1
#FedRateWatch
1.5M views
6,803 Discussing
2
#ZcashRises6%
56,474 views
677 Discussing
3
#XRPSinks10%
37,711 views
443 Discussing
4
#BitcoinETFsShed$450M
7,435 views
96 Discussing
5
#CircleOpensArcMainnet
17,493 views
295 Discussing
6
#ZcashHoldersBackNU7Upgrade
29,296 views
453 Discussing
7
#MSTRTradingVolumeSurpassesMorganStanley
27,448 views
605 Discussing
8
#BitcoinFalls4%
56,682 views
940 Discussing
9
#SKHynixInTalksToMakeMemoryChipsInUS
21,959 views
367 Discussing
10
#OpenAIDiscussesNewFundingAt$1.2TValuation
6,096 views
60 Discussing