
#skhyb
skhyb
42,048 views
1,012 Discussing
Hot
Latest

·
--
$SKHYB looks ready to go higher from here 🚀
🎯 Buy $SKHYB 137.8561 to 139.0985
Stop loss 132.7818
Targets 147.9523 / 154.0205 / 163.1229
Holding strong near today's high at $138.8500
RSI sits at 68 showing solid strength
Up 3.6% today with healthy volume
Sitting inside the zone as I type this
Tap $SKHYB to buy
#SKHYB #TradingSignals
$SKHYB looks ready to go higher from here 🚀
🎯 Buy $SKHYB 137.8561 to 139.0985
Stop loss 132.7818
Targets 147.9523 / 154.0205 / 163.1229
Holding strong near today's high at $138.8500
RSI sits at 68 showing solid strength
Up 3.6% today with healthy volume
Sitting inside the zone as I type this
Tap $SKHYB to buy
#SKHYB #TradingSignals
🎯 Buy $SKHYB 137.8561 to 139.0985
Stop loss 132.7818
Targets 147.9523 / 154.0205 / 163.1229
Holding strong near today's high at $138.8500
RSI sits at 68 showing solid strength
Up 3.6% today with healthy volume
Sitting inside the zone as I type this
Tap $SKHYB to buy
#SKHYB #TradingSignals


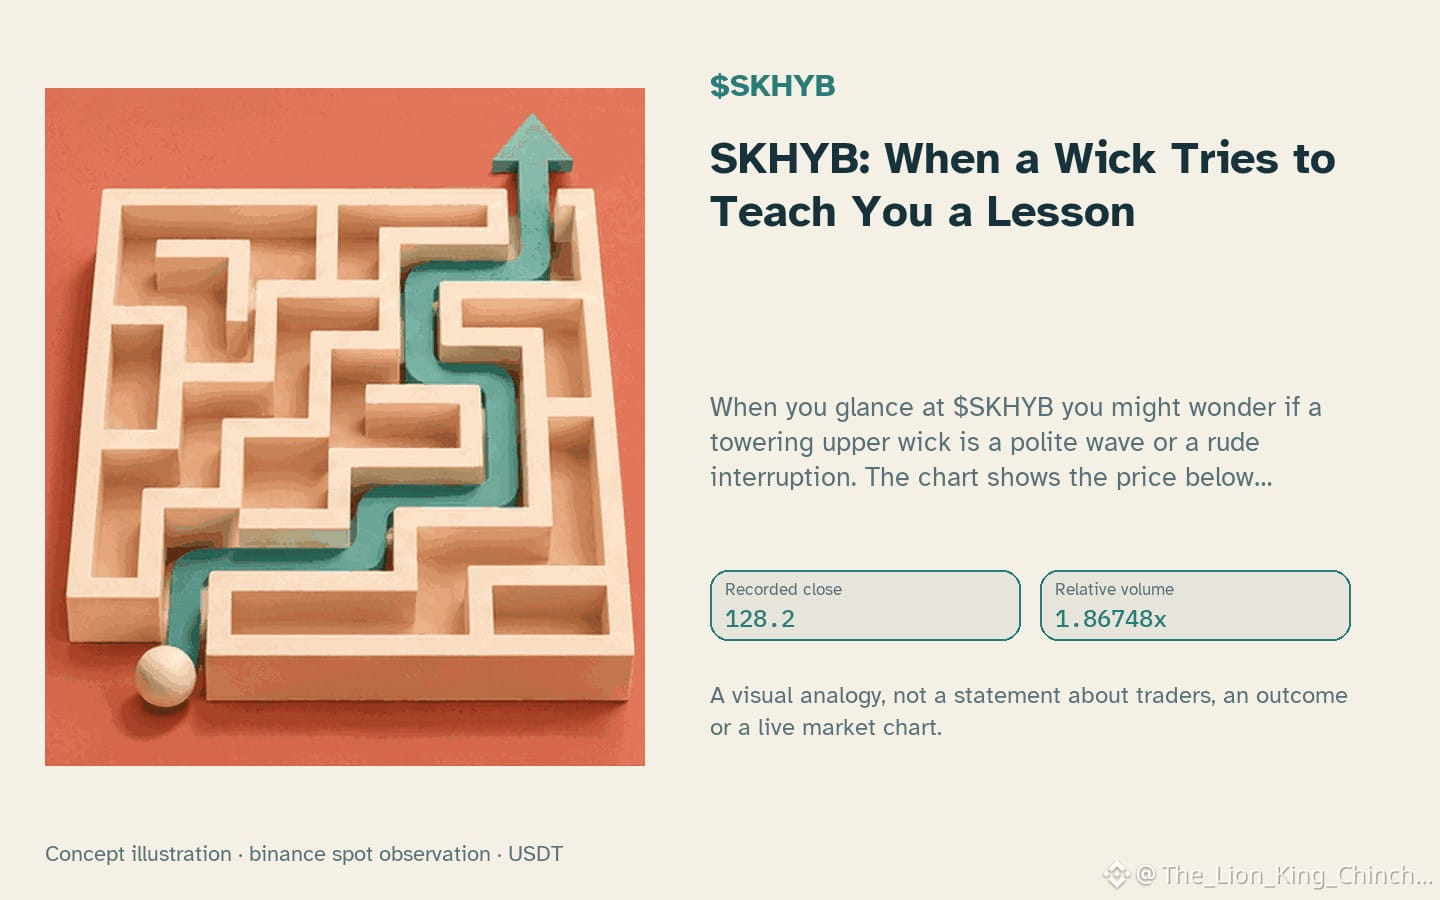
$SKHYB: SKHYB: When a Wick Tries to Teach You a Lesson
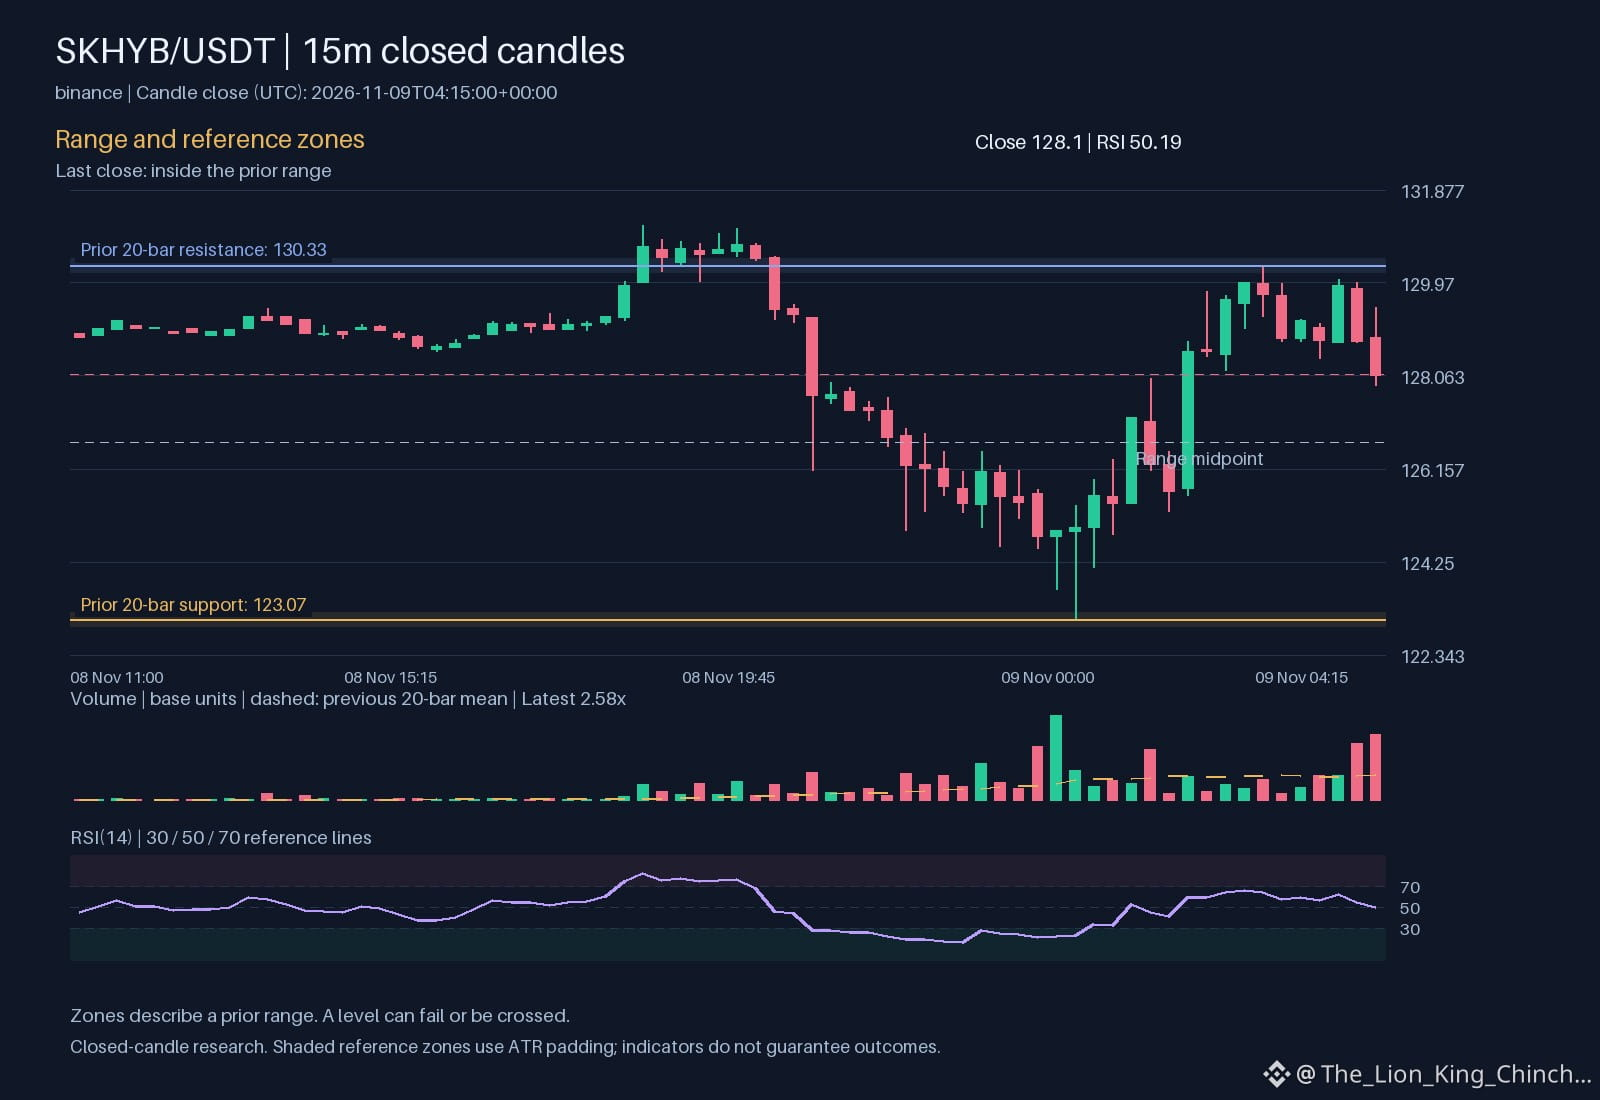
When you glance at $SKHYB you might wonder if a towering upper wick is a polite wave or a rude interruption. The chart shows the price below support, a down hourly direction, and volume above baseline, which sets a tidy stage for a thought experiment. Imagine a researcher who treats each wick like a mischievous teacher demanding a test. The hypothesis: a long wick that fails to close above the prior high may be signaling a rejected move, but only if the candle’s body respects the local range.
The dilemma is whether to write a rule that says “ignore the wick if the close stays below the prior resistance.” A counterexample appears when the candle closes just above the resistance line, yet the next bar slides back under support, proving the rule can be too blunt. A self‑check would compare the close to 128.93 and 135.18 while noting the RSI 34.7921 for overbought bias. If the RSI is high, the wick rejection idea gains plausibility; if low, the wick might simply be noise.
The lesson: use the wick as a hint, not a verdict. Test the hypothesis on a small sample, record outcomes, and adjust the rule rather than treating the wick as a crystal ball.
Probabilistic market research, not a recommendation or guaranteed return.
Have you changed the rule after seeing the candle?
#SKHYB #LearnCrypto #CryptoLearning
Binance spot proof for $SKHYB: closed price 128.2 USDT.
Source: binance. Closed candle: 2026-11-10T17:00:00+00:00.
$SKHYB : SKHYB: When a Wick Tries to Teach You a Lesson
When you glance at $SKHYB you might wonder if a towering upper wick is a polite wave or a rude interruption. The chart shows the price below support, a down hourly direction, and volume above baseline, which sets a tidy stage for a thought experiment. Imagine a researcher who treats each wick like a mischievous teacher demanding a test. The hypothesis: a long wick that fails to close above the prior high may be signaling a rejected move, but only if the candle’s body respects the local range.
The dilemma is whether to write a rule that says “ignore the wick if the close stays below the prior resistance.” A counterexample appears when the candle closes just above the resistance line, yet the next bar slides back under support, proving the rule can be too blunt. A self‑check would compare the close to 128.93 and 135.18 while noting the RSI 34.7921 for overbought bias. If the RSI is high, the wick rejection idea gains plausibility; if low, the wick might simply be noise.
The lesson: use the wick as a hint, not a verdict. Test the hypothesis on a small sample, record outcomes, and adjust the rule rather than treating the wick as a crystal ball.
Probabilistic market research, not a recommendation or guaranteed return.
Have you changed the rule after seeing the candle?
#SKHYB #LearnCrypto #CryptoLearning
Binance spot proof for $SKHYB : closed price 128.2 USDT.
Source: binance. Closed candle: 2026-11-10T17:00:00+00:00.
When you glance at $SKHYB you might wonder if a towering upper wick is a polite wave or a rude interruption. The chart shows the price below support, a down hourly direction, and volume above baseline, which sets a tidy stage for a thought experiment. Imagine a researcher who treats each wick like a mischievous teacher demanding a test. The hypothesis: a long wick that fails to close above the prior high may be signaling a rejected move, but only if the candle’s body respects the local range.
The dilemma is whether to write a rule that says “ignore the wick if the close stays below the prior resistance.” A counterexample appears when the candle closes just above the resistance line, yet the next bar slides back under support, proving the rule can be too blunt. A self‑check would compare the close to 128.93 and 135.18 while noting the RSI 34.7921 for overbought bias. If the RSI is high, the wick rejection idea gains plausibility; if low, the wick might simply be noise.
The lesson: use the wick as a hint, not a verdict. Test the hypothesis on a small sample, record outcomes, and adjust the rule rather than treating the wick as a crystal ball.
Probabilistic market research, not a recommendation or guaranteed return.
Have you changed the rule after seeing the candle?
#SKHYB #LearnCrypto #CryptoLearning
Binance spot proof for $SKHYB : closed price 128.2 USDT.
Source: binance. Closed candle: 2026-11-10T17:00:00+00:00.
62

·
--
$SKHYB +7.01% | $ETHFI +6.97% | $AVGOB +6.94%
#SKHYB is trading at $132.21, up +7.01% on $10.5 M of volume. The price jump looks solid, though the move could cool if buying eases.
#ETHFI sits at $0.6355, gaining +6.97% with $4.5 M changing hands. Momentum is decent, yet the low‑price tier can be volatile.
#AVGOB reaches $318.56, up +6.94% on $2.0 M of volume. It’s the quietest of the three, so a breakout might need more participation.
📈 Watch whether the volume for AVGOB picks up; a lift could confirm the upside is more than a brief flare.
#Write2Earn #Binance
$SKHYB +7.01% | $ETHFI +6.97% | $AVGOB +6.94%
#SKHYB is trading at $132.21, up +7.01% on $10.5 M of volume. The price jump looks solid, though the move could cool if buying eases.
#ETHFI sits at $0.6355, gaining +6.97% with $4.5 M changing hands. Momentum is decent, yet the low‑price tier can be volatile.
#AVGOB reaches $318.56, up +6.94% on $2.0 M of volume. It’s the quietest of the three, so a breakout might need more participation.
📈 Watch whether the volume for AVGOB picks up; a lift could confirm the upside is more than a brief flare.
#Write2Earn #Binance
#SKHYB is trading at $132.21, up +7.01% on $10.5 M of volume. The price jump looks solid, though the move could cool if buying eases.
#ETHFI sits at $0.6355, gaining +6.97% with $4.5 M changing hands. Momentum is decent, yet the low‑price tier can be volatile.
#AVGOB reaches $318.56, up +6.94% on $2.0 M of volume. It’s the quietest of the three, so a breakout might need more participation.
📈 Watch whether the volume for AVGOB picks up; a lift could confirm the upside is more than a brief flare.
#Write2Earn #Binance
2

·
--
$SKHYB +7.86% | $ETHFI +7.70% | $JUP +7.51%
#SKHYB is holding at $134.11, up +7.86% with $10.3 M of volume. The price jump is the strongest among the three, suggesting fresh buying pressure.
#ETHFI trades around $0.6381, gaining +7.70% on $4.5 M of volume. Its rise mirrors SKHYB’s but with half the turnover, so the move could be more fragile.
#JUP sits at $0.2519, up +7.51% and moving $3.8 M. The consistent percentage gains across lower‑volume tokens hint at a broader sector rally, though volatility may increase.
👀 Keep an eye on whether ETHFI can maintain momentum as volume tapers, which could signal a spill‑over to the smaller caps.
#Write2Earn #Binance
$SKHYB +7.86% | $ETHFI +7.70% | $JUP +7.51%
#SKHYB is holding at $134.11, up +7.86% with $10.3 M of volume. The price jump is the strongest among the three, suggesting fresh buying pressure.
#ETHFI trades around $0.6381, gaining +7.70% on $4.5 M of volume. Its rise mirrors SKHYB’s but with half the turnover, so the move could be more fragile.
#JUP sits at $0.2519, up +7.51% and moving $3.8 M. The consistent percentage gains across lower‑volume tokens hint at a broader sector rally, though volatility may increase.
👀 Keep an eye on whether ETHFI can maintain momentum as volume tapers, which could signal a spill‑over to the smaller caps.
#Write2Earn #Binance
#SKHYB is holding at $134.11, up +7.86% with $10.3 M of volume. The price jump is the strongest among the three, suggesting fresh buying pressure.
#ETHFI trades around $0.6381, gaining +7.70% on $4.5 M of volume. Its rise mirrors SKHYB’s but with half the turnover, so the move could be more fragile.
#JUP sits at $0.2519, up +7.51% and moving $3.8 M. The consistent percentage gains across lower‑volume tokens hint at a broader sector rally, though volatility may increase.
👀 Keep an eye on whether ETHFI can maintain momentum as volume tapers, which could signal a spill‑over to the smaller caps.
#Write2Earn #Binance
·
--
$SKHYB +8.13% | $SAND +8.11% | $AVGOB +8.00%
#SKHYB is trading at $133.93, up +8.13% and pulling $10.9 M in volume, the strongest flow of the three.
#SAND sits at $0.0439, gaining +8.11% on a modest $1.3 M of trades, showing steady interest despite its low price.
#AVGOB moves to $318.05, up +8.00% with $1.8 M volume, keeping pace with the other gainers 📈 but may meet resistance if sellers return.
Watch SKHYB’s volume edge—it could push the token toward its next technical hurdle.
#Write2Earn #Binance
$SKHYB +8.13% | $SAND +8.11% | $AVGOB +8.00%
#SKHYB is trading at $133.93, up +8.13% and pulling $10.9 M in volume, the strongest flow of the three.
#SAND sits at $0.0439, gaining +8.11% on a modest $1.3 M of trades, showing steady interest despite its low price.
#AVGOB moves to $318.05, up +8.00% with $1.8 M volume, keeping pace with the other gainers 📈 but may meet resistance if sellers return.
Watch SKHYB’s volume edge—it could push the token toward its next technical hurdle.
#Write2Earn #Binance
#SKHYB is trading at $133.93, up +8.13% and pulling $10.9 M in volume, the strongest flow of the three.
#SAND sits at $0.0439, gaining +8.11% on a modest $1.3 M of trades, showing steady interest despite its low price.
#AVGOB moves to $318.05, up +8.00% with $1.8 M volume, keeping pace with the other gainers 📈 but may meet resistance if sellers return.
Watch SKHYB’s volume edge—it could push the token toward its next technical hurdle.
#Write2Earn #Binance
2
·
--
$SKHYB looks ready to go higher from here
It is up 8.0% today and holding strong
Entry zone 132.9109 to 134.2223
Stop 131.1157
Targets 138.2264 then 141.0707 then 145.3371
RSI is 56 so it has room to run
Volume is 1.3x higher than average today
Sitting inside the zone as I type this
Tap $SKHYB to buy
Who else is in
#SKHYB #TradingSignals
$SKHYB looks ready to go higher from here
It is up 8.0% today and holding strong
Entry zone 132.9109 to 134.2223
Stop 131.1157
Targets 138.2264 then 141.0707 then 145.3371
RSI is 56 so it has room to run
Volume is 1.3x higher than average today
Sitting inside the zone as I type this
Tap $SKHYB to buy
Who else is in
#SKHYB #TradingSignals
It is up 8.0% today and holding strong
Entry zone 132.9109 to 134.2223
Stop 131.1157
Targets 138.2264 then 141.0707 then 145.3371
RSI is 56 so it has room to run
Volume is 1.3x higher than average today
Sitting inside the zone as I type this
Tap $SKHYB to buy
Who else is in
#SKHYB #TradingSignals
1

·
--
Can a 1.34x volume spike sustain $SKHYB above $133?
Volume sits at $11.40M with a 5.88% daily gain to $133.26.
Hourly momentum slowed down 0.53% after testing the $136 high.
A breakout confirmation depends on reclaiming the $136 high with sustained volume, whereas losing the $121.69 range low invalidates the bullish structure.
Will you wait for a daily close above the $136 high to confirm strength, or watch for a retest of the $121.69 low to invalidate the move?
Tap $SKHYB for the live chart. #SKHYB #BinanceSquare
Can a 1.34x volume spike sustain $SKHYB above $133?
Volume sits at $11.40M with a 5.88% daily gain to $133.26.
Hourly momentum slowed down 0.53% after testing the $136 high.
A breakout confirmation depends on reclaiming the $136 high with sustained volume, whereas losing the $121.69 range low invalidates the bullish structure.
Will you wait for a daily close above the $136 high to confirm strength, or watch for a retest of the $121.69 low to invalidate the move?
Tap $SKHYB for the live chart. #SKHYB #BinanceSquare
Volume sits at $11.40M with a 5.88% daily gain to $133.26.
Hourly momentum slowed down 0.53% after testing the $136 high.
A breakout confirmation depends on reclaiming the $136 high with sustained volume, whereas losing the $121.69 range low invalidates the bullish structure.
Will you wait for a daily close above the $136 high to confirm strength, or watch for a retest of the $121.69 low to invalidate the move?
Tap $SKHYB for the live chart. #SKHYB #BinanceSquare
42
$SKHYB: Understanding Liquidity Through Chart Patterns
Liquidity is the ease with which a token can be bought or sold without moving its price dramatically. Think of a busy market stall where dozens of shoppers exchange goods; the stall can handle many transactions at the same price. In a thin market, a single buyer or seller can shift the price like a lone customer causing a sudden price jump at a quiet stall.
When the hourly direction points down and volume sits above baseline, as observed for $SKHYB, the market is showing higher participation despite the price pressure. This combination often signals that enough buyers are still active to absorb sell orders, creating a tighter spread between bid and ask. The spread behaves like the gap between two parallel lines on a chart: a narrow gap means trades can occur close to the last price, while a wide gap suggests slippage and higher transaction costs.
To see this mechanism, compare spot turnover to a water pipe. A larger pipe (higher turnover) lets more water flow with less pressure change, whereas a narrow pipe (low turnover) creates turbulence and pressure spikes. By monitoring 2.58426 and 2.57332e+06, traders can gauge how much water is moving through the pipe at any moment.
A practical way to reassess the observation is to overlay a simple liquidity indicator, such as the ratio of volume to price range, on the chart. If the ratio rises while price declines, it may indicate that the down move is supported by genuine buying interest rather than a lack of liquidity. Conversely, a falling ratio could warn that the market is thinning and price swings may become more erratic.
Remember to treat volume spikes as clues, not guarantees, and always consider the broader order book context before acting.
Probabilistic market research, not a recommendation or guaranteed return.
Which crypto concept becomes clearer when you look at an actual chart?
#SKHYB #CryptoEducation #CryptoLearning
$SKHYB : Understanding Liquidity Through Chart Patterns
Liquidity is the ease with which a token can be bought or sold without moving its price dramatically. Think of a busy market stall where dozens of shoppers exchange goods; the stall can handle many transactions at the same price. In a thin market, a single buyer or seller can shift the price like a lone customer causing a sudden price jump at a quiet stall.
When the hourly direction points down and volume sits above baseline, as observed for $SKHYB , the market is showing higher participation despite the price pressure. This combination often signals that enough buyers are still active to absorb sell orders, creating a tighter spread between bid and ask. The spread behaves like the gap between two parallel lines on a chart: a narrow gap means trades can occur close to the last price, while a wide gap suggests slippage and higher transaction costs.
To see this mechanism, compare spot turnover to a water pipe. A larger pipe (higher turnover) lets more water flow with less pressure change, whereas a narrow pipe (low turnover) creates turbulence and pressure spikes. By monitoring 2.58426 and 2.57332e+06, traders can gauge how much water is moving through the pipe at any moment.
A practical way to reassess the observation is to overlay a simple liquidity indicator, such as the ratio of volume to price range, on the chart. If the ratio rises while price declines, it may indicate that the down move is supported by genuine buying interest rather than a lack of liquidity. Conversely, a falling ratio could warn that the market is thinning and price swings may become more erratic.
Remember to treat volume spikes as clues, not guarantees, and always consider the broader order book context before acting.
Probabilistic market research, not a recommendation or guaranteed return.
Which crypto concept becomes clearer when you look at an actual chart?
#SKHYB #CryptoEducation #CryptoLearning
Liquidity is the ease with which a token can be bought or sold without moving its price dramatically. Think of a busy market stall where dozens of shoppers exchange goods; the stall can handle many transactions at the same price. In a thin market, a single buyer or seller can shift the price like a lone customer causing a sudden price jump at a quiet stall.
When the hourly direction points down and volume sits above baseline, as observed for $SKHYB , the market is showing higher participation despite the price pressure. This combination often signals that enough buyers are still active to absorb sell orders, creating a tighter spread between bid and ask. The spread behaves like the gap between two parallel lines on a chart: a narrow gap means trades can occur close to the last price, while a wide gap suggests slippage and higher transaction costs.
To see this mechanism, compare spot turnover to a water pipe. A larger pipe (higher turnover) lets more water flow with less pressure change, whereas a narrow pipe (low turnover) creates turbulence and pressure spikes. By monitoring 2.58426 and 2.57332e+06, traders can gauge how much water is moving through the pipe at any moment.
A practical way to reassess the observation is to overlay a simple liquidity indicator, such as the ratio of volume to price range, on the chart. If the ratio rises while price declines, it may indicate that the down move is supported by genuine buying interest rather than a lack of liquidity. Conversely, a falling ratio could warn that the market is thinning and price swings may become more erratic.
Remember to treat volume spikes as clues, not guarantees, and always consider the broader order book context before acting.
Probabilistic market research, not a recommendation or guaranteed return.
Which crypto concept becomes clearer when you look at an actual chart?
#SKHYB #CryptoEducation #CryptoLearning
30

·
--
👀 Is anyone watching? | $SKHYB PRICE_CHANGE_24H Current: 134.04. 24h rolling price change: +5.4600%, reaching the 5% watch threshold; no price direction prediction
📊 Data snapshot
· Indicator: PRICE_CHANGE_24H
· Reading: 134.04
· Basis: Calculated from historical prices of closed candlesticks
Don't rush to take sides—understand the data first.
Volume matters more than price; at times like this, bulls and bears are both battling it out.
Let's talk in the comments 👇
#市场观察 #SKHYB #Binance
👀 Is anyone watching? | $SKHYB PRICE_CHANGE_24H Current: 134.04. 24h rolling price change: +5.4600%, reaching the 5% watch threshold; no price direction prediction
📊 Data snapshot
· Indicator: PRICE_CHANGE_24H
· Reading: 134.04
· Basis: Calculated from historical prices of closed candlesticks
Don't rush to take sides—understand the data first.
Volume matters more than price; at times like this, bulls and bears are both battling it out.
Let's talk in the comments 👇
#市场观察 #SKHYB #Binance
📊 Data snapshot
· Indicator: PRICE_CHANGE_24H
· Reading: 134.04
· Basis: Calculated from historical prices of closed candlesticks
Don't rush to take sides—understand the data first.
Volume matters more than price; at times like this, bulls and bears are both battling it out.
Let's talk in the comments 👇
#市场观察 #SKHYB #Binance


·
--
🔍 $SKHYB Price Change Breakdown
5 min: -0.02%
1h: -0.40%
4h: -0.95%
24h: +5.85%
Current price: 133.5, 24h trading volume: $11.44 million
Up +5.85% in a single day, with the gains not concentrated in any short-term period—more like a steady, gradual rise throughout the day.
Do you think this is a genuine breakout or a pump-and-dump? 👇
(Data analysis, not investment advice. DYOR.)
#SKHYB
🔍 $SKHYB Price Change Breakdown
5 min: -0.02%
1h: -0.40%
4h: -0.95%
24h: +5.85%
Current price: 133.5, 24h trading volume: $11.44 million
Up +5.85% in a single day, with the gains not concentrated in any short-term period—more like a steady, gradual rise throughout the day.
Do you think this is a genuine breakout or a pump-and-dump? 👇
(Data analysis, not investment advice. DYOR.)
#SKHYB
5 min: -0.02%
1h: -0.40%
4h: -0.95%
24h: +5.85%
Current price: 133.5, 24h trading volume: $11.44 million
Up +5.85% in a single day, with the gains not concentrated in any short-term period—more like a steady, gradual rise throughout the day.
Do you think this is a genuine breakout or a pump-and-dump? 👇
(Data analysis, not investment advice. DYOR.)
#SKHYB
1
·
--
Bottom line first: SKHYB has staged a decent rebound, and short-term sentiment is recovering.
Market data: Current price 135.22, up 6.56% over 24 hours; trading volume 11 million USDT; intraday high 135.72, low 121.69, with a range of 11.5%.
The current price is near the top of the intraday range (96%). Buying support remains fairly active, and the pullback has been limited.
The price is above the 7-day moving average (133.36) and below the 25-day moving average (140.92), so the short-term structure remains intact.
In terms of position, the price is down 21.6% from the 30-day high of 172.48. The 30-day low is 120.33, and the 7-day cumulative change is -9.3%.
Trading volume is neutral; the market is gradually choosing a direction based on capital flows.
The key levels are clear: 135.72, the intraday high, is resistance above; 121.69 is the short-term support below. If the latter holds, the bulls still have a chance.
Keep an eye on two things next: whether the previous high above is decisively broken—otherwise, continue to treat this as range-bound trading—and whether the funding rate continues to diverge, as overheated sentiment often precedes a pullback.
At this same level, would you wait for a breakout or a retest?
(The above is a review of market activity and does not constitute investment advice. Futures trading involves risk.)
#SKHYB #K线复盘 #Technical Analysis
Bottom line first: SKHYB has staged a decent rebound, and short-term sentiment is recovering.
Market data: Current price 135.22, up 6.56% over 24 hours; trading volume 11 million USDT; intraday high 135.72, low 121.69, with a range of 11.5%.
The current price is near the top of the intraday range (96%). Buying support remains fairly active, and the pullback has been limited.
The price is above the 7-day moving average (133.36) and below the 25-day moving average (140.92), so the short-term structure remains intact.
In terms of position, the price is down 21.6% from the 30-day high of 172.48. The 30-day low is 120.33, and the 7-day cumulative change is -9.3%.
Trading volume is neutral; the market is gradually choosing a direction based on capital flows.
The key levels are clear: 135.72, the intraday high, is resistance above; 121.69 is the short-term support below. If the latter holds, the bulls still have a chance.
Keep an eye on two things next: whether the previous high above is decisively broken—otherwise, continue to treat this as range-bound trading—and whether the funding rate continues to diverge, as overheated sentiment often precedes a pullback.
At this same level, would you wait for a breakout or a retest?
(The above is a review of market activity and does not constitute investment advice. Futures trading involves risk.)
#SKHYB #K线复盘 #Technical Analysis
Market data: Current price 135.22, up 6.56% over 24 hours; trading volume 11 million USDT; intraday high 135.72, low 121.69, with a range of 11.5%.
The current price is near the top of the intraday range (96%). Buying support remains fairly active, and the pullback has been limited.
The price is above the 7-day moving average (133.36) and below the 25-day moving average (140.92), so the short-term structure remains intact.
In terms of position, the price is down 21.6% from the 30-day high of 172.48. The 30-day low is 120.33, and the 7-day cumulative change is -9.3%.
Trading volume is neutral; the market is gradually choosing a direction based on capital flows.
The key levels are clear: 135.72, the intraday high, is resistance above; 121.69 is the short-term support below. If the latter holds, the bulls still have a chance.
Keep an eye on two things next: whether the previous high above is decisively broken—otherwise, continue to treat this as range-bound trading—and whether the funding rate continues to diverge, as overheated sentiment often precedes a pullback.
At this same level, would you wait for a breakout or a retest?
(The above is a review of market activity and does not constitute investment advice. Futures trading involves risk.)
#SKHYB #K线复盘 #Technical Analysis
5
·
--
$SKHYB +1.42% | $TON +0.95% | $KORUB +0.87%
#SKHYB is holding at $128.88, up +1.42% with $1.3 M changing hands. The modest rise suggests steady buying pressure rather than a flash move.
#TON ticks at $1.60, gaining +0.95% on a solid $7.7 M of volume. That liquidity depth could help it stay resilient if broader sentiment sours.
#KORUB sits at $6.99, up +0.87% with $1.4 M traded. The incremental climb hints at modest interest from traders watching the mid‑cap space.
👀 Keep an eye on whether the higher TON volume translates into a breakout if the market pivots toward lower‑priced assets.
#Write2Earn #Binance
$SKHYB +1.42% | $TON +0.95% | $KORUB +0.87%
#SKHYB is holding at $128.88, up +1.42% with $1.3 M changing hands. The modest rise suggests steady buying pressure rather than a flash move.
#TON ticks at $1.60, gaining +0.95% on a solid $7.7 M of volume. That liquidity depth could help it stay resilient if broader sentiment sours.
#KORUB sits at $6.99, up +0.87% with $1.4 M traded. The incremental climb hints at modest interest from traders watching the mid‑cap space.
👀 Keep an eye on whether the higher TON volume translates into a breakout if the market pivots toward lower‑priced assets.
#Write2Earn #Binance
#SKHYB is holding at $128.88, up +1.42% with $1.3 M changing hands. The modest rise suggests steady buying pressure rather than a flash move.
#TON ticks at $1.60, gaining +0.95% on a solid $7.7 M of volume. That liquidity depth could help it stay resilient if broader sentiment sours.
#KORUB sits at $6.99, up +0.87% with $1.4 M traded. The incremental climb hints at modest interest from traders watching the mid‑cap space.
👀 Keep an eye on whether the higher TON volume translates into a breakout if the market pivots toward lower‑priced assets.
#Write2Earn #Binance
1
·
--
$SKHYB +1.47% | $AERO +1.42% | $KORUB +1.15%
#SKHYB nudged to $129.17, up +1.47% on $1.4 M of volume. The modest rise suggests some buying pressure, though the trade size remains modest.
#AERO climbed to $0.6135, gaining +1.42% with $1.8 M traded. The higher volume hints at broader interest beyond a simple price bounce.
#KORUB reached $7.02, up +1.15% on $1.4 M of volume. Momentum appears steady, but the thin margin leaves room for volatility.
👀 Keep an eye on whether these midsize caps can sustain their upward drift as larger market sentiment shifts.
#Write2Earn #Binance
$SKHYB +1.47% | $AERO +1.42% | $KORUB +1.15%
#SKHYB nudged to $129.17, up +1.47% on $1.4 M of volume. The modest rise suggests some buying pressure, though the trade size remains modest.
#AERO climbed to $0.6135, gaining +1.42% with $1.8 M traded. The higher volume hints at broader interest beyond a simple price bounce.
#KORUB reached $7.02, up +1.15% on $1.4 M of volume. Momentum appears steady, but the thin margin leaves room for volatility.
👀 Keep an eye on whether these midsize caps can sustain their upward drift as larger market sentiment shifts.
#Write2Earn #Binance
#SKHYB nudged to $129.17, up +1.47% on $1.4 M of volume. The modest rise suggests some buying pressure, though the trade size remains modest.
#AERO climbed to $0.6135, gaining +1.42% with $1.8 M traded. The higher volume hints at broader interest beyond a simple price bounce.
#KORUB reached $7.02, up +1.15% on $1.4 M of volume. Momentum appears steady, but the thin margin leaves room for volatility.
👀 Keep an eye on whether these midsize caps can sustain their upward drift as larger market sentiment shifts.
#Write2Earn #Binance
22
$SKHYB: Regression Bias in Volume Gaps
A missed entry often feels like a personal failure. We anchor on the missing profit rather than the rule that guided us. This is regression bias. The brain wants to erase the friction of a valid decision just because the next bar moved against it.
Current Observation
$SKHYB trades below support at 128.37. The hourly direction is down. Relative volume sits at 2.27076. These are facts. They are not a verdict on your judgment.
The Bias Mechanism
When price breaks support, fear spikes. If you waited for a retest and it failed to return, regret takes over. You might abandon your stop-loss rule. You decide the next move is safe because you already missed the initial drop. This shifts from evidence to hope. You are no longer trading the market. You are trading your discomfort with inaction.
Practical Self-Check
- Write your entry rule on paper before the chart appears.
- If the setup invalidates, ask: Would I enter now, or am I just avoiding loss?
- Accept that some moves exclude you. That is normal.
Anchoring on what you did not earn corrupts the next trade. Volume at 2.7919e+06 confirms activity, but it does not confirm fairness. Stick to the process. The next signal will not care about your earlier hesitation.
Probabilistic market research, not a recommendation or guaranteed return.
Would you keep the same rule after missing a move?
#SKHYB #TradingPsychology #CryptoLearning
$SKHYB : Regression Bias in Volume Gaps
A missed entry often feels like a personal failure. We anchor on the missing profit rather than the rule that guided us. This is regression bias. The brain wants to erase the friction of a valid decision just because the next bar moved against it.
Current Observation
$SKHYB trades below support at 128.37. The hourly direction is down. Relative volume sits at 2.27076. These are facts. They are not a verdict on your judgment.
The Bias Mechanism
When price breaks support, fear spikes. If you waited for a retest and it failed to return, regret takes over. You might abandon your stop-loss rule. You decide the next move is safe because you already missed the initial drop. This shifts from evidence to hope. You are no longer trading the market. You are trading your discomfort with inaction.
Practical Self-Check
- Write your entry rule on paper before the chart appears.
- If the setup invalidates, ask: Would I enter now, or am I just avoiding loss?
- Accept that some moves exclude you. That is normal.
Anchoring on what you did not earn corrupts the next trade. Volume at 2.7919e+06 confirms activity, but it does not confirm fairness. Stick to the process. The next signal will not care about your earlier hesitation.
Probabilistic market research, not a recommendation or guaranteed return.
Would you keep the same rule after missing a move?
#SKHYB #TradingPsychology #CryptoLearning
A missed entry often feels like a personal failure. We anchor on the missing profit rather than the rule that guided us. This is regression bias. The brain wants to erase the friction of a valid decision just because the next bar moved against it.
Current Observation
$SKHYB trades below support at 128.37. The hourly direction is down. Relative volume sits at 2.27076. These are facts. They are not a verdict on your judgment.
The Bias Mechanism
When price breaks support, fear spikes. If you waited for a retest and it failed to return, regret takes over. You might abandon your stop-loss rule. You decide the next move is safe because you already missed the initial drop. This shifts from evidence to hope. You are no longer trading the market. You are trading your discomfort with inaction.
Practical Self-Check
- Write your entry rule on paper before the chart appears.
- If the setup invalidates, ask: Would I enter now, or am I just avoiding loss?
- Accept that some moves exclude you. That is normal.
Anchoring on what you did not earn corrupts the next trade. Volume at 2.7919e+06 confirms activity, but it does not confirm fairness. Stick to the process. The next signal will not care about your earlier hesitation.
Probabilistic market research, not a recommendation or guaranteed return.
Would you keep the same rule after missing a move?
#SKHYB #TradingPsychology #CryptoLearning
48
·
--
$SKHYB looks ready to go higher from here 🚀
It gained 5.6 percent today and is still holding strong
Volume is steady at 8.5M matching the weekly average
Price sits right in the middle of today's range
Buying $SKHYB between 126.5816 and 128.3296
Invalid below 123.8546
Taking profit at 134.1680 138.2934 144.4814
Tap $SKHYB to buy it here
Last 7 days of my calls, 28 hit target and 62 hit stop
#SKHYB #TradingSignals
$SKHYB looks ready to go higher from here 🚀
It gained 5.6 percent today and is still holding strong
Volume is steady at 8.5M matching the weekly average
Price sits right in the middle of today's range
Buying $SKHYB between 126.5816 and 128.3296
Invalid below 123.8546
Taking profit at 134.1680 138.2934 144.4814
Tap $SKHYB to buy it here
Last 7 days of my calls, 28 hit target and 62 hit stop
#SKHYB #TradingSignals
It gained 5.6 percent today and is still holding strong
Volume is steady at 8.5M matching the weekly average
Price sits right in the middle of today's range
Buying $SKHYB between 126.5816 and 128.3296
Invalid below 123.8546
Taking profit at 134.1680 138.2934 144.4814
Tap $SKHYB to buy it here
Last 7 days of my calls, 28 hit target and 62 hit stop
#SKHYB #TradingSignals
87

·
--
Bullish
$SKHYB
{spot}(SKHYBUSDT)
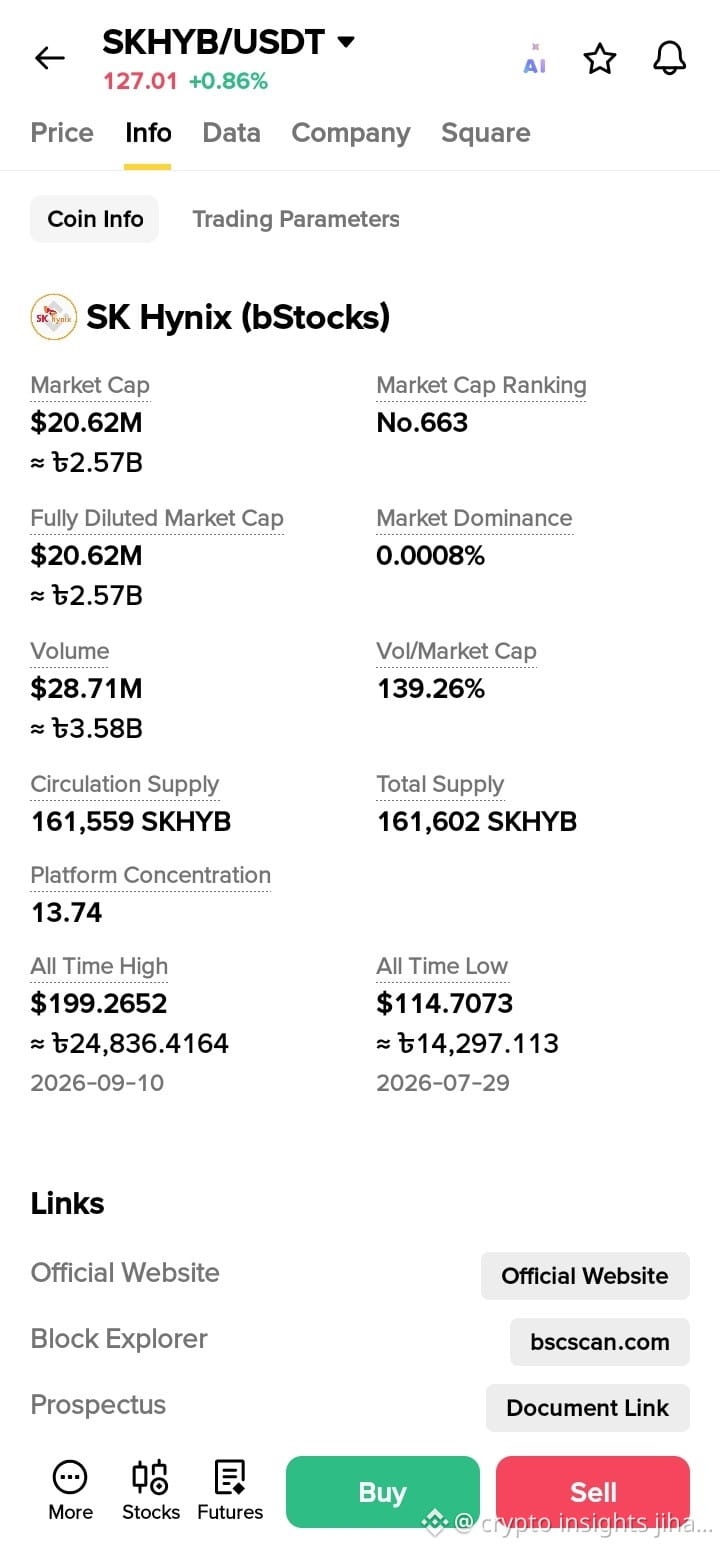
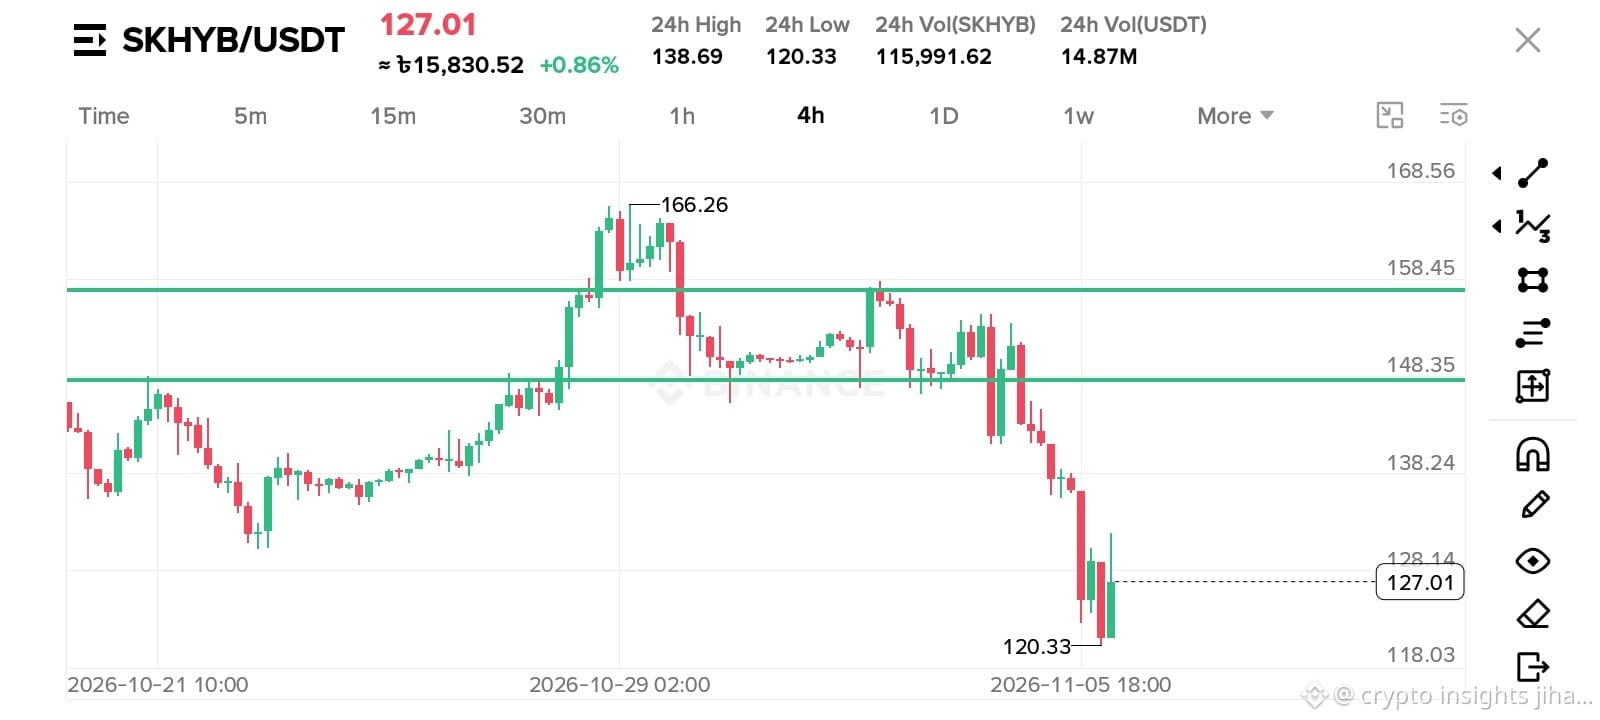
$SKHYB is at $127.01
Info says: Volume $28.71M, Market Cap $20.62M.
Vol / Cap = 139%. Means full supply traded 1.4x in 1 day.
Chart says: Dumped from $166 to $120.33, now bouncing. ATL is $114.70. We are very close.
So buyers are fighting hard near ATL.
My view: Above $128.14 = up to $138. Below $120.33 = down to $114.
You?
A) Buy here
B) Wait for $128 break
C) Short
Comment A / B / C 👇
#SKHYB #BTC
$SKHYB
$SKHYB is at $127.01
Info says: Volume $28.71M, Market Cap $20.62M.
Vol / Cap = 139%. Means full supply traded 1.4x in 1 day.
Chart says: Dumped from $166 to $120.33, now bouncing. ATL is $114.70. We are very close.
So buyers are fighting hard near ATL.
My view: Above $128.14 = up to $138. Below $120.33 = down to $114.
You?
A) Buy here
B) Wait for $128 break
C) Short
Comment A / B / C 👇
#SKHYB #BTC
$SKHYB is at $127.01
Info says: Volume $28.71M, Market Cap $20.62M.
Vol / Cap = 139%. Means full supply traded 1.4x in 1 day.
Chart says: Dumped from $166 to $120.33, now bouncing. ATL is $114.70. We are very close.
So buyers are fighting hard near ATL.
My view: Above $128.14 = up to $138. Below $120.33 = down to $114.
You?
A) Buy here
B) Wait for $128 break
C) Short
Comment A / B / C 👇
#SKHYB #BTC
1
127
·
--
Is $SKHYB setting up a reset or a deeper drop?
1. Current State: Price sits at $121.78 following a sharp 13.83% 24-hour decline on $15.40M volume.
2. Bullish Scenario: A move back above the 23-hour range low of $122.68 signals selling exhaustion and initial base building.
3. Risk Scenario: Falling further below $121.78 keeps the downside trend active toward fresh lows.
Risk management remains priority over chasing size here.
Will you wait for a clean reclaim of $122.68 before looking long, or does losing $121.78 confirm further downside?
Tap $SKHYB for the live chart. #SKHYB #BinanceSquare
Is $SKHYB setting up a reset or a deeper drop?
1. Current State: Price sits at $121.78 following a sharp 13.83% 24-hour decline on $15.40M volume.
2. Bullish Scenario: A move back above the 23-hour range low of $122.68 signals selling exhaustion and initial base building.
3. Risk Scenario: Falling further below $121.78 keeps the downside trend active toward fresh lows.
Risk management remains priority over chasing size here.
Will you wait for a clean reclaim of $122.68 before looking long, or does losing $121.78 confirm further downside?
Tap $SKHYB for the live chart. #SKHYB #BinanceSquare
1. Current State: Price sits at $121.78 following a sharp 13.83% 24-hour decline on $15.40M volume.
2. Bullish Scenario: A move back above the 23-hour range low of $122.68 signals selling exhaustion and initial base building.
3. Risk Scenario: Falling further below $121.78 keeps the downside trend active toward fresh lows.
Risk management remains priority over chasing size here.
Will you wait for a clean reclaim of $122.68 before looking long, or does losing $121.78 confirm further downside?
Tap $SKHYB for the live chart. #SKHYB #BinanceSquare
5

·
--
$SKHYB — Short Setup | Market Analysis
SKHYBUSDT has experienced a substantial -14.67% decline over the past 24 hours, accompanied by significant quote volume, indicating strong bearish conviction. This aggressive downward movement suggests sellers remain in control. We anticipate a continuation of this negative trend, making a short position favorable.
Market Context
24h Change: -14.67%
24h Volume: 15.2M USDT
Trade Plan
Entry: 121.62
Stop Loss: 122.59
TP1: 120.4
TP2: 119.19
TP3: 117.97
⚖️ Risk:Reward (TP1) 1:1.26
Confirmation Trigger: Market Entry / Immediate Execution
Risk Note: Trading involves substantial risk and is not suitable for all investors. The prices and targets provided are for informational purposes only and do not constitute financial advice. Always perform your own due diligence.
Discipline beats prediction every time.
#SKHYB #skhyb
$SKHYB — Short Setup | Market Analysis
SKHYBUSDT has experienced a substantial -14.67% decline over the past 24 hours, accompanied by significant quote volume, indicating strong bearish conviction. This aggressive downward movement suggests sellers remain in control. We anticipate a continuation of this negative trend, making a short position favorable.
Market Context
24h Change: -14.67%
24h Volume: 15.2M USDT
Trade Plan
Entry: 121.62
Stop Loss: 122.59
TP1: 120.4
TP2: 119.19
TP3: 117.97
⚖️ Risk:Reward (TP1) 1:1.26
Confirmation Trigger: Market Entry / Immediate Execution
Risk Note: Trading involves substantial risk and is not suitable for all investors. The prices and targets provided are for informational purposes only and do not constitute financial advice. Always perform your own due diligence.
Discipline beats prediction every time.
#SKHYB #skhyb
SKHYBUSDT has experienced a substantial -14.67% decline over the past 24 hours, accompanied by significant quote volume, indicating strong bearish conviction. This aggressive downward movement suggests sellers remain in control. We anticipate a continuation of this negative trend, making a short position favorable.
Market Context
24h Change: -14.67%
24h Volume: 15.2M USDT
Trade Plan
Entry: 121.62
Stop Loss: 122.59
TP1: 120.4
TP2: 119.19
TP3: 117.97
⚖️ Risk:Reward (TP1) 1:1.26
Confirmation Trigger: Market Entry / Immediate Execution
Risk Note: Trading involves substantial risk and is not suitable for all investors. The prices and targets provided are for informational purposes only and do not constitute financial advice. Always perform your own due diligence.
Discipline beats prediction every time.
#SKHYB #skhyb
5

·
--
💀 -10%, -35%, -10% — three coins getting absolutely wrecked while the market watches. Is there a trade here?
CRCLB, SNXXB, and SKHYB are all in freefall mode today. Different coins, different ecosystems, same pattern: heavy selling, expanding volume, and zero signs of a reversal. Let's break down what the charts are telling us.
📊 CRCLB (-10.2%): Price at $68.8 with RSI at 38.5 and falling. Volume 2.4x above average confirms this isn't just low-liquidity noise — real selling pressure is behind this move. Price has broken below SMA7 ($72.3) and is heading toward the $65 support zone. MACD histogram is deeply negative and still expanding.
📊 SNXXB (-34.9%): The biggest loser in today's top 10. RSI at 23.6 = textbook oversold, but the trend is violently bearish. Volume at 6x normal — this is liquidation-level selling. At $3.49 with SMA7 at $4.43, the gap is enormous. Any bounce will likely face aggressive selling at $3.80-4.00.
📊 SKHYB (-10.1%): The "mildest" of the three but still ugly. RSI at 31.8, volume at 0.98x (normal) which actually makes it scarier — this isn't panic, it's steady distribution. Price at $128 vs SMA7 of $133.7 shows persistent weakness. If $125 breaks, next support is $118-112.
🎯 Trade Plans (all shorts):
CRCLB: Entry $70-71 | SL $75 | TP $63 / $60
SNXXB: Entry $3.50-3.70 | SL $4.10 | TP $3.00 / $2.80
SKHYB: Entry $130-132 | SL $142 | TP $118 / $112
Which one do you think finds support first — or are they all heading lower? 📉
#CRCLB #SNXXB #SKHYB
💀 -10%, -35%, -10% — three coins getting absolutely wrecked while the market watches. Is there a trade here?
CRCLB, SNXXB, and SKHYB are all in freefall mode today. Different coins, different ecosystems, same pattern: heavy selling, expanding volume, and zero signs of a reversal. Let's break down what the charts are telling us.
📊 CRCLB (-10.2%): Price at $68.8 with RSI at 38.5 and falling. Volume 2.4x above average confirms this isn't just low-liquidity noise — real selling pressure is behind this move. Price has broken below SMA7 ($72.3) and is heading toward the $65 support zone. MACD histogram is deeply negative and still expanding.
📊 SNXXB (-34.9%): The biggest loser in today's top 10. RSI at 23.6 = textbook oversold, but the trend is violently bearish. Volume at 6x normal — this is liquidation-level selling. At $3.49 with SMA7 at $4.43, the gap is enormous. Any bounce will likely face aggressive selling at $3.80-4.00.
📊 SKHYB (-10.1%): The "mildest" of the three but still ugly. RSI at 31.8, volume at 0.98x (normal) which actually makes it scarier — this isn't panic, it's steady distribution. Price at $128 vs SMA7 of $133.7 shows persistent weakness. If $125 breaks, next support is $118-112.
🎯 Trade Plans (all shorts):
CRCLB: Entry $70-71 | SL $75 | TP $63 / $60
SNXXB: Entry $3.50-3.70 | SL $4.10 | TP $3.00 / $2.80
SKHYB: Entry $130-132 | SL $142 | TP $118 / $112
Which one do you think finds support first — or are they all heading lower? 📉
#CRCLB #SNXXB #SKHYB
CRCLB, SNXXB, and SKHYB are all in freefall mode today. Different coins, different ecosystems, same pattern: heavy selling, expanding volume, and zero signs of a reversal. Let's break down what the charts are telling us.
📊 CRCLB (-10.2%): Price at $68.8 with RSI at 38.5 and falling. Volume 2.4x above average confirms this isn't just low-liquidity noise — real selling pressure is behind this move. Price has broken below SMA7 ($72.3) and is heading toward the $65 support zone. MACD histogram is deeply negative and still expanding.
📊 SNXXB (-34.9%): The biggest loser in today's top 10. RSI at 23.6 = textbook oversold, but the trend is violently bearish. Volume at 6x normal — this is liquidation-level selling. At $3.49 with SMA7 at $4.43, the gap is enormous. Any bounce will likely face aggressive selling at $3.80-4.00.
📊 SKHYB (-10.1%): The "mildest" of the three but still ugly. RSI at 31.8, volume at 0.98x (normal) which actually makes it scarier — this isn't panic, it's steady distribution. Price at $128 vs SMA7 of $133.7 shows persistent weakness. If $125 breaks, next support is $118-112.
🎯 Trade Plans (all shorts):
CRCLB: Entry $70-71 | SL $75 | TP $63 / $60
SNXXB: Entry $3.50-3.70 | SL $4.10 | TP $3.00 / $2.80
SKHYB: Entry $130-132 | SL $142 | TP $118 / $112
Which one do you think finds support first — or are they all heading lower? 📉
#CRCLB #SNXXB #SKHYB
834
·
--
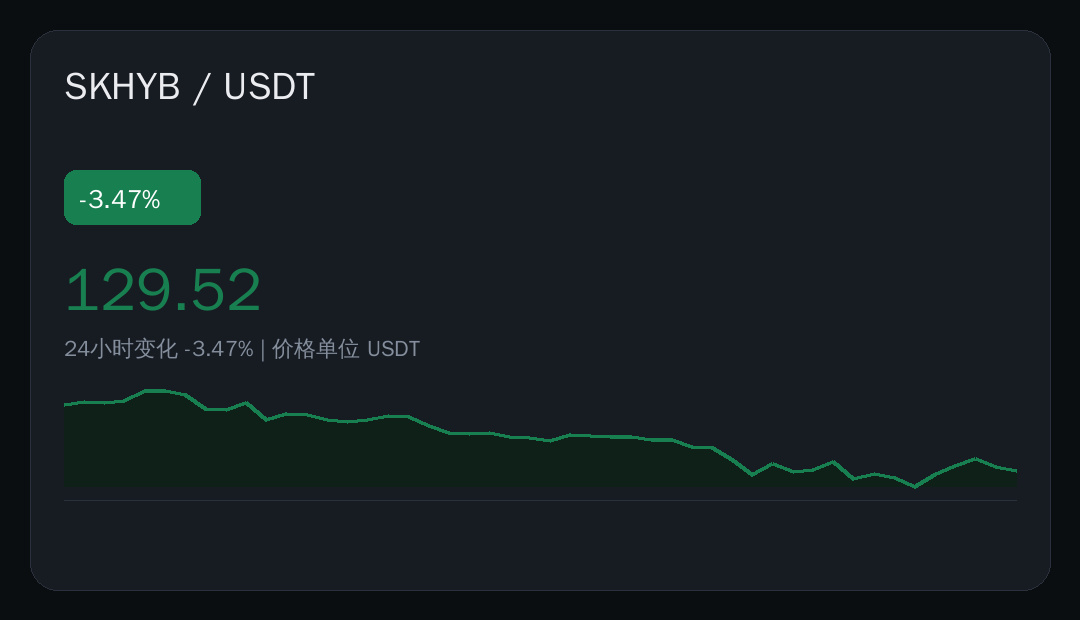
⚠️ A steady slide, and $SKHYB is at it again: down 3.47% in 24 hours, current price 129.52 USDT.
📊 Data snapshot
· Current price: 129.52 USDT
· 24h: -3.47%
· Range: 120.33 — 134.50
· Trading volume: 14909855.68 USDT
No need to panic just yet—the data speaks for itself. Volume is more worth watching than price.
What do you think? 👇
#市场观察 #SKHYB #Binance
⚠️ A steady slide, and $SKHYB is at it again: down 3.47% in 24 hours, current price 129.52 USDT.
📊 Data snapshot
· Current price: 129.52 USDT
· 24h: -3.47%
· Range: 120.33 — 134.50
· Trading volume: 14909855.68 USDT
No need to panic just yet—the data speaks for itself. Volume is more worth watching than price.
What do you think? 👇
#市场观察 #SKHYB #Binance
📊 Data snapshot
· Current price: 129.52 USDT
· 24h: -3.47%
· Range: 120.33 — 134.50
· Trading volume: 14909855.68 USDT
No need to panic just yet—the data speaks for itself. Volume is more worth watching than price.
What do you think? 👇
#市场观察 #SKHYB #Binance
Log in to explore more content
Join global crypto users on Binance Square
⚡️ Get latest and useful information about crypto.
💬 Trusted by the world’s largest crypto exchange.
👍 Discover real insights from verified creators.
Email / Phone number
Trending Topics
1
#HotCPIDecemberHikePriced
186,078 views
2,015 Discussing
2
#StrategyFaces$2.8BSelloffRiskFromMSCIRemoval
3,657 views
55 Discussing
3
#AnthropicRejectsIPODelayValuationinQuestion
287,294 views
2,428 Discussing
4
#CanNvidiaEarningsEaseMarketConcerns?
65,964 views
888 Discussing
5
#BitmineReports$6.3BFiscal2026Loss
0 views
2 Discussing
6
#SouthKoreaPartiesTentativelyAgreeToDelayCryptoTax
494 views
24 Discussing
7
#FSBUrgesTurkeyToEstablishStablecoinFramework
1,364 views
36 Discussing
8
#BitcoinFiveWeeklyLosses
633,735 views
3,934 Discussing
9
#XRPLedger2027RoadmapProposesQuantumResistantSignatures
249 views
6 Discussing
10
#SECEnforcementActionsFall24%InFiscal2026
2,123 views
33 Discussing