
#oversold
oversold
287,249 views
1,451 Discussing
Hot
Latest

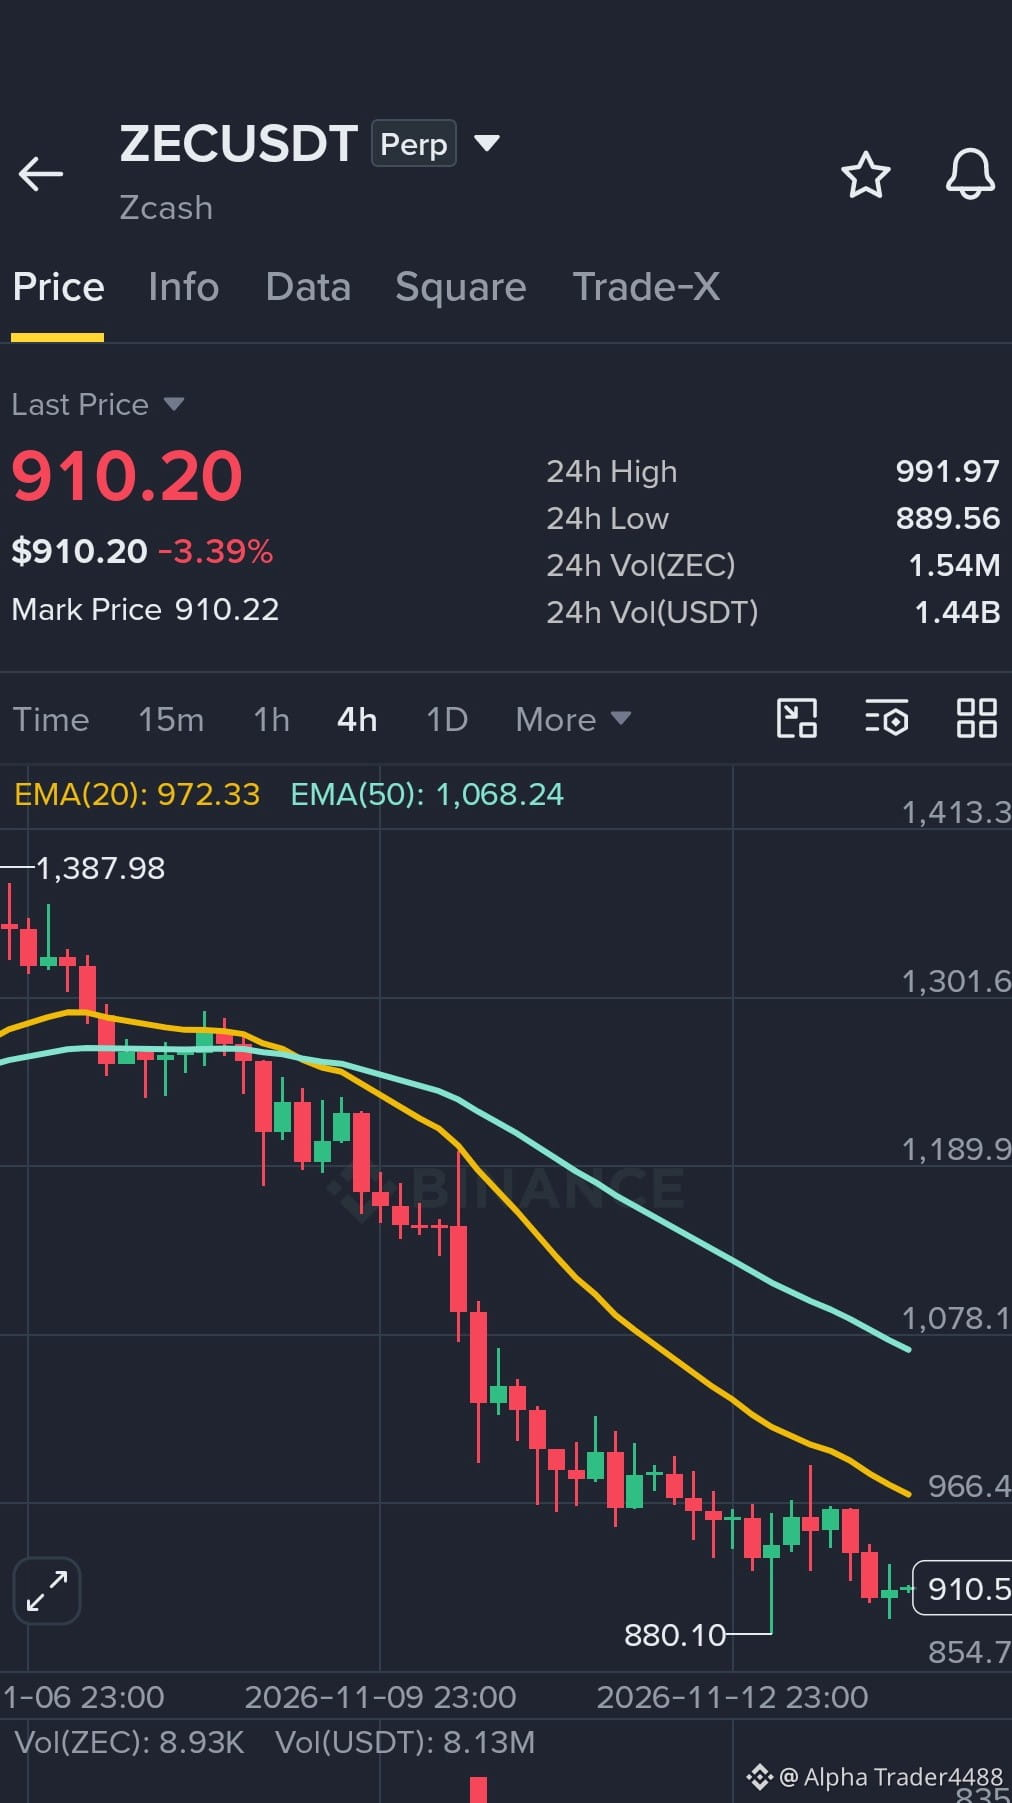
$ZEC Analysis:
Trend: BEARISH - Price far below EMA20 972.33 and EMA50 1068.24, EMA20 under EMA50 death cross, lower highs
But: Oversold extreme RSI 28.71, this is bottoming zone 880-910, volume 835K spike at bottom showing capitulation then green buying
What is better?
DO NOT SHORT NOW - Too late, risk reward bad. Shorting at RSI 28 on support 880 is chasing.
Option 1 SAFE: Wait for bounce to short
Best short zone 966 - 972 EMA20 resistance
Entry: 966 - 972
Stop: 1010 above
Targets: 910 - 889 - 850
This is best high probability
Option 2 RISKY SCALP LONG for bounce
Price at 910 near low 880.10, RSI 28.71 will bounce to 966
Long entry: 905 - 915 current
Stop: 880 low break
Targets: 966 EMA20 +4% and 1020 +12%
Small size, scalp only
My call: BETTER IS SHORT ON BOUNCE, NOT LONG CHASE
{future}(ZECUSDT)
#ZEC #Zcash #Oversold #Binance
$ZEC Analysis:
Trend: BEARISH - Price far below EMA20 972.33 and EMA50 1068.24, EMA20 under EMA50 death cross, lower highs
But: Oversold extreme RSI 28.71, this is bottoming zone 880-910, volume 835K spike at bottom showing capitulation then green buying
What is better?
DO NOT SHORT NOW - Too late, risk reward bad. Shorting at RSI 28 on support 880 is chasing.
Option 1 SAFE: Wait for bounce to short
Best short zone 966 - 972 EMA20 resistance
Entry: 966 - 972
Stop: 1010 above
Targets: 910 - 889 - 850
This is best high probability
Option 2 RISKY SCALP LONG for bounce
Price at 910 near low 880.10, RSI 28.71 will bounce to 966
Long entry: 905 - 915 current
Stop: 880 low break
Targets: 966 EMA20 +4% and 1020 +12%
Small size, scalp only
My call: BETTER IS SHORT ON BOUNCE, NOT LONG CHASE
#ZEC #Zcash #Oversold #Binance
Trend: BEARISH - Price far below EMA20 972.33 and EMA50 1068.24, EMA20 under EMA50 death cross, lower highs
But: Oversold extreme RSI 28.71, this is bottoming zone 880-910, volume 835K spike at bottom showing capitulation then green buying
What is better?
DO NOT SHORT NOW - Too late, risk reward bad. Shorting at RSI 28 on support 880 is chasing.
Option 1 SAFE: Wait for bounce to short
Best short zone 966 - 972 EMA20 resistance
Entry: 966 - 972
Stop: 1010 above
Targets: 910 - 889 - 850
This is best high probability
Option 2 RISKY SCALP LONG for bounce
Price at 910 near low 880.10, RSI 28.71 will bounce to 966
Long entry: 905 - 915 current
Stop: 880 low break
Targets: 966 EMA20 +4% and 1020 +12%
Small size, scalp only
My call: BETTER IS SHORT ON BOUNCE, NOT LONG CHASE
#ZEC #Zcash #Oversold #Binance
1
193

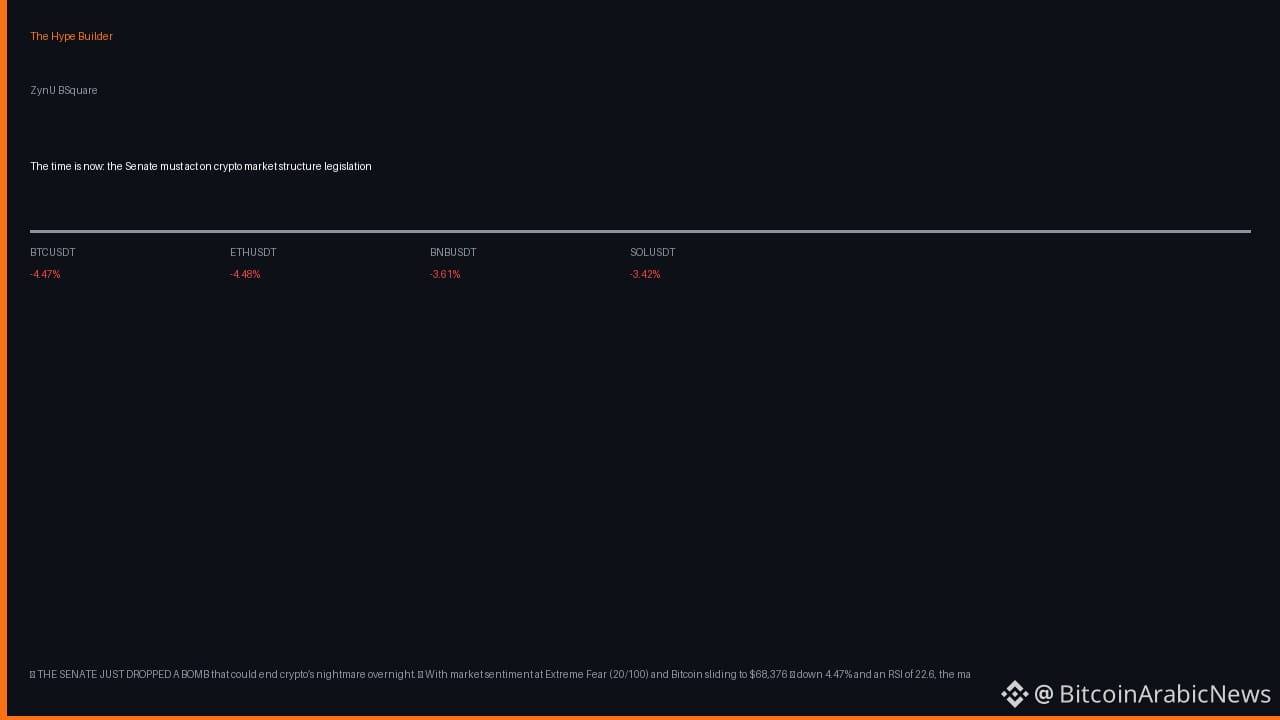
🔥 THE SENATE JUST DROPPED A BOMB that could end crypto’s nightmare overnight.
📊 With market sentiment at Extreme Fear (20/100) and Bitcoin sliding to $68,376 – down 4.47% and an RSI of 22.6, the market is officially #OVERSOLD and primed for a breakout. #BTC
📊 Meanwhile, BTC futures open interest sits at a massive $6.71 B and funding turned bullish (+0.0085%), meaning longs are getting paid while smart wallets are already loading up on Solana gems like FDNA – a clear sign institutional firepower is waiting for regulatory green‑light. #CryptoRegulation
💡 If the Senate finally clears the market‑structure bill, we could see a flood of $10‑$20 B in inflows, catapulting BTC back above $80K and igniting the next alt‑season. #BullRun
❓ Are you ready to ride the wave when Congress says yes, or will you watch from the sidelines?
🔥 THE SENATE JUST DROPPED A BOMB that could end crypto’s nightmare overnight.
📊 With market sentiment at Extreme Fear (20/100) and Bitcoin sliding to $68,376 – down 4.47% and an RSI of 22.6, the market is officially #OVERSOLD and primed for a breakout. #BTC
📊 Meanwhile, BTC futures open interest sits at a massive $6.71 B and funding turned bullish (+0.0085%), meaning longs are getting paid while smart wallets are already loading up on Solana gems like FDNA – a clear sign institutional firepower is waiting for regulatory green‑light. #CryptoRegulation
💡 If the Senate finally clears the market‑structure bill, we could see a flood of $10‑$20 B in inflows, catapulting BTC back above $80K and igniting the next alt‑season. #BullRun
❓ Are you ready to ride the wave when Congress says yes, or will you watch from the sidelines?
📊 With market sentiment at Extreme Fear (20/100) and Bitcoin sliding to $68,376 – down 4.47% and an RSI of 22.6, the market is officially #OVERSOLD and primed for a breakout. #BTC
📊 Meanwhile, BTC futures open interest sits at a massive $6.71 B and funding turned bullish (+0.0085%), meaning longs are getting paid while smart wallets are already loading up on Solana gems like FDNA – a clear sign institutional firepower is waiting for regulatory green‑light. #CryptoRegulation
💡 If the Senate finally clears the market‑structure bill, we could see a flood of $10‑$20 B in inflows, catapulting BTC back above $80K and igniting the next alt‑season. #BullRun
❓ Are you ready to ride the wave when Congress says yes, or will you watch from the sidelines?
7

·
--
$BTC Momentum Enters Oversold Territory After Recent Declines
$BTC trades at 69,038.01 USD, down 3.5% over the past 24 hours, with 4H RSI at 24.7 (oversold).
Recent downward movement over the past twenty-four hours has driven momentum into oversold territory on the four-hour chart. Market participants often observe whether selling pressure stabilizes or continues when technical momentum reaches these lower extremes.
TECHNICAL READ
▪️ Momentum: 4H RSI 24.7 sits in the oversold zone
▪️ Trend filter: EMA 20 is below EMA 50, and price is below EMA 20
▪️ Range: price is 8.5% below the range high and 2.2% above the range low
WHAT WOULD CONFIRM A BOUNCE
▪️ RSI recovering above 30 with a 4H close above EMA 20 (71,747.27 USD)
▪️ Price defending 67,568.00 USD on retests
WHAT WOULD INVALIDATE IT
▪️ A 4H close below 67,568.00 USD
▪️ RSI staying pinned in oversold territory while price makes lower lows
Do you expect a short-term rebound from oversold territory, or will downward pressure persist?
Not financial advice. Always DYOR.
Like & Follow for Daily Trade Analytics & Insider News. @MistralAK
#Bitcoin #Oversold #BitcoinCoreDisclosesTorTrafficVulnerability
{spot}(BTCUSDT)
$BTC Momentum Enters Oversold Territory After Recent Declines
$BTC trades at 69,038.01 USD, down 3.5% over the past 24 hours, with 4H RSI at 24.7 (oversold).
Recent downward movement over the past twenty-four hours has driven momentum into oversold territory on the four-hour chart. Market participants often observe whether selling pressure stabilizes or continues when technical momentum reaches these lower extremes.
TECHNICAL READ
▪️ Momentum: 4H RSI 24.7 sits in the oversold zone
▪️ Trend filter: EMA 20 is below EMA 50, and price is below EMA 20
▪️ Range: price is 8.5% below the range high and 2.2% above the range low
WHAT WOULD CONFIRM A BOUNCE
▪️ RSI recovering above 30 with a 4H close above EMA 20 (71,747.27 USD)
▪️ Price defending 67,568.00 USD on retests
WHAT WOULD INVALIDATE IT
▪️ A 4H close below 67,568.00 USD
▪️ RSI staying pinned in oversold territory while price makes lower lows
Do you expect a short-term rebound from oversold territory, or will downward pressure persist?
Not financial advice. Always DYOR.
Like & Follow for Daily Trade Analytics & Insider News. @MistralAK
#Bitcoin #Oversold #BitcoinCoreDisclosesTorTrafficVulnerability
$BTC trades at 69,038.01 USD, down 3.5% over the past 24 hours, with 4H RSI at 24.7 (oversold).
Recent downward movement over the past twenty-four hours has driven momentum into oversold territory on the four-hour chart. Market participants often observe whether selling pressure stabilizes or continues when technical momentum reaches these lower extremes.
TECHNICAL READ
▪️ Momentum: 4H RSI 24.7 sits in the oversold zone
▪️ Trend filter: EMA 20 is below EMA 50, and price is below EMA 20
▪️ Range: price is 8.5% below the range high and 2.2% above the range low
WHAT WOULD CONFIRM A BOUNCE
▪️ RSI recovering above 30 with a 4H close above EMA 20 (71,747.27 USD)
▪️ Price defending 67,568.00 USD on retests
WHAT WOULD INVALIDATE IT
▪️ A 4H close below 67,568.00 USD
▪️ RSI staying pinned in oversold territory while price makes lower lows
Do you expect a short-term rebound from oversold territory, or will downward pressure persist?
Not financial advice. Always DYOR.
Like & Follow for Daily Trade Analytics & Insider News. @MistralAK
#Bitcoin #Oversold #BitcoinCoreDisclosesTorTrafficVulnerability

68

·
--
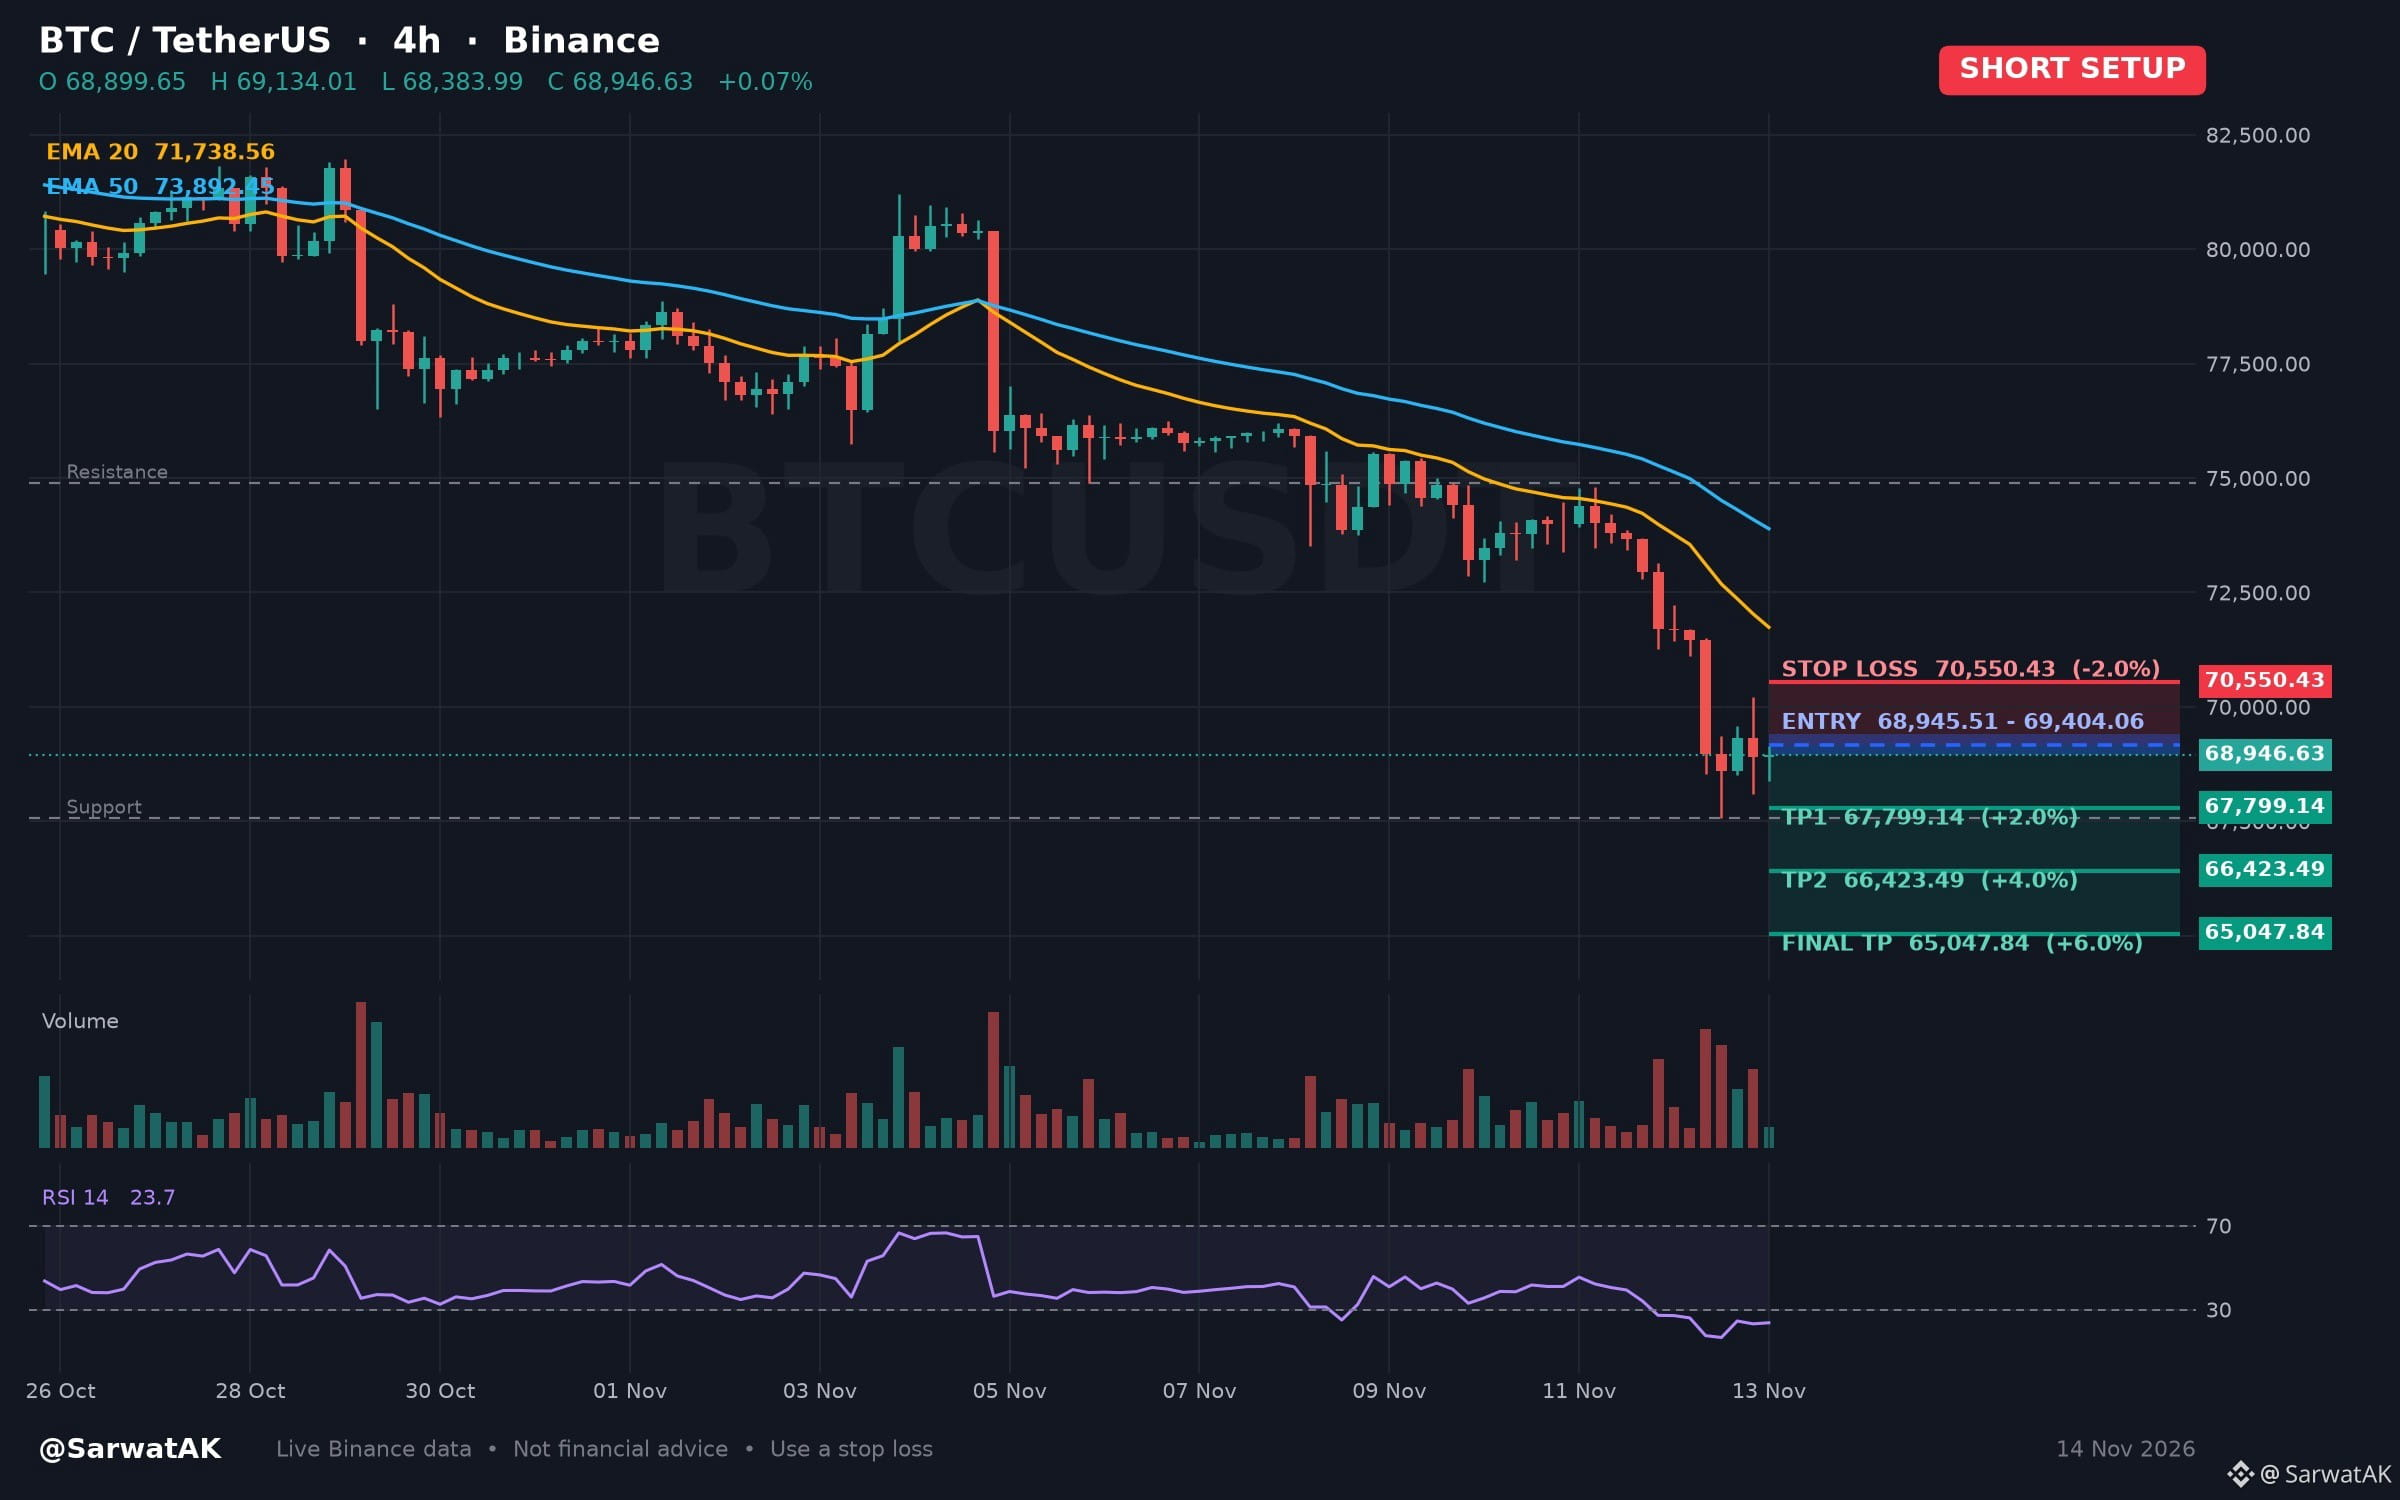
$BTC SHORT SETUP ... NEXT TARGET 65,047.84
Oversold Relative Strength Index Emerges Following Downward Price Pressure
Entry: 68,945.51 - 69,404.06 (Short)
TP1: 67,799.14
TP2: 66,423.49
Final TP: 65,047.84
SL: 70,550.43
Recent downward movement over the past twenty-four hours has driven the relative strength index into oversold territory on the four-hour chart. Market participants often observe whether such compressed readings precede temporary stabilization or continued decline.
As long as price stays below 69,404.06, structure stays heavy
Must use stop loss while trading
Trade $BTC
Not financial advice. Always DYOR.
🙏 Tips are always welcome and truly appreciated. Thank you for supporting Open to Discussion.
Like & Follow for Daily Trade Analytics & Insider News. @SarwatAK
#Bitcoin #Oversold #TrendingTopic
$BTC SHORT SETUP ... NEXT TARGET 65,047.84
Oversold Relative Strength Index Emerges Following Downward Price Pressure
Entry: 68,945.51 - 69,404.06 (Short)
TP1: 67,799.14
TP2: 66,423.49
Final TP: 65,047.84
SL: 70,550.43
Recent downward movement over the past twenty-four hours has driven the relative strength index into oversold territory on the four-hour chart. Market participants often observe whether such compressed readings precede temporary stabilization or continued decline.
As long as price stays below 69,404.06, structure stays heavy
Must use stop loss while trading
Trade $BTC
Not financial advice. Always DYOR.
🙏 Tips are always welcome and truly appreciated. Thank you for supporting Open to Discussion.
Like & Follow for Daily Trade Analytics & Insider News. @SarwatAK
#Bitcoin #Oversold #TrendingTopic
Oversold Relative Strength Index Emerges Following Downward Price Pressure
Entry: 68,945.51 - 69,404.06 (Short)
TP1: 67,799.14
TP2: 66,423.49
Final TP: 65,047.84
SL: 70,550.43
Recent downward movement over the past twenty-four hours has driven the relative strength index into oversold territory on the four-hour chart. Market participants often observe whether such compressed readings precede temporary stabilization or continued decline.
As long as price stays below 69,404.06, structure stays heavy
Must use stop loss while trading
Trade $BTC
Not financial advice. Always DYOR.
🙏 Tips are always welcome and truly appreciated. Thank you for supporting Open to Discussion.
Like & Follow for Daily Trade Analytics & Insider News. @SarwatAK
#Bitcoin #Oversold #TrendingTopic
Dj Snak:
تحليل جميل 🥀
1
3
·
--
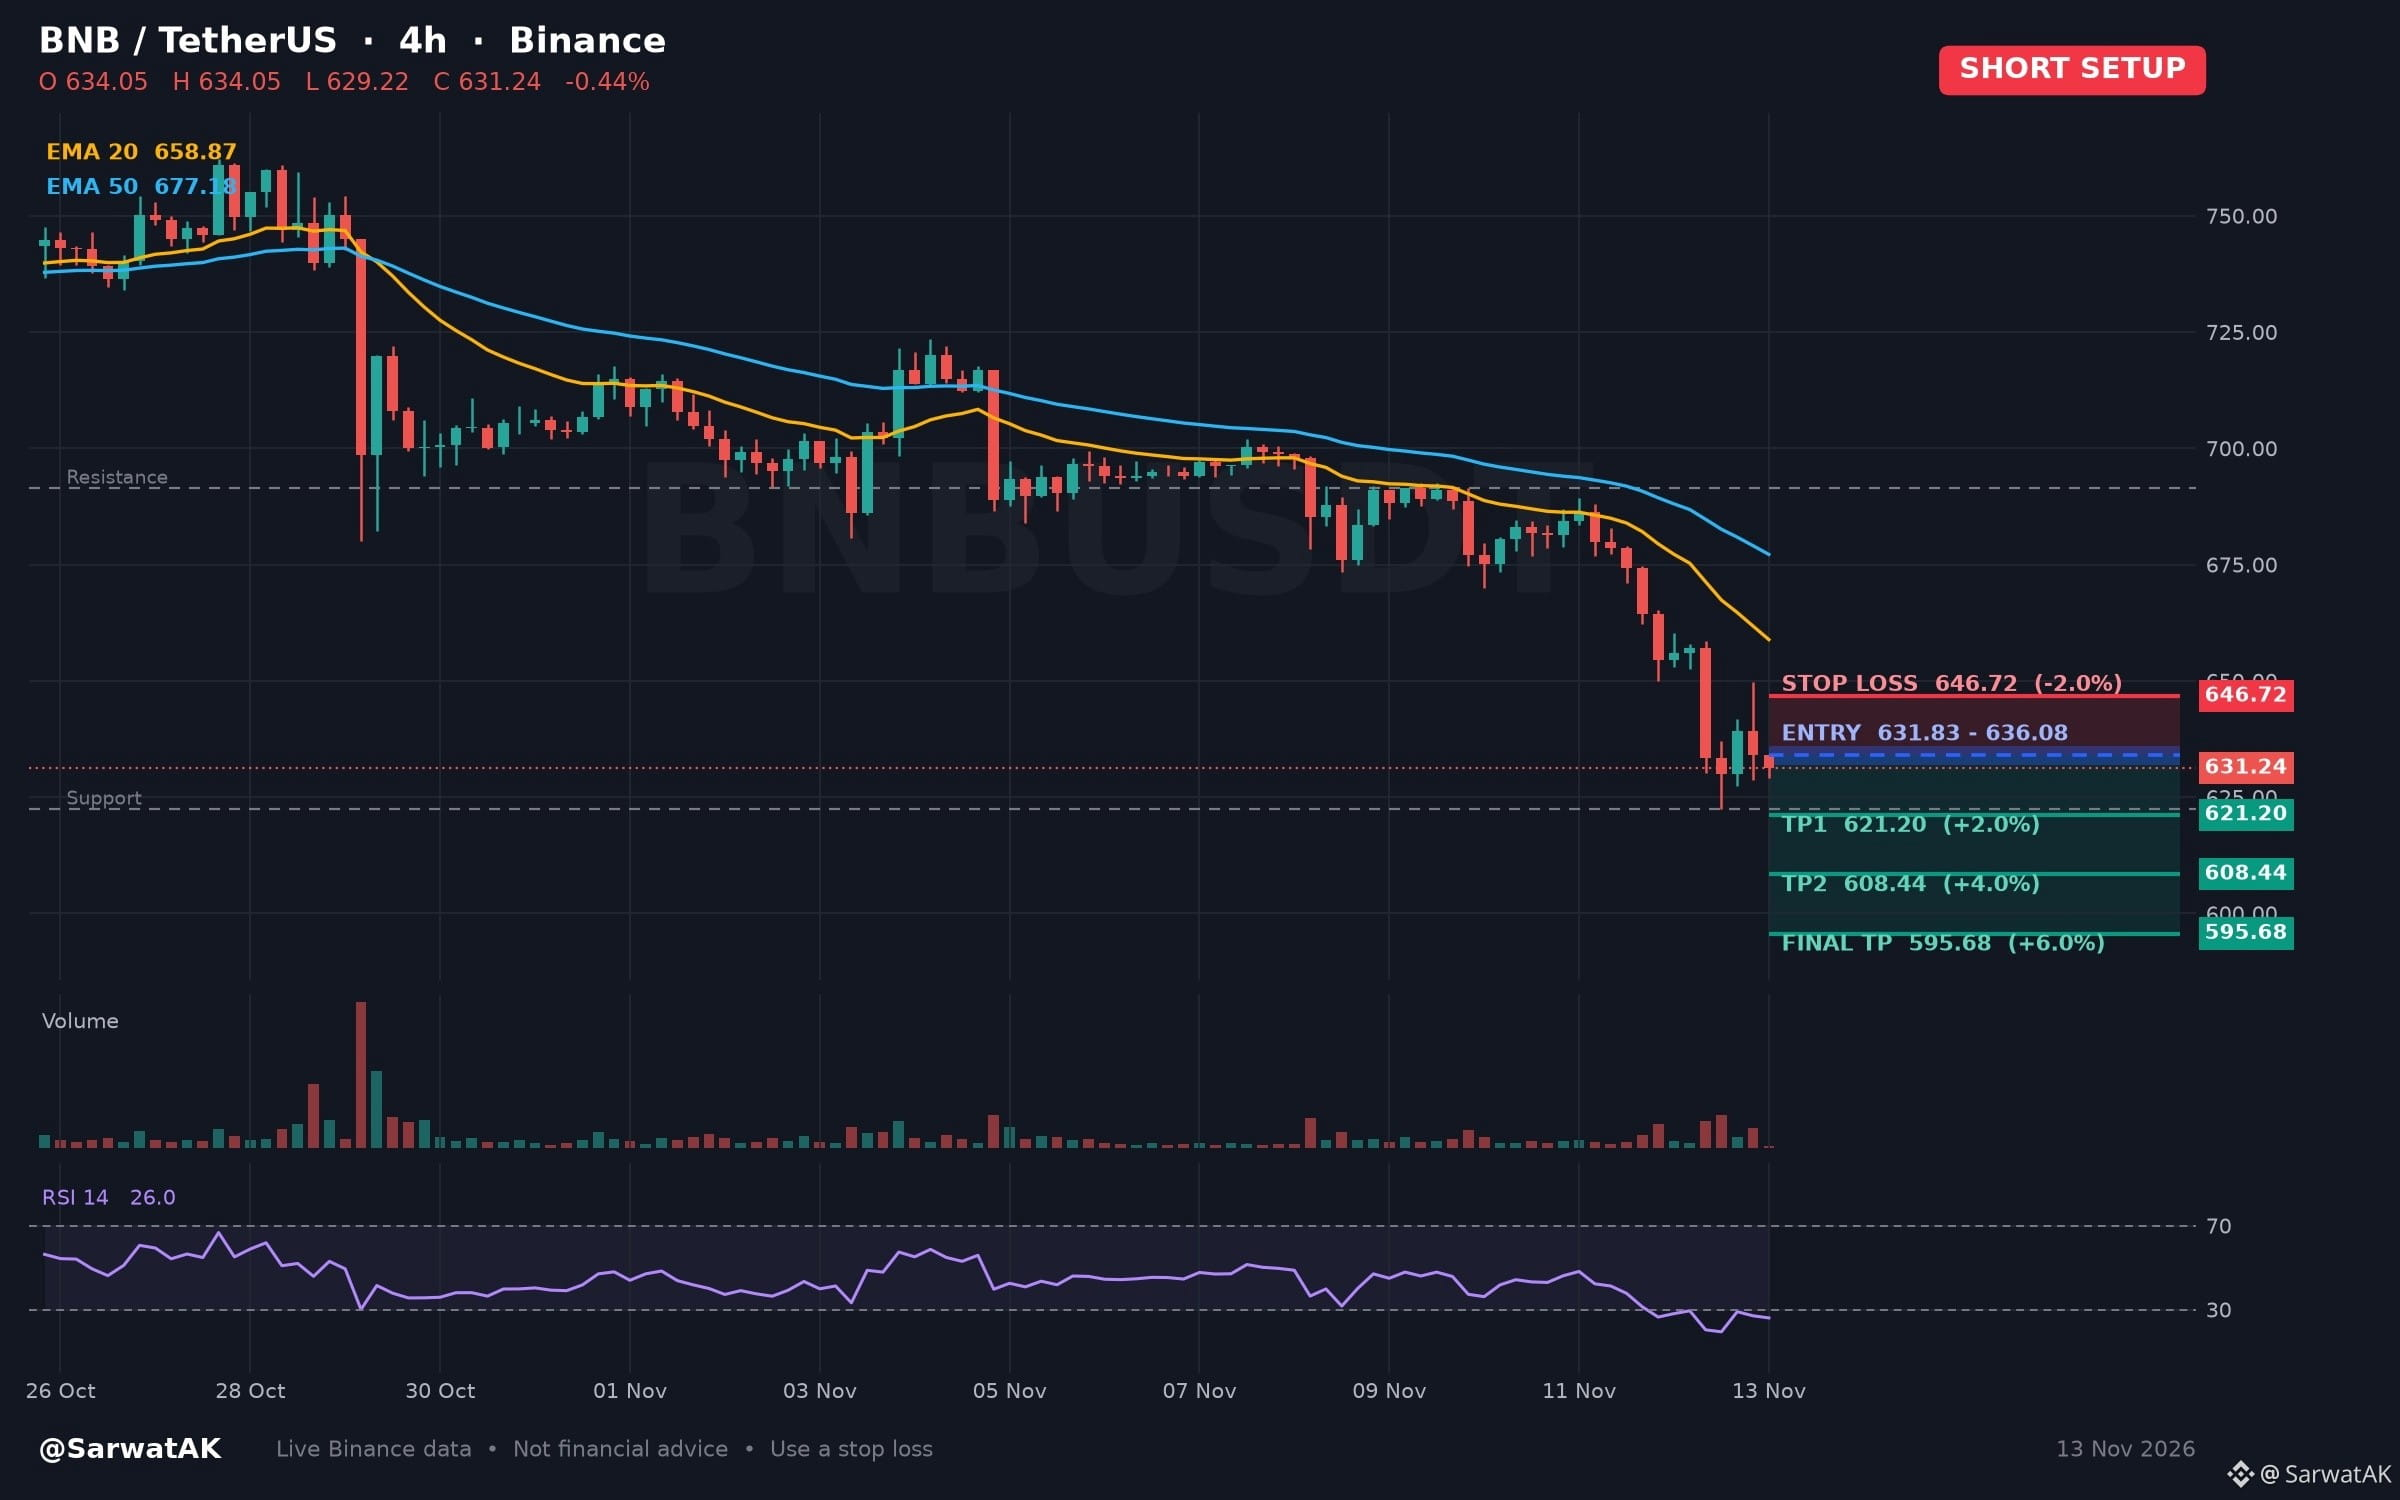
$BNB SHORT SETUP ... NEXT TARGET 595.68
Oversold Relative Strength Index Meets Continued Short Term Downward Momentum
Entry: 631.83 - 636.08 (Short)
TP1: 621.20
TP2: 608.44
Final TP: 595.68
SL: 646.72
The short-term decline over the past twenty-four hours has driven the four-hour relative strength index into oversold territory. Market participants often observe whether such extended momentum prompts a stabilization or if selling pressure continues.
As long as price stays below 636.08, structure stays heavy
Must use stop loss while trading
Trade $BNB
Not financial advice. Always DYOR.
🙏 Tips are always welcome and truly appreciated. Thank you for supporting Open to Discussion.
Like & Follow for Daily Trade Analytics & Insider News. @SarwatAK
#BNB #Oversold #TrendingTopic
$BNB SHORT SETUP ... NEXT TARGET 595.68
Oversold Relative Strength Index Meets Continued Short Term Downward Momentum
Entry: 631.83 - 636.08 (Short)
TP1: 621.20
TP2: 608.44
Final TP: 595.68
SL: 646.72
The short-term decline over the past twenty-four hours has driven the four-hour relative strength index into oversold territory. Market participants often observe whether such extended momentum prompts a stabilization or if selling pressure continues.
As long as price stays below 636.08, structure stays heavy
Must use stop loss while trading
Trade $BNB
Not financial advice. Always DYOR.
🙏 Tips are always welcome and truly appreciated. Thank you for supporting Open to Discussion.
Like & Follow for Daily Trade Analytics & Insider News. @SarwatAK
#BNB #Oversold #TrendingTopic
Oversold Relative Strength Index Meets Continued Short Term Downward Momentum
Entry: 631.83 - 636.08 (Short)
TP1: 621.20
TP2: 608.44
Final TP: 595.68
SL: 646.72
The short-term decline over the past twenty-four hours has driven the four-hour relative strength index into oversold territory. Market participants often observe whether such extended momentum prompts a stabilization or if selling pressure continues.
As long as price stays below 636.08, structure stays heavy
Must use stop loss while trading
Trade $BNB
Not financial advice. Always DYOR.
🙏 Tips are always welcome and truly appreciated. Thank you for supporting Open to Discussion.
Like & Follow for Daily Trade Analytics & Insider News. @SarwatAK
#BNB #Oversold #TrendingTopic
4

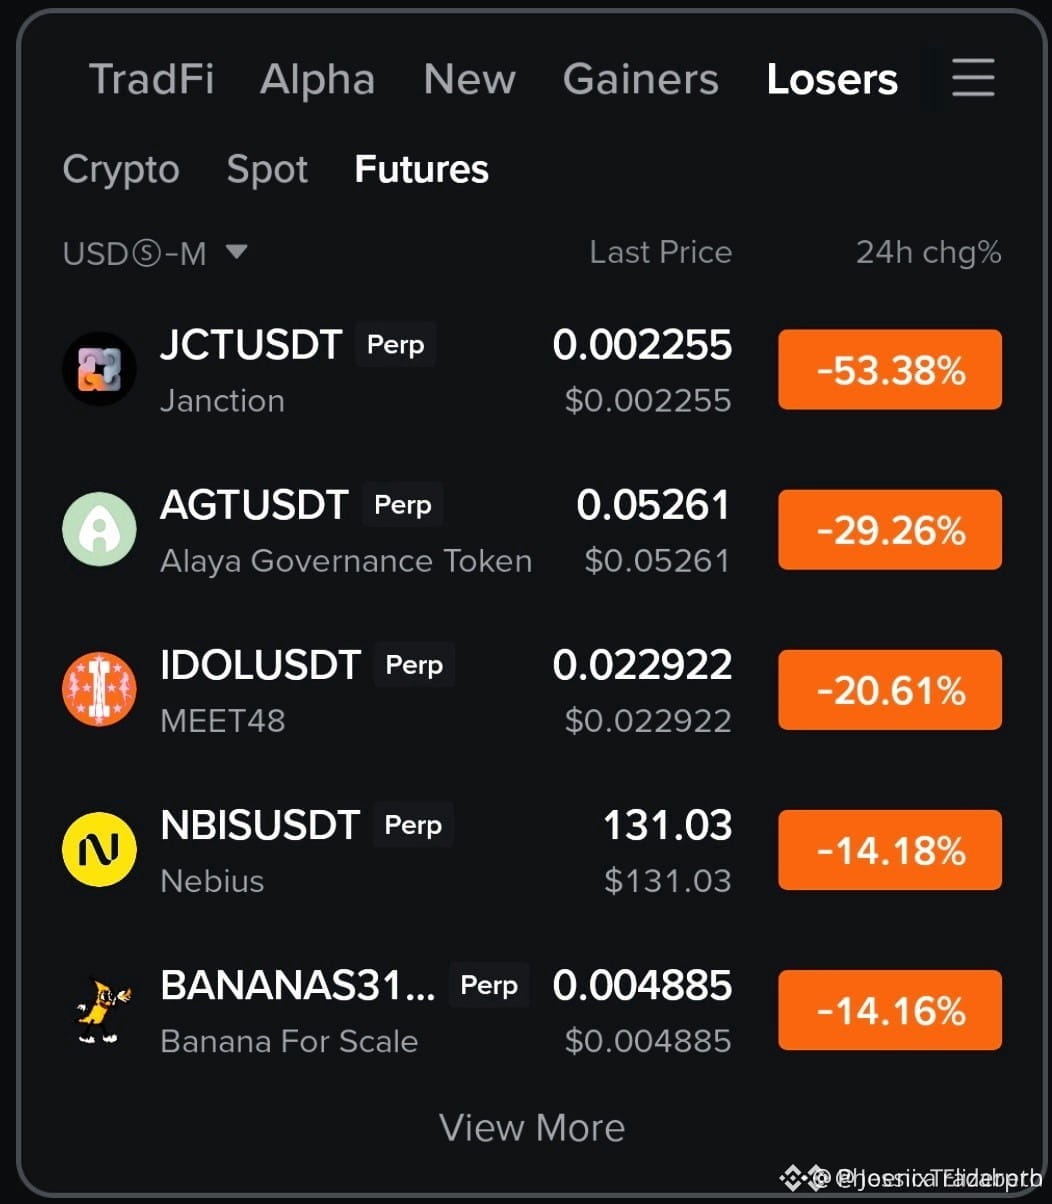
🔴 $JCT BLEEDING TO DEEP SUPPORT WHILE RETAIL PANICS AND SMART MONEY CIRCLES! 🦈
Severe sell-offs on a major exchange often leave blood in the streets, but deep red daily closes create prime hunting grounds for disciplined participants. 📊 Order books show heavy absorption clusters building around local lows as weak hands capitulate.
When momentum indicators plunge into extreme oversold territory, the risk-to-reward dynamics shift drastically for patient buyers waiting for a structural reclaim. ⚡ Tracking how price reacts to these capitulation zones separates casual spectators from experienced operators.
💬 Are you waiting for a confirmed volume expansion before bidding this heavy dip, or fading the bleed? 👇
⚠️ Not financial advice. Always manage your risk. 🛡️
🏷️ #JCT #MarketCorrection #Oversold #CryptoTrading
🔥 💎
🔴 $JCT BLEEDING TO DEEP SUPPORT WHILE RETAIL PANICS AND SMART MONEY CIRCLES! 🦈
Severe sell-offs on a major exchange often leave blood in the streets, but deep red daily closes create prime hunting grounds for disciplined participants. 📊 Order books show heavy absorption clusters building around local lows as weak hands capitulate.
When momentum indicators plunge into extreme oversold territory, the risk-to-reward dynamics shift drastically for patient buyers waiting for a structural reclaim. ⚡ Tracking how price reacts to these capitulation zones separates casual spectators from experienced operators.
💬 Are you waiting for a confirmed volume expansion before bidding this heavy dip, or fading the bleed? 👇
⚠️ Not financial advice. Always manage your risk. 🛡️
🏷️ #JCT #MarketCorrection #Oversold #CryptoTrading
🔥 💎
Severe sell-offs on a major exchange often leave blood in the streets, but deep red daily closes create prime hunting grounds for disciplined participants. 📊 Order books show heavy absorption clusters building around local lows as weak hands capitulate.
When momentum indicators plunge into extreme oversold territory, the risk-to-reward dynamics shift drastically for patient buyers waiting for a structural reclaim. ⚡ Tracking how price reacts to these capitulation zones separates casual spectators from experienced operators.
💬 Are you waiting for a confirmed volume expansion before bidding this heavy dip, or fading the bleed? 👇
⚠️ Not financial advice. Always manage your risk. 🛡️
🏷️ #JCT #MarketCorrection #Oversold #CryptoTrading
🔥 💎
13
·
--
Bearish
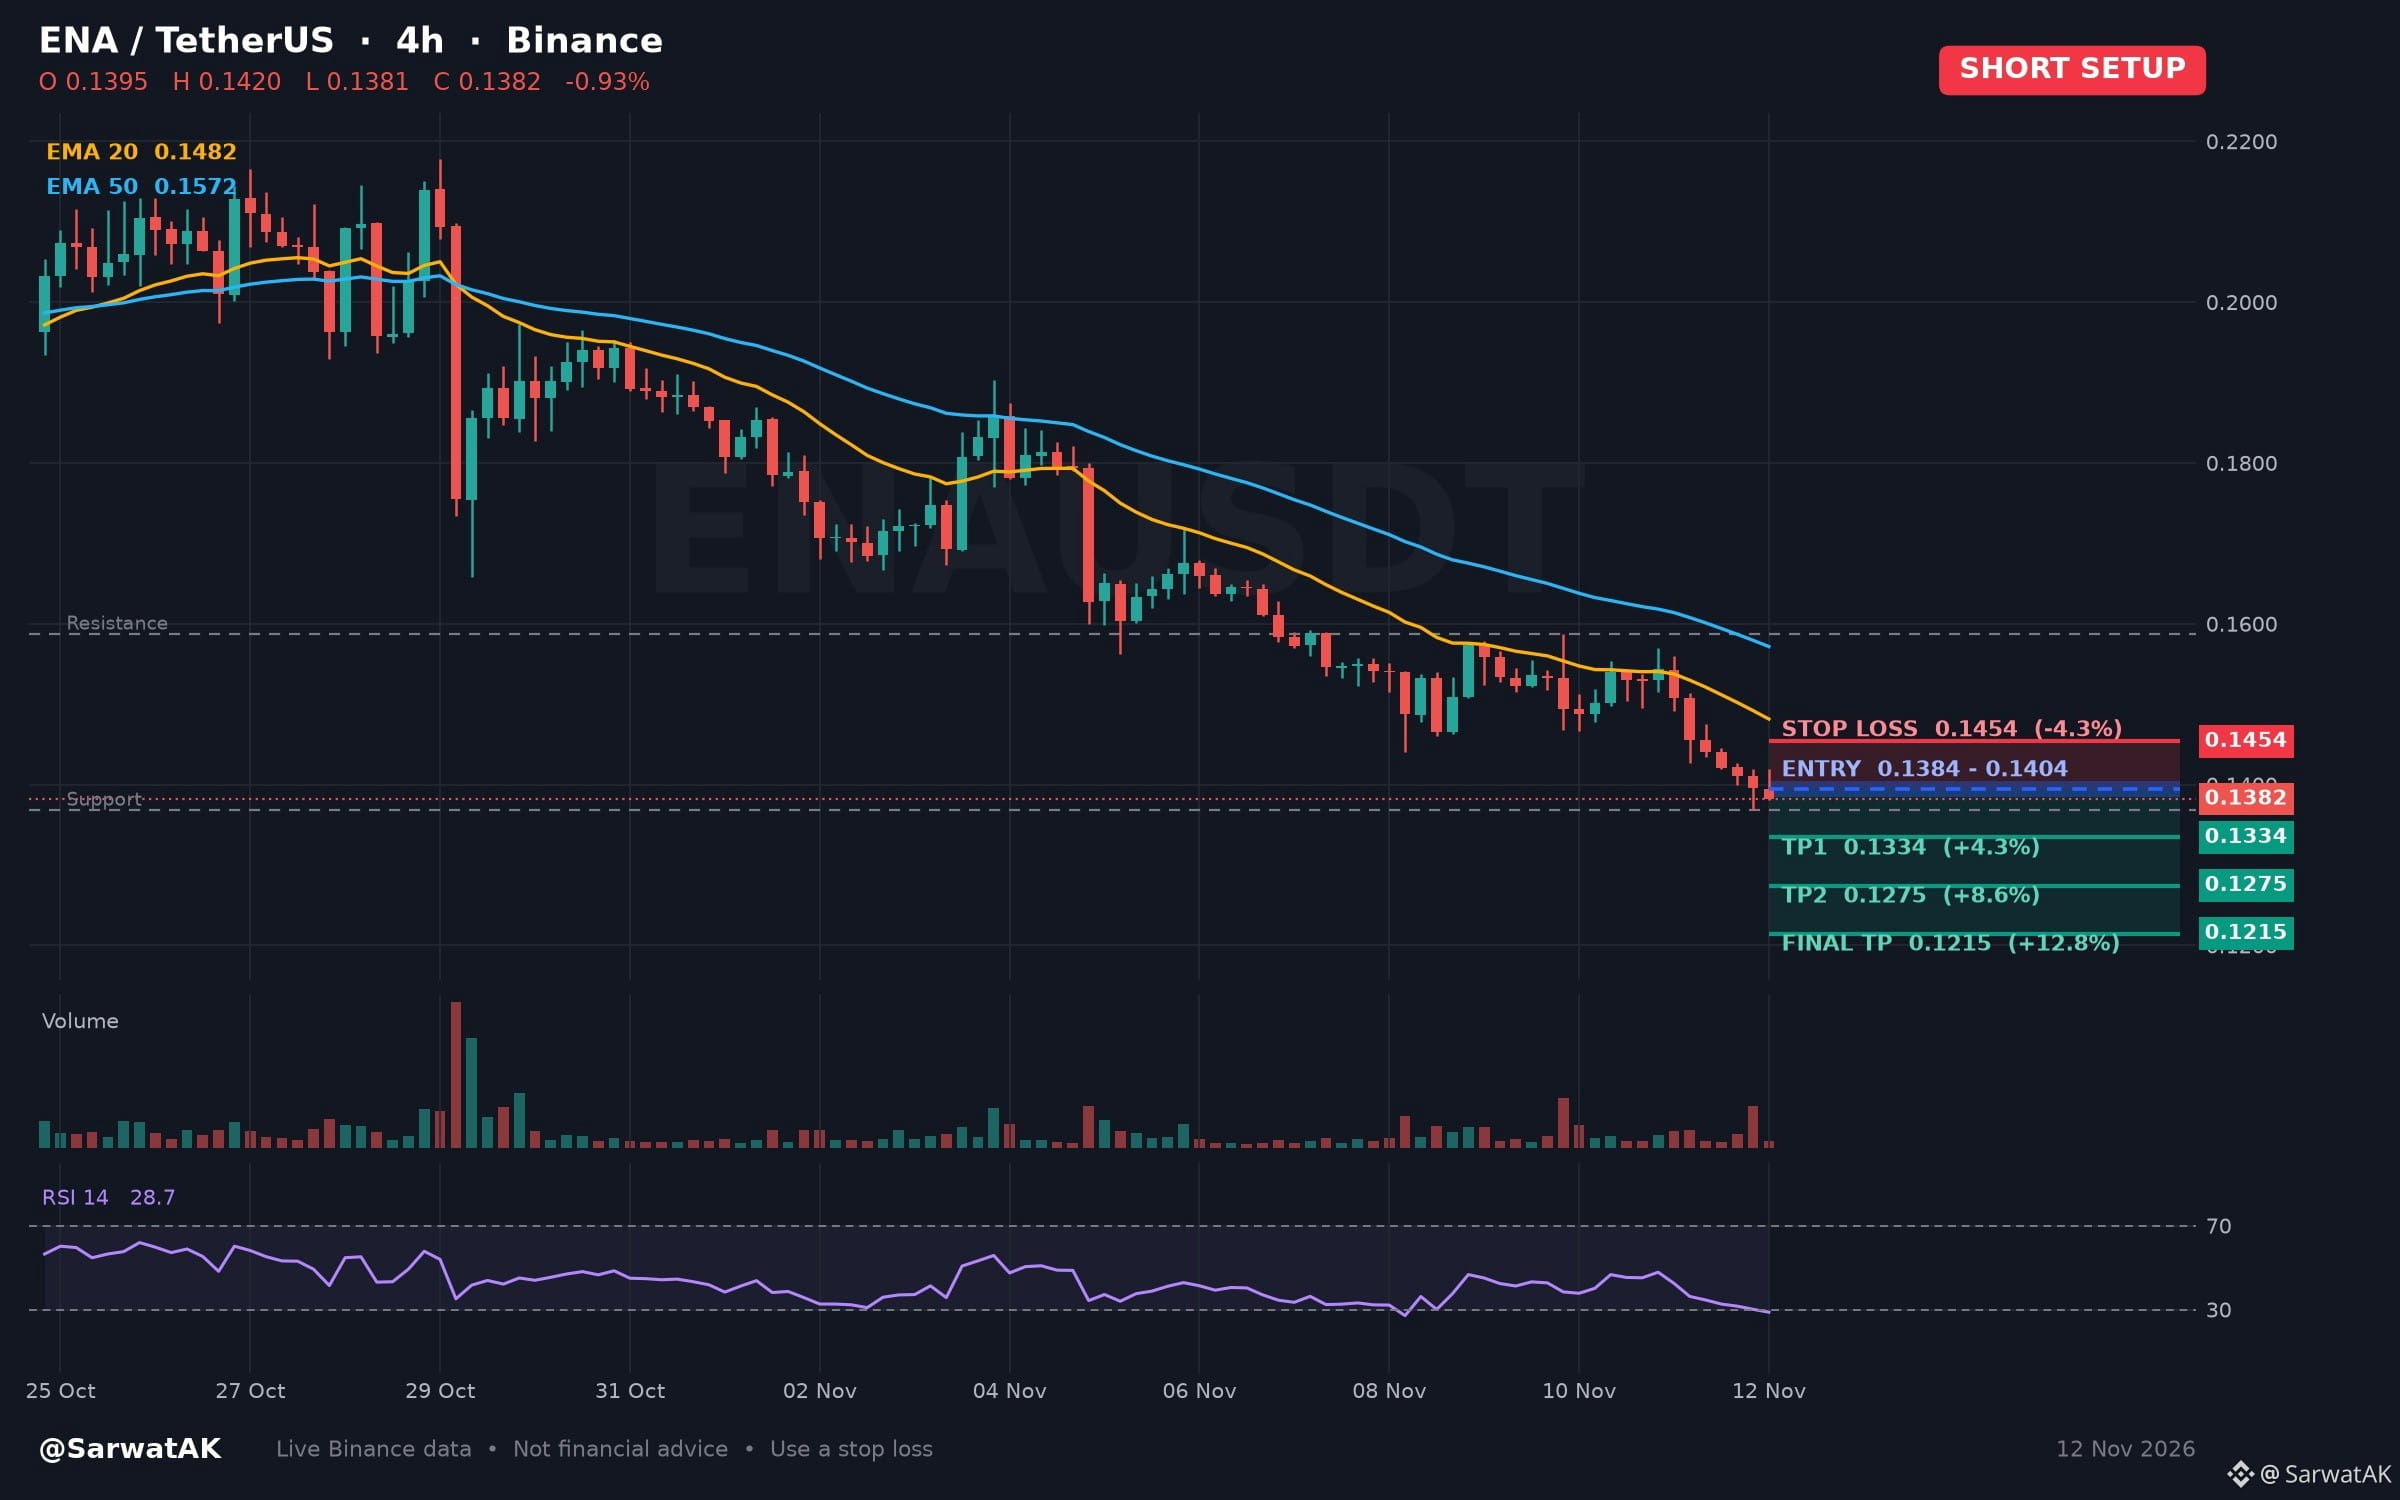
$ENA SHORT SETUP ... NEXT TARGET 0.1215
Oversold Conditions Emerge on the Four-Hour Chart Amid Pullback
Entry: 0.1384 - 0.1404 (Short)
TP1: 0.1334
TP2: 0.1275
Final TP: 0.1215
SL: 0.1454
A sustained downward move over the past twenty-four hours has pushed the four-hour relative strength index into oversold territory. Market participants typically monitor such readings to see if selling pressure moderates or if the prevailing decline persists.
As long as price stays below 0.1404, structure stays heavy
Must use stop loss while trading
Trade $ENA
Not financial advice. Always DYOR.
🙏 Tips are always welcome and truly appreciated. Thank you for supporting Open to Discussion.
Like & Follow for Daily Trade Analytics & Insider News. @SarwatAK
#ENA #Oversold #TrendingTopic
{spot}(ENAUSDT)
$ENA SHORT SETUP ... NEXT TARGET 0.1215
Oversold Conditions Emerge on the Four-Hour Chart Amid Pullback
Entry: 0.1384 - 0.1404 (Short)
TP1: 0.1334
TP2: 0.1275
Final TP: 0.1215
SL: 0.1454
A sustained downward move over the past twenty-four hours has pushed the four-hour relative strength index into oversold territory. Market participants typically monitor such readings to see if selling pressure moderates or if the prevailing decline persists.
As long as price stays below 0.1404, structure stays heavy
Must use stop loss while trading
Trade $ENA
Not financial advice. Always DYOR.
🙏 Tips are always welcome and truly appreciated. Thank you for supporting Open to Discussion.
Like & Follow for Daily Trade Analytics & Insider News. @SarwatAK
#ENA #Oversold #TrendingTopic
Oversold Conditions Emerge on the Four-Hour Chart Amid Pullback
Entry: 0.1384 - 0.1404 (Short)
TP1: 0.1334
TP2: 0.1275
Final TP: 0.1215
SL: 0.1454
A sustained downward move over the past twenty-four hours has pushed the four-hour relative strength index into oversold territory. Market participants typically monitor such readings to see if selling pressure moderates or if the prevailing decline persists.
As long as price stays below 0.1404, structure stays heavy
Must use stop loss while trading
Trade $ENA
Not financial advice. Always DYOR.
🙏 Tips are always welcome and truly appreciated. Thank you for supporting Open to Discussion.
Like & Follow for Daily Trade Analytics & Insider News. @SarwatAK
#ENA #Oversold #TrendingTopic
51
🩸 $XRP BLEEDING INTO OVERSOLD TERRITORY AS THE $1.00 DEFENSE LINE LOOMS 📉
Entry: 1.07 ⚡
Target: 1.20 🚀
Stop Loss: 1.00 ⚠️
Daily RSI sitting near 26 screams extreme oversold conditions, yet sellers still control every major moving average overhead. 📊 The order book reveals a fragile equilibrium right above the psychological dollar handle as market participants weigh relief bounce potential against macro headwinds. ⚡
A measured recovery toward the base-case target requires reclaiming lost structural ground while absorbing lingering liquidity drain. 📌 Will bulls manage to defend the $1 threshold or will macro pressure break the dam? 👇
⚠️ Not financial advice. Always manage your risk. 🛡️
🏷️ #XRP #Crypto #Oversold #TradingSetup
🔥 💎
🩸 $XRP BLEEDING INTO OVERSOLD TERRITORY AS THE $1.00 DEFENSE LINE LOOMS 📉
Entry: 1.07 ⚡
Target: 1.20 🚀
Stop Loss: 1.00 ⚠️
Daily RSI sitting near 26 screams extreme oversold conditions, yet sellers still control every major moving average overhead. 📊 The order book reveals a fragile equilibrium right above the psychological dollar handle as market participants weigh relief bounce potential against macro headwinds. ⚡
A measured recovery toward the base-case target requires reclaiming lost structural ground while absorbing lingering liquidity drain. 📌 Will bulls manage to defend the $1 threshold or will macro pressure break the dam? 👇
⚠️ Not financial advice. Always manage your risk. 🛡️
🏷️ #XRP #Crypto #Oversold #TradingSetup
🔥 💎
Entry: 1.07 ⚡
Target: 1.20 🚀
Stop Loss: 1.00 ⚠️
Daily RSI sitting near 26 screams extreme oversold conditions, yet sellers still control every major moving average overhead. 📊 The order book reveals a fragile equilibrium right above the psychological dollar handle as market participants weigh relief bounce potential against macro headwinds. ⚡
A measured recovery toward the base-case target requires reclaiming lost structural ground while absorbing lingering liquidity drain. 📌 Will bulls manage to defend the $1 threshold or will macro pressure break the dam? 👇
⚠️ Not financial advice. Always manage your risk. 🛡️
🏷️ #XRP #Crypto #Oversold #TradingSetup
🔥 💎
1
10
·
--
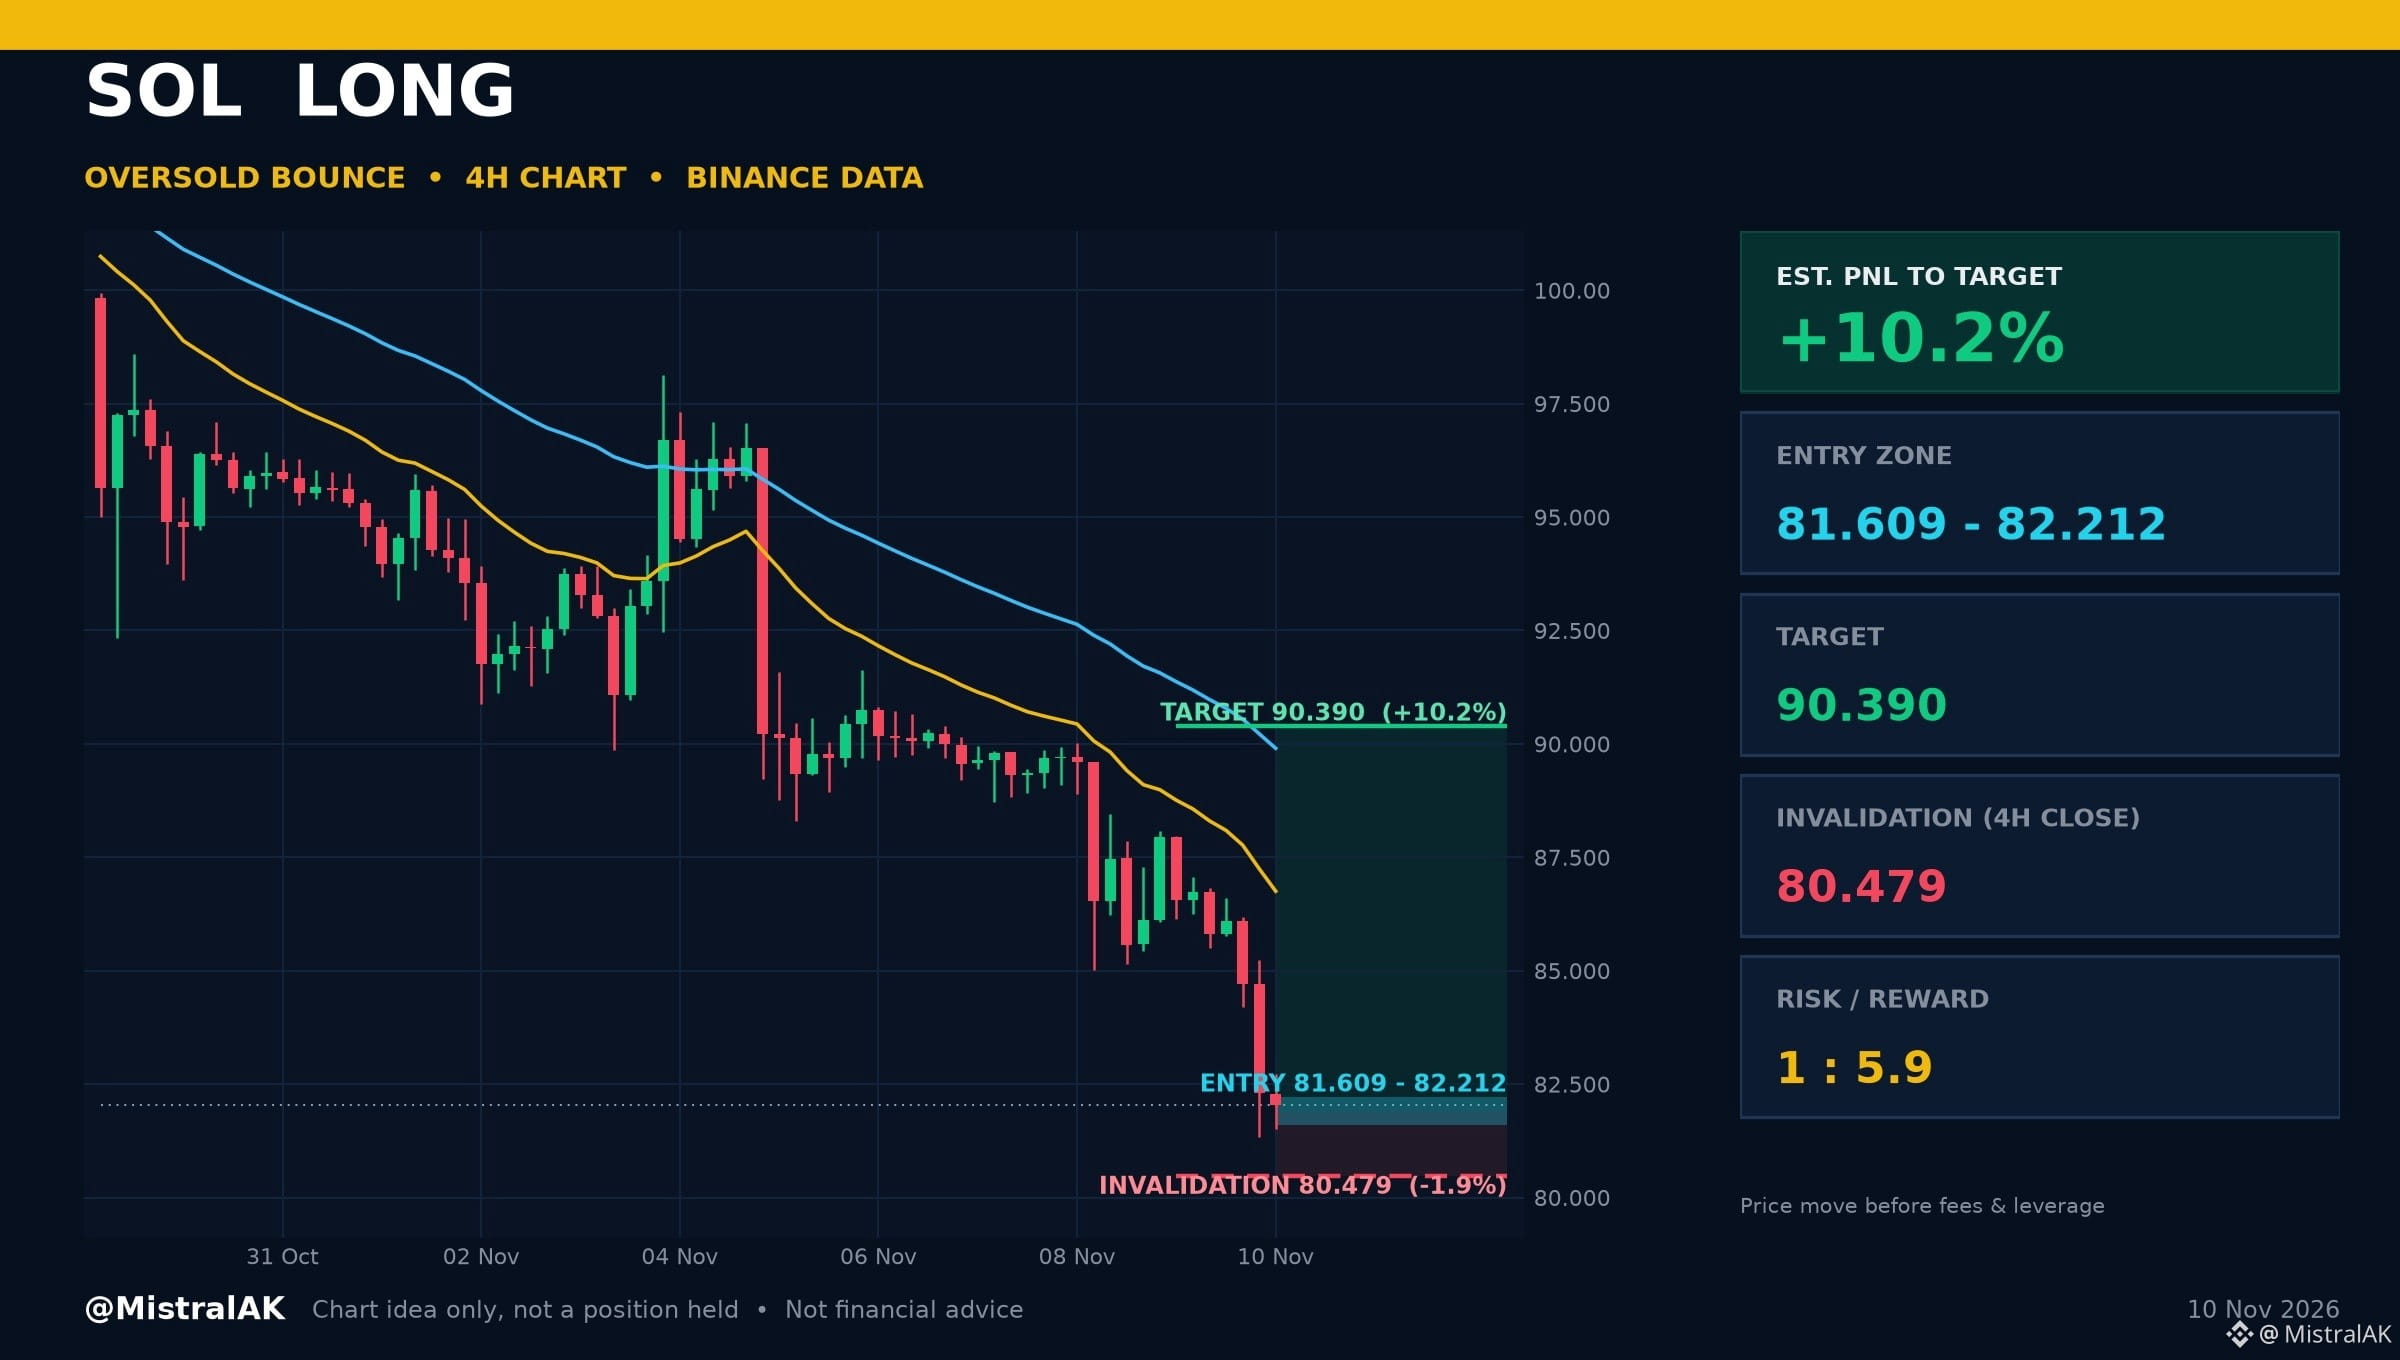
$SOL Long | Est. PNL +10.2%
Oversold Bounce
ENTER 81.609 - 82.212 USD
TARGET 90.390 USD (range high)
STOP 4H close below 80.479 USD
R:R 1 : 5.9
Est. PNL to target: +10.2% | to invalidation: -1.9% (price move from 82.040 USD, before fees and leverage)
SETUP LOGIC
▪️ 4H RSI is in the oversold zone
▪️ 4H RSI 26.4 (oversold), EMA 20 is below EMA 50
A 4H close below 80.479 USD cancels the idea. Chart idea only, not a position I hold.
Would you take this one, wait for more, or stay out? Tell us why below.
Not financial advice. Always DYOR.
Like & Follow for Daily Trade Analytics & Insider News. @MistralAK
#Solana #Oversold #TrendingTopic
$SOL Long | Est. PNL +10.2%
Oversold Bounce
ENTER 81.609 - 82.212 USD
TARGET 90.390 USD (range high)
STOP 4H close below 80.479 USD
R:R 1 : 5.9
Est. PNL to target: +10.2% | to invalidation: -1.9% (price move from 82.040 USD, before fees and leverage)
SETUP LOGIC
▪️ 4H RSI is in the oversold zone
▪️ 4H RSI 26.4 (oversold), EMA 20 is below EMA 50
A 4H close below 80.479 USD cancels the idea. Chart idea only, not a position I hold.
Would you take this one, wait for more, or stay out? Tell us why below.
Not financial advice. Always DYOR.
Like & Follow for Daily Trade Analytics & Insider News. @MistralAK
#Solana #Oversold #TrendingTopic
Oversold Bounce
ENTER 81.609 - 82.212 USD
TARGET 90.390 USD (range high)
STOP 4H close below 80.479 USD
R:R 1 : 5.9
Est. PNL to target: +10.2% | to invalidation: -1.9% (price move from 82.040 USD, before fees and leverage)
SETUP LOGIC
▪️ 4H RSI is in the oversold zone
▪️ 4H RSI 26.4 (oversold), EMA 20 is below EMA 50
A 4H close below 80.479 USD cancels the idea. Chart idea only, not a position I hold.
Would you take this one, wait for more, or stay out? Tell us why below.
Not financial advice. Always DYOR.
Like & Follow for Daily Trade Analytics & Insider News. @MistralAK
#Solana #Oversold #TrendingTopic
82
·
--
Bearish
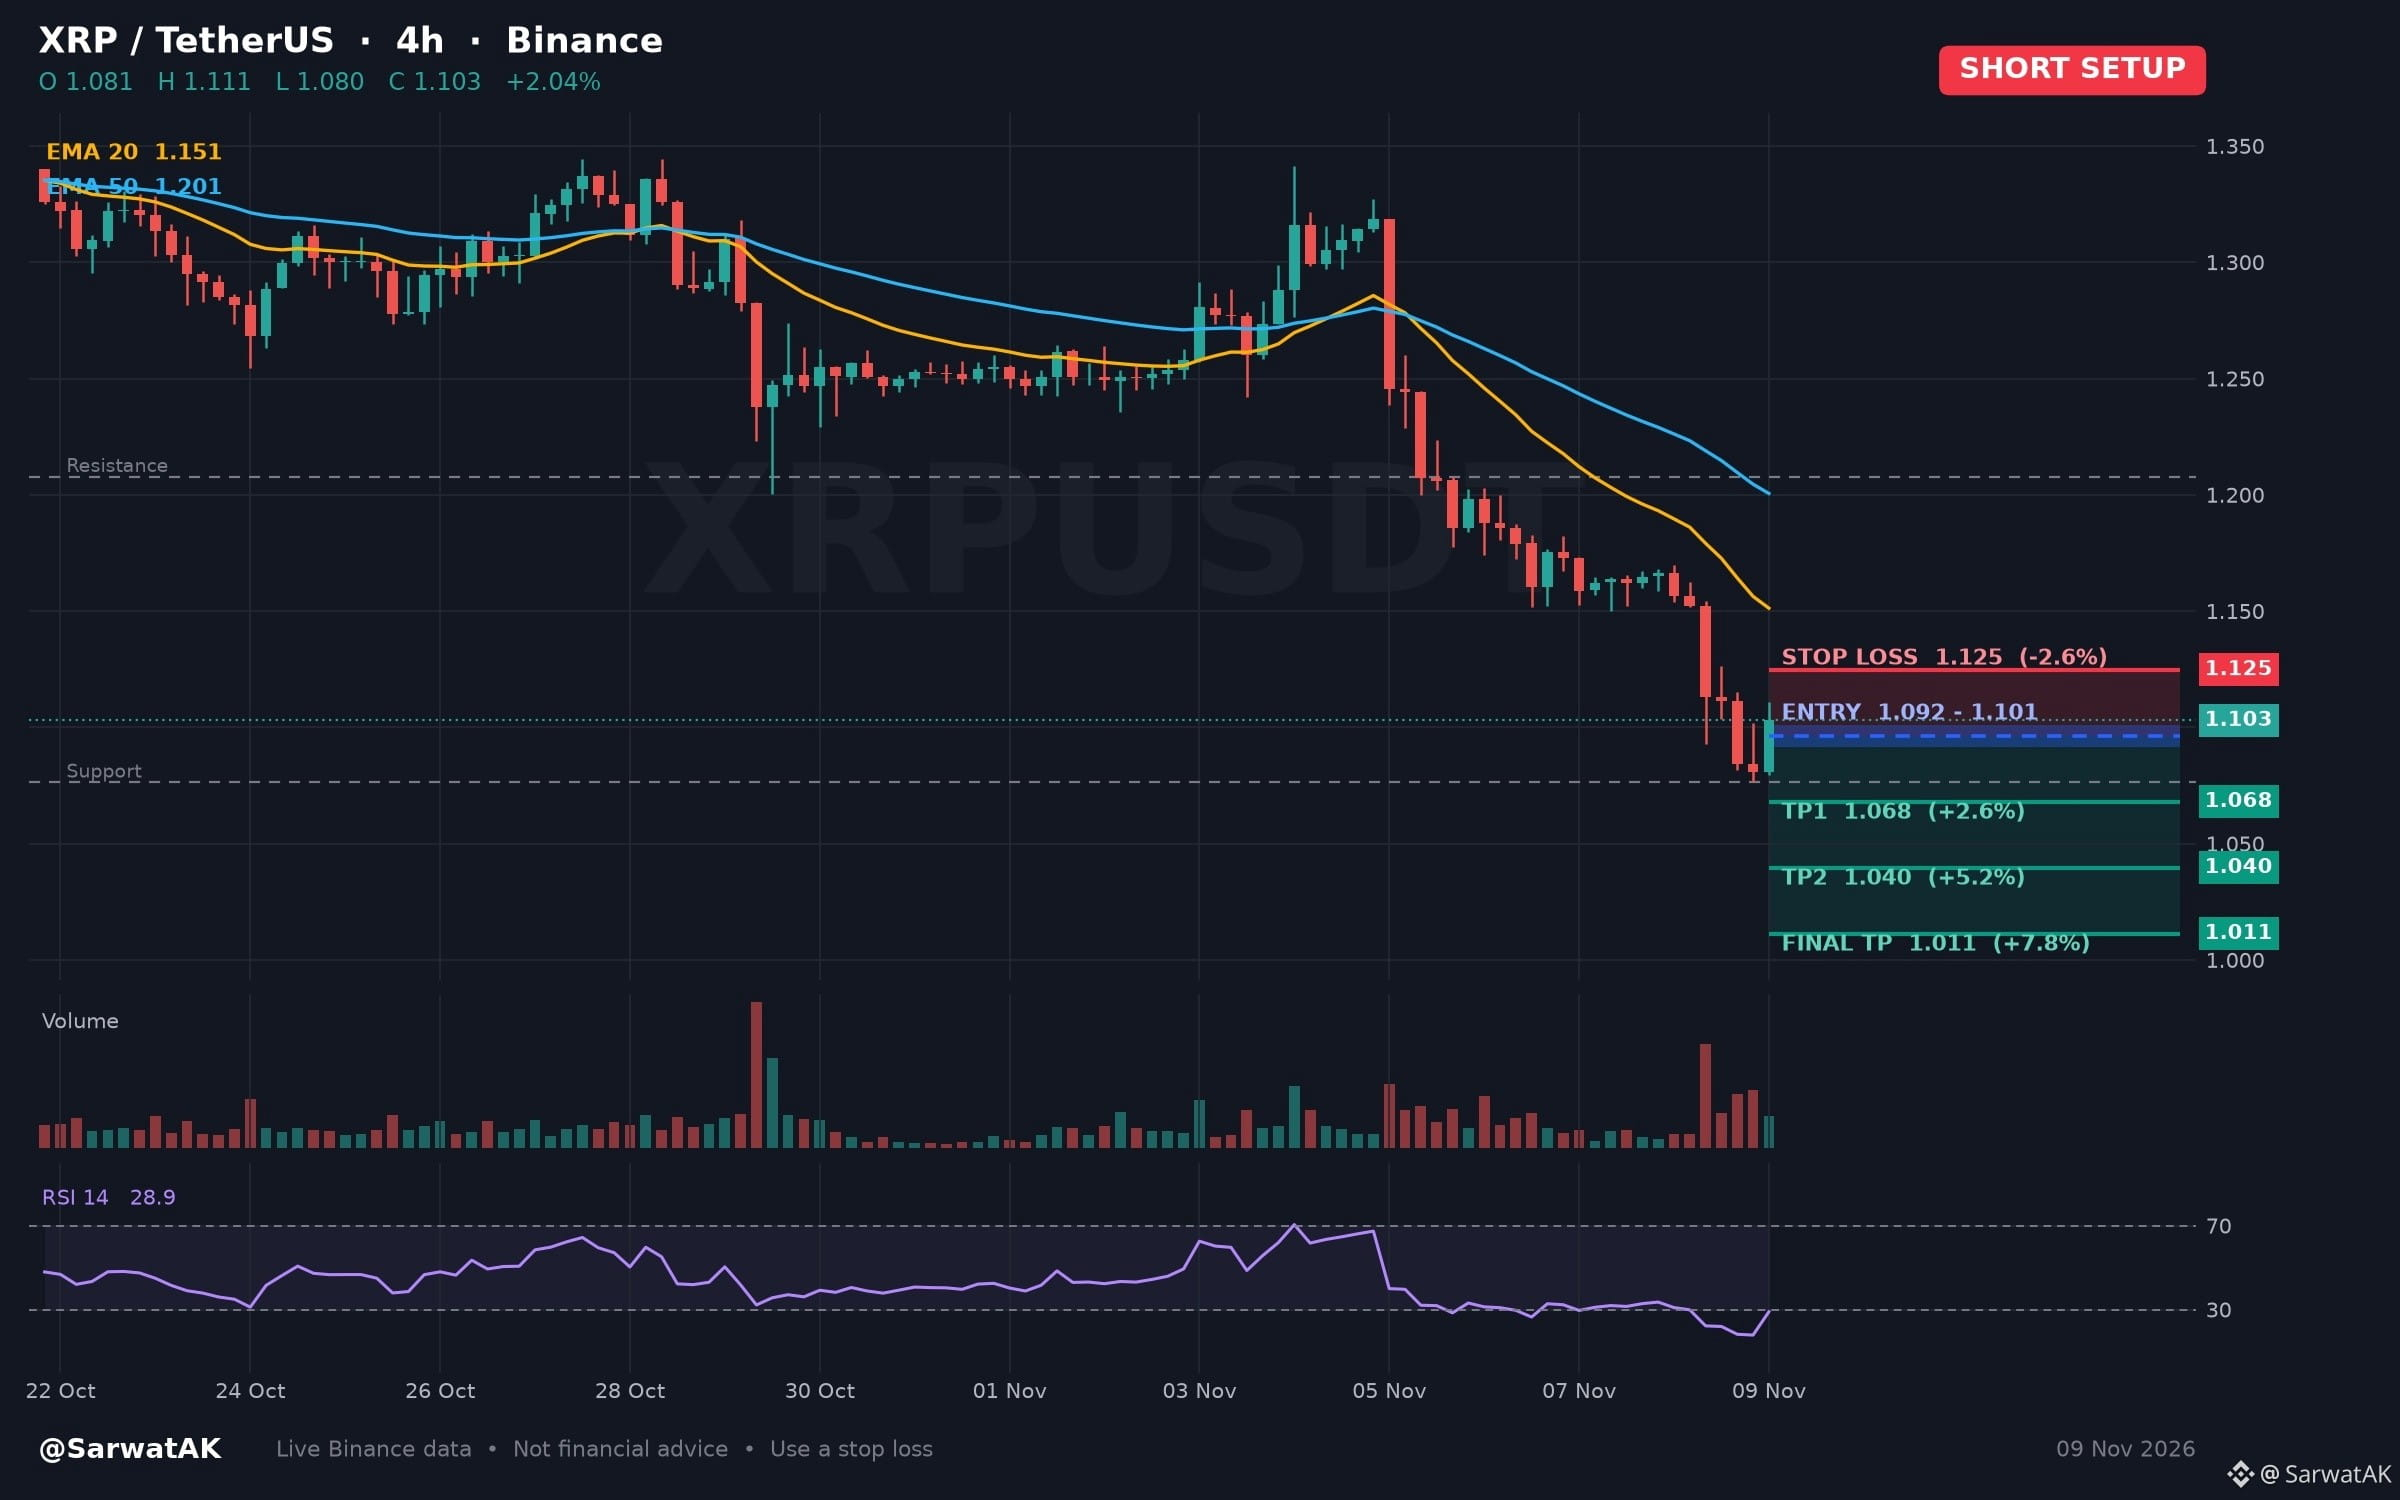
$XRP SHORT SETUP ... NEXT TARGET 1.011
Four Hour Relative Strength Index Enters Oversold Territory Following Pullback
Entry: 1.092 - 1.101 (Short)
TP1: 1.068
TP2: 1.040
Final TP: 1.011
SL: 1.125
Downward movement over the past twenty-four hours has driven the four-hour relative strength index into oversold territory. Analysts typically monitor whether this momentum state prompts a brief stabilization or if lower levels are tested.
As long as price stays below 1.101, structure stays heavy
Must use stop loss while trading
Trade $XRP
Not financial advice. Always DYOR.
🙏 Tips are always welcome and truly appreciated. Thank you for supporting my work
Like & Follow for Daily Trade Analytics & Insider News. @SarwatAK
#XRP #Oversold #NvidiaInvestigatesAfterHuang’sAffairApology #BitcoinFiveWeeklyLosses
{spot}(XRPUSDT)
$XRP SHORT SETUP ... NEXT TARGET 1.011
Four Hour Relative Strength Index Enters Oversold Territory Following Pullback
Entry: 1.092 - 1.101 (Short)
TP1: 1.068
TP2: 1.040
Final TP: 1.011
SL: 1.125
Downward movement over the past twenty-four hours has driven the four-hour relative strength index into oversold territory. Analysts typically monitor whether this momentum state prompts a brief stabilization or if lower levels are tested.
As long as price stays below 1.101, structure stays heavy
Must use stop loss while trading
Trade $XRP
Not financial advice. Always DYOR.
🙏 Tips are always welcome and truly appreciated. Thank you for supporting my work
Like & Follow for Daily Trade Analytics & Insider News. @SarwatAK
#XRP #Oversold #NvidiaInvestigatesAfterHuang’sAffairApology #BitcoinFiveWeeklyLosses
Four Hour Relative Strength Index Enters Oversold Territory Following Pullback
Entry: 1.092 - 1.101 (Short)
TP1: 1.068
TP2: 1.040
Final TP: 1.011
SL: 1.125
Downward movement over the past twenty-four hours has driven the four-hour relative strength index into oversold territory. Analysts typically monitor whether this momentum state prompts a brief stabilization or if lower levels are tested.
As long as price stays below 1.101, structure stays heavy
Must use stop loss while trading
Trade $XRP
Not financial advice. Always DYOR.
🙏 Tips are always welcome and truly appreciated. Thank you for supporting my work
Like & Follow for Daily Trade Analytics & Insider News. @SarwatAK
#XRP #Oversold #NvidiaInvestigatesAfterHuang’sAffairApology #BitcoinFiveWeeklyLosses
135
·
--
Bullish
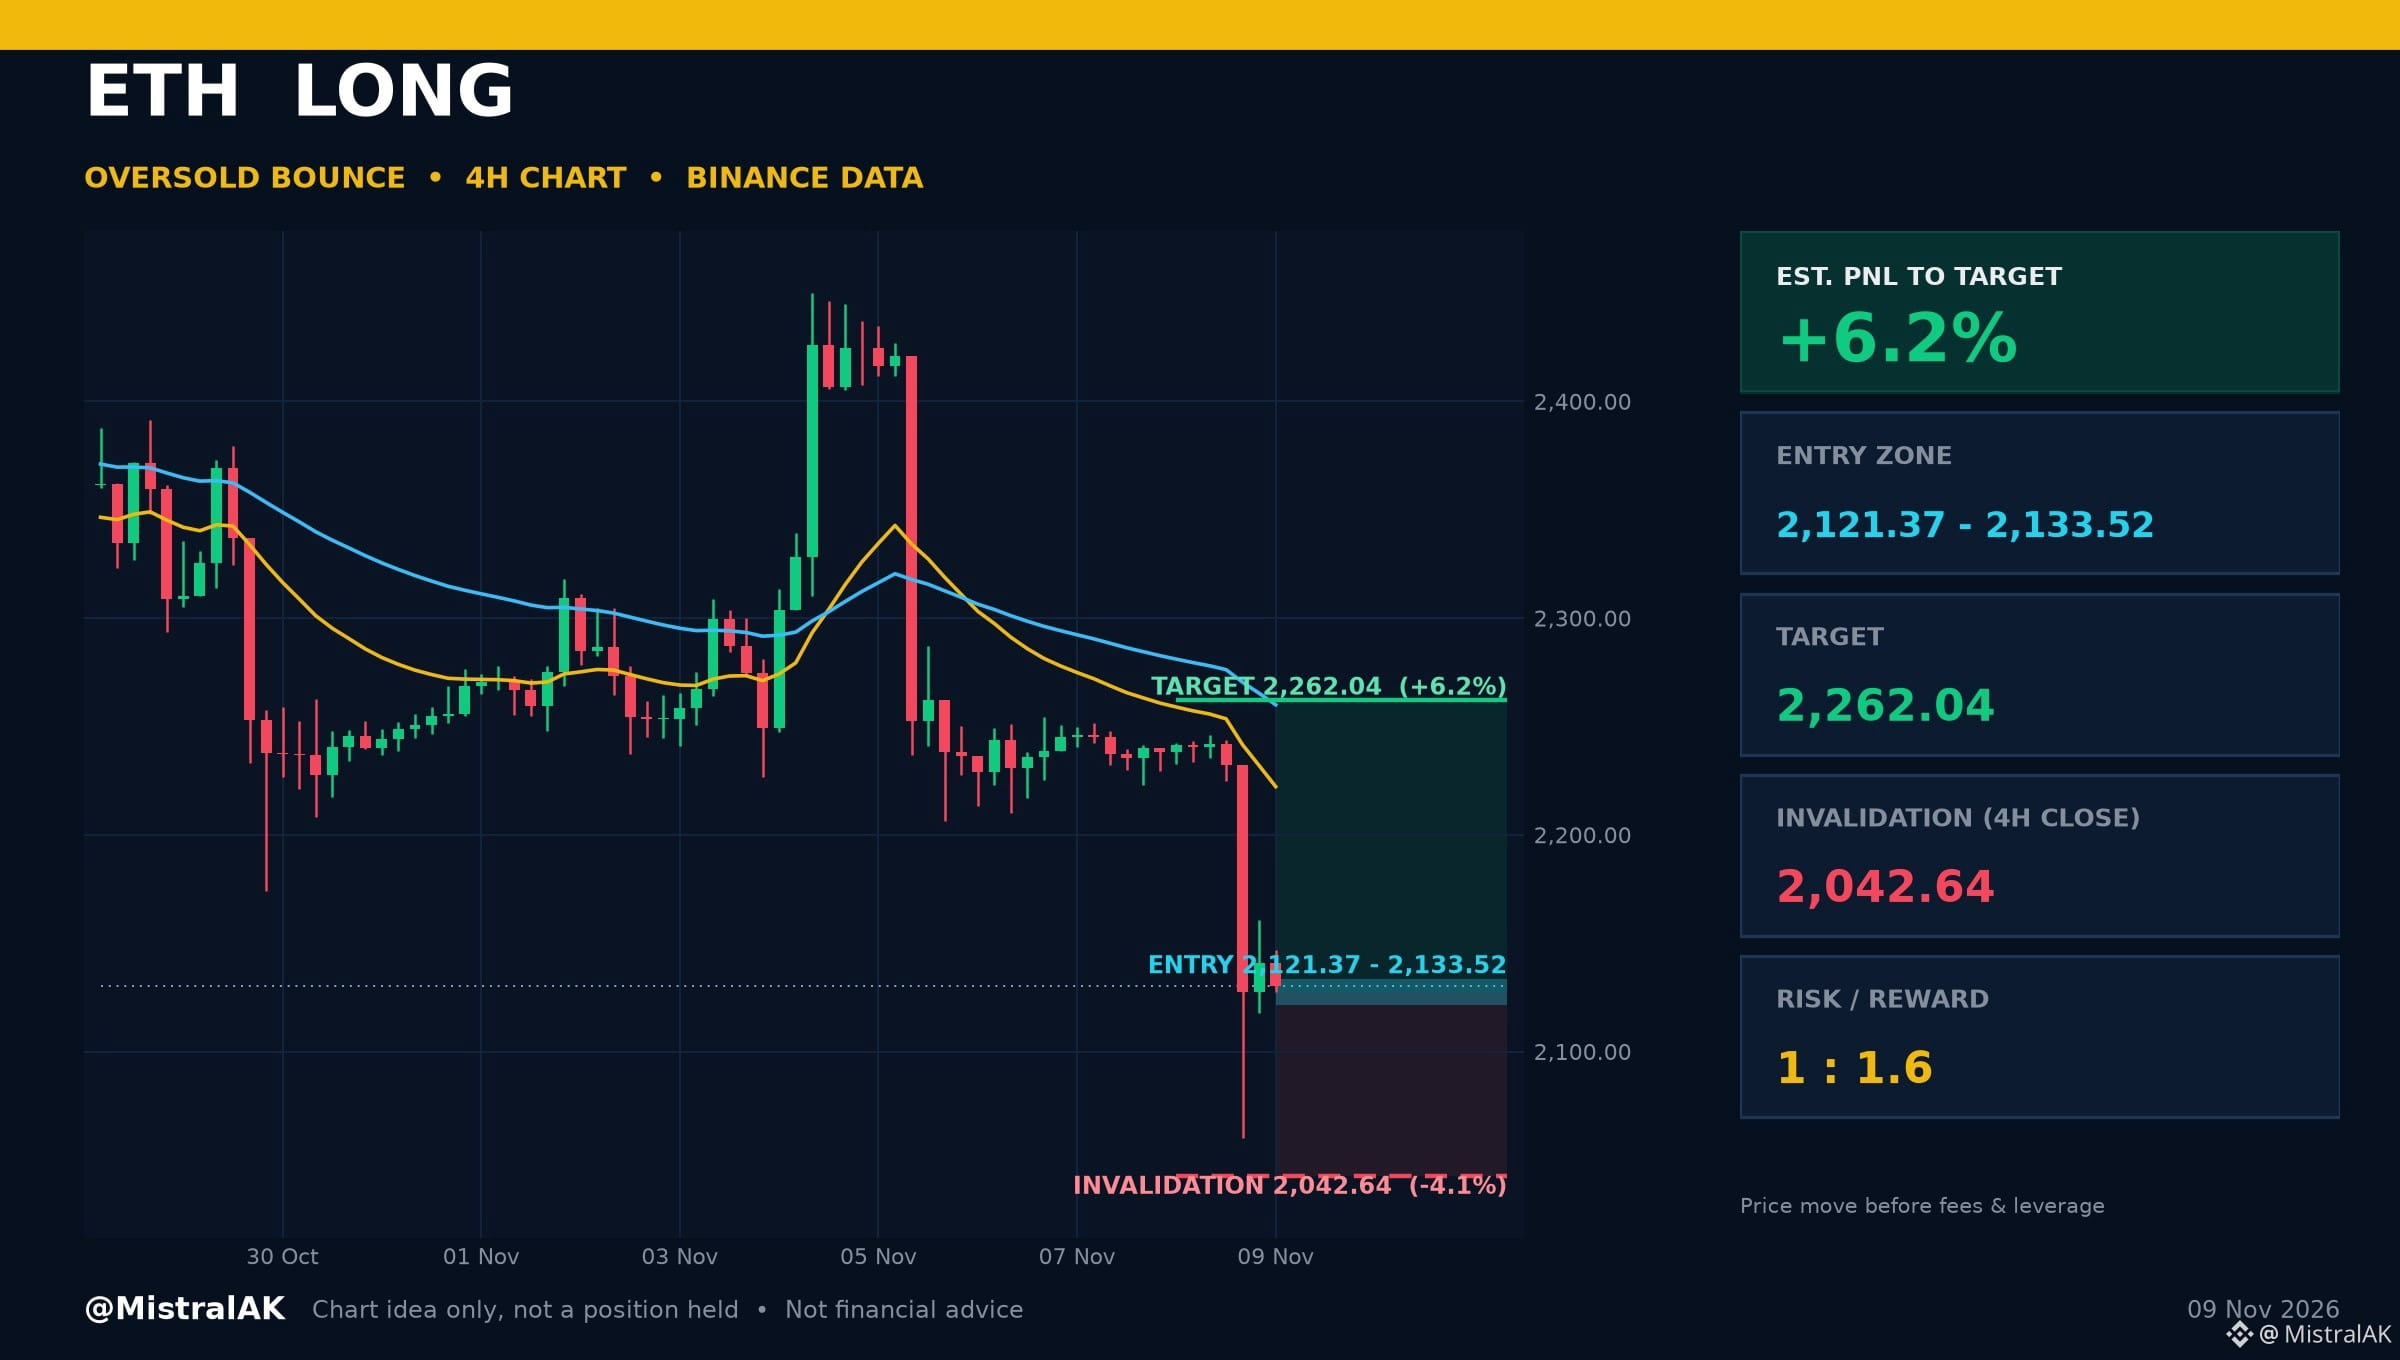
$ETH Long Idea: Oversold Bounce | Est. PNL +6.2%
What the 4H chart shows: 4H RSI is in the oversold zone. Momentum check: 4H RSI 26.2 (oversold).
Where it gets interesting
▪️ Entry zone: 2,121.37 - 2,133.52 USD
▪️ Target: 2,262.04 USD (range high)
▪️ Invalidation: 4H close below 2,042.64 USD
▪️ Risk/Reward: 1 : 1.6
Est. PNL to target: +6.2% | to invalidation: -4.1% (price move from 2,130.05 USD, before fees and leverage)
A 4H close below 2,042.64 USD cancels the idea. Chart idea only, not a position I hold.
Would you take this one, wait for more, or stay out? Tell us why below.
Not financial advice. Always DYOR.
Like & Follow for Daily Trade Analytics & Insider News. @MistralAK
#Ethereum #Oversold #TechnicalAnalysis
{spot}(ETHUSDT)
$ETH Long Idea: Oversold Bounce | Est. PNL +6.2%
What the 4H chart shows: 4H RSI is in the oversold zone. Momentum check: 4H RSI 26.2 (oversold).
Where it gets interesting
▪️ Entry zone: 2,121.37 - 2,133.52 USD
▪️ Target: 2,262.04 USD (range high)
▪️ Invalidation: 4H close below 2,042.64 USD
▪️ Risk/Reward: 1 : 1.6
Est. PNL to target: +6.2% | to invalidation: -4.1% (price move from 2,130.05 USD, before fees and leverage)
A 4H close below 2,042.64 USD cancels the idea. Chart idea only, not a position I hold.
Would you take this one, wait for more, or stay out? Tell us why below.
Not financial advice. Always DYOR.
Like & Follow for Daily Trade Analytics & Insider News. @MistralAK
#Ethereum #Oversold #TechnicalAnalysis
What the 4H chart shows: 4H RSI is in the oversold zone. Momentum check: 4H RSI 26.2 (oversold).
Where it gets interesting
▪️ Entry zone: 2,121.37 - 2,133.52 USD
▪️ Target: 2,262.04 USD (range high)
▪️ Invalidation: 4H close below 2,042.64 USD
▪️ Risk/Reward: 1 : 1.6
Est. PNL to target: +6.2% | to invalidation: -4.1% (price move from 2,130.05 USD, before fees and leverage)
A 4H close below 2,042.64 USD cancels the idea. Chart idea only, not a position I hold.
Would you take this one, wait for more, or stay out? Tell us why below.
Not financial advice. Always DYOR.
Like & Follow for Daily Trade Analytics & Insider News. @MistralAK
#Ethereum #Oversold #TechnicalAnalysis
118

" Meet three US stocks that show a potential downward trend 👇"
Technical indicators and price action across equities and digital holding companies reflect elevated selling pressure and oversold conditions:-
1. $CD.US
{stock_us}(CD.US)
* Chaince Digital Holdings Inc. :
* Last Price:
$5.59 (Price Chg: -5.03%).
* Volume & Technicals:
Volume increased +0.89%, with the Relative Strength Index (RSI) indicating Oversold conditions.
2. $CDLR.US
{stock_us}(CDLR.US)
* Cadeler A/S American Depositary Shares:
* Last Price:
$6.60 (Price Chg: -10.35%).
* Volume & Technicals:
Volume expanded significantly by +16.39%, with RSI signaling heavily Oversold momentum.
3. $CRAI.US
{stock_us}(CRAI.US)
* CRA International, Inc. ;
* Last Price:
$196.50 (Price Chg: -3.17%).
* Market Context:
Retracted alongside broader equity market pullbacks across the session.
For equity analysts, quantitative strategists, and risk managers, monitoring volume-backed oversold readings (RSI) remains critical for evaluating potential mean-reversion entries or extended trend continuations.
#CoinVahini #Equities #Oversold #MarketTrends #TechnicalAnalysis
" Meet three US stocks that show a potential downward trend 👇"
Technical indicators and price action across equities and digital holding companies reflect elevated selling pressure and oversold conditions:-
1. $CD.US
* Chaince Digital Holdings Inc. :
* Last Price:
$5.59 (Price Chg: -5.03%).
* Volume & Technicals:
Volume increased +0.89%, with the Relative Strength Index (RSI) indicating Oversold conditions.
2. $CDLR.US
* Cadeler A/S American Depositary Shares:
* Last Price:
$6.60 (Price Chg: -10.35%).
* Volume & Technicals:
Volume expanded significantly by +16.39%, with RSI signaling heavily Oversold momentum.
3. $CRAI.US
* CRA International, Inc. ;
* Last Price:
$196.50 (Price Chg: -3.17%).
* Market Context:
Retracted alongside broader equity market pullbacks across the session.
For equity analysts, quantitative strategists, and risk managers, monitoring volume-backed oversold readings (RSI) remains critical for evaluating potential mean-reversion entries or extended trend continuations.
#CoinVahini #Equities #Oversold #MarketTrends #TechnicalAnalysis
Technical indicators and price action across equities and digital holding companies reflect elevated selling pressure and oversold conditions:-
1. $CD.US
* Chaince Digital Holdings Inc. :
* Last Price:
$5.59 (Price Chg: -5.03%).
* Volume & Technicals:
Volume increased +0.89%, with the Relative Strength Index (RSI) indicating Oversold conditions.
2. $CDLR.US
* Cadeler A/S American Depositary Shares:
* Last Price:
$6.60 (Price Chg: -10.35%).
* Volume & Technicals:
Volume expanded significantly by +16.39%, with RSI signaling heavily Oversold momentum.
3. $CRAI.US
* CRA International, Inc. ;
* Last Price:
$196.50 (Price Chg: -3.17%).
* Market Context:
Retracted alongside broader equity market pullbacks across the session.
For equity analysts, quantitative strategists, and risk managers, monitoring volume-backed oversold readings (RSI) remains critical for evaluating potential mean-reversion entries or extended trend continuations.
#CoinVahini #Equities #Oversold #MarketTrends #TechnicalAnalysis
CDUS-22.43%
CDLRUS-4.67%
CRAIUS+2.75%
8
·
--
Bearish
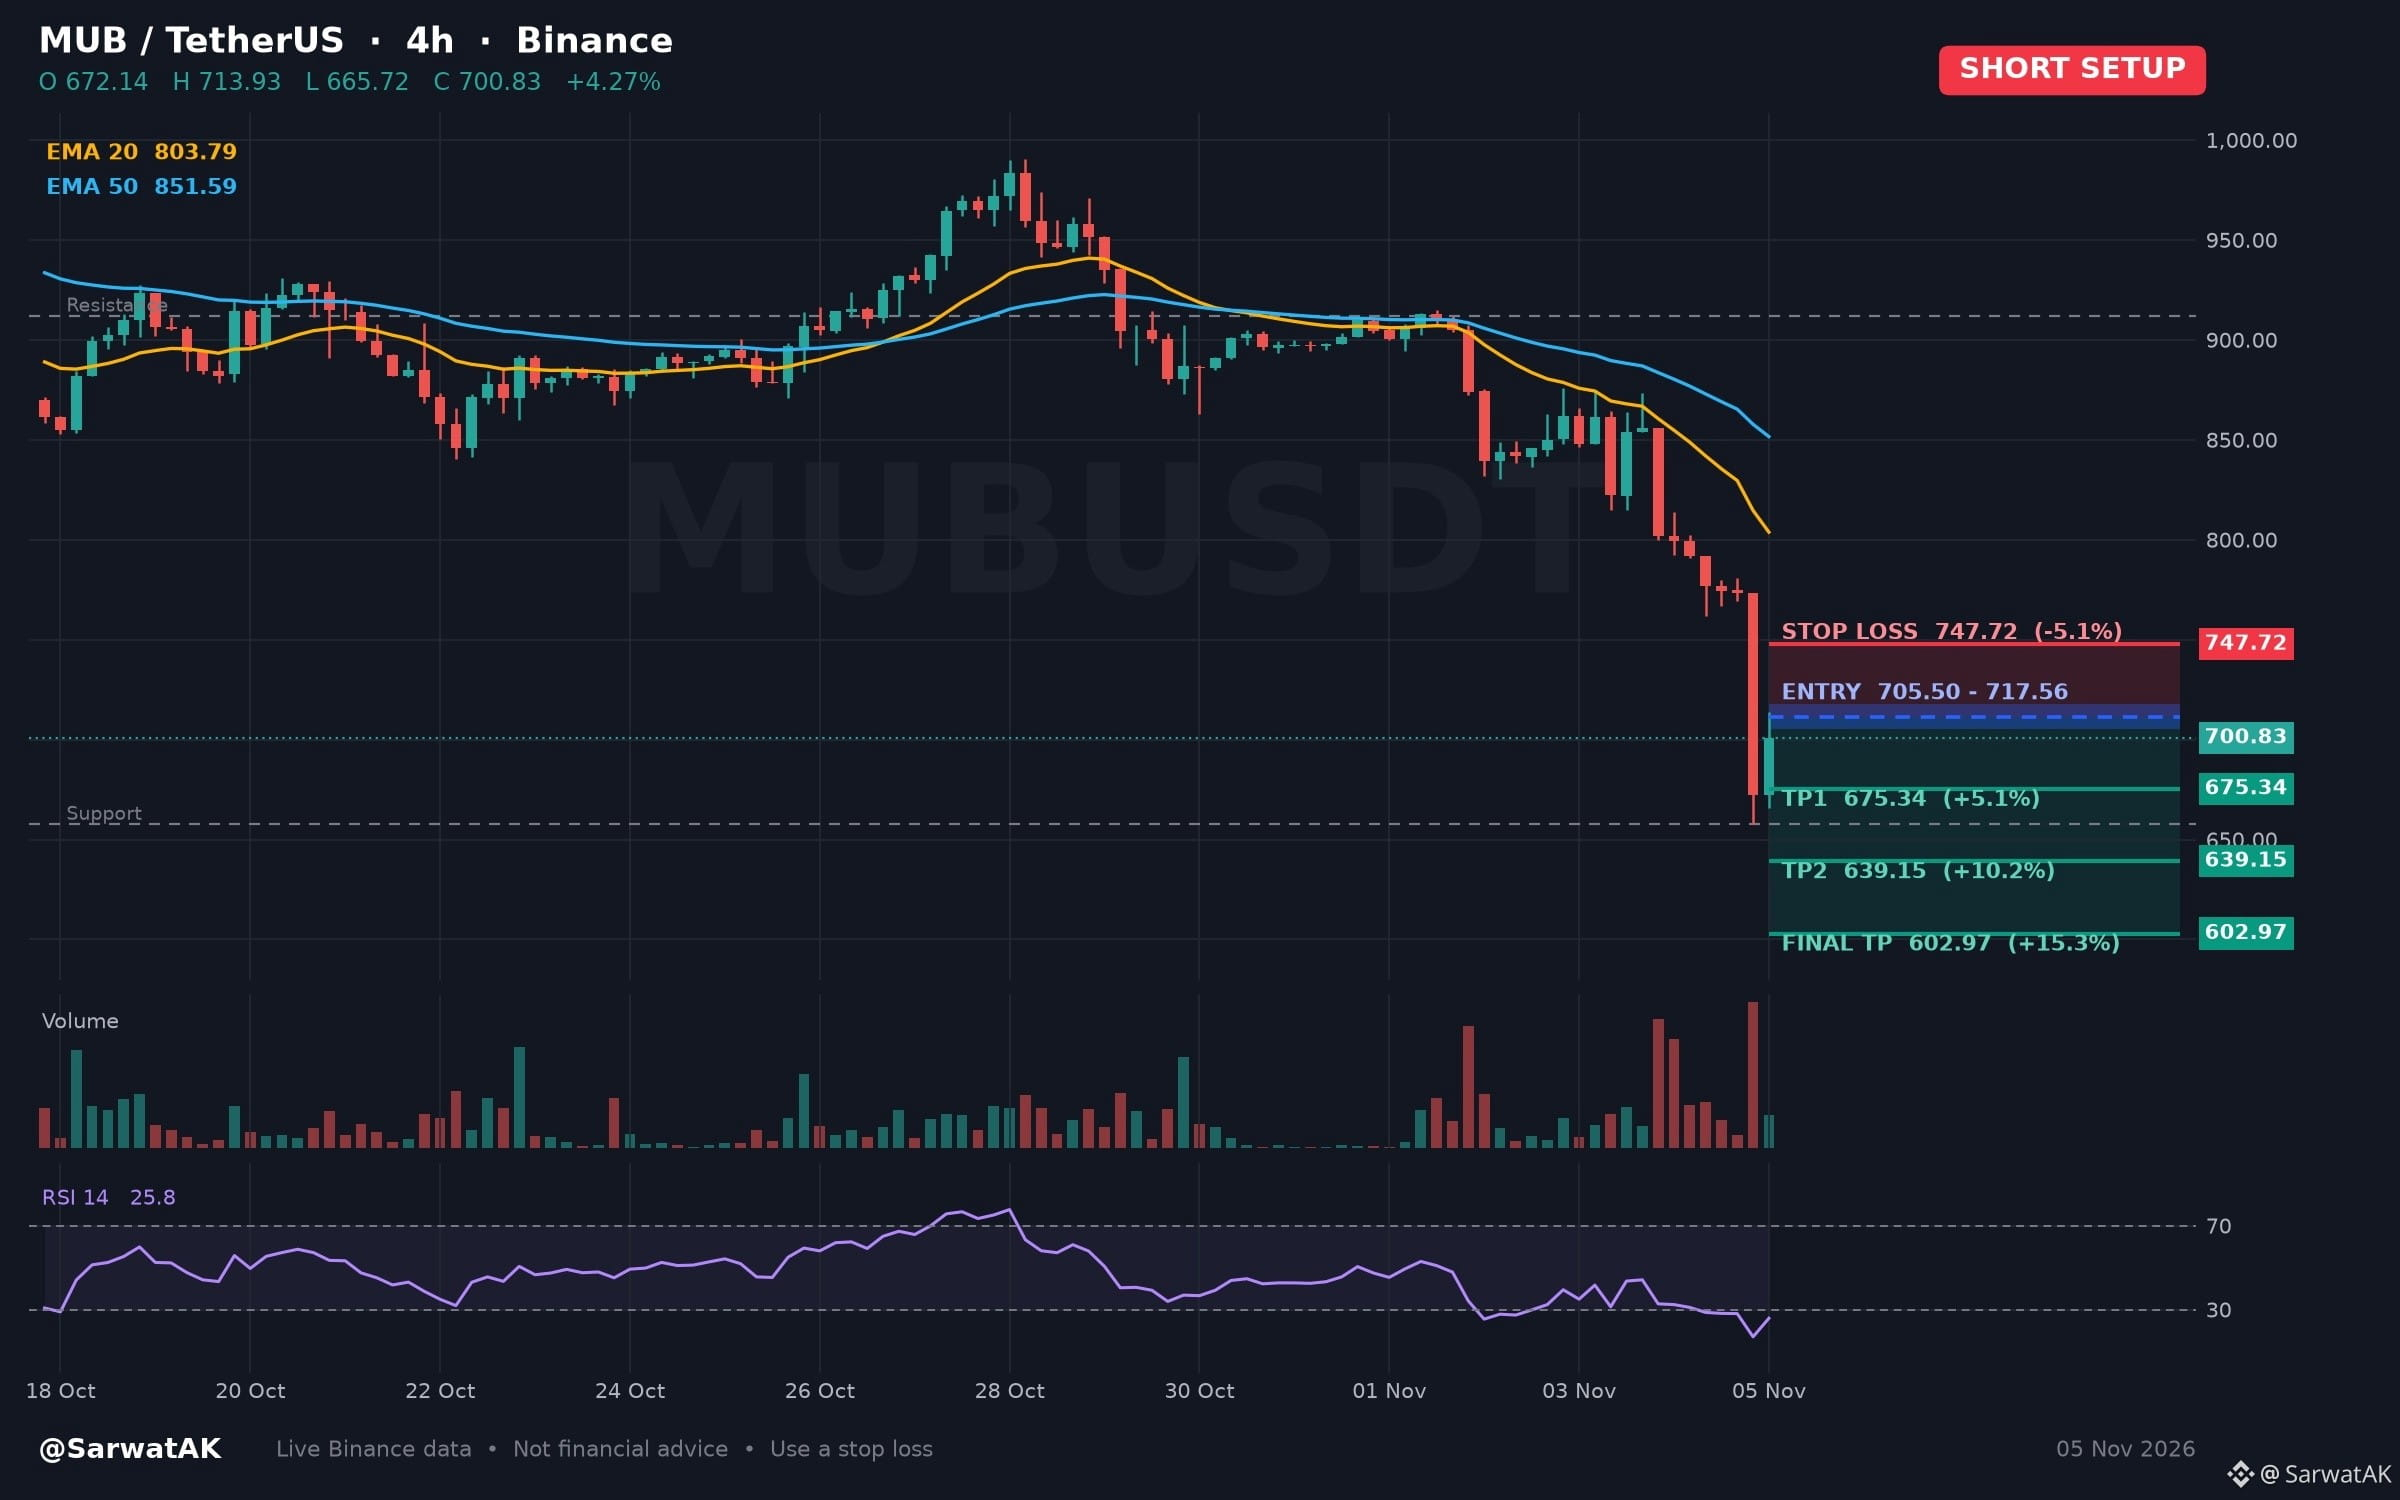
$MUB SHORT SETUP ... NEXT TARGET 602.97
Relative Strength Index Enters Oversold Territory Following Recent Downward Momentum
Entry: 705.50 - 717.56 (Short)
TP1: 675.34
TP2: 639.15
Final TP: 602.97
SL: 747.72
Downward movement over the past twenty-four hours has driven the momentum indicator into oversold territory on the four-hour chart. Market participants often monitor these technical conditions for potential consolidation or stabilization before assessing further direction.
As long as price stays below 717.56, structure stays heavy
Must use stop loss while trading
Trade $MUB
Not financial advice. Always DYOR.
Like & Follow for Daily Trade Analytics & Insider News. @SarwatAK
#MUB #Oversold #TradingSignals
{spot}(MUBUSDT)
$MUB SHORT SETUP ... NEXT TARGET 602.97
Relative Strength Index Enters Oversold Territory Following Recent Downward Momentum
Entry: 705.50 - 717.56 (Short)
TP1: 675.34
TP2: 639.15
Final TP: 602.97
SL: 747.72
Downward movement over the past twenty-four hours has driven the momentum indicator into oversold territory on the four-hour chart. Market participants often monitor these technical conditions for potential consolidation or stabilization before assessing further direction.
As long as price stays below 717.56, structure stays heavy
Must use stop loss while trading
Trade $MUB
Not financial advice. Always DYOR.
Like & Follow for Daily Trade Analytics & Insider News. @SarwatAK
#MUB #Oversold #TradingSignals
Relative Strength Index Enters Oversold Territory Following Recent Downward Momentum
Entry: 705.50 - 717.56 (Short)
TP1: 675.34
TP2: 639.15
Final TP: 602.97
SL: 747.72
Downward movement over the past twenty-four hours has driven the momentum indicator into oversold territory on the four-hour chart. Market participants often monitor these technical conditions for potential consolidation or stabilization before assessing further direction.
As long as price stays below 717.56, structure stays heavy
Must use stop loss while trading
Trade $MUB
Not financial advice. Always DYOR.
Like & Follow for Daily Trade Analytics & Insider News. @SarwatAK
#MUB #Oversold #TradingSignals
166

·
--
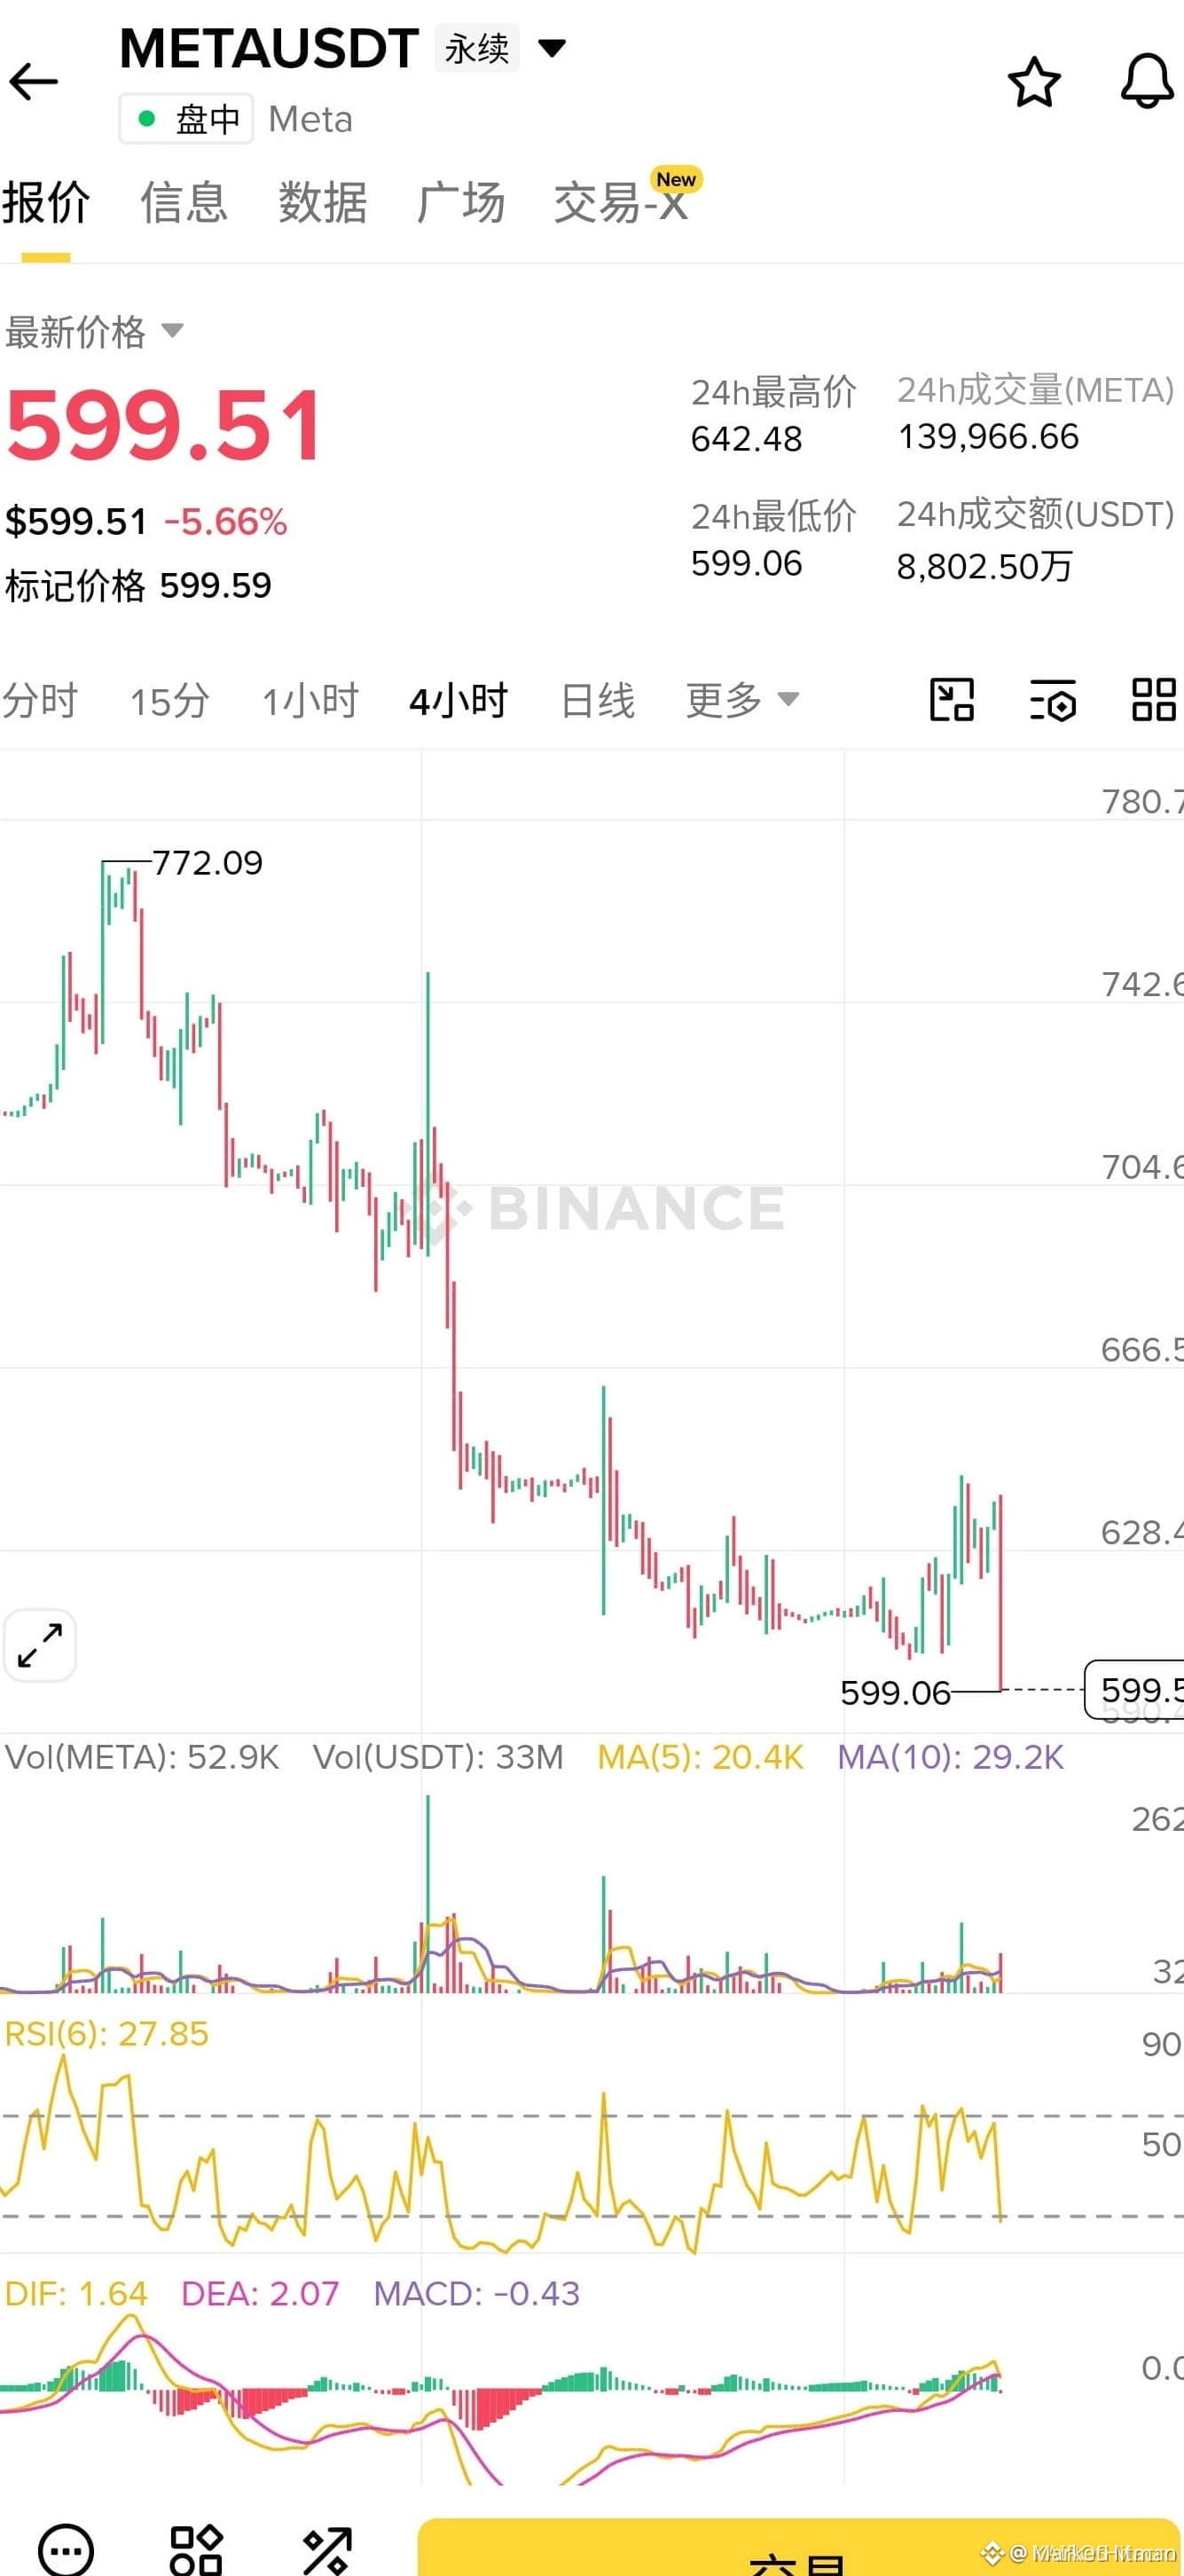
🚨 $META BOTTOM HUNT REACHES 599.51 – TIME TO RECLAIM 💥
Entry: 599.51 🟢
Target: 611.51 🎯
Stop Loss: 595.51 ⚠️
The market’s relentless head‑fakes have left many traders bracing for a deeper dive, yet the oversold signal is screaming a bounce. 📊 Technical gauges sit in extreme bearish territory, turning the pressure into a liquidity pool for smart money to flip. ⚡ When price finally kisses the 599.51 support, the floodgate opens and the next wave aims straight for 611.51. 🌊
💬 Who’s ready to lock the bottom and ride the rebound? 👇
⚠️ Not financial advice. Always manage your risk. 🛡️
🏷️ #META #LongSetup #Oversold #Crypto
🔥 💎
🚨 $META BOTTOM HUNT REACHES 599.51 – TIME TO RECLAIM 💥
Entry: 599.51 🟢
Target: 611.51 🎯
Stop Loss: 595.51 ⚠️
The market’s relentless head‑fakes have left many traders bracing for a deeper dive, yet the oversold signal is screaming a bounce. 📊 Technical gauges sit in extreme bearish territory, turning the pressure into a liquidity pool for smart money to flip. ⚡ When price finally kisses the 599.51 support, the floodgate opens and the next wave aims straight for 611.51. 🌊
💬 Who’s ready to lock the bottom and ride the rebound? 👇
⚠️ Not financial advice. Always manage your risk. 🛡️
🏷️ #META #LongSetup #Oversold #Crypto
🔥 💎
Entry: 599.51 🟢
Target: 611.51 🎯
Stop Loss: 595.51 ⚠️
The market’s relentless head‑fakes have left many traders bracing for a deeper dive, yet the oversold signal is screaming a bounce. 📊 Technical gauges sit in extreme bearish territory, turning the pressure into a liquidity pool for smart money to flip. ⚡ When price finally kisses the 599.51 support, the floodgate opens and the next wave aims straight for 611.51. 🌊
💬 Who’s ready to lock the bottom and ride the rebound? 👇
⚠️ Not financial advice. Always manage your risk. 🛡️
🏷️ #META #LongSetup #Oversold #Crypto
🔥 💎
10

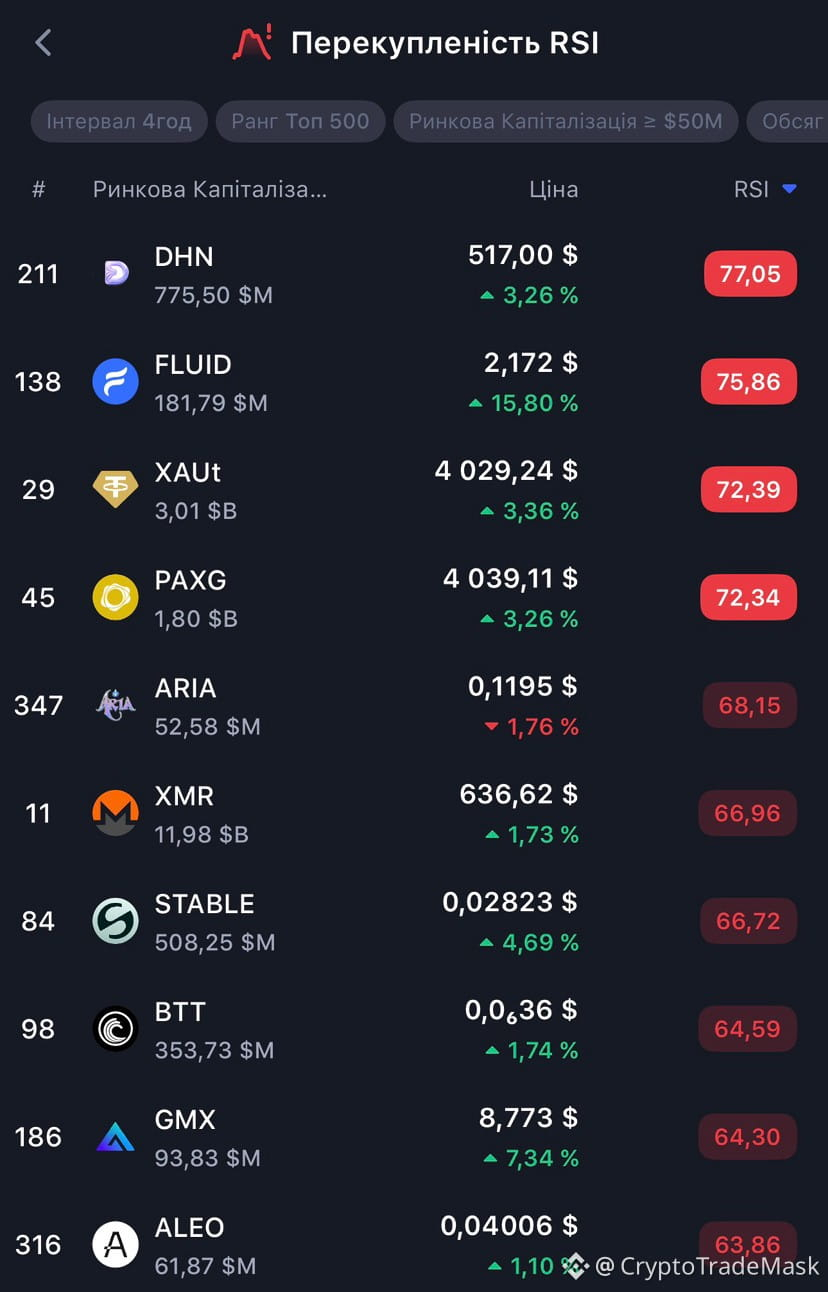
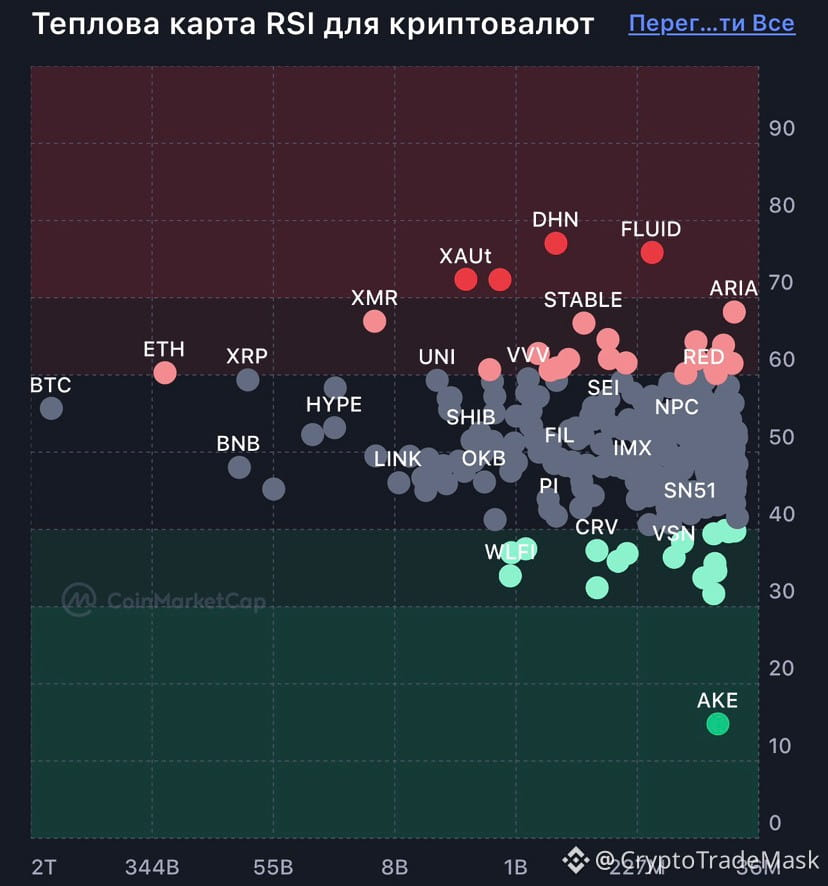
#Overbought & #oversold
📊 Overbought & Oversold: How does it work? 📈📉
Key market zones that indicate when the price may reverse.
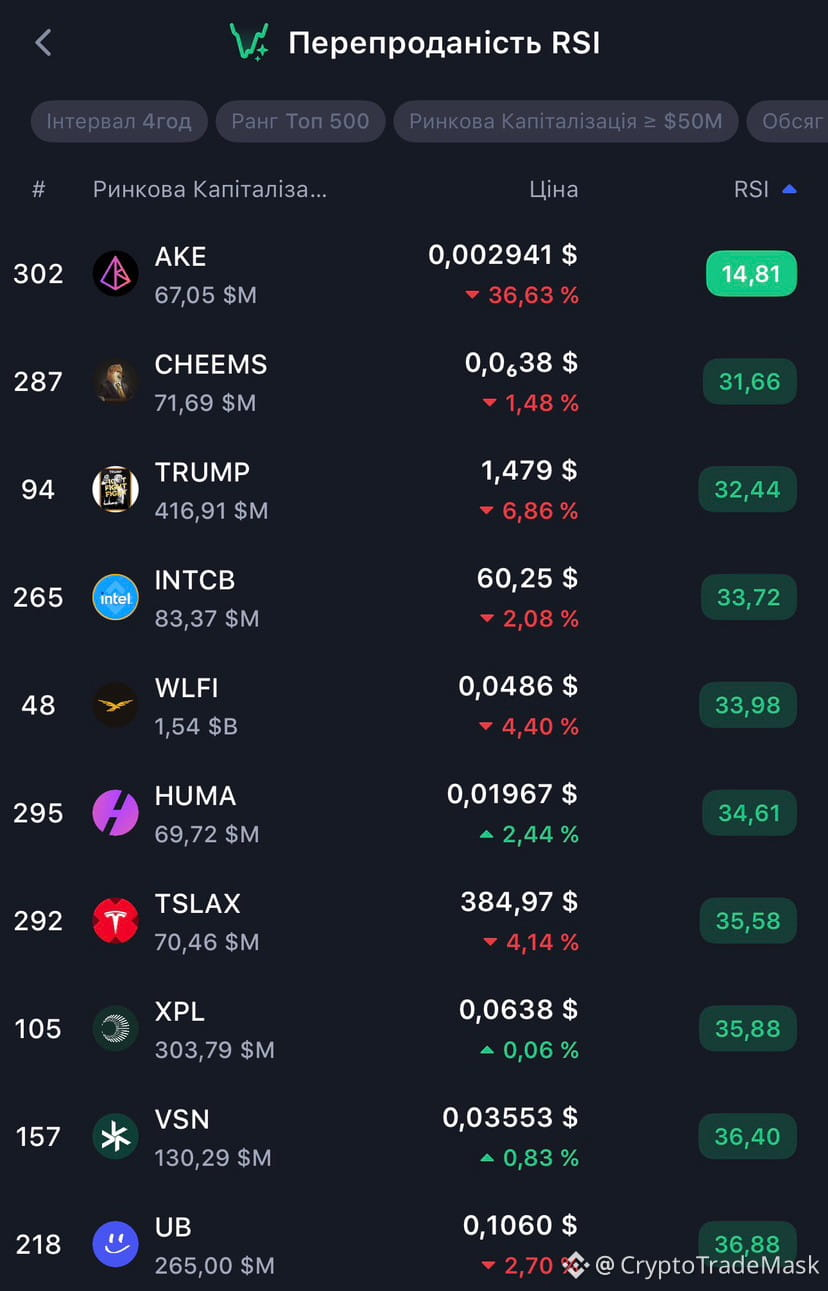
🟢 Oversold
• The price has fallen too low - temporarily or excessively.
• RSI < 30.
• There may be a chance of a rebound - the asset is becoming interesting to buy.
• Many coins are now in this zone: $AKE - a bottom may be forming.
🔴 Overbought
• The price has risen too much.
• RSI > 70.
• A correction or pause after growth is likely - it's time to take profits.
• In this zone now: $FLUID , $PAXG - a cooling after a surge is possible.
⚠️ Rule of thumb: no indicator gives guarantees - they are only hints, not a verdict.
{future}(PAXGUSDT)
{future}(FLUIDUSDT)
{future}(AKEUSDT)
#Overbought & #oversold
📊 Overbought & Oversold: How does it work? 📈📉
Key market zones that indicate when the price may reverse.
🟢 Oversold
• The price has fallen too low - temporarily or excessively.
• RSI < 30.
• There may be a chance of a rebound - the asset is becoming interesting to buy.
• Many coins are now in this zone: $AKE - a bottom may be forming.
🔴 Overbought
• The price has risen too much.
• RSI > 70.
• A correction or pause after growth is likely - it's time to take profits.
• In this zone now: $FLUID , $PAXG - a cooling after a surge is possible.
⚠️ Rule of thumb: no indicator gives guarantees - they are only hints, not a verdict.
📊 Overbought & Oversold: How does it work? 📈📉
Key market zones that indicate when the price may reverse.
🟢 Oversold
• The price has fallen too low - temporarily or excessively.
• RSI < 30.
• There may be a chance of a rebound - the asset is becoming interesting to buy.
• Many coins are now in this zone: $AKE - a bottom may be forming.
🔴 Overbought
• The price has risen too much.
• RSI > 70.
• A correction or pause after growth is likely - it's time to take profits.
• In this zone now: $FLUID , $PAXG - a cooling after a surge is possible.
⚠️ Rule of thumb: no indicator gives guarantees - they are only hints, not a verdict.
1
63

$WLD -26% in a week. Here's the oversold watchlist while everyone chases gainers 📉
Three big names that got hit hard this week (4H):
1️⃣ Worldcoin: 0.4385, -26% in 7 days
• Fresh low at 0.4249 yesterday, RSI 35
• First lid: the EMA 20 at 0.451, then 0.4529
2️⃣ $AAVE 133.45, -14% in 7 days
• Six lower highs in a row, new low at 129.5, RSI 38
• Needs a close above 135.7 (EMA 20) to show any strength
3️⃣ $SUI 0.93, -9.4% in 7 days
• Holding a double bottom at 0.900, RSI 48
• Lid at 0.937, then the EMA 50 at 0.955
Oversold isn't a buy signal by itself. In a downtrend, RSI can stay low for days. What turns oversold into opportunity:
✅ A higher low
✅ A 4H close above the EMA 20
✅ Volume on green candles
Sui is closest to confirming. Worldcoin and Aave still need patience.
Which one do you think bounces first? 👇
NFA
#Altcoins #Oversold #TechnicalAnalysis
No Binance account yet? Get 20% of your trading fees back 👉 [Sign up on Binance](https://www.binance.com/register?ref=TGCSTKKM)
$WLD -26% in a week. Here's the oversold watchlist while everyone chases gainers 📉
Three big names that got hit hard this week (4H):
1️⃣ Worldcoin: 0.4385, -26% in 7 days
• Fresh low at 0.4249 yesterday, RSI 35
• First lid: the EMA 20 at 0.451, then 0.4529
2️⃣ $AAVE 133.45, -14% in 7 days
• Six lower highs in a row, new low at 129.5, RSI 38
• Needs a close above 135.7 (EMA 20) to show any strength
3️⃣ $SUI 0.93, -9.4% in 7 days
• Holding a double bottom at 0.900, RSI 48
• Lid at 0.937, then the EMA 50 at 0.955
Oversold isn't a buy signal by itself. In a downtrend, RSI can stay low for days. What turns oversold into opportunity:
✅ A higher low
✅ A 4H close above the EMA 20
✅ Volume on green candles
Sui is closest to confirming. Worldcoin and Aave still need patience.
Which one do you think bounces first? 👇
NFA
#Altcoins #Oversold #TechnicalAnalysis
No Binance account yet? Get 20% of your trading fees back 👉 Sign up on Binance
Three big names that got hit hard this week (4H):
1️⃣ Worldcoin: 0.4385, -26% in 7 days
• Fresh low at 0.4249 yesterday, RSI 35
• First lid: the EMA 20 at 0.451, then 0.4529
2️⃣ $AAVE 133.45, -14% in 7 days
• Six lower highs in a row, new low at 129.5, RSI 38
• Needs a close above 135.7 (EMA 20) to show any strength
3️⃣ $SUI 0.93, -9.4% in 7 days
• Holding a double bottom at 0.900, RSI 48
• Lid at 0.937, then the EMA 50 at 0.955
Oversold isn't a buy signal by itself. In a downtrend, RSI can stay low for days. What turns oversold into opportunity:
✅ A higher low
✅ A 4H close above the EMA 20
✅ Volume on green candles
Sui is closest to confirming. Worldcoin and Aave still need patience.
Which one do you think bounces first? 👇
NFA
#Altcoins #Oversold #TechnicalAnalysis
No Binance account yet? Get 20% of your trading fees back 👉 Sign up on Binance
1
223
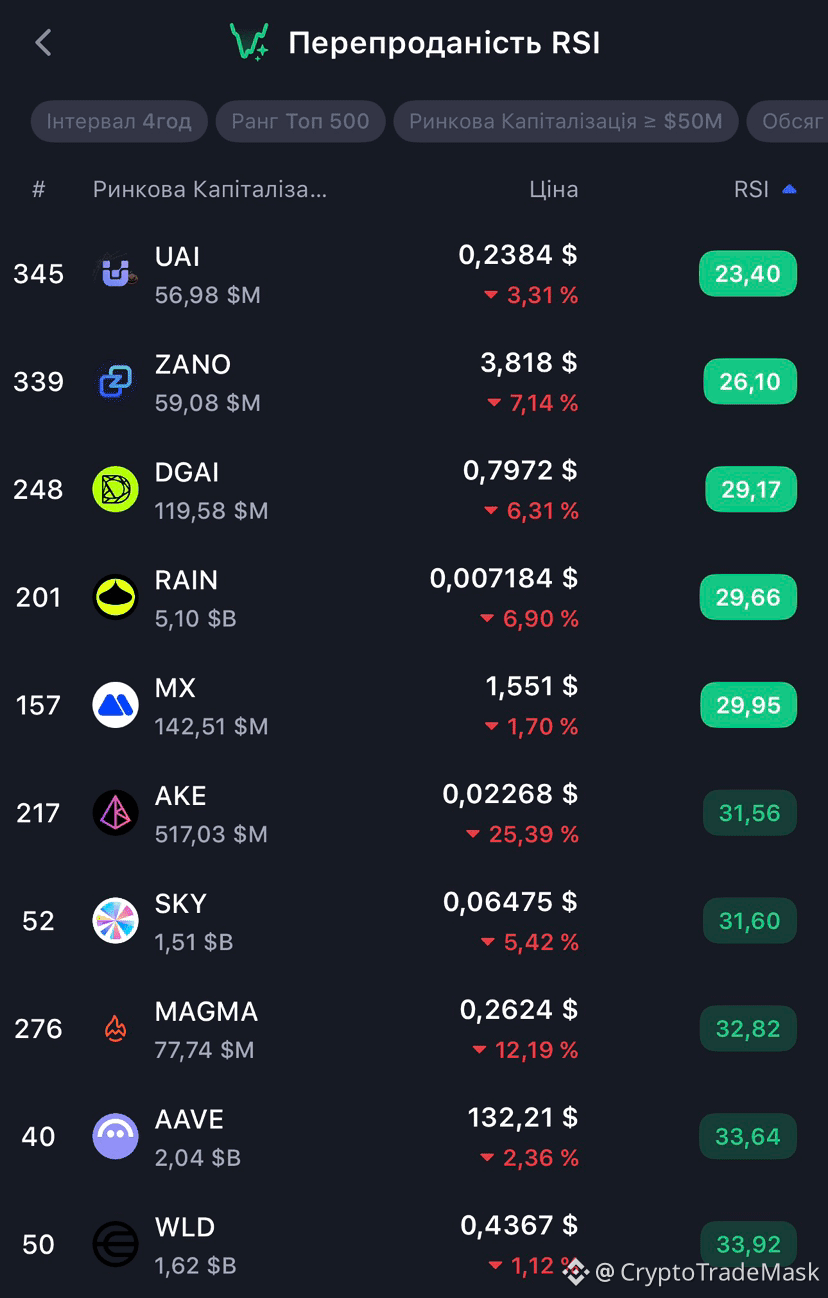
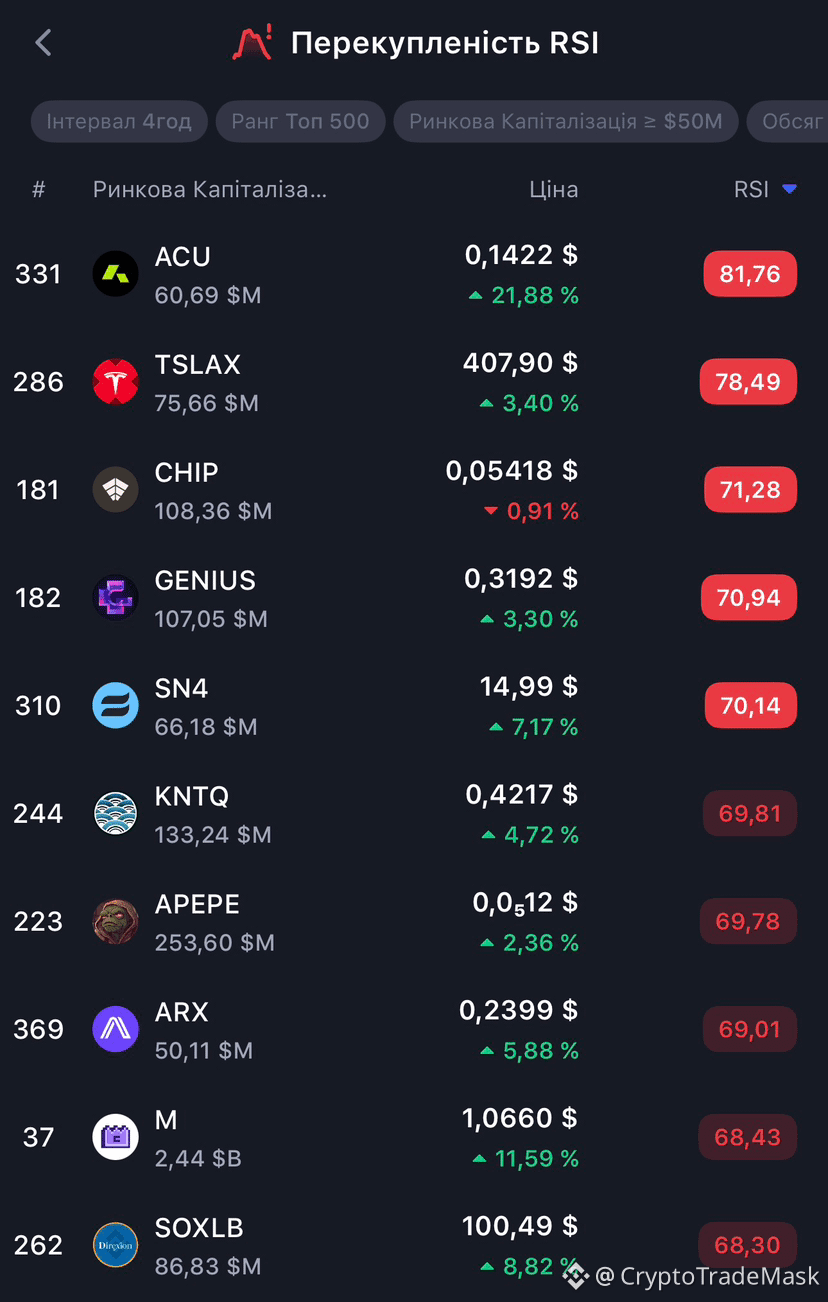
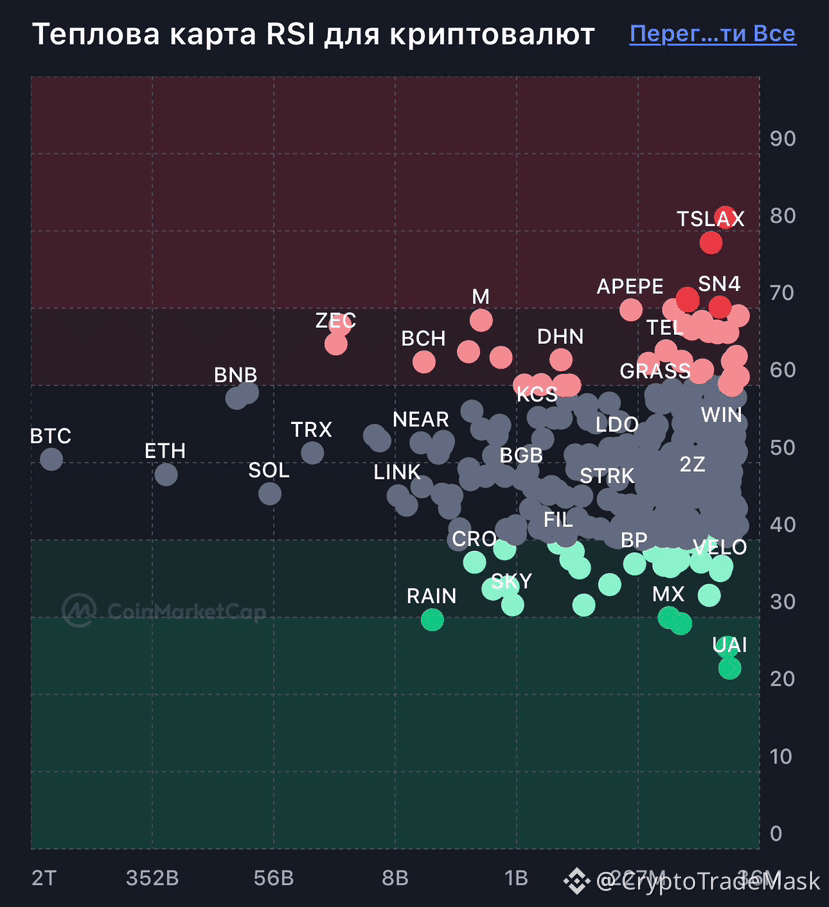
#Overbought & #oversold
📊 Overbought & Oversold: How does it work? 📈📉
Key market zones that indicate when the price may reverse.
🟢 Oversold
• The price has fallen too low - temporarily or excessively.
• RSI < 30.
• There may be a chance of a rebound - the asset is becoming interesting to buy.
• Many coins are now in this zone: $UAI - a bottom may be forming.
🔴 Overbought
• The price has risen too much.
• RSI > 70.
• A correction or pause after growth is likely - it's time to take profits.
• In this zone now: $ACU , $CHIP - a cooling after a surge is possible.
⚠️ Rule of thumb: no indicator gives guarantees - they are only hints, not a verdict.
{future}(CHIPUSDT)
{future}(ACUUSDT)
{future}(UAIUSDT)
#Overbought & #oversold
📊 Overbought & Oversold: How does it work? 📈📉
Key market zones that indicate when the price may reverse.
🟢 Oversold
• The price has fallen too low - temporarily or excessively.
• RSI < 30.
• There may be a chance of a rebound - the asset is becoming interesting to buy.
• Many coins are now in this zone: $UAI - a bottom may be forming.
🔴 Overbought
• The price has risen too much.
• RSI > 70.
• A correction or pause after growth is likely - it's time to take profits.
• In this zone now: $ACU , $CHIP - a cooling after a surge is possible.
⚠️ Rule of thumb: no indicator gives guarantees - they are only hints, not a verdict.
📊 Overbought & Oversold: How does it work? 📈📉
Key market zones that indicate when the price may reverse.
🟢 Oversold
• The price has fallen too low - temporarily or excessively.
• RSI < 30.
• There may be a chance of a rebound - the asset is becoming interesting to buy.
• Many coins are now in this zone: $UAI - a bottom may be forming.
🔴 Overbought
• The price has risen too much.
• RSI > 70.
• A correction or pause after growth is likely - it's time to take profits.
• In this zone now: $ACU , $CHIP - a cooling after a surge is possible.
⚠️ Rule of thumb: no indicator gives guarantees - they are only hints, not a verdict.
1
851

·
--
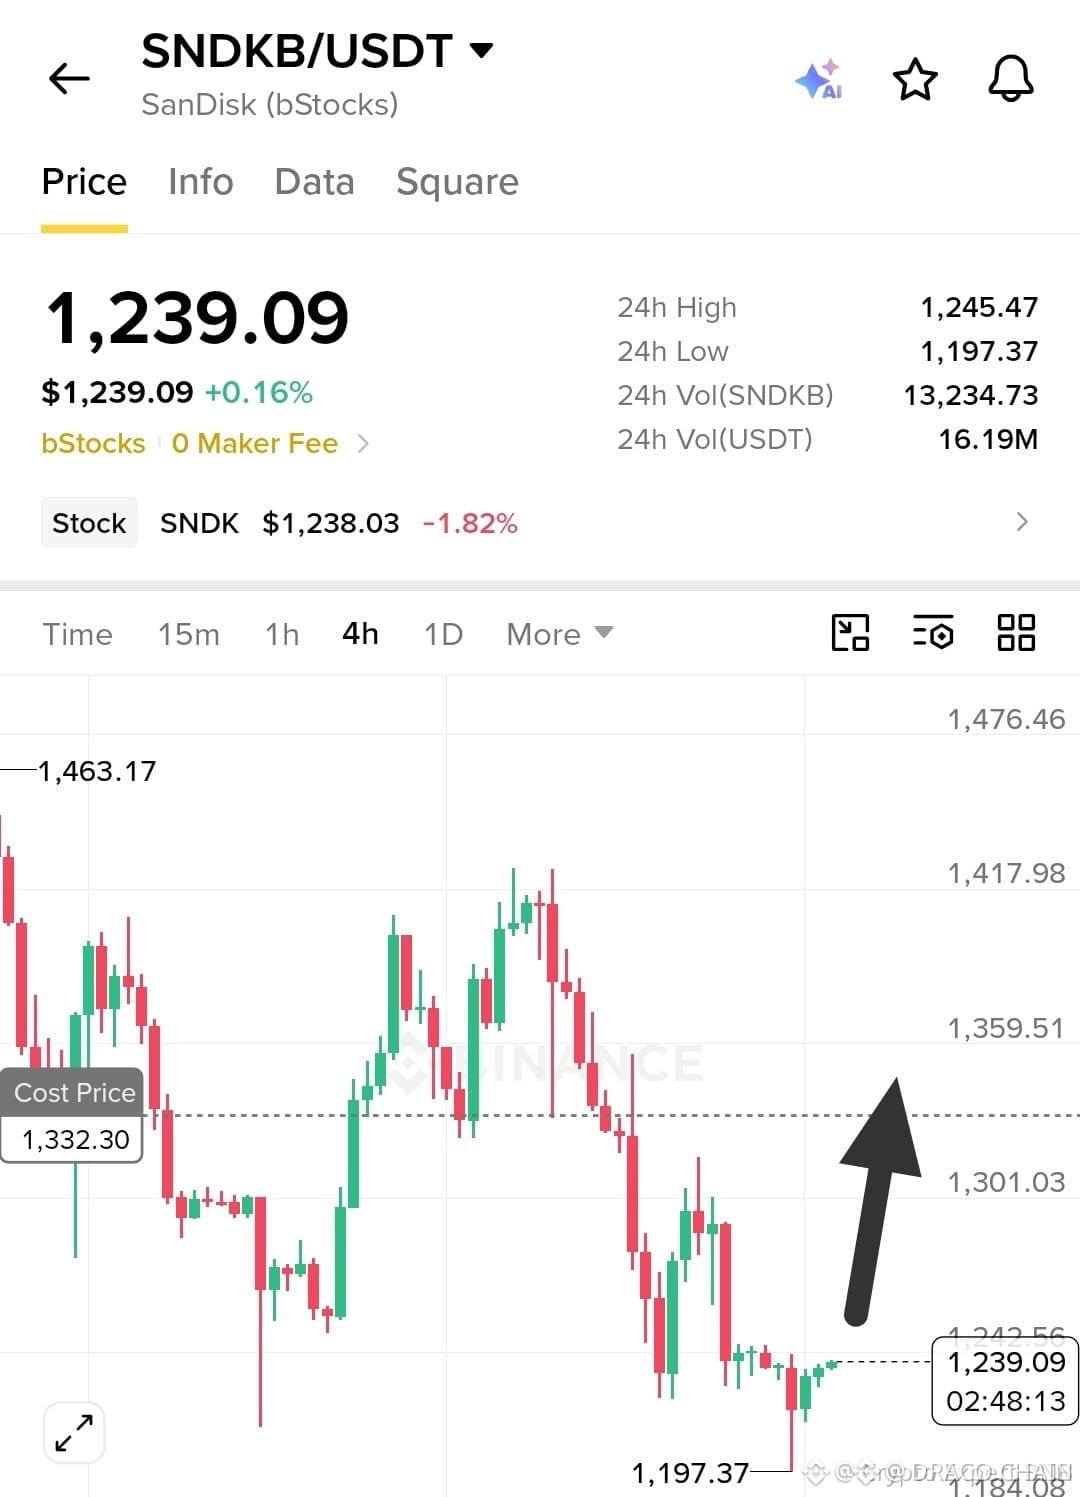
🚨 $SNDK PREPARED FOR A BULLISH REBOUND ABOVE $1,265 📈
Entry: 1239 ⚡
Target: 1265 🚀
Stop Loss: 1205 ⚠️
📊 RSI is flirting with the 30‑zone, marking a deep oversold condition while the $1,210‑$1,240 band cradles solid demand. 📌 A bounce off this pocket could flip the short‑term bias, but the prevailing bearish texture still shadows the chart. 🌊 Confirmation above $1,265 would signal smart‑money liquidity sweep completion and open the path to higher TP tiers. 💡
💬 Are you positioning for the bounce or waiting for the next liquidity trap? 👇
⚠️ Not financial advice. Always manage your risk. 🛡️
🏷️ #SNDK #LongSetup #Oversold #Crypto
🔥 💎
🚨 $SNDK PREPARED FOR A BULLISH REBOUND ABOVE $1,265 📈
Entry: 1239 ⚡
Target: 1265 🚀
Stop Loss: 1205 ⚠️
📊 RSI is flirting with the 30‑zone, marking a deep oversold condition while the $1,210‑$1,240 band cradles solid demand. 📌 A bounce off this pocket could flip the short‑term bias, but the prevailing bearish texture still shadows the chart. 🌊 Confirmation above $1,265 would signal smart‑money liquidity sweep completion and open the path to higher TP tiers. 💡
💬 Are you positioning for the bounce or waiting for the next liquidity trap? 👇
⚠️ Not financial advice. Always manage your risk. 🛡️
🏷️ #SNDK #LongSetup #Oversold #Crypto
🔥 💎
Entry: 1239 ⚡
Target: 1265 🚀
Stop Loss: 1205 ⚠️
📊 RSI is flirting with the 30‑zone, marking a deep oversold condition while the $1,210‑$1,240 band cradles solid demand. 📌 A bounce off this pocket could flip the short‑term bias, but the prevailing bearish texture still shadows the chart. 🌊 Confirmation above $1,265 would signal smart‑money liquidity sweep completion and open the path to higher TP tiers. 💡
💬 Are you positioning for the bounce or waiting for the next liquidity trap? 👇
⚠️ Not financial advice. Always manage your risk. 🛡️
🏷️ #SNDK #LongSetup #Oversold #Crypto
🔥 💎
7
·
--
Bearish
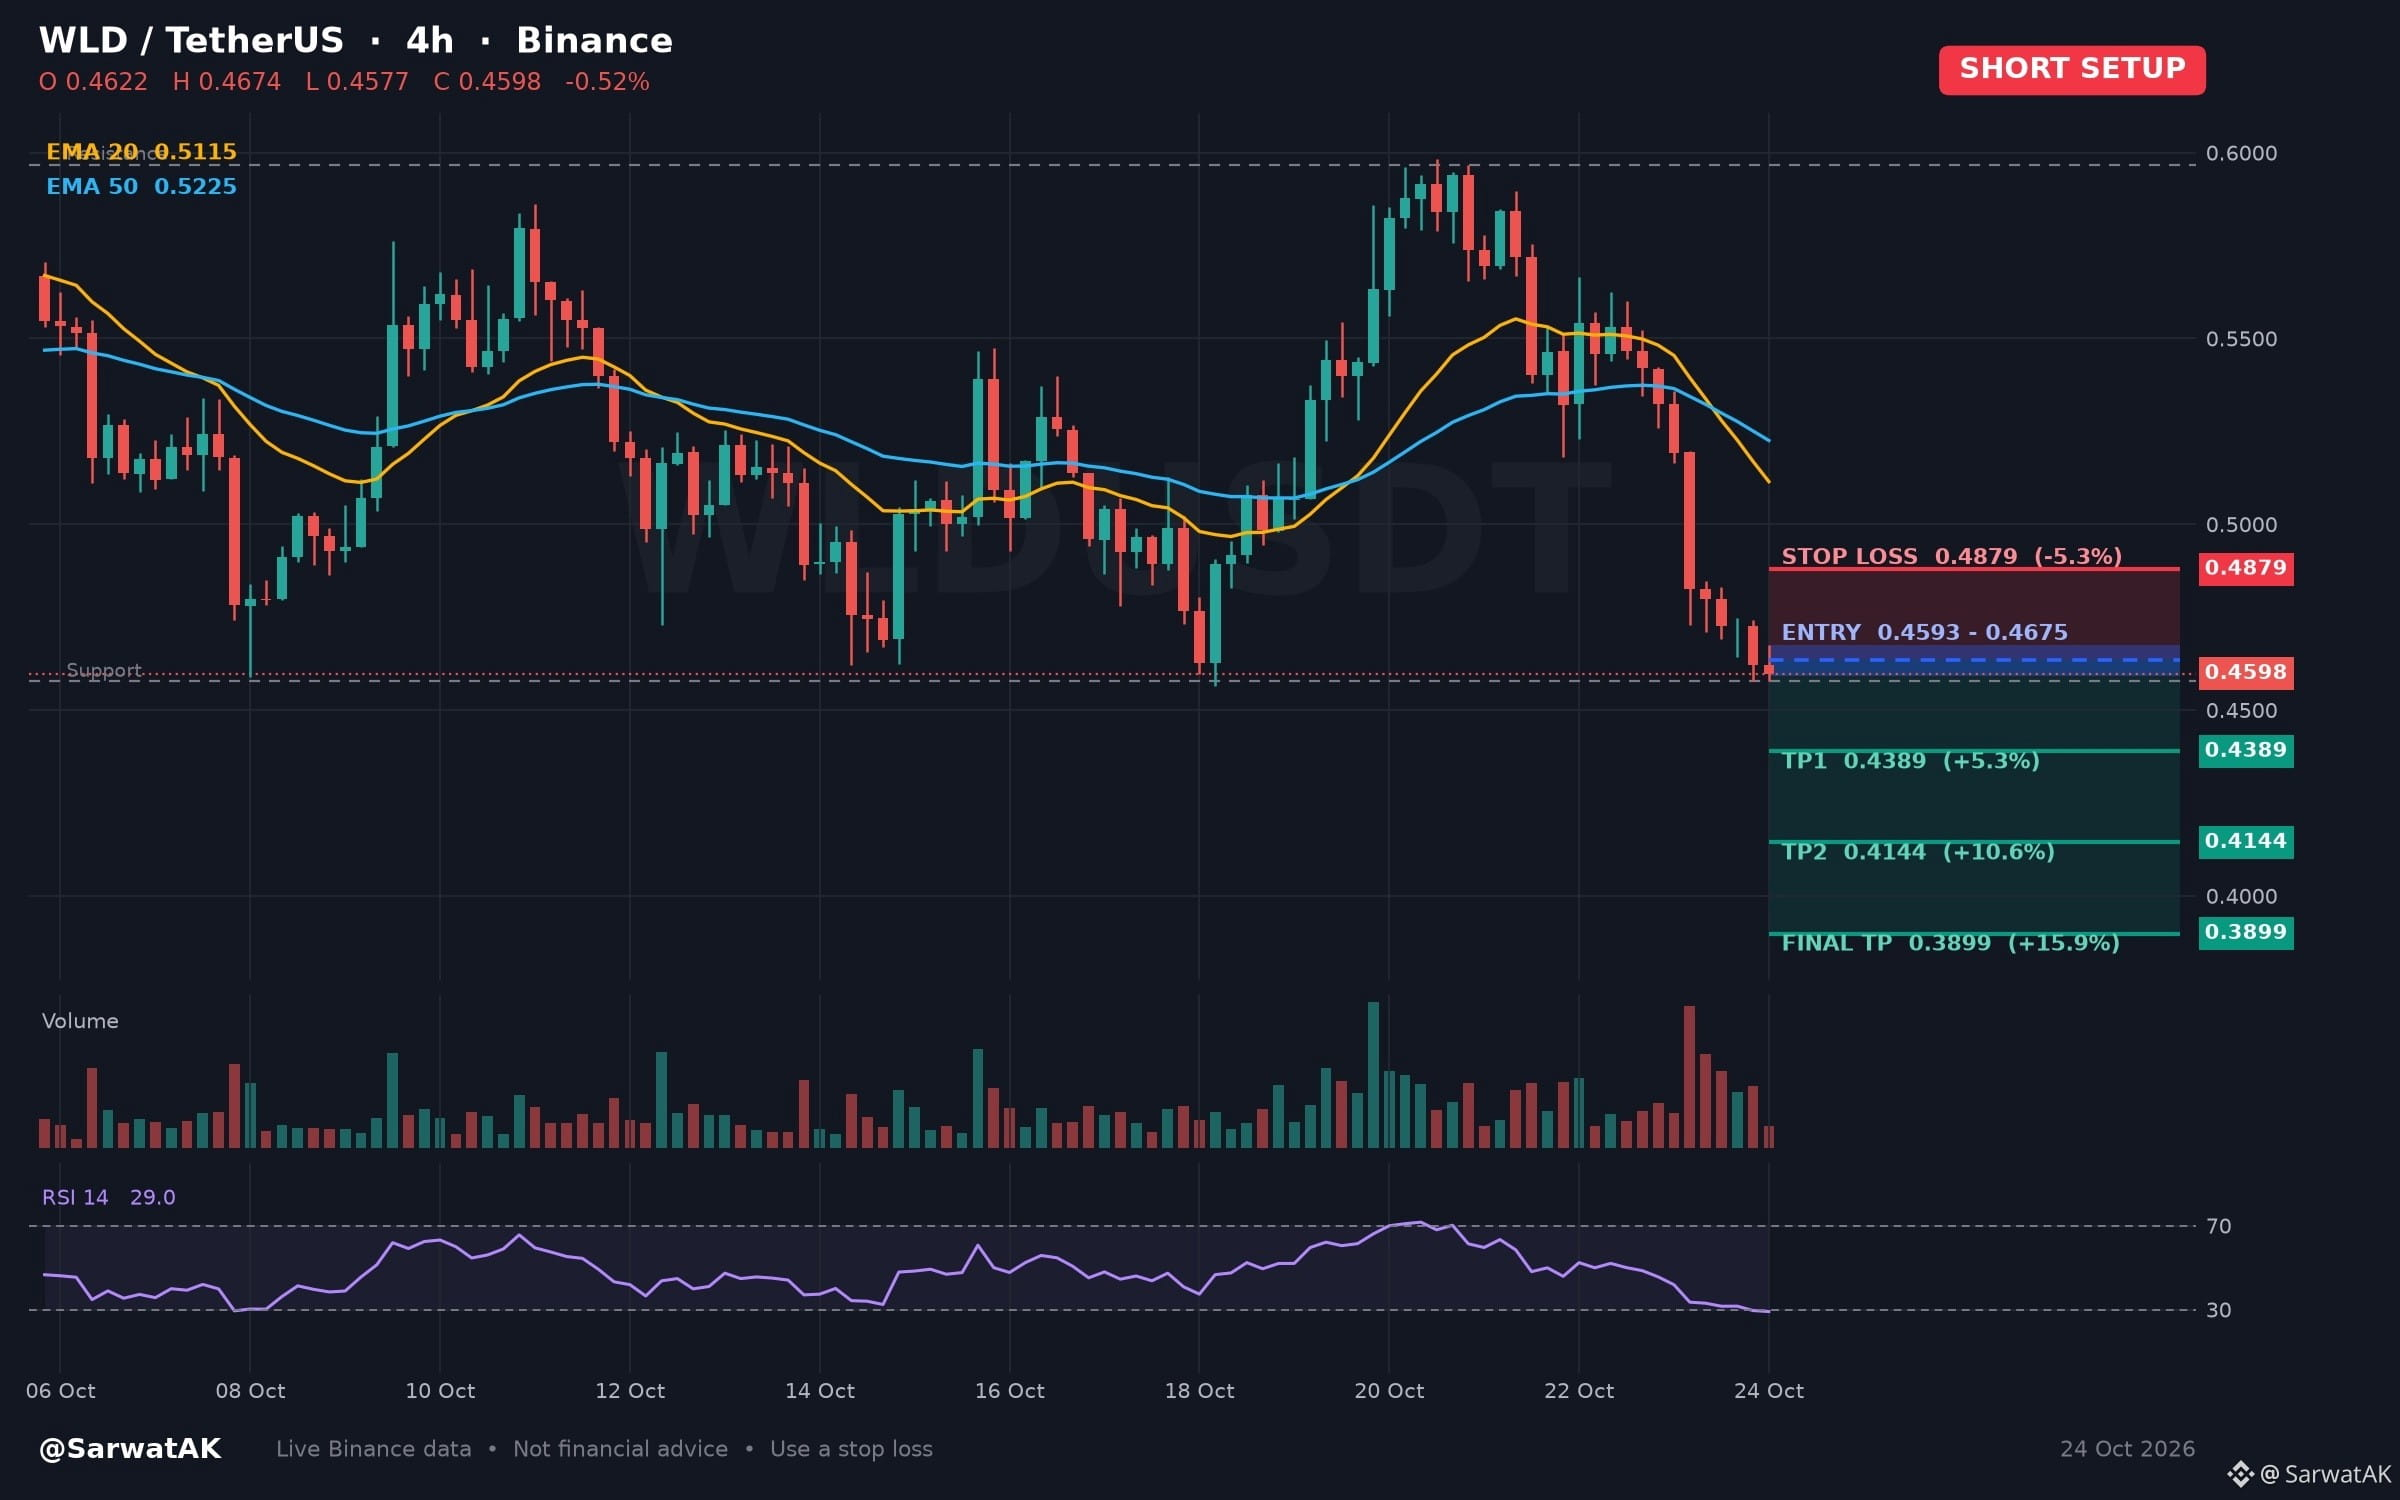
$WLD SHORT SETUP ... NEXT TARGET 0.3899
Oversold Relative Strength Follows Downward Movement on Four-Hour Chart
Entry: 0.4593 - 0.4675 (Short)
TP1: 0.4389
TP2: 0.4144
Final TP: 0.3899
SL: 0.4879
Downward price action over the past twenty-four hours has pushed the four-hour relative strength index into oversold territory. Traders assessing this setup observe whether momentum stabilizes or extended selling pressure persists.
As long as price stays below 0.4675, structure stays heavy
Must use stop loss while trading
Trade $WLD
Not financial advice. Always DYOR.
Like & Follow for Daily Trade Analytics & Insider News. @SarwatAK
#WLD #Oversold #HotTrends
{spot}(WLDUSDT)
$WLD SHORT SETUP ... NEXT TARGET 0.3899
Oversold Relative Strength Follows Downward Movement on Four-Hour Chart
Entry: 0.4593 - 0.4675 (Short)
TP1: 0.4389
TP2: 0.4144
Final TP: 0.3899
SL: 0.4879
Downward price action over the past twenty-four hours has pushed the four-hour relative strength index into oversold territory. Traders assessing this setup observe whether momentum stabilizes or extended selling pressure persists.
As long as price stays below 0.4675, structure stays heavy
Must use stop loss while trading
Trade $WLD
Not financial advice. Always DYOR.
Like & Follow for Daily Trade Analytics & Insider News. @SarwatAK
#WLD #Oversold #HotTrends
Oversold Relative Strength Follows Downward Movement on Four-Hour Chart
Entry: 0.4593 - 0.4675 (Short)
TP1: 0.4389
TP2: 0.4144
Final TP: 0.3899
SL: 0.4879
Downward price action over the past twenty-four hours has pushed the four-hour relative strength index into oversold territory. Traders assessing this setup observe whether momentum stabilizes or extended selling pressure persists.
As long as price stays below 0.4675, structure stays heavy
Must use stop loss while trading
Trade $WLD
Not financial advice. Always DYOR.
Like & Follow for Daily Trade Analytics & Insider News. @SarwatAK
#WLD #Oversold #HotTrends
1
342

·
--
🚀 $XRP TEETERING AT SUPPORT, RSI SAYS BULLISH REBOUND? 📈
Entry: $1.28 ⚡
Target: $1.39 🚀
Stop Loss: $1.26 ⚠️
📊 The RSI has plunged to 17.35, screaming oversold territory while volume still fuels the downtrend. 📈 A bounce off the $1.26 floor could flip the script, but sellers are still pressing hard above the $1.31‑$1.32 EMA wall. 🦈 If buyers reclaim the $1.30 zone, the next hurdle is the $1.39 ceiling that’s been holding the last rally. 💡 Will the liquidity sweep finally flip, or will the bears drive XRP deeper? 🤔
⚠️ Not financial advice. Always manage your risk. 🛡️
🏷️ #XRP #LongSetup #Oversold #Crypto
🔥 💎
🚀 $XRP TEETERING AT SUPPORT, RSI SAYS BULLISH REBOUND? 📈
Entry: $1.28 ⚡
Target: $1.39 🚀
Stop Loss: $1.26 ⚠️
📊 The RSI has plunged to 17.35, screaming oversold territory while volume still fuels the downtrend. 📈 A bounce off the $1.26 floor could flip the script, but sellers are still pressing hard above the $1.31‑$1.32 EMA wall. 🦈 If buyers reclaim the $1.30 zone, the next hurdle is the $1.39 ceiling that’s been holding the last rally. 💡 Will the liquidity sweep finally flip, or will the bears drive XRP deeper? 🤔
⚠️ Not financial advice. Always manage your risk. 🛡️
🏷️ #XRP #LongSetup #Oversold #Crypto
🔥 💎
Entry: $1.28 ⚡
Target: $1.39 🚀
Stop Loss: $1.26 ⚠️
📊 The RSI has plunged to 17.35, screaming oversold territory while volume still fuels the downtrend. 📈 A bounce off the $1.26 floor could flip the script, but sellers are still pressing hard above the $1.31‑$1.32 EMA wall. 🦈 If buyers reclaim the $1.30 zone, the next hurdle is the $1.39 ceiling that’s been holding the last rally. 💡 Will the liquidity sweep finally flip, or will the bears drive XRP deeper? 🤔
⚠️ Not financial advice. Always manage your risk. 🛡️
🏷️ #XRP #LongSetup #Oversold #Crypto
🔥 💎
17
Log in to explore more content
Join global crypto users on Binance Square
⚡️ Get latest and useful information about crypto.
💬 Trusted by the world’s largest crypto exchange.
👍 Discover real insights from verified creators.
Email / Phone number
Trending Topics
1
#WhoWillSucceedJensenHuangatNvidia?
22,238 views
330 Discussing
2
#WhatWillDriveCryptoandStocks’NextRebound?
312,965 views
2,276 Discussing
3
#USPPIMissMayEaseBTCPressure
140,114 views
1,576 Discussing
4
#TONStrategyReports$23.97MQ3NetLoss
392 views
10 Discussing
5
#PolkadotCommunityApprovesNewStrategyWith97%Vote
946 views
63 Discussing
6
#dYdXPlansV9.9UpgradeToShiftUSDCToInjective
1,145 views
45 Discussing
7
#TradFiForBeginners
660,567 views
4,275 Discussing
8
#MANTRAPausesUnstakingFor7DaysAfterKeplrSecurityIncident
2,487 views
36 Discussing
9
#BitcoinCoreDisclosesTorTrafficVulnerability
64,646 views
899 Discussing
10
#BitcoinBreaksBelow200WeekMovingAverage
141,146 views
909 Discussing