

#magmaustd
magmaustd
76,799 views
374 Discussing
Hot
Latest

·
--
$MAGMA
{future}(MAGMAUSDT)
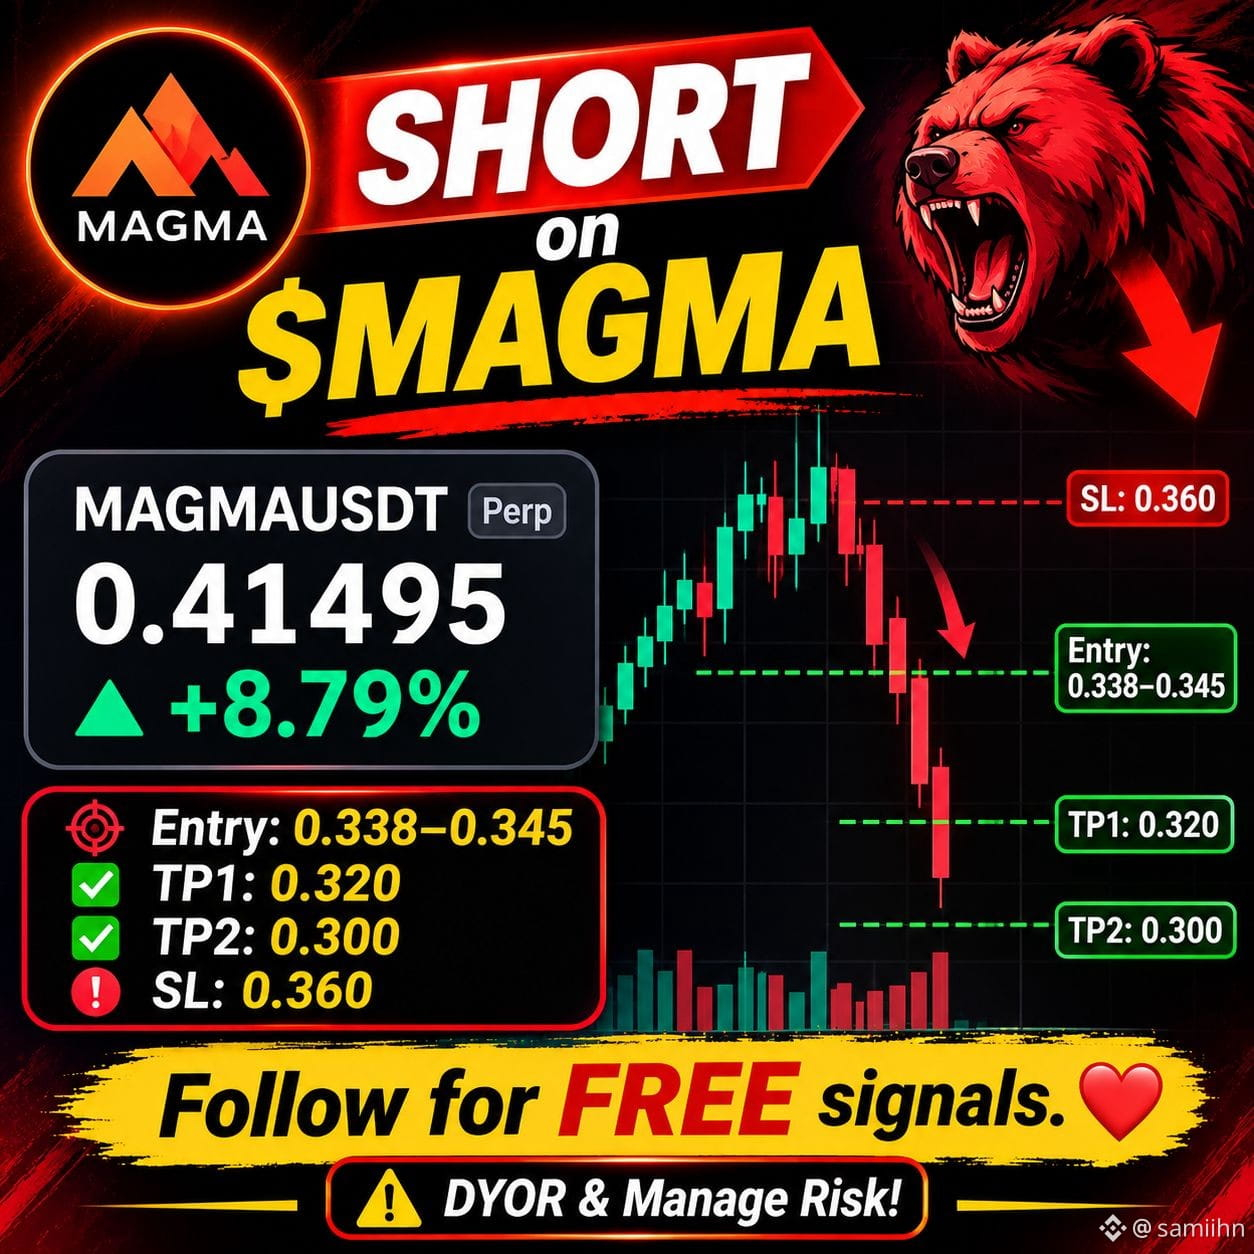
📊 MAGMAUSDT Perp
💰 Price: 0.41495
📈 +8.79%
🎯 Entry: 0.338–0.345
✅ TP1: 0.320
✅ TP2: 0.300
🛑 SL: 0.360
Follow for FREE signals ❤️
⚠️ DYOR & Manage Risk!
#MAGMAUSTD #APR
$MAGMA
📊 MAGMAUSDT Perp
💰 Price: 0.41495
📈 +8.79%
🎯 Entry: 0.338–0.345
✅ TP1: 0.320
✅ TP2: 0.300
🛑 SL: 0.360
Follow for FREE signals ❤️
⚠️ DYOR & Manage Risk!
#MAGMAUSTD #APR
📊 MAGMAUSDT Perp
💰 Price: 0.41495
📈 +8.79%
🎯 Entry: 0.338–0.345
✅ TP1: 0.320
✅ TP2: 0.300
🛑 SL: 0.360
Follow for FREE signals ❤️
⚠️ DYOR & Manage Risk!
#MAGMAUSTD #APR
269

·
--
Bullish
Shorts are getting squeezed at a higher level.
Watch for another upside push.
$MAGMA
{future}(MAGMAUSDT)
$AIN
{future}(AINUSDT)
$IDOL
{future}(IDOLUSDT)
🟢 LIQUIDITY ZONE HIT 🟢
Short liquidation spotted 🧨
$1.6303K cleared at $0.40595
Upside liquidity swept — watch reaction 👀
🎯 TP Targets:
TP1: ~$0.40798
TP2: ~$0.41001
TP3: ~$0.41204
#MAGMAUSTD
Shorts are getting squeezed at a higher level.
Watch for another upside push.
$MAGMA
$AIN
$IDOL
🟢 LIQUIDITY ZONE HIT 🟢
Short liquidation spotted 🧨
$1.6303K cleared at $0.40595
Upside liquidity swept — watch reaction 👀
🎯 TP Targets:
TP1: ~$0.40798
TP2: ~$0.41001
TP3: ~$0.41204
#MAGMAUSTD
Watch for another upside push.
$MAGMA
$AIN
$IDOL
🟢 LIQUIDITY ZONE HIT 🟢
Short liquidation spotted 🧨
$1.6303K cleared at $0.40595
Upside liquidity swept — watch reaction 👀
🎯 TP Targets:
TP1: ~$0.40798
TP2: ~$0.41001
TP3: ~$0.41204
#MAGMAUSTD
15

·
--
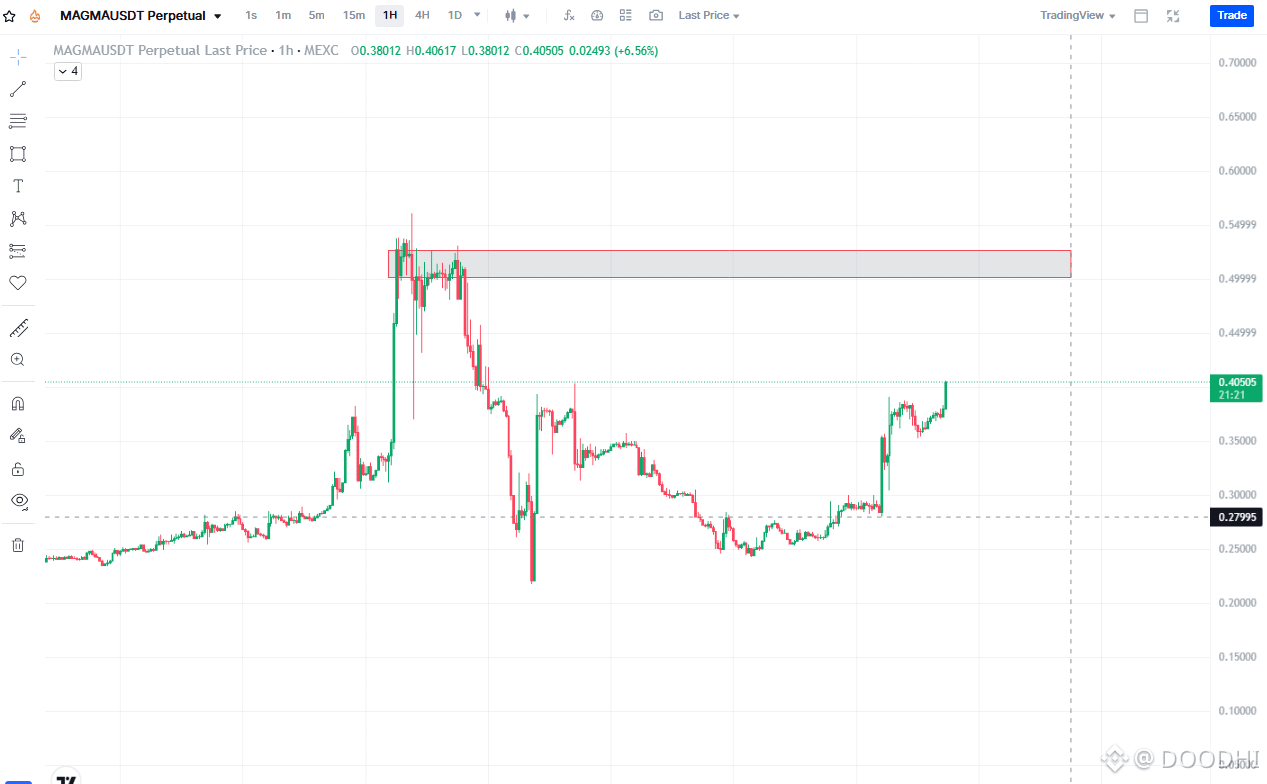
🚀 MAGMAUSDT – Bullish Momentum | 1H Chart Analysis
MAGMAUSDT is showing strong bullish momentum on the 1-hour chart, with price currently trading around 0.40505 USDT.
📊 Technical Analysis:
Price has recovered significantly from the 0.25–0.28 support area and is now approaching an important resistance zone. Buyers are showing strength, but confirmation is needed before expecting a major breakout.
🔑 Key Levels to Watch:
🟢 Current Price: 0.40505 USDT
🎯 Target 1: 0.4500 USDT
🎯 Target 2: 0.5000 USDT
🔴 Major Resistance Zone: 0.4990–0.5500 USDT
⚠️ Important Support: 0.3500 USDT
Bullish Scenario:
If MAGMAUSDT maintains its momentum and breaks above 0.4500, the next potential move could be toward 0.5000. A strong breakout above the resistance zone may open the door for further upside.
Bearish Scenario:
If price faces rejection and falls below 0.3500, bullish momentum could weaken, increasing the possibility of a deeper correction.
📌 My View: MAGMAUSDT is showing an interesting recovery, but the upcoming resistance zone will be crucial. Always wait for confirmation and manage your risk carefully.
💬 What do you think? Will MAGMAUSDT break above 0.5000, or will sellers take control?
DYOR – This is a technical analysis, not financial advice. Always trade with proper risk management.
$MAGMA
{future}(MAGMAUSDT)
#BinanceReports80%Recoveryof$6.3BillioninLossesfromHackIncident #TRMCambodianCasinosReceived$1.07BInCrypto #IolePlansToSellAll151.21Bitcoin #SuspectedNorthKoreaAttacksAccountForNearly89%OfCryptoHackLosses #MAGMAUSTD
🚀 MAGMAUSDT – Bullish Momentum | 1H Chart Analysis
MAGMAUSDT is showing strong bullish momentum on the 1-hour chart, with price currently trading around 0.40505 USDT.
📊 Technical Analysis:
Price has recovered significantly from the 0.25–0.28 support area and is now approaching an important resistance zone. Buyers are showing strength, but confirmation is needed before expecting a major breakout.
🔑 Key Levels to Watch:
🟢 Current Price: 0.40505 USDT
🎯 Target 1: 0.4500 USDT
🎯 Target 2: 0.5000 USDT
🔴 Major Resistance Zone: 0.4990–0.5500 USDT
⚠️ Important Support: 0.3500 USDT
Bullish Scenario:
If MAGMAUSDT maintains its momentum and breaks above 0.4500, the next potential move could be toward 0.5000. A strong breakout above the resistance zone may open the door for further upside.
Bearish Scenario:
If price faces rejection and falls below 0.3500, bullish momentum could weaken, increasing the possibility of a deeper correction.
📌 My View: MAGMAUSDT is showing an interesting recovery, but the upcoming resistance zone will be crucial. Always wait for confirmation and manage your risk carefully.
💬 What do you think? Will MAGMAUSDT break above 0.5000, or will sellers take control?
DYOR – This is a technical analysis, not financial advice. Always trade with proper risk management.
$MAGMA
#BinanceReports80%Recoveryof$6.3BillioninLossesfromHackIncident #TRMCambodianCasinosReceived$1.07BInCrypto #IolePlansToSellAll151.21Bitcoin #SuspectedNorthKoreaAttacksAccountForNearly89%OfCryptoHackLosses #MAGMAUSTD
1
1
199
·
--
Bullish
The upside squeeze is gaining attention.
Watch for strength near this level.
$MAGMA
{future}(MAGMAUSDT)
$AIN
{future}(AINUSDT)
$IDOL
{future}(IDOLUSDT)
🟢 LIQUIDITY ZONE HIT 🟢
Short liquidation spotted 🧨
$4.9977K cleared at $0.38941
Upside liquidity swept — watch reaction 👀
🎯 TP Targets:
TP1: ~$0.39136
TP2: ~$0.39330
TP3: ~$0.39525
#MAGMAUSTD
The upside squeeze is gaining attention.
Watch for strength near this level.
$MAGMA
$AIN
$IDOL
🟢 LIQUIDITY ZONE HIT 🟢
Short liquidation spotted 🧨
$4.9977K cleared at $0.38941
Upside liquidity swept — watch reaction 👀
🎯 TP Targets:
TP1: ~$0.39136
TP2: ~$0.39330
TP3: ~$0.39525
#MAGMAUSTD
Watch for strength near this level.
$MAGMA
$AIN
$IDOL
🟢 LIQUIDITY ZONE HIT 🟢
Short liquidation spotted 🧨
$4.9977K cleared at $0.38941
Upside liquidity swept — watch reaction 👀
🎯 TP Targets:
TP1: ~$0.39136
TP2: ~$0.39330
TP3: ~$0.39525
#MAGMAUSTD
21

·
--
$MAGMA
{future}(MAGMAUSDT)
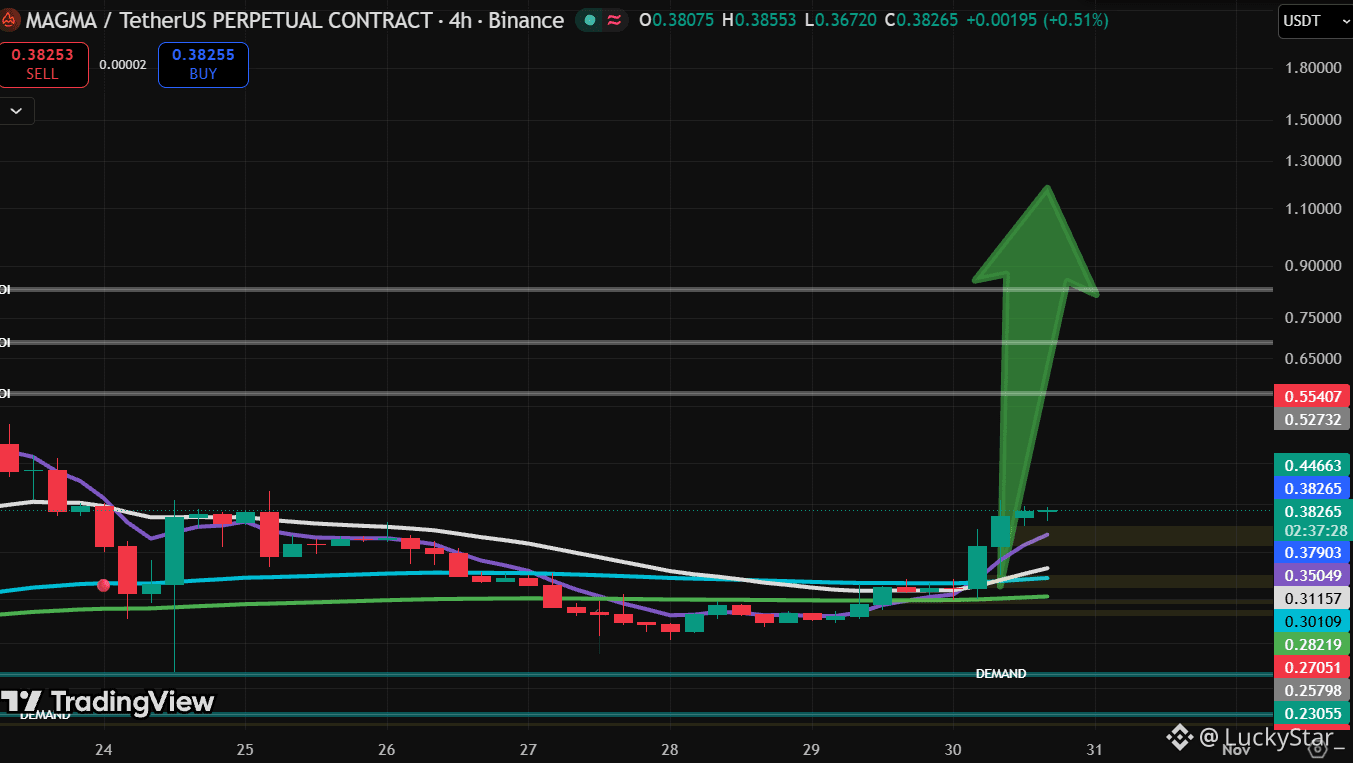
💎 The current structure deserves more attention than it seems.
Demand is gradually returning after a period of uncertainty.
If buyers confirm their strength, a new wave of growth could begin sooner than many expect.
The key remains the immediate resistance levels.
They will show how strong the current momentum is.
#MAGMA #MAGMAUSTD #MAGMAsignal
$MAGMA
💎 The current structure deserves more attention than it seems.
Demand is gradually returning after a period of uncertainty.
If buyers confirm their strength, a new wave of growth could begin sooner than many expect.
The key remains the immediate resistance levels.
They will show how strong the current momentum is.
#MAGMA #MAGMAUSTD #MAGMAsignal
12

·
--
Bullish
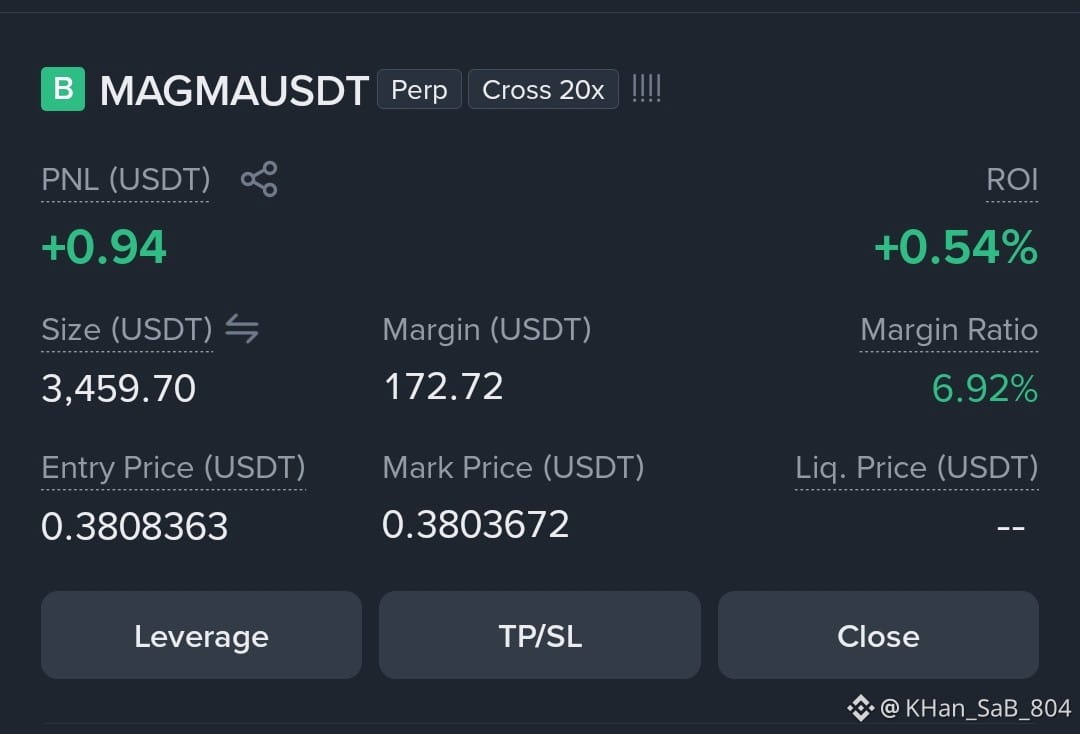
Another Huge Signal Go Long With $MAGMA Huge Pump Loading Don't Miss This Big And Free Signal Dear Crypto Team🔥
{future}(MAGMAUSDT)
#MAGMAUSTD #longpositions #KOSPIFalls3.53%BackBelow6000
Another Huge Signal Go Long With $MAGMA Huge Pump Loading Don't Miss This Big And Free Signal Dear Crypto Team🔥
#MAGMAUSTD #longpositions #KOSPIFalls3.53%BackBelow6000
#MAGMAUSTD #longpositions #KOSPIFalls3.53%BackBelow6000
18

·
--
Bearish
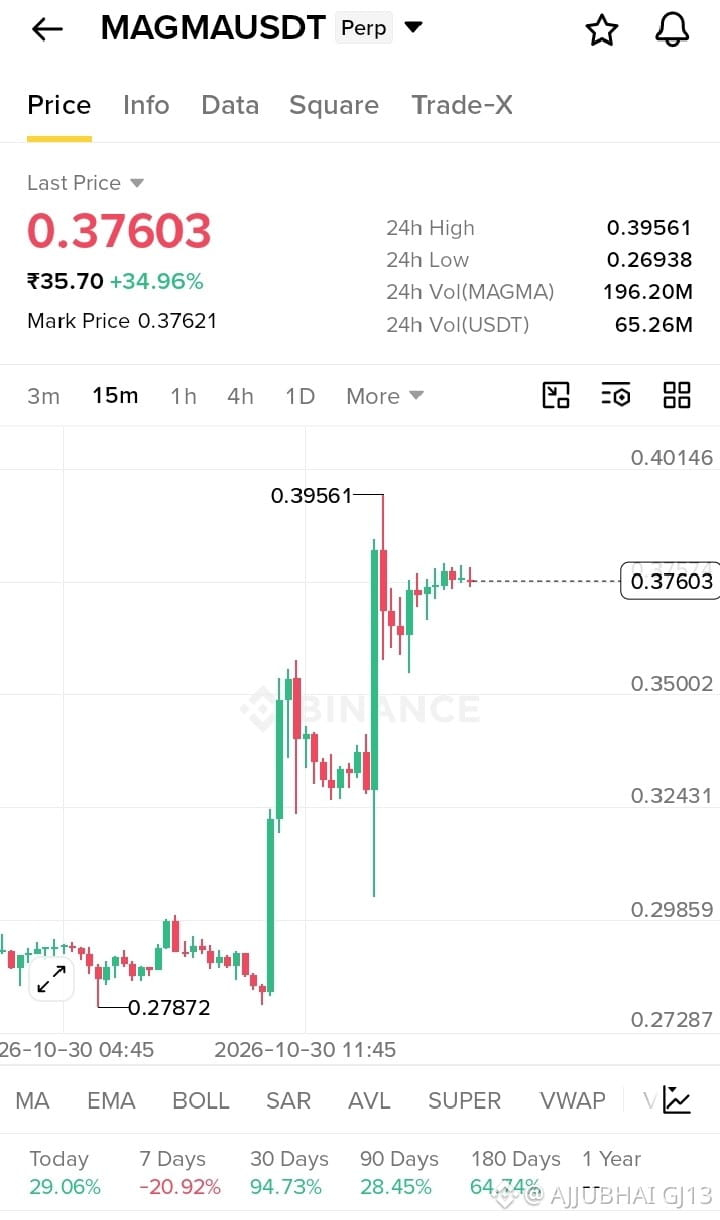
🔴 $MAGMA /USDT – SELL PRESSURE INCOMING?
🎯 Potential Sell Setup:
Entry: 0.3750 – 0.3800
TP1: 0.3650
TP2: 0.3500
TP3: 0.3350
Stop Loss: 0.3970
#MAGMASHORT #MAGMAUSTD
{future}(MAGMAUSDT)
🔴 $MAGMA /USDT – SELL PRESSURE INCOMING?
🎯 Potential Sell Setup:
Entry: 0.3750 – 0.3800
TP1: 0.3650
TP2: 0.3500
TP3: 0.3350
Stop Loss: 0.3970
#MAGMASHORT #MAGMAUSTD
🎯 Potential Sell Setup:
Entry: 0.3750 – 0.3800
TP1: 0.3650
TP2: 0.3500
TP3: 0.3350
Stop Loss: 0.3970
#MAGMASHORT #MAGMAUSTD
1
146

$MAGMA
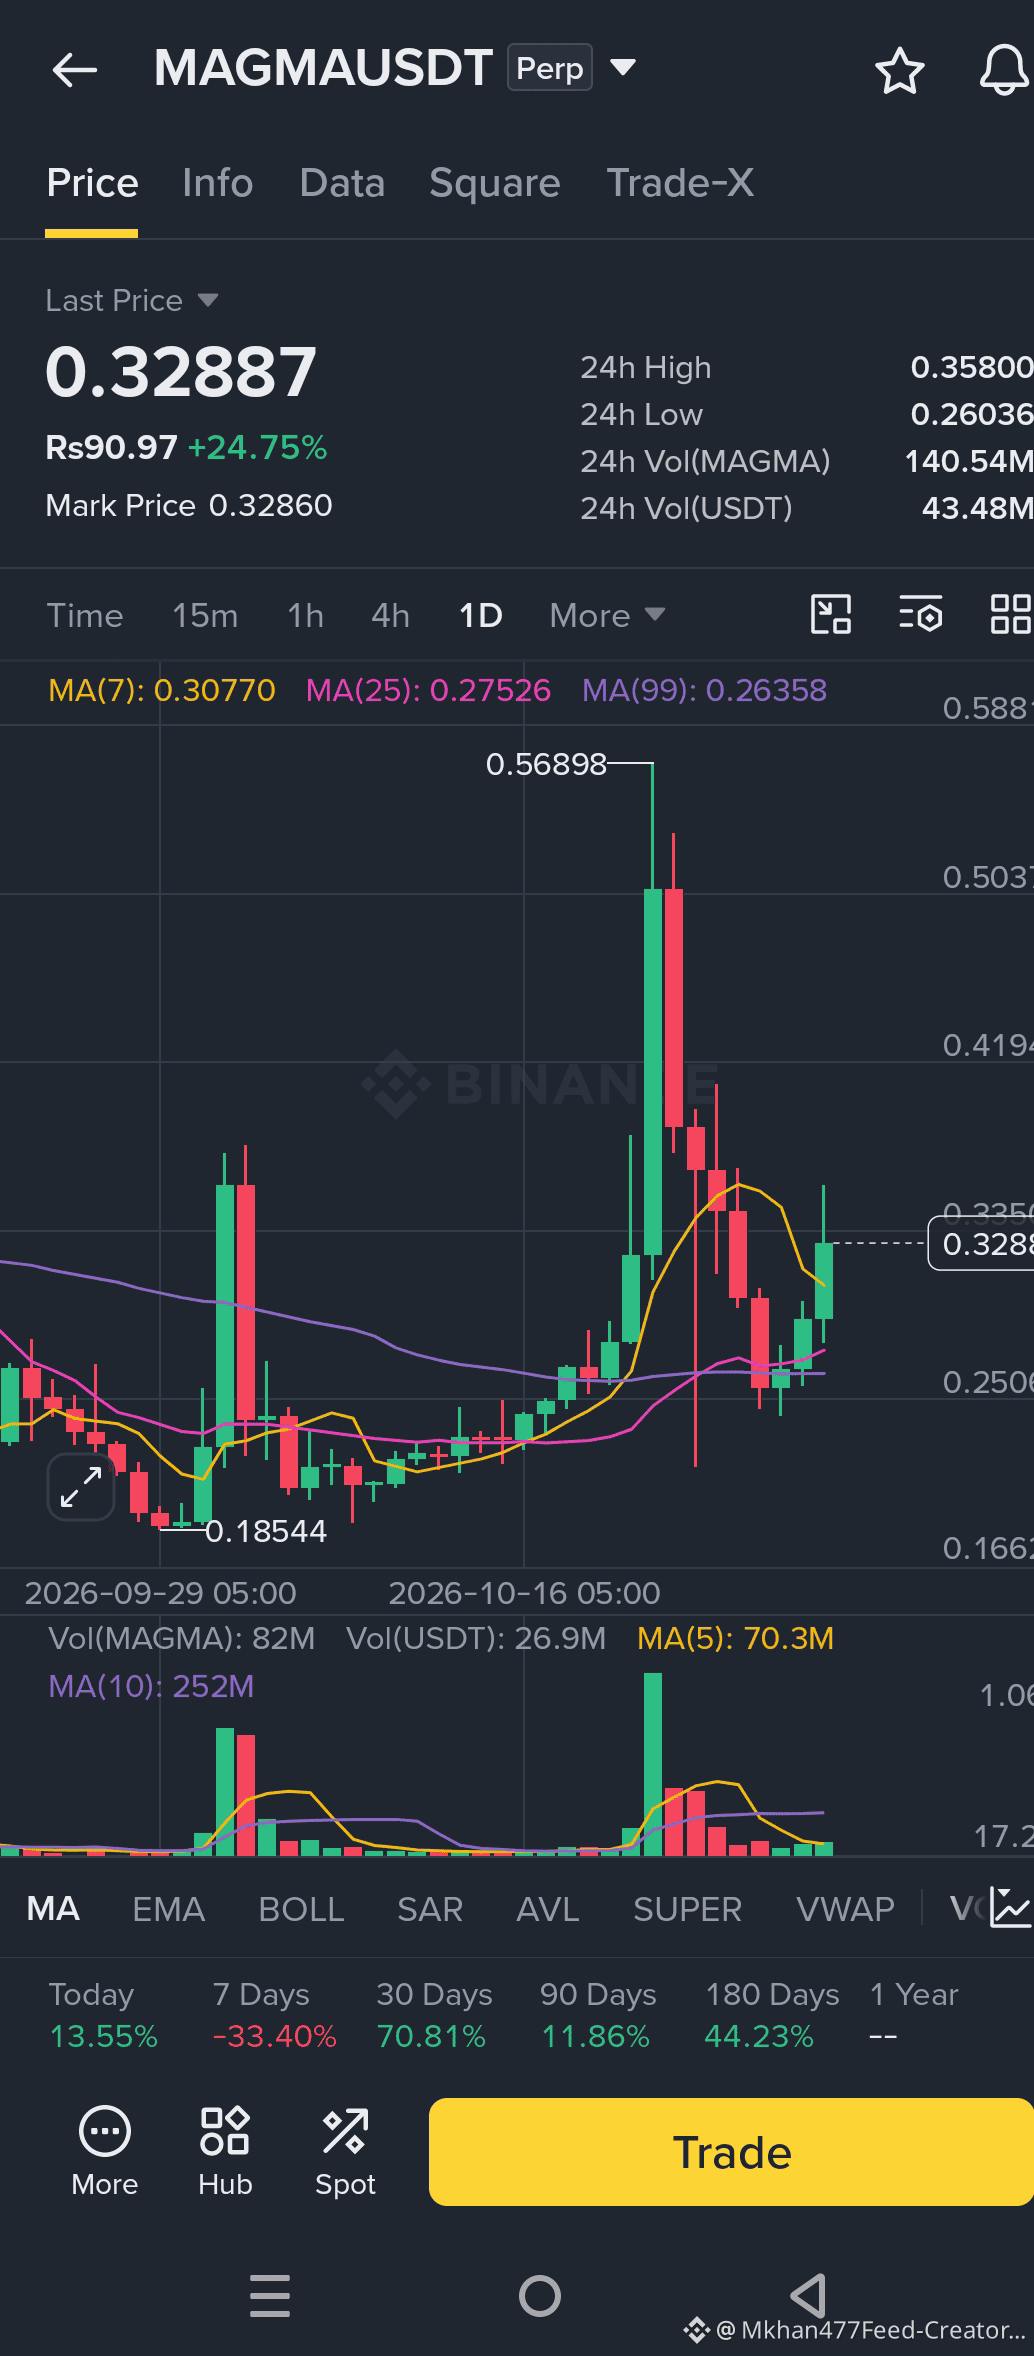
MAGMAUSDT has bullish momentum on the daily chart, but after a sharp price increase, a pullback is possible. Watch the 4-hour candle close and trading volume before making a decision.
🟢 Bullish scenario
If the price breaks above 0.33500–0.34000 with strong buying volume, it could move toward 0.35000–0.35800.
A sustained breakout above 0.35800 would indicate further bullish momentum.
Confirmation: a strong 4-hour candle closes above resistance.
🔴 Bearish scenario
If the price fails to break resistance, profit-taking could push it toward 0.31500–0.30770.
If 0.30770 breaks, the price could test 0.29000–0.27500.
Confirmation: a strong red candle closes below support
.#MAGMAUSTD
168

·
--
Bullish
🚨 $MAGMA Warning!
$MAGMA — Keep shorting this dip if you enjoy watching reversals blast right past you! 📉👀
🟢 LONG ENTRY: $0.308 – $0.322 (retest of the daily MA 7 flip zone)
🛑 STOP-LOSS: $0.272 (clean invalidation below the daily MA 25 support)
🎯 TARGETS: $0.358 |•| $0.420 |•| $0.510.
{future}(MAGMAUSDT)
#TradingCommunity $Q
#MAGMAUSTD
#q
🚨 $MAGMA Warning!
$MAGMA — Keep shorting this dip if you enjoy watching reversals blast right past you! 📉👀
🟢 LONG ENTRY: $0.308 – $0.322 (retest of the daily MA 7 flip zone)
🛑 STOP-LOSS: $0.272 (clean invalidation below the daily MA 25 support)
🎯 TARGETS: $0.358 |•| $0.420 |•| $0.510.
#TradingCommunity $Q
#MAGMAUSTD
#q

Follow for More.
From ApexDesk
山藏金:
,
1
176
·
--
$MAGMA
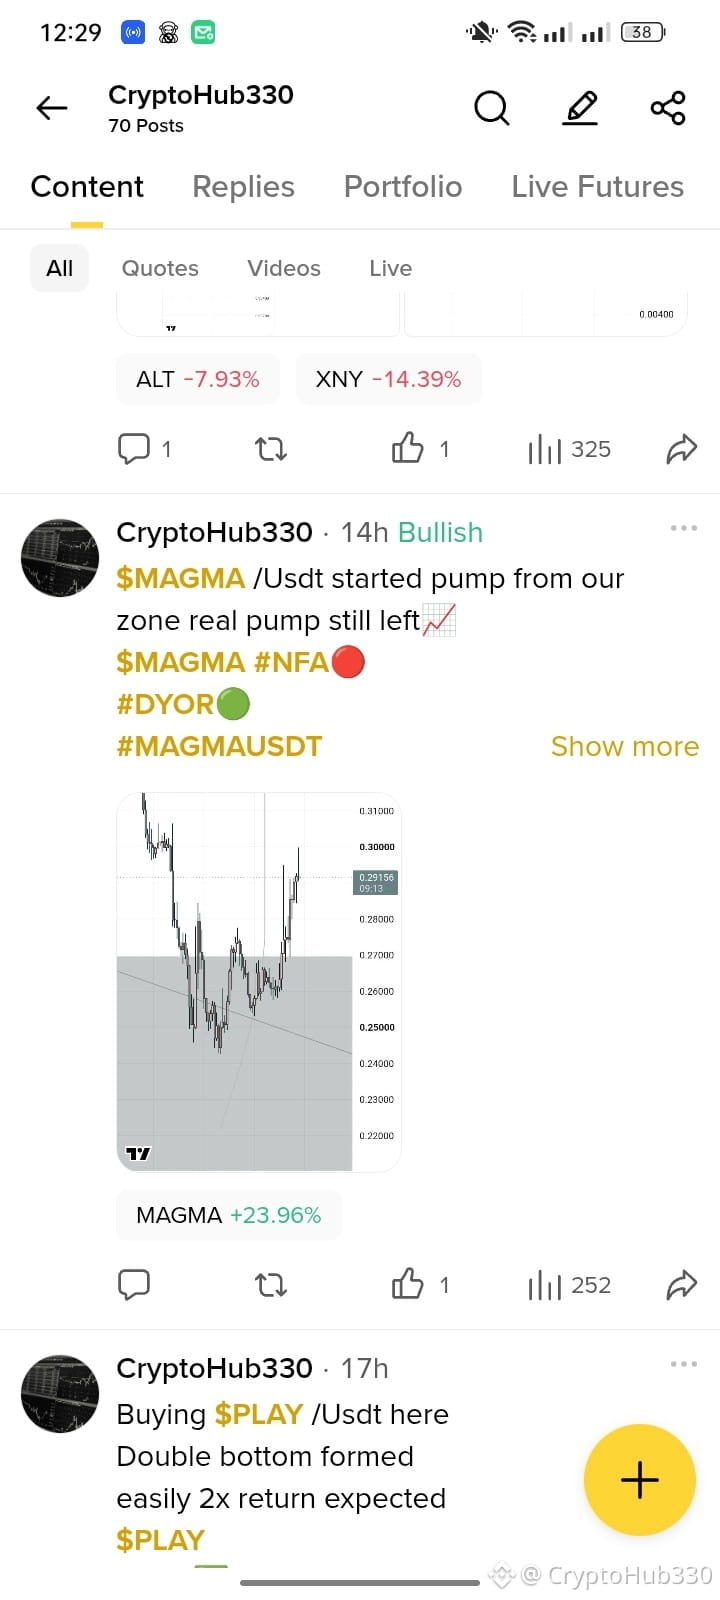
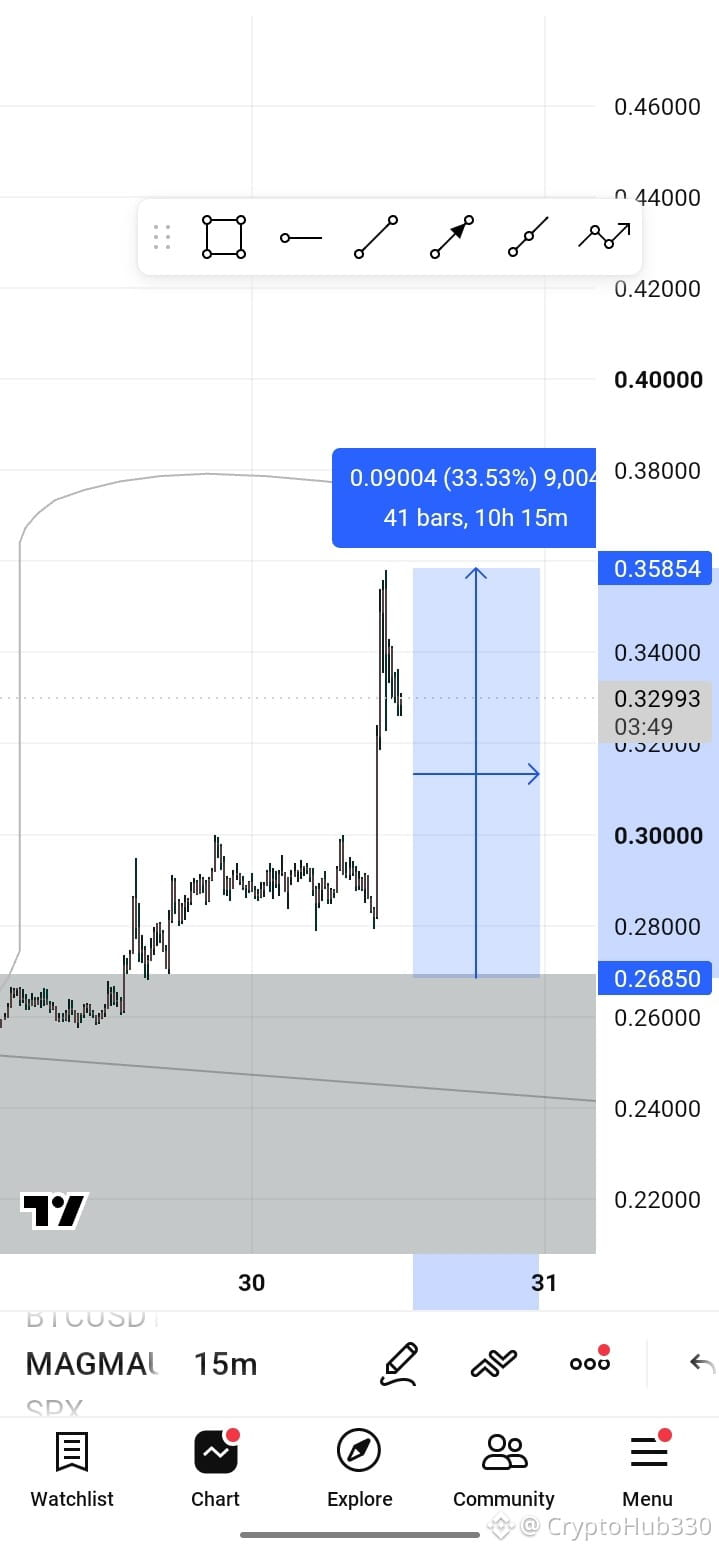
You are getting such trades for free I updated yesterday that the real pump is yet to come in $MAGMA and now after a few hours it pumped 30 percent follow and like for more such trades.
$MAGMA
{alpha}(CT_7840x9f854b3ad20f8161ec0886f15f4a1752bf75d22261556f14cc8d3a1c5d50e529::magma::MAGMA)
#gainer
#MAGMAUSTD
#NFA✅
$MAGMA
You are getting such trades for free I updated yesterday that the real pump is yet to come in $MAGMA and now after a few hours it pumped 30 percent follow and like for more such trades.
$MAGMA
#gainer
#MAGMAUSTD
#NFA✅
You are getting such trades for free I updated yesterday that the real pump is yet to come in $MAGMA and now after a few hours it pumped 30 percent follow and like for more such trades.
$MAGMA
#gainer
#MAGMAUSTD
#NFA✅
1
855

·
--
Bullish
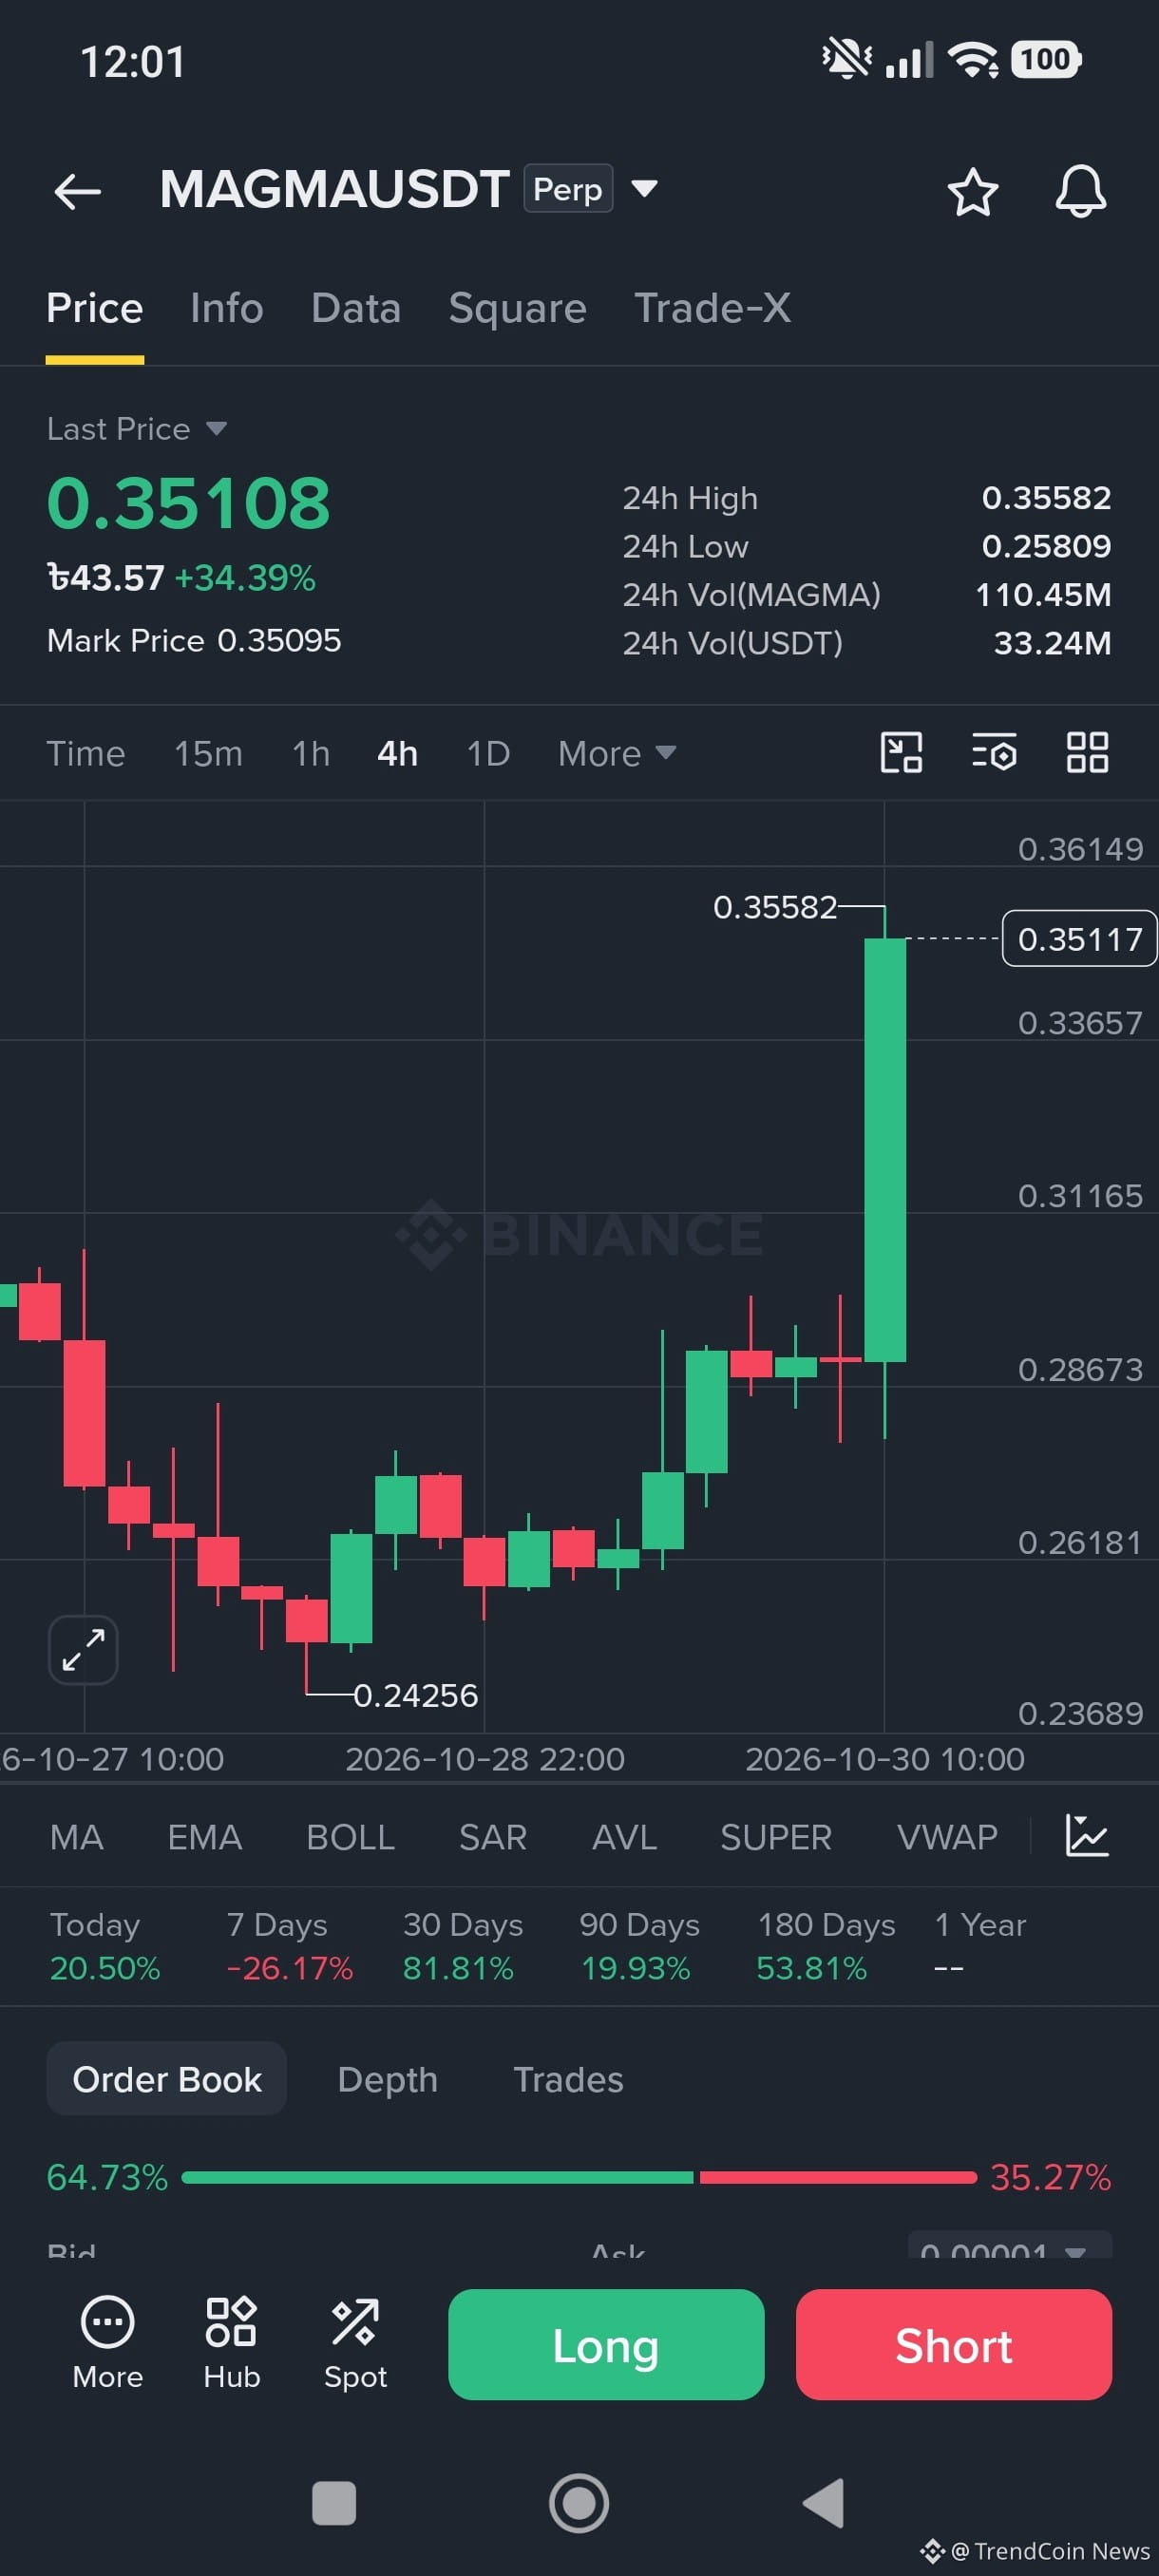
🚩 I AM TELLING YOU GUYS, $MAGMA WILL REACH $0.3800 SOON 💪🚀
Current Price: $0.35108 (+34.39%)
Watch $0.35582 → $0.36149 → $0.3800
TRADE HERE 👇
{future}(MAGMAUSDT)
#MAGMAUSTD #EarningsSeason #USMidtermElections #BinanceWillListPredictPREDICT
🚩 I AM TELLING YOU GUYS, $MAGMA WILL REACH $0.3800 SOON 💪🚀
Current Price: $0.35108 (+34.39%)
Watch $0.35582 → $0.36149 → $0.3800
TRADE HERE 👇
#MAGMAUSTD #EarningsSeason #USMidtermElections #BinanceWillListPredictPREDICT
Current Price: $0.35108 (+34.39%)
Watch $0.35582 → $0.36149 → $0.3800
TRADE HERE 👇
#MAGMAUSTD #EarningsSeason #USMidtermElections #BinanceWillListPredictPREDICT
1
30

·
--
Bullish
🌅☀️ GOOD MORNING, BINANCE CRYPTO FAMILY! 🟡🚀
💚📈 MOMENTUM WATCH:
👉👉👉 $MAGMA
👉👉👉 $CAP
👉👉👉 $APR
🔥 These three coins are catching traders’ attention as momentum continues to build! Are you holding any of them in your portfolio, or are you watching for the next opportunity? 👀💎
💬 Drop your favorite coin in the comments! 👇
⚠️ Remember: Always DYOR, confirm market trends, and manage your risk before making any trading decisions. 🚀🛡️
#KumailAbbasAkmal #MAGMAUSTD #CAP #APR #FedWatch
{future}(CAPUSDT)
{future}(MAGMAUSDT)
{future}(APRUSDT)
🌅☀️ GOOD MORNING, BINANCE CRYPTO FAMILY! 🟡🚀
💚📈 MOMENTUM WATCH:
👉👉👉 $MAGMA
👉👉👉 $CAP
👉👉👉 $APR
🔥 These three coins are catching traders’ attention as momentum continues to build! Are you holding any of them in your portfolio, or are you watching for the next opportunity? 👀💎
💬 Drop your favorite coin in the comments! 👇
⚠️ Remember: Always DYOR, confirm market trends, and manage your risk before making any trading decisions. 🚀🛡️
#KumailAbbasAkmal #MAGMAUSTD #CAP #APR #FedWatch
663

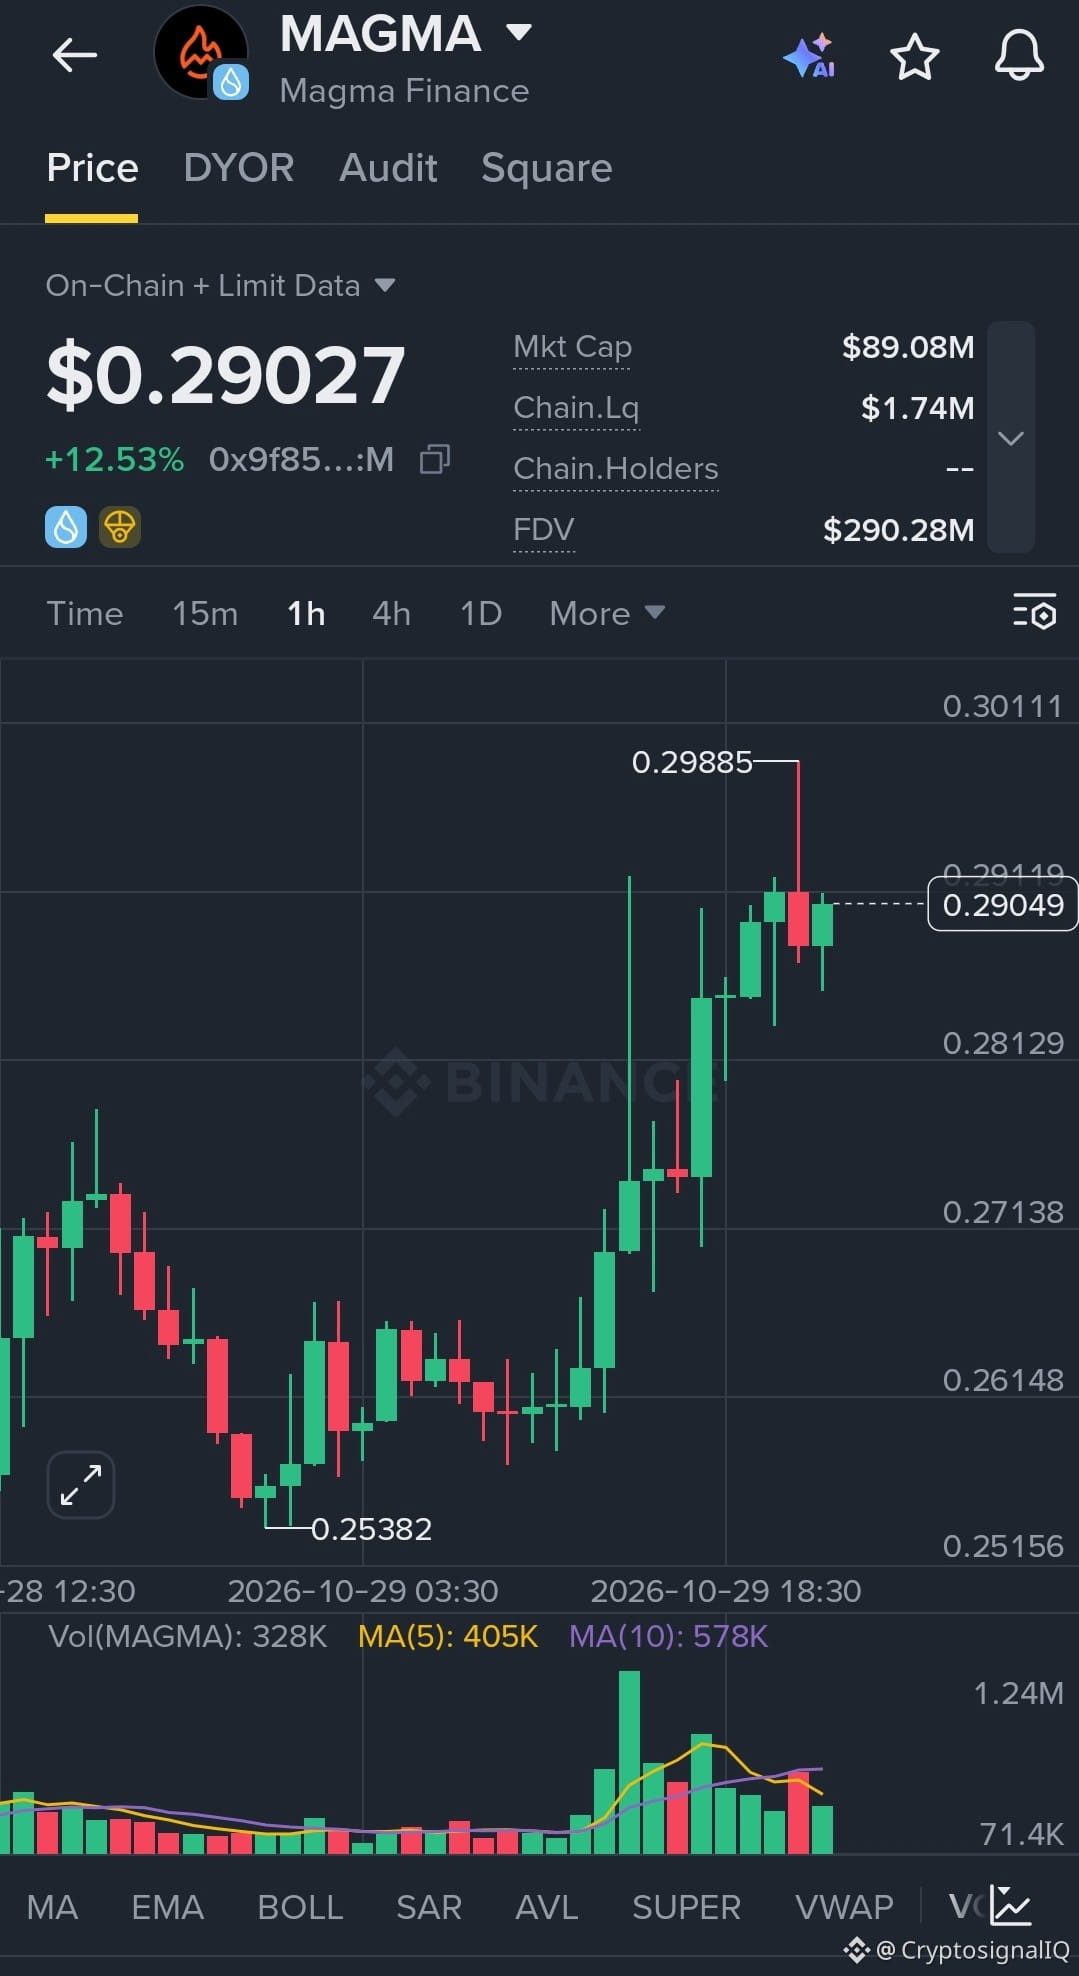
$MAGMA — Buyers have pushed price from $0.2538 to nearly $0.3000, but that resistance is the next big test.
Entry: $0.2840–$0.2900
🎯 TP1: $0.2990
🎯 TP2: $0.3100
🎯 TP3: $0.3250
🛑 SL: $0.2760
The 1H chart is holding a strong recovery structure, but the upper wick near $0.2989 shows sellers are still defending the highs. A clean breakout with volume could unlock further upside — wait for confirmation instead of chasing the move.
Trade #MAGMAUSTD
{alpha}(CT_7840x9f854b3ad20f8161ec0886f15f4a1752bf75d22261556f14cc8d3a1c5d50e529::magma::MAGMA)
$WARD
{alpha}(560xf5cb7cc90040aa717a16887c8b7d7c10a7c60984)
$PARTI
{future}(PARTIUSDT)
$MAGMA — Buyers have pushed price from $0.2538 to nearly $0.3000, but that resistance is the next big test.
Entry: $0.2840–$0.2900
🎯 TP1: $0.2990
🎯 TP2: $0.3100
🎯 TP3: $0.3250
🛑 SL: $0.2760
The 1H chart is holding a strong recovery structure, but the upper wick near $0.2989 shows sellers are still defending the highs. A clean breakout with volume could unlock further upside — wait for confirmation instead of chasing the move.
Trade #MAGMAUSTD
$WARD
$PARTI
1
1.4k
·
--
Bullish
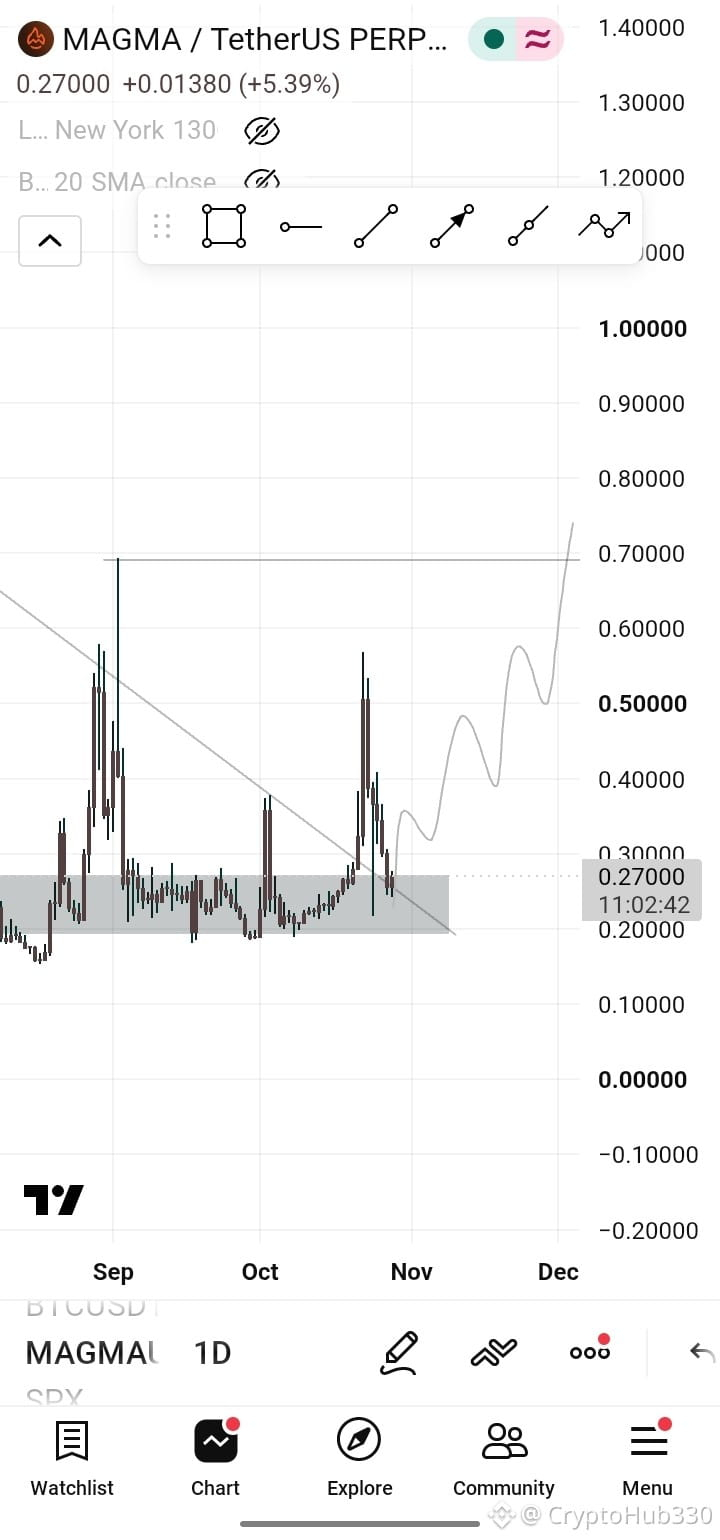
Buying $MAGMA /Usdt here
$MAGMA is still in the zone good buying momentum is expected soon it will come in top gainers.
$MAGMA
{alpha}(CT_7840x9f854b3ad20f8161ec0886f15f4a1752bf75d22261556f14cc8d3a1c5d50e529::magma::MAGMA)
#NFA✅
#DYOR🟢
#MAGMAUSTD
Buying $MAGMA /Usdt here
$MAGMA is still in the zone good buying momentum is expected soon it will come in top gainers.
$MAGMA
#NFA✅
#DYOR🟢
#MAGMAUSTD
$MAGMA is still in the zone good buying momentum is expected soon it will come in top gainers.
$MAGMA
#NFA✅
#DYOR🟢
#MAGMAUSTD
2
322

·
--
Bullish
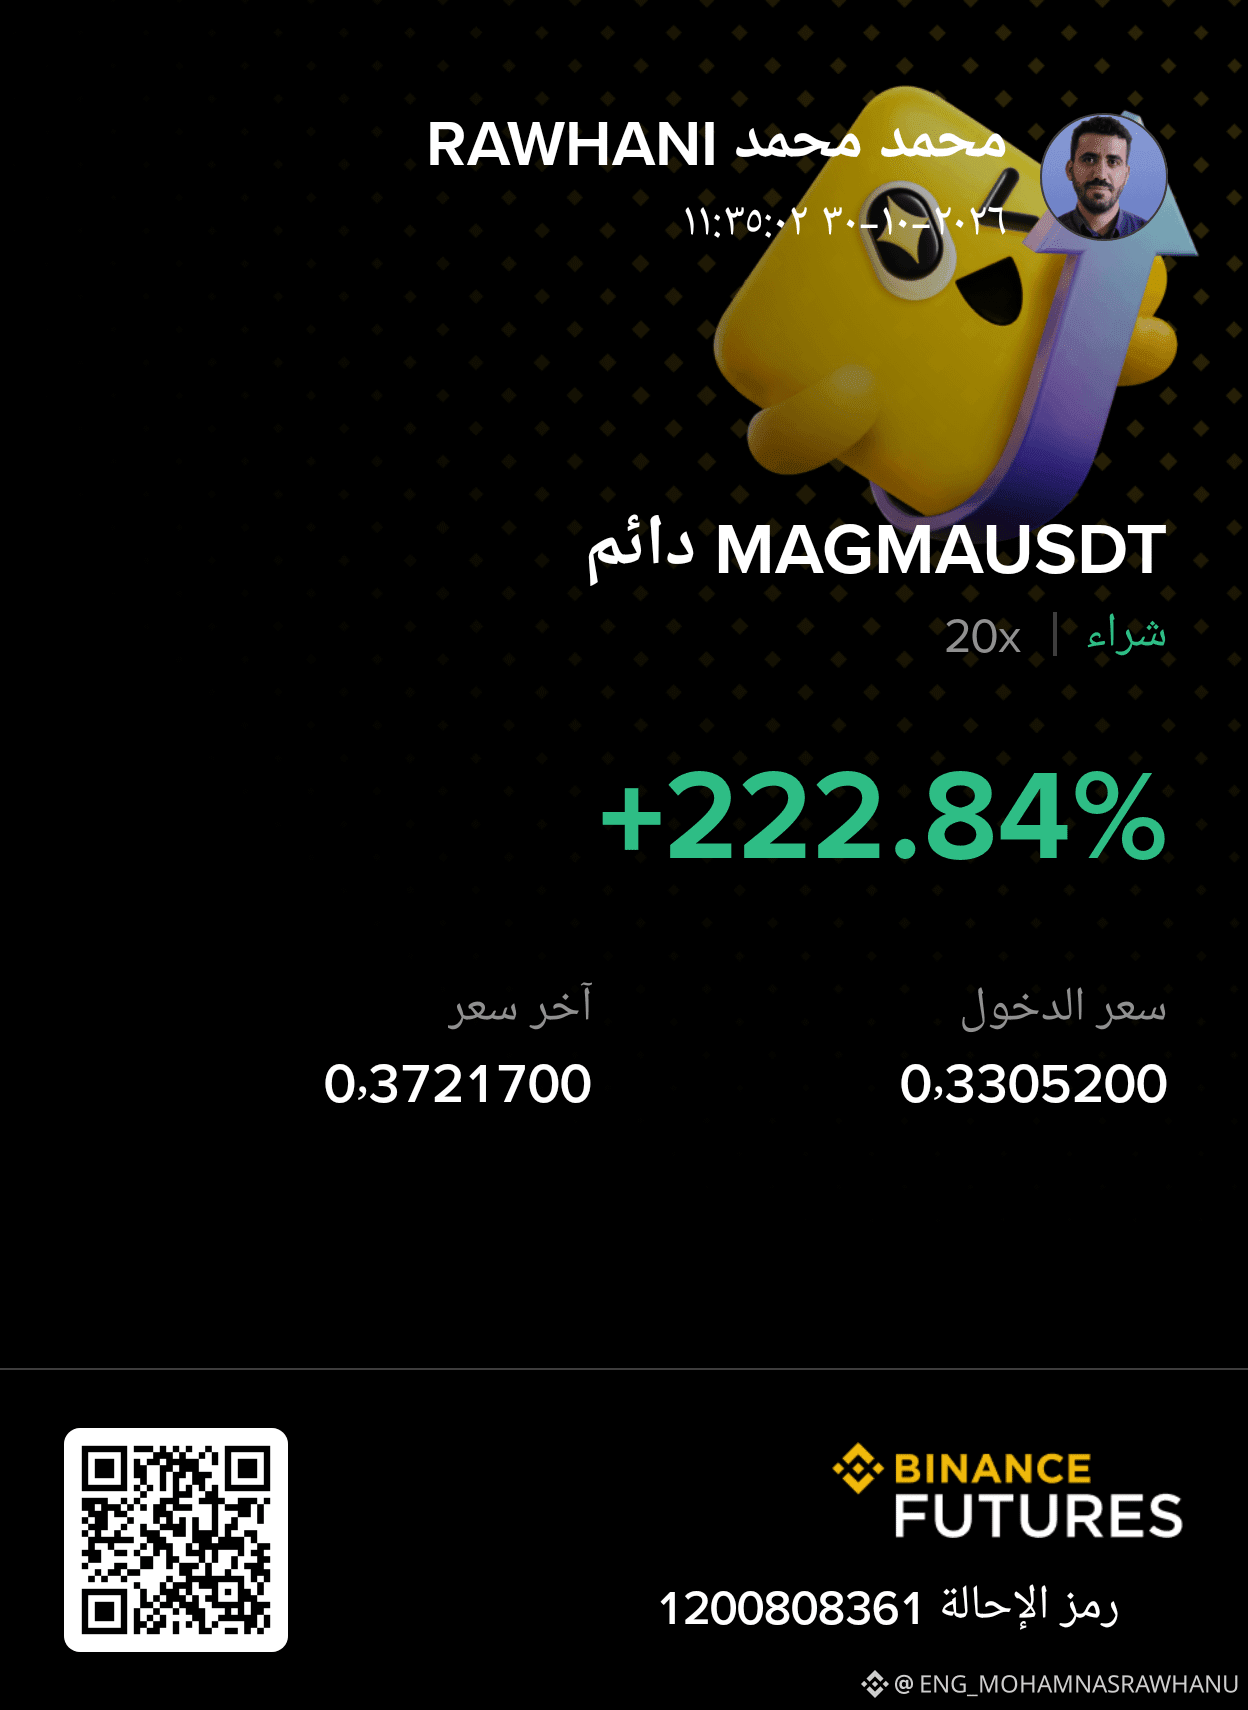
I entered our trade and hit the target right away $MAGMA
{future}(MAGMAUSDT)
This currency is for everyone 😂
#MAGMAUSTD
$Q
{future}(QUSDT)
I entered our trade and hit the target right away $MAGMA
This currency is for everyone 😂
#MAGMAUSTD
$Q
This currency is for everyone 😂
#MAGMAUSTD
$Q
1
102
·
--
$MAGMA
{future}(MAGMAUSDT)
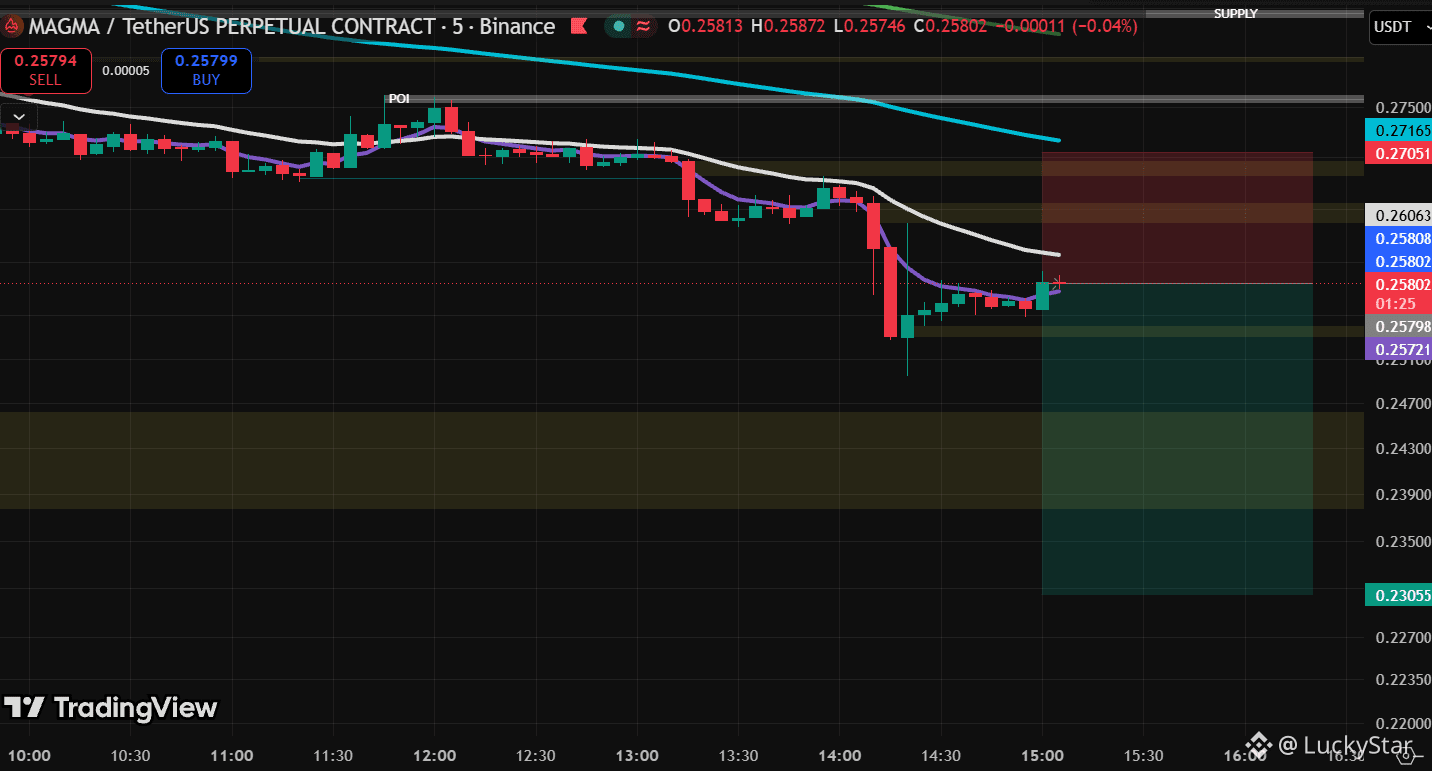
Short setup emerging
📈 While most are arguing about the direction, the market is already starting to leave clues.
Price just pushed into a key supply zone after a recovery, and volume is already starting to drop off.
Momentum on chart is showing bearish — the first sign that the move is losing steam.
Are you shorting this rejection or waiting for a breakdown confirmation?
#MAGMA #MAGMASHORT #MAGMAUSTD
$MAGMA
Short setup emerging
📈 While most are arguing about the direction, the market is already starting to leave clues.
Price just pushed into a key supply zone after a recovery, and volume is already starting to drop off.
Momentum on chart is showing bearish — the first sign that the move is losing steam.
Are you shorting this rejection or waiting for a breakdown confirmation?
#MAGMA #MAGMASHORT #MAGMAUSTD
11

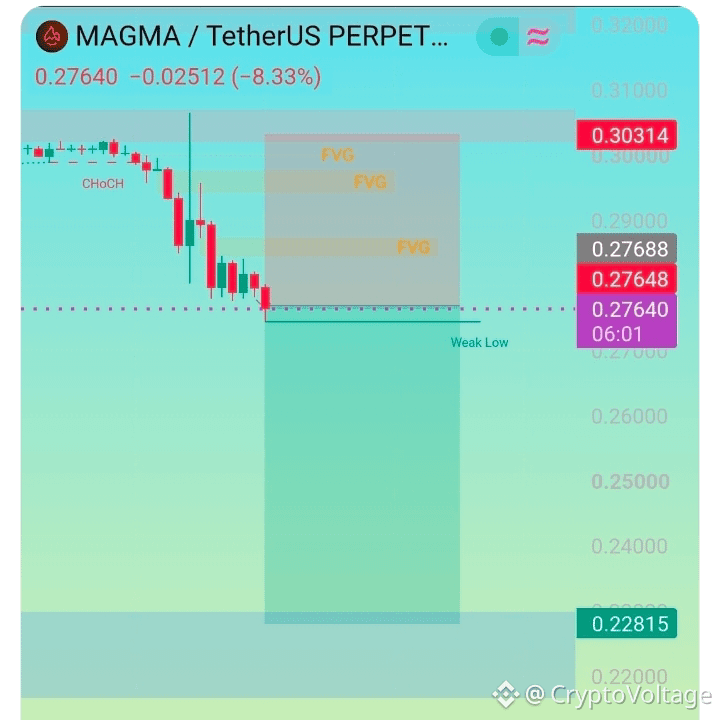
📉 $MAGMA Bears Are Taking Control — More Downside Ahead?
$MAGMA is showing signs of bearish pressure, with sellers looking to push the price lower. If the rejection continues and buyers fail to regain control, the next support zone could come into focus.
🔻 Potential SHORT Setup
{future}(MAGMAUSDT)
- Entry Zone: $0.2850–$0.2950
- 🎯 Take Profit: $0.2300
- 🛑 Stop Loss: $0.3045
📊 What to watch: A strong rejection within the entry zone could support the bearish setup. However, a breakout above $0.3045 would invalidate this trade idea.
Bears have a level to defend, but confirmation is key. Avoid entering blindly and manage your risk.
What’s your view on $MAGMA — more downside or a bullish reversal?
follw me @QueenOfCharts
#MAGMAUSTD #cryptotrading #ShortSetup #TechnicalAnalysis #BinanceSquare
📉 $MAGMA Bears Are Taking Control — More Downside Ahead?
$MAGMA is showing signs of bearish pressure, with sellers looking to push the price lower. If the rejection continues and buyers fail to regain control, the next support zone could come into focus.
🔻 Potential SHORT Setup
- Entry Zone: $0.2850–$0.2950
- 🎯 Take Profit: $0.2300
- 🛑 Stop Loss: $0.3045
📊 What to watch: A strong rejection within the entry zone could support the bearish setup. However, a breakout above $0.3045 would invalidate this trade idea.
Bears have a level to defend, but confirmation is key. Avoid entering blindly and manage your risk.
What’s your view on $MAGMA — more downside or a bullish reversal?
follw me @CryptoVoltage
#MAGMAUSTD #cryptotrading #ShortSetup #TechnicalAnalysis #BinanceSquare
1
188
·
--
Bearish
MAGMA recorded $2.5493K in long liquidations around $0.30484.
I’m watching for further weakness or a quick recovery.
$MAGMA
{future}(MAGMAUSDT)
$BULLA
{future}(BULLAUSDT)
$DOOD
{future}(DOODUSDT)
🔴 LIQUIDITY ZONE HIT 🔴
Long liquidation spotted 🧨
$2.5493K cleared at $0.30484
Downside liquidity swept — watch reaction 👀
🎯 TP Targets:
TP1: ~$0.3030
TP2: ~$0.3010
TP3: ~$0.2990
#MAGMAUSTD
MAGMA recorded $2.5493K in long liquidations around $0.30484.
I’m watching for further weakness or a quick recovery.
$MAGMA
$BULLA
$DOOD
🔴 LIQUIDITY ZONE HIT 🔴
Long liquidation spotted 🧨
$2.5493K cleared at $0.30484
Downside liquidity swept — watch reaction 👀
🎯 TP Targets:
TP1: ~$0.3030
TP2: ~$0.3010
TP3: ~$0.2990
#MAGMAUSTD
I’m watching for further weakness or a quick recovery.
$MAGMA
$BULLA
$DOOD
🔴 LIQUIDITY ZONE HIT 🔴
Long liquidation spotted 🧨
$2.5493K cleared at $0.30484
Downside liquidity swept — watch reaction 👀
🎯 TP Targets:
TP1: ~$0.3030
TP2: ~$0.3010
TP3: ~$0.2990
#MAGMAUSTD
157

·
--
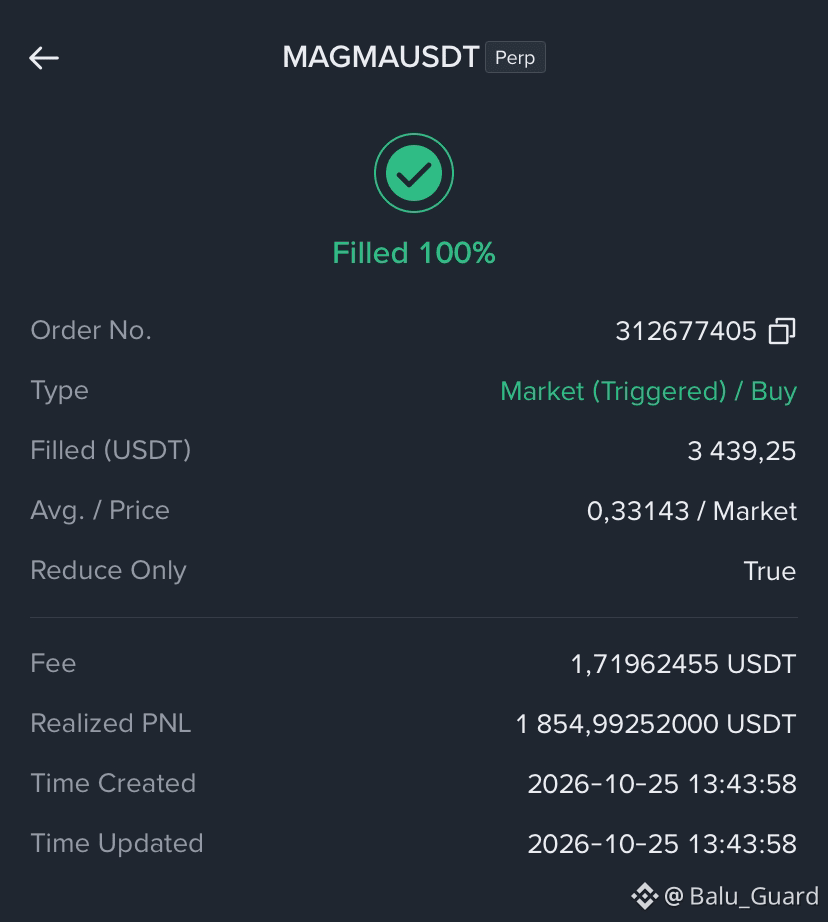
$MAGMA SHORT CLOSED! 🎯💰
As I mentioned earlier, I’m closing my short position on $MAGMA.
+$1,850 PROFIT! 💵🐻
Patience, discipline, and taking profits. 📉💎
Who caught this move with me? 👀🔥
$DOOD $ERA
#MAGMAUSTD #cryptotrading #profit #Altcoins
{future}(MAGMAUSDT)
{future}(ERAUSDT)
{future}(DOODUSDT)
$MAGMA SHORT CLOSED! 🎯💰
As I mentioned earlier, I’m closing my short position on $MAGMA .
+$1,850 PROFIT! 💵🐻
Patience, discipline, and taking profits. 📉💎
Who caught this move with me? 👀🔥
$DOOD $ERA
#MAGMAUSTD #cryptotrading #profit #Altcoins
As I mentioned earlier, I’m closing my short position on $MAGMA .
+$1,850 PROFIT! 💵🐻
Patience, discipline, and taking profits. 📉💎
Who caught this move with me? 👀🔥
$DOOD $ERA
#MAGMAUSTD #cryptotrading #profit #Altcoins
1
96

·
--
Bullish
$MAGMA
Latest Update 🚀
Price:Around $0.3337 - $0.3394 (may change quickly).
Price increase:$MAGMA has pumped huge — up +23.25% today.
{future}(MAGMAUSDT)
Trading:Many people trading $MAGMA on Binance, Bybit, OKX, Bitget, KuCoin, MEXC, Gate. High volatility perp.
#MAGMAUSTD #magmafinance #crypt #perp
$MAGMA
Latest Update 🚀
Price:Around $0.3337 - $0.3394 (may change quickly).
Price increase:$MAGMA has pumped huge — up +23.25% today.
Trading:Many people trading $MAGMA on Binance, Bybit, OKX, Bitget, KuCoin, MEXC, Gate. High volatility perp.
#MAGMAUSTD #magmafinance #crypt #perp
Latest Update 🚀
Price:Around $0.3337 - $0.3394 (may change quickly).
Price increase:$MAGMA has pumped huge — up +23.25% today.
Trading:Many people trading $MAGMA on Binance, Bybit, OKX, Bitget, KuCoin, MEXC, Gate. High volatility perp.
#MAGMAUSTD #magmafinance #crypt #perp

73
Log in to explore more content
Join global crypto users on Binance Square
⚡️ Get latest and useful information about crypto.
💬 Trusted by the world’s largest crypto exchange.
👍 Discover real insights from verified creators.
Email / Phone number
Trending Topics
1
#BinanceRecovery90% of stolen assets
13,847 views
73 Discussing
2
#YiHe:ProofOfReserves:10TokensAt100%Backing
42,668 views
205 Discussing
3
#BackedNotBroken:RichardTengSaysUsersBearNoLoss
1,198 views
113 Discussing
4
#CZSaysCompensationIsinPlaceUsersAreProtected
66,188 views
914 Discussing
5
#IntelHasItsWorstDaySince1974
15,756 views
399 Discussing
6
#TRMCambodianCasinosReceived$1.07BInCrypto
3,704 views
56 Discussing
7
#USDCCirculationFallsAbout800MInSevenDays
35,699 views
560 Discussing
8
#SuspectedNorthKoreaAttacksAccountForNearly89%OfCryptoHackLosses
9,928 views
79 Discussing
9
#OpenAICutsFundraisingTargetBy$10B
2,372 views
65 Discussing
10
#ASICHasReceivedNoPredictionMarketApplications
46,710 views
941 Discussing