
#ma200
ma200
14,976 views
27 Discussing
Hot
Latest


Most retail traders focus only on short-term candles…
But smart money watches the bigger structure.
That’s where MA99 and MA200 become extremely important in crypto trading.
These aren’t just random lines on a chart.
They represent market psychology on a much larger scale. 🧠
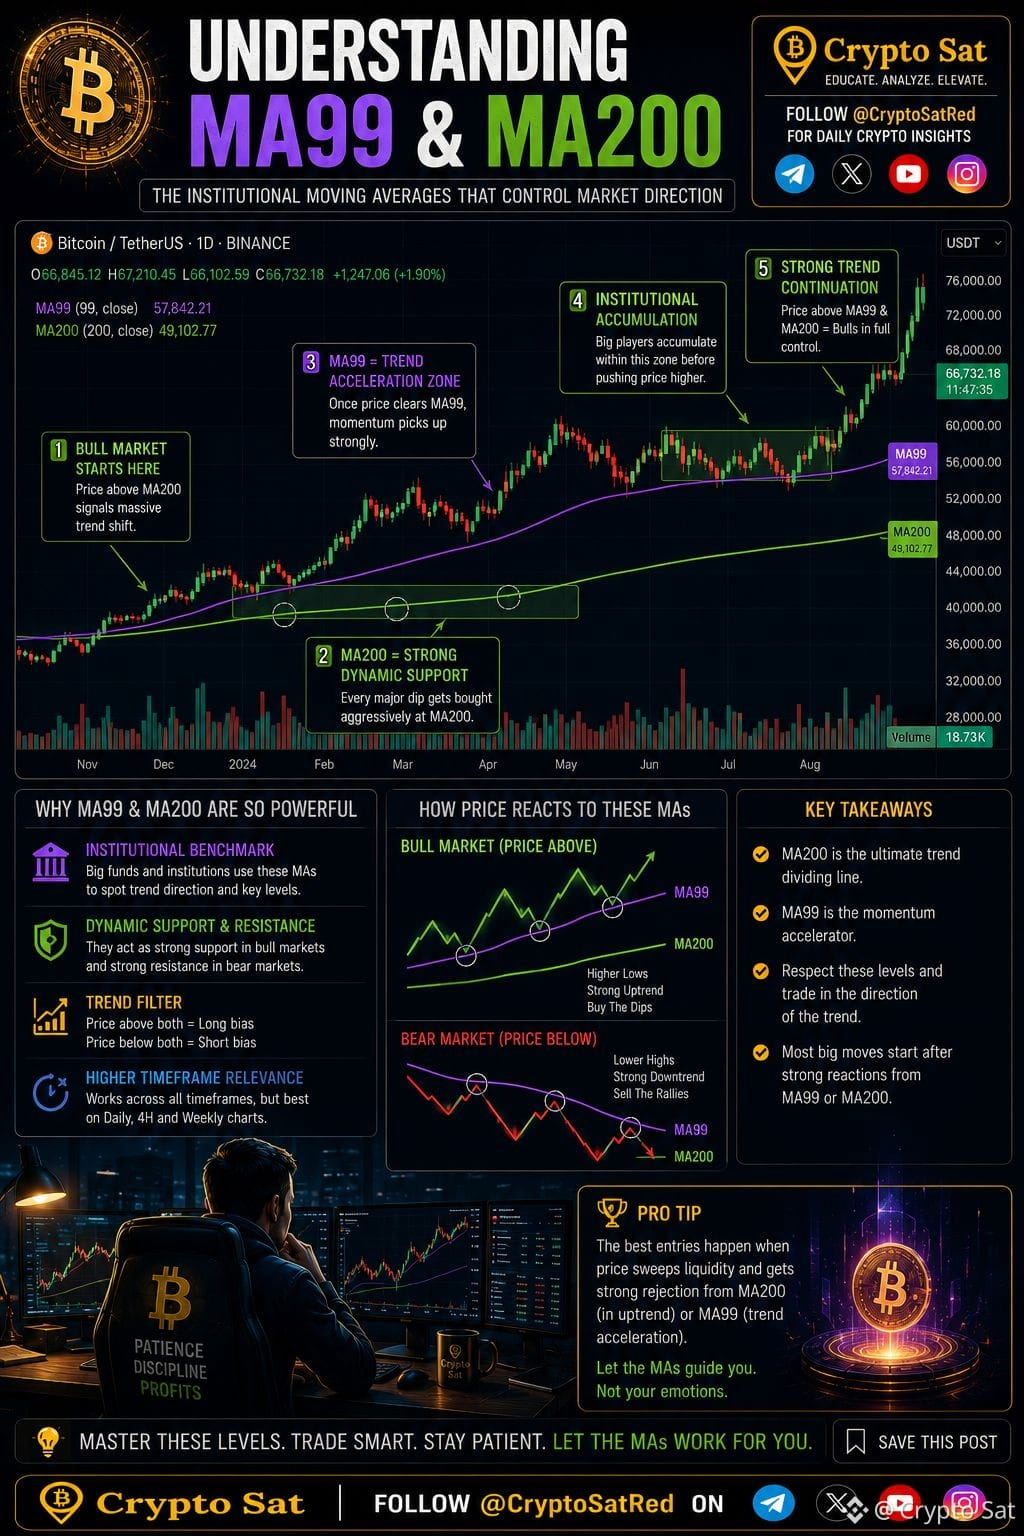
🔹 MA99 = Mid-term trend
🔹 MA200 = Macro trend
MA99 helps traders understand the medium-term market structure.
When $BTC stays above MA99, it usually signals that momentum and trend structure are still healthy.
During bull markets, BTC often pulls back into MA99, finds support, and continues higher.
That’s why many swing traders use MA99 as a dynamic support zone instead of panicking during corrections.
Now let’s talk about the real heavyweight: #MA200
The MA200 is one of the most respected indicators in all financial markets — not just crypto.
Institutions, hedge funds, algorithmic traders, and large investors all monitor it closely.
Why?
Because MA200 helps define the overall macro direction of the market.
When #Bitcoin trades above MA200:
🟢 Long-term sentiment is usually bullish
When BTC trades below MA200:
🔴 Market conditions often become defensive and risk-off
This is why price reacts so aggressively around MA200.
It’s not magic.
It’s liquidity + psychology + massive trader attention combined in one area.
You’ll often notice:
• Strong bounces from MA200
• Violent rejections near MA200
• Huge volume spikes around it
Because smart money is making decisions there.
But here’s the important lesson: Professional traders don’t blindly buy or sell just because price touches MA200.
They combine it with:
🔹 Market structure
🔹 Volume
🔹 Trend strength
🔹 Higher timeframe confirmation
That’s how experienced traders read the market.
Not emotionally…
but structurally.
📌 Learn to understand trend behavior first.
The chart becomes much clearer after that.
But smart money watches the bigger structure.
That’s where MA99 and MA200 become extremely important in crypto trading.
These aren’t just random lines on a chart.
They represent market psychology on a much larger scale. 🧠
🔹 MA99 = Mid-term trend
🔹 MA200 = Macro trend
MA99 helps traders understand the medium-term market structure.
When $BTC stays above MA99, it usually signals that momentum and trend structure are still healthy.
During bull markets, BTC often pulls back into MA99, finds support, and continues higher.
That’s why many swing traders use MA99 as a dynamic support zone instead of panicking during corrections.
Now let’s talk about the real heavyweight: #MA200
The MA200 is one of the most respected indicators in all financial markets — not just crypto.
Institutions, hedge funds, algorithmic traders, and large investors all monitor it closely.
Why?
Because MA200 helps define the overall macro direction of the market.
When #Bitcoin trades above MA200:
🟢 Long-term sentiment is usually bullish
When BTC trades below MA200:
🔴 Market conditions often become defensive and risk-off
This is why price reacts so aggressively around MA200.
It’s not magic.
It’s liquidity + psychology + massive trader attention combined in one area.
You’ll often notice:
• Strong bounces from MA200
• Violent rejections near MA200
• Huge volume spikes around it
Because smart money is making decisions there.
But here’s the important lesson: Professional traders don’t blindly buy or sell just because price touches MA200.
They combine it with:
🔹 Market structure
🔹 Volume
🔹 Trend strength
🔹 Higher timeframe confirmation
That’s how experienced traders read the market.
Not emotionally…
but structurally.
📌 Learn to understand trend behavior first.
The chart becomes much clearer after that.
Crypto Sat
·
--
BullishMA7 vs MA25 — Most Traders use them incorrectly.
They see lines crossing on the chart…
then instantly open a trade without understanding what those lines actually represent.
But MA7 and MA25 tell two completely different stories. 👇
🔹 MA7 = Momentum
🔹 MA25 = Trend
That’s the simplest way to understand it.
MA7 reacts very fast to price movement.
When $BTC suddenly pumps from 102k to 105k, MA7 quickly follows price.
That’s why short-term traders and scalpers love it.
It helps them catch:
• Fast momentum shifts
• Quick pullbacks
• Intraday trend continuation
But there’s a downside:
MA7 gives many fake signals during sideways markets.
Now let’s talk about MA25.
MA25 moves slower and smoother.
Instead of reacting to every small #BTC candle, it focuses more on the actual short-term trend.
Swing traders use MA25 to:
🔹 Hold trades longer
🔹 Avoid market noise
🔹 Stay aligned with trend direction
For example:
If #Bitcoin pulls back to MA25 during an uptrend and holds support, many traders see that as a healthy continuation setup.
This is where crossover strategies become popular.
When:
🟢 MA7 crosses ABOVE MA25
→ Momentum may be turning bullish
When:
🔴 MA7 crosses BELOW MA25
→ Momentum may be weakening
But here’s the important part beginners miss:
Crossovers alone are NOT enough.
Professional traders also check:
• Volume
• Market structure
• Support & resistance
• Higher timeframe trend
Because price can fake crossover signals many times before the real move happens.
That’s why experienced traders don’t blindly follow indicators.
They use MA7 for momentum…
MA25 for direction…
and price action for confirmation.
Learn what the market is doing first.
Indicators become powerful only after understanding trend behavior.
They see lines crossing on the chart…
then instantly open a trade without understanding what those lines actually represent.
But MA7 and MA25 tell two completely different stories. 👇
🔹 MA7 = Momentum
🔹 MA25 = Trend
That’s the simplest way to understand it.
MA7 reacts very fast to price movement.
When $BTC suddenly pumps from 102k to 105k, MA7 quickly follows price.
That’s why short-term traders and scalpers love it.
It helps them catch:
• Fast momentum shifts
• Quick pullbacks
• Intraday trend continuation
But there’s a downside:
MA7 gives many fake signals during sideways markets.
Now let’s talk about MA25.
MA25 moves slower and smoother.
Instead of reacting to every small #BTC candle, it focuses more on the actual short-term trend.
Swing traders use MA25 to:
🔹 Hold trades longer
🔹 Avoid market noise
🔹 Stay aligned with trend direction
For example:
If #Bitcoin pulls back to MA25 during an uptrend and holds support, many traders see that as a healthy continuation setup.
This is where crossover strategies become popular.
When:
🟢 MA7 crosses ABOVE MA25
→ Momentum may be turning bullish
When:
🔴 MA7 crosses BELOW MA25
→ Momentum may be weakening
But here’s the important part beginners miss:
Crossovers alone are NOT enough.
Professional traders also check:
• Volume
• Market structure
• Support & resistance
• Higher timeframe trend
Because price can fake crossover signals many times before the real move happens.
That’s why experienced traders don’t blindly follow indicators.
They use MA7 for momentum…
MA25 for direction…
and price action for confirmation.
Learn what the market is doing first.
Indicators become powerful only after understanding trend behavior.

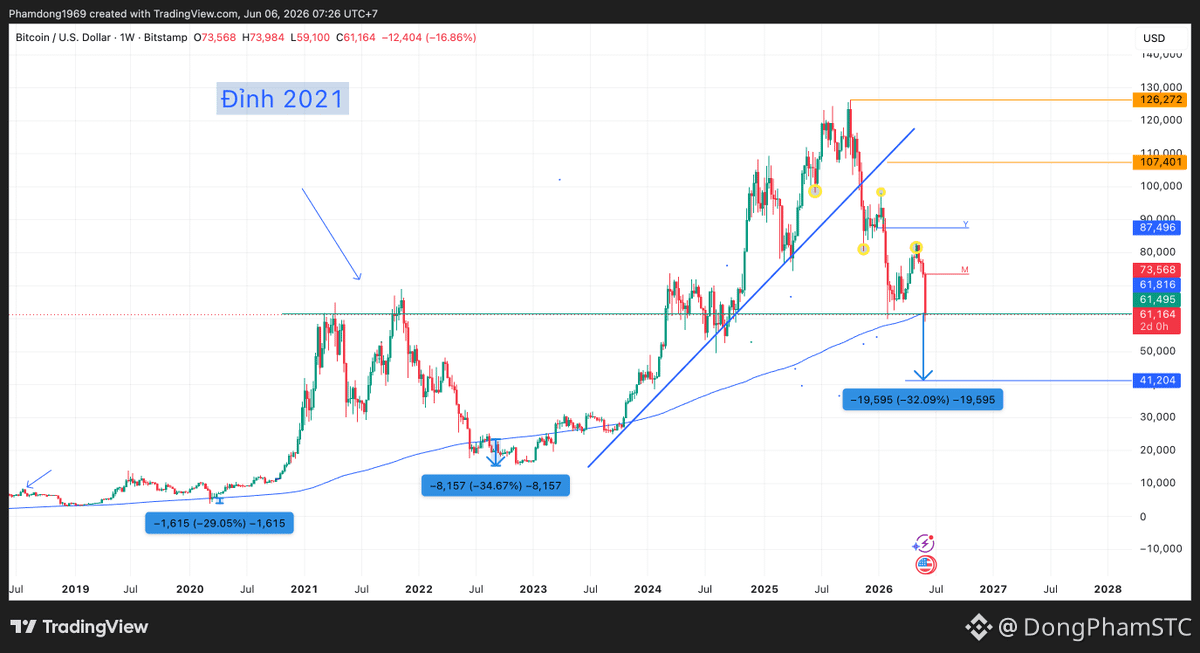
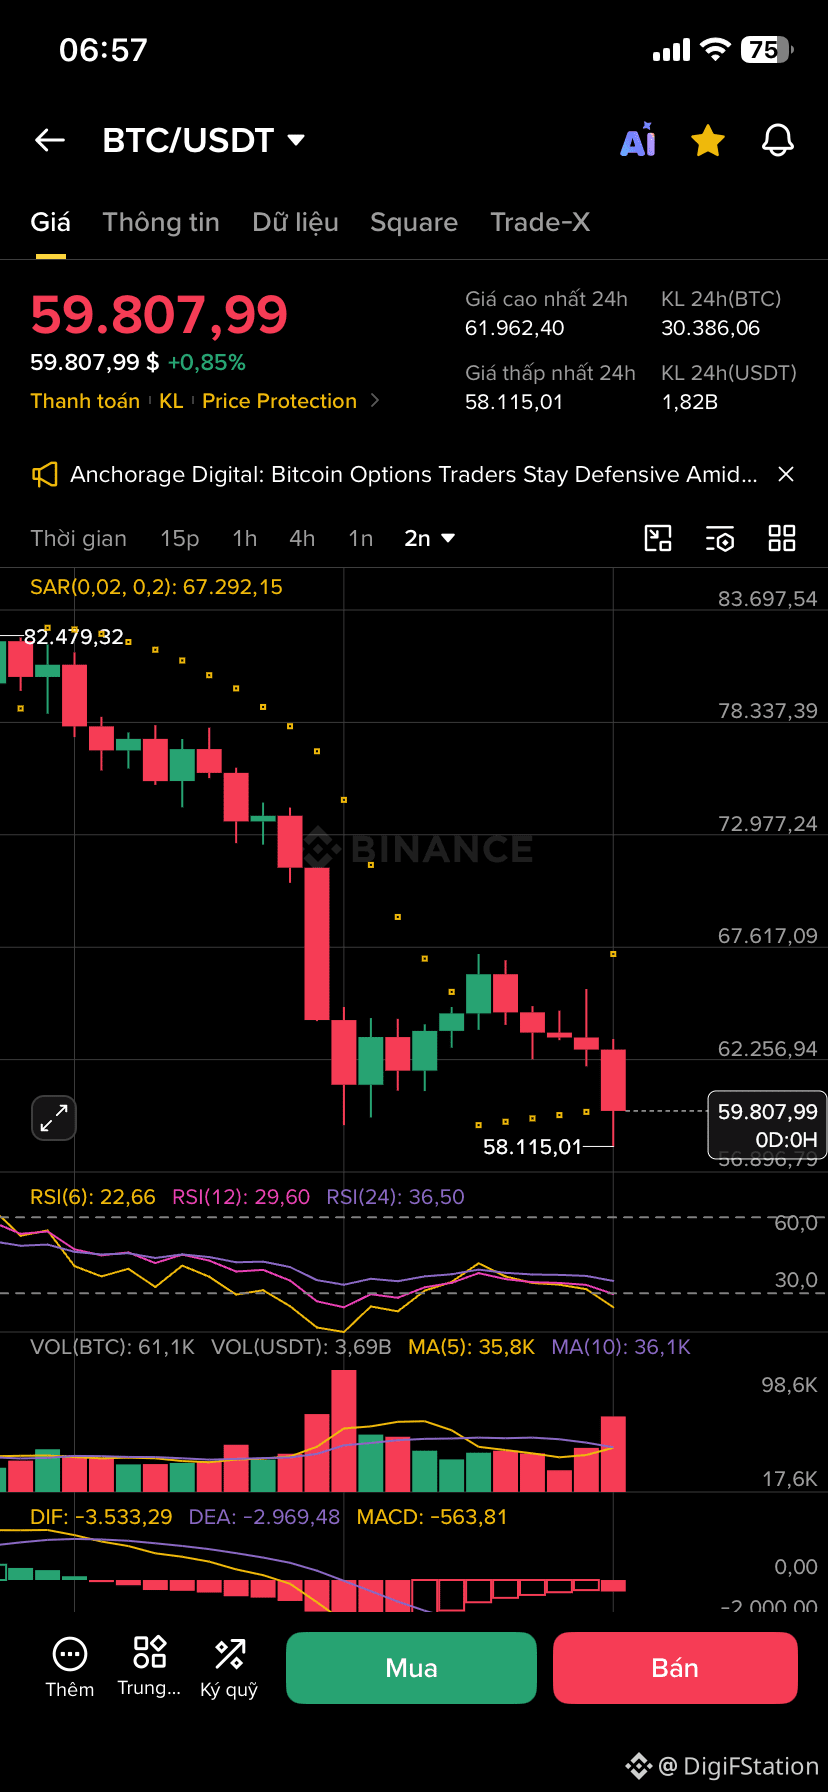
Bitcoin's price just broke below the weekly MA200.
- But last time it broke the MA200, it usually dipped around 30% more before hitting the bottom.
=> Assuming this time it also drops an additional 30% from the weekly MA200, the price would be around 40K.
However, what happened in the past isn't guaranteed to happen now. So, this is just one angle to consider.
#BTC #Bitcoin #MA200 $BTC
- But last time it broke the MA200, it usually dipped around 30% more before hitting the bottom.
=> Assuming this time it also drops an additional 30% from the weekly MA200, the price would be around 40K.
However, what happened in the past isn't guaranteed to happen now. So, this is just one angle to consider.
#BTC #Bitcoin #MA200 $BTC

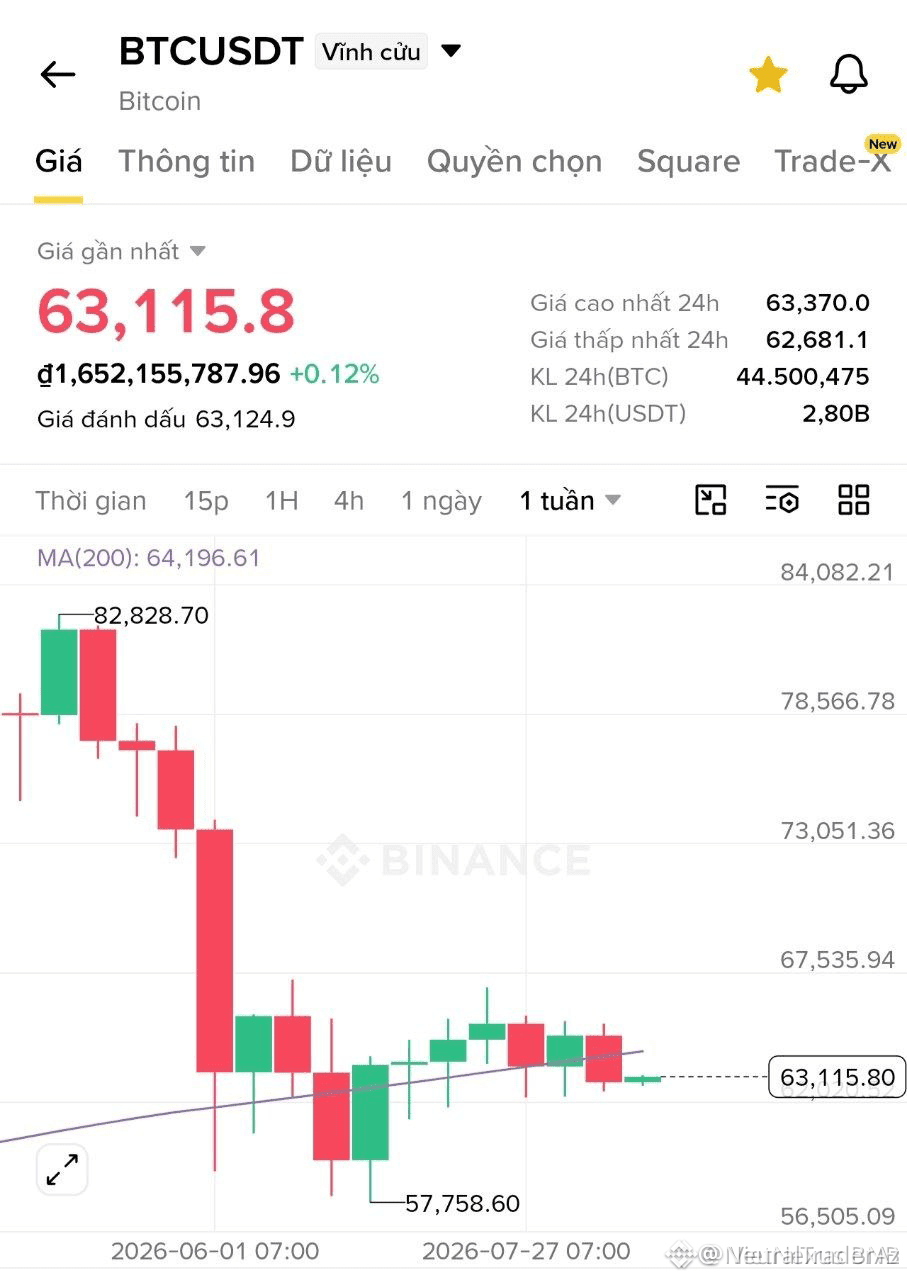
🚨 $BTC TRAPPED IN A $3K RANGE BELOW THE WEEKLY MA200 — FOR HOW LONG? 💥
📊 The weekly MA200 — the level Michael Saylor famously dubbed hard support — has printed a weekly close below. Yet $BTC spent three weeks trapped in a $3,000 range instead of accelerating lower. That lack of follow-through is the tell.
🔍 Smart money rarely telegraphs its next move, but a prolonged coil beneath a broken MA200 often reads as containment before a liquidity sweep. 📌 Watch the range edges: reclaim the MA200 and the bearish narrative flips; lose the low and the path narrows fast.
💬 Are you betting on a MA200 reclaim or waiting for the range low to fail? 👇
⚠️ Not financial advice. Always manage your risk. 🛡️
🏷️ #BTC #Bitcoin #MA200 #Sideways #Crypto
🎯 🦈
📊 The weekly MA200 — the level Michael Saylor famously dubbed hard support — has printed a weekly close below. Yet $BTC spent three weeks trapped in a $3,000 range instead of accelerating lower. That lack of follow-through is the tell.
🔍 Smart money rarely telegraphs its next move, but a prolonged coil beneath a broken MA200 often reads as containment before a liquidity sweep. 📌 Watch the range edges: reclaim the MA200 and the bearish narrative flips; lose the low and the path narrows fast.
💬 Are you betting on a MA200 reclaim or waiting for the range low to fail? 👇
⚠️ Not financial advice. Always manage your risk. 🛡️
🏷️ #BTC #Bitcoin #MA200 #Sideways #Crypto
🎯 🦈

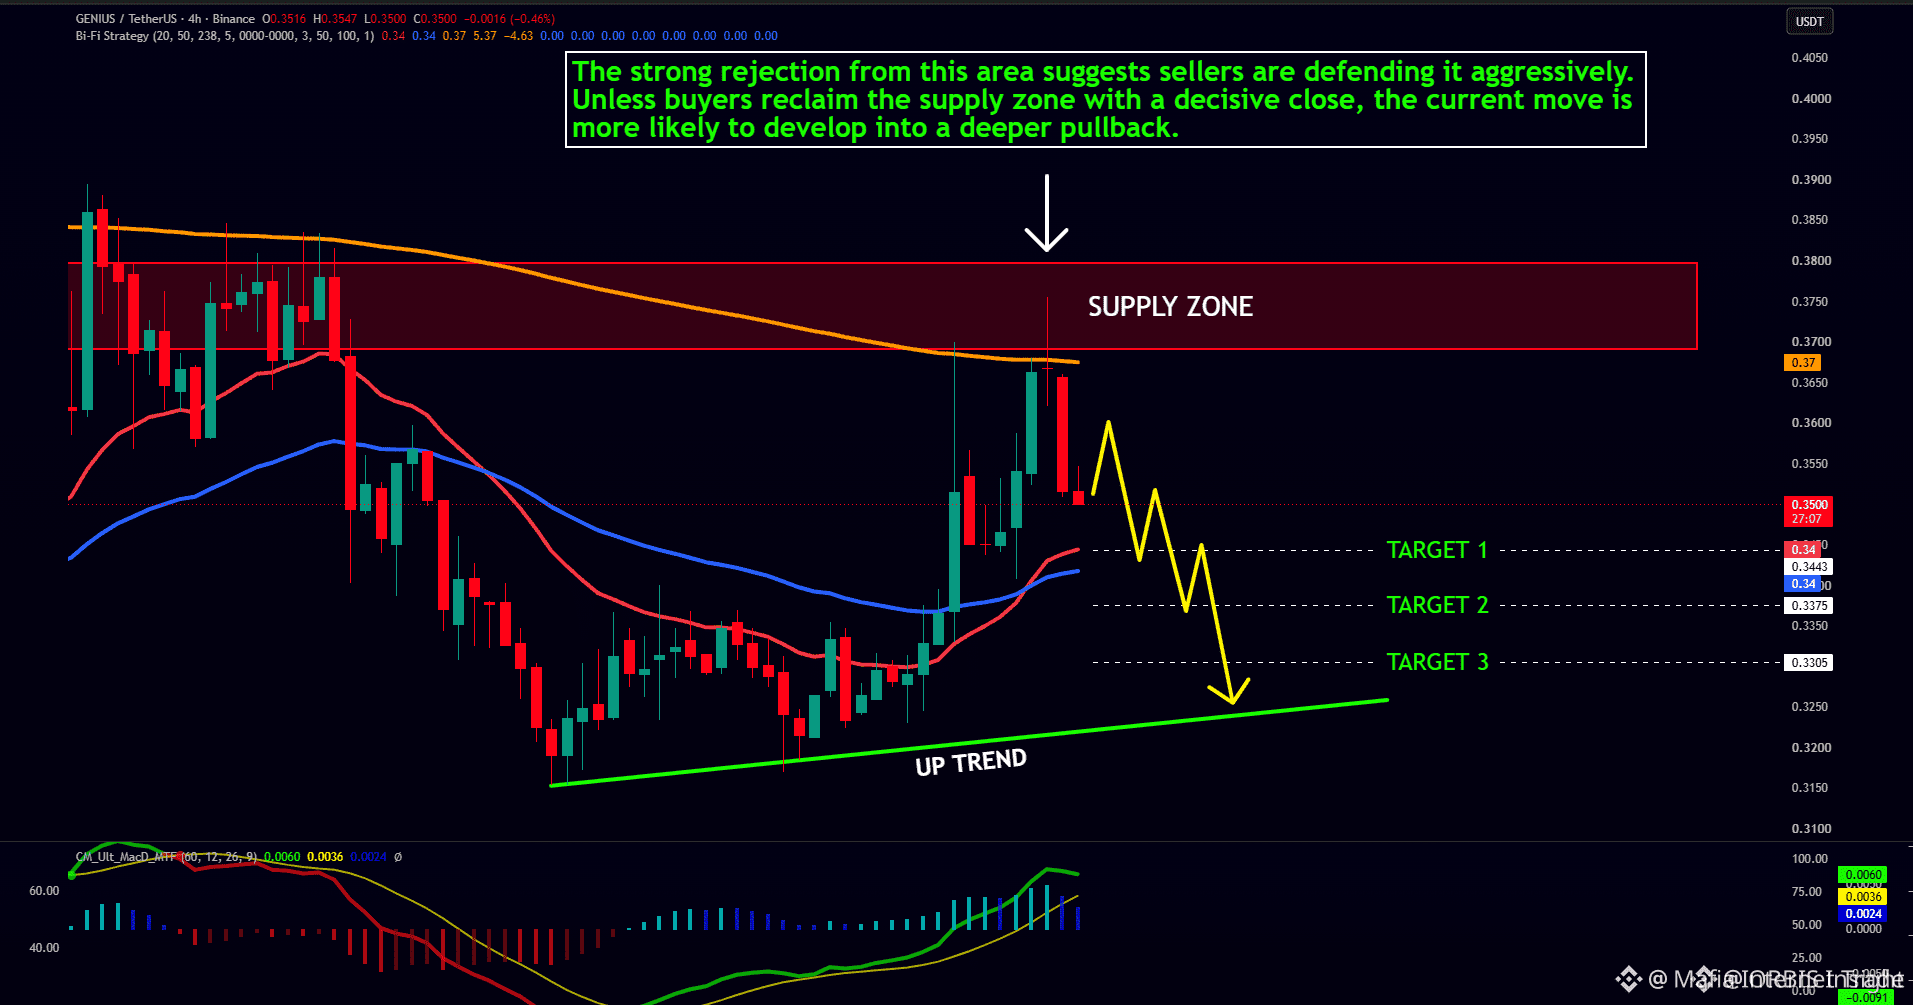
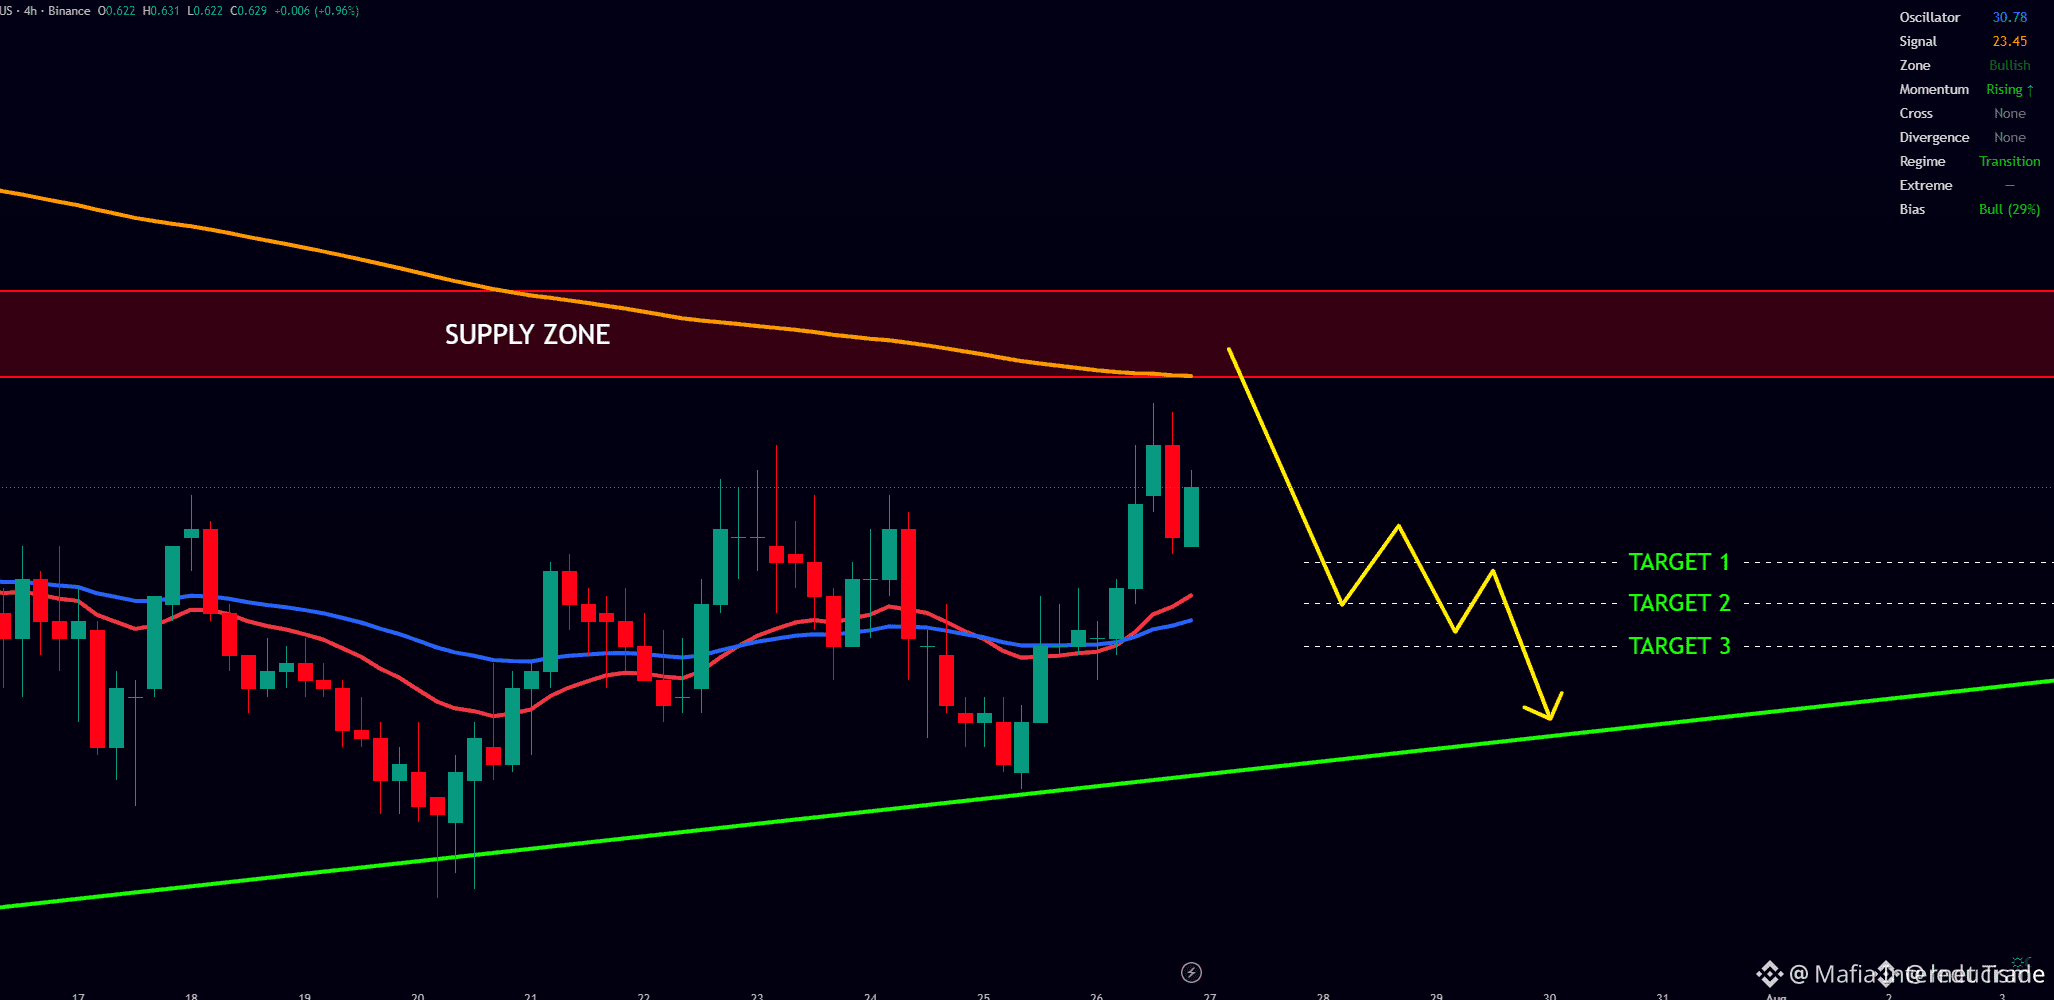
🚨 $GENIUS PUNCHES THE MA200 FIRE WALL — SELLERS HOLDING THE LINE! 🩸
Target: 0.3443 / 0.3375 / 0.3305 🎯
📌 $GENIUS just ran face-first into a brick wall built from the MA200 and a supply zone that has sellers stacked like sandbags. The last few candles are spitting long upper wicks — that's the market telling you who's in control. 📊
💡 This is textbook distribution. Smart money loves feeding retail longs at resistance walls, and once the buy-side fuel runs dry, price gets sucked toward the liquidity pool below like water down a drain. 🔍
💬 Are you shorting this rejection at MA200, or waiting for one more fake breakout before pulling the trigger? 👇
⚠️ Not financial advice. Always manage your risk. 🛡️
🏷️ #GENIUS #ShortSetup #Bearish #MA200 #Crypto
🐻 🩸
Target: 0.3443 / 0.3375 / 0.3305 🎯
📌 $GENIUS just ran face-first into a brick wall built from the MA200 and a supply zone that has sellers stacked like sandbags. The last few candles are spitting long upper wicks — that's the market telling you who's in control. 📊
💡 This is textbook distribution. Smart money loves feeding retail longs at resistance walls, and once the buy-side fuel runs dry, price gets sucked toward the liquidity pool below like water down a drain. 🔍
💬 Are you shorting this rejection at MA200, or waiting for one more fake breakout before pulling the trigger? 👇
⚠️ Not financial advice. Always manage your risk. 🛡️
🏷️ #GENIUS #ShortSetup #Bearish #MA200 #Crypto
🐻 🩸

Michael Saylor’s strategy follows Bitcoin’s 200-week MA
- Michael Saylor’s Strategy (the company previously known as MicroStrategy) is currently tracking Bitcoin’s 200-week moving average index.
- The 200-week MA is considered an important long-term support level that BTC has historically respected.
- This tracking indicates Strategy’s belief in Bitcoin’s long-term uptrend.
- It could be a signal to prepare for additional capital allocation into BTC if the price holds above this level.
#BinanceSquare #CryptoNews #BTC #Strategy #MA200
$btc
vlikevn Titanbot
Source: CoinDesk
- Michael Saylor’s Strategy (the company previously known as MicroStrategy) is currently tracking Bitcoin’s 200-week moving average index.
- The 200-week MA is considered an important long-term support level that BTC has historically respected.
- This tracking indicates Strategy’s belief in Bitcoin’s long-term uptrend.
- It could be a signal to prepare for additional capital allocation into BTC if the price holds above this level.
#BinanceSquare #CryptoNews #BTC #Strategy #MA200
$btc
vlikevn Titanbot
Source: CoinDesk

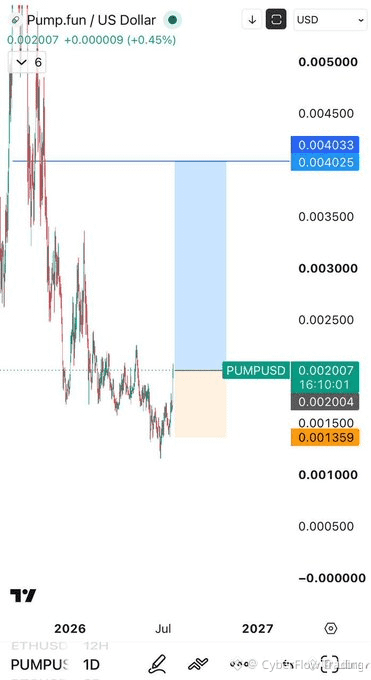
🚀 $PUMP SHATTERS EMA200 AND MA200 — FIRST TIME EVER! 💥
📌 This isn't just a routine bounce — $PUMP just swallowed the 200-day moving average wall that has capped price action for months. Combined EMA200 and MA200 breakouts signal a structural shift from bearish to bullish territory. 📊 Volume confirms real conviction behind the move.
💡 When a low-cap asset reclaims both of these heavy resistance zones simultaneously, it often marks the beginning of a sustained trend phase. The key now is whether this level flips to support in the next 4–12 hours. 🔍
💬 Are you waiting for a retest or jumping in on momentum? 👇
⚠️ Not financial advice. Always manage your risk. 🛡️
🏷️ #PUMP #Breakout #EMA200 #MA200 #Crypto
🚀 🎯
📌 This isn't just a routine bounce — $PUMP just swallowed the 200-day moving average wall that has capped price action for months. Combined EMA200 and MA200 breakouts signal a structural shift from bearish to bullish territory. 📊 Volume confirms real conviction behind the move.
💡 When a low-cap asset reclaims both of these heavy resistance zones simultaneously, it often marks the beginning of a sustained trend phase. The key now is whether this level flips to support in the next 4–12 hours. 🔍
💬 Are you waiting for a retest or jumping in on momentum? 👇
⚠️ Not financial advice. Always manage your risk. 🛡️
🏷️ #PUMP #Breakout #EMA200 #MA200 #Crypto
🚀 🎯

$B SURGES 12% BUT FACES MAJOR TEST AT MA 200 🔥
$B has risen 12% in 24 hours with Open Interest up 5.44% to $27.34M, signaling strong long positioning. The price now challenges the 200-day moving average, a resistance that has rejected multiple past rallies.
While funding rates stay positive, CMF and A/D indicators show bearish divergence. Volume climbed 25% to $7.25M, but selling pressure is building at this level.
Will buyers push through MA 200 or will price retreat to $0.21?
Not financial advice. Always manage your risk.
#B #Breakout #Altcoins #MA200 #Crypto
🎯
$B has risen 12% in 24 hours with Open Interest up 5.44% to $27.34M, signaling strong long positioning. The price now challenges the 200-day moving average, a resistance that has rejected multiple past rallies.
While funding rates stay positive, CMF and A/D indicators show bearish divergence. Volume climbed 25% to $7.25M, but selling pressure is building at this level.
Will buyers push through MA 200 or will price retreat to $0.21?
Not financial advice. Always manage your risk.
#B #Breakout #Altcoins #MA200 #Crypto
🎯
🚨 $APT SLAMS INTO MA200 – SELLERS DELIVER THE KNOCKOUT! 🔴
Target: 6.20 – 6.15 – 6.10 🚀
Stop Loss: H4 close above MA200 ⚠️
📌 The MA200 on the daily has turned into a concrete ceiling. Buyers stepped in with hope, but got instantly wrecked – volume on the rejection bar confirms aggressive distribution. 🐻 Bears are now stacking orders below, and momentum oscillators are rolling over from overbought territory on lower timeframes.
💡 This is a textbook supply zone rejection. Each failed rally draws more liquidity on the downside, clearing the path toward those targets. The narrative shifts fast when the 200-day acts as a trap, not a springboard. 💬 Are you shorting this rejection or waiting for a retest of the broken support? 👇
⚠️ Not financial advice. Always manage your risk. 🛡️
🏷️ #APT #ShortSetup #Crypto #Bearish #MA200
🐻 🔴
Target: 6.20 – 6.15 – 6.10 🚀
Stop Loss: H4 close above MA200 ⚠️
📌 The MA200 on the daily has turned into a concrete ceiling. Buyers stepped in with hope, but got instantly wrecked – volume on the rejection bar confirms aggressive distribution. 🐻 Bears are now stacking orders below, and momentum oscillators are rolling over from overbought territory on lower timeframes.
💡 This is a textbook supply zone rejection. Each failed rally draws more liquidity on the downside, clearing the path toward those targets. The narrative shifts fast when the 200-day acts as a trap, not a springboard. 💬 Are you shorting this rejection or waiting for a retest of the broken support? 👇
⚠️ Not financial advice. Always manage your risk. 🛡️
🏷️ #APT #ShortSetup #Crypto #Bearish #MA200
🐻 🔴
Log in to explore more content