
#hedgefundscmebitcoinnetshortsfall89
hedgefundscmebitcoinnetshortsfall89
403 views
26 Discussing
Hot
Latest

Everyone thinks hedge funds slashing their Bitcoin shorts by 89% means the smart money is turning bullish, but actually it often just means they're reducing bets in a market that's still full of uncertainty.
The pain is real when you see that headline and feel the FOMO. You buy $BTC only to watch it grind lower because you treated a positioning change as a buy signal while fear is still extreme.
Think of hedge funds covering those CME shorts like a bunch of poker players folding their hands mid-game. They are not suddenly all-in on the next hand. They might just be sitting out the volatility while Fear and Greed sits at 19. This kind of move can create a short squeeze that lifts prices temporarily, but it does not confirm a trend change. Traders pile into $ETH and $SOL expecting the same lift, forgetting that covering shorts is not the same as opening longs.
The bigger risk is assuming this clears the path for a rally when it could just be de-risking ahead of more news. Combined with what we are seeing in flows, it might leave $BTC vulnerable if retail follows the wrong signal.
What's your take on whether this covering actually changes anything?
#HedgeFundsCMEBitcoinNetShortsFall89 #WhatWillDriveCryptoandStocks #BitcoinETFOutflowsHit1
Everyone thinks hedge funds slashing their Bitcoin shorts by 89% means the smart money is turning bullish, but actually it often just means they're reducing bets in a market that's still full of uncertainty.
The pain is real when you see that headline and feel the FOMO. You buy $BTC only to watch it grind lower because you treated a positioning change as a buy signal while fear is still extreme.
Think of hedge funds covering those CME shorts like a bunch of poker players folding their hands mid-game. They are not suddenly all-in on the next hand. They might just be sitting out the volatility while Fear and Greed sits at 19. This kind of move can create a short squeeze that lifts prices temporarily, but it does not confirm a trend change. Traders pile into $ETH and $SOL expecting the same lift, forgetting that covering shorts is not the same as opening longs.
The bigger risk is assuming this clears the path for a rally when it could just be de-risking ahead of more news. Combined with what we are seeing in flows, it might leave $BTC vulnerable if retail follows the wrong signal.
What's your take on whether this covering actually changes anything?
#HedgeFundsCMEBitcoinNetShortsFall89 #WhatWillDriveCryptoandStocks #BitcoinETFOutflowsHit1
The pain is real when you see that headline and feel the FOMO. You buy $BTC only to watch it grind lower because you treated a positioning change as a buy signal while fear is still extreme.
Think of hedge funds covering those CME shorts like a bunch of poker players folding their hands mid-game. They are not suddenly all-in on the next hand. They might just be sitting out the volatility while Fear and Greed sits at 19. This kind of move can create a short squeeze that lifts prices temporarily, but it does not confirm a trend change. Traders pile into $ETH and $SOL expecting the same lift, forgetting that covering shorts is not the same as opening longs.
The bigger risk is assuming this clears the path for a rally when it could just be de-risking ahead of more news. Combined with what we are seeing in flows, it might leave $BTC vulnerable if retail follows the wrong signal.
What's your take on whether this covering actually changes anything?
#HedgeFundsCMEBitcoinNetShortsFall89 #WhatWillDriveCryptoandStocks #BitcoinETFOutflowsHit1
60

·
--
everyone thinks nvidia and the next ai headline is whats gonna drive stocks and crypto together but actually the trade is already happening in the positioning while retail sits frozen.
ngl the worst pain is holding $USDT through extreme fear then chasing $BTC after some headline finally gives you permission. you miss the entry, buy the narrative, and become exit liquidity.
fear and greed is at 19 right now. hedge funds just cut their cme bitcoin net shorts by 89 percent and jane street nearly octupled their fidelity bitcoin etf holdings. thats not a rumor, thats flow. people keep asking what will drive both markets like theyre waiting for one clean story. ser the tape is already shifting under you while $ETH keeps getting searched and youre still parked waiting for a stocks-style catalyst. the huang nvidia stuff might spill into risk assets but it is not the thing you should be sitting on your hands for.
the mistake i keep seeing is treating crypto and stocks like they need the same obvious catalyst. by the time the narrative is clean the move is already halfway done.
where do you think this goes from here if the shorts are covering and retail is still sitting it out?
#WhatWillDriveCryptoandStocks #JaneStreetNearlyOctuplesFidelityBitcoinETFHoldings #HedgeFundsCMEBitcoinNetShortsFall89
everyone thinks nvidia and the next ai headline is whats gonna drive stocks and crypto together but actually the trade is already happening in the positioning while retail sits frozen.
ngl the worst pain is holding $USDT through extreme fear then chasing $BTC after some headline finally gives you permission. you miss the entry, buy the narrative, and become exit liquidity.
fear and greed is at 19 right now. hedge funds just cut their cme bitcoin net shorts by 89 percent and jane street nearly octupled their fidelity bitcoin etf holdings. thats not a rumor, thats flow. people keep asking what will drive both markets like theyre waiting for one clean story. ser the tape is already shifting under you while $ETH keeps getting searched and youre still parked waiting for a stocks-style catalyst. the huang nvidia stuff might spill into risk assets but it is not the thing you should be sitting on your hands for.
the mistake i keep seeing is treating crypto and stocks like they need the same obvious catalyst. by the time the narrative is clean the move is already halfway done.
where do you think this goes from here if the shorts are covering and retail is still sitting it out?
#WhatWillDriveCryptoandStocks #JaneStreetNearlyOctuplesFidelityBitcoinETFHoldings #HedgeFundsCMEBitcoinNetShortsFall89
ngl the worst pain is holding $USDT through extreme fear then chasing $BTC after some headline finally gives you permission. you miss the entry, buy the narrative, and become exit liquidity.
fear and greed is at 19 right now. hedge funds just cut their cme bitcoin net shorts by 89 percent and jane street nearly octupled their fidelity bitcoin etf holdings. thats not a rumor, thats flow. people keep asking what will drive both markets like theyre waiting for one clean story. ser the tape is already shifting under you while $ETH keeps getting searched and youre still parked waiting for a stocks-style catalyst. the huang nvidia stuff might spill into risk assets but it is not the thing you should be sitting on your hands for.
the mistake i keep seeing is treating crypto and stocks like they need the same obvious catalyst. by the time the narrative is clean the move is already halfway done.
where do you think this goes from here if the shorts are covering and retail is still sitting it out?
#WhatWillDriveCryptoandStocks #JaneStreetNearlyOctuplesFidelityBitcoinETFHoldings #HedgeFundsCMEBitcoinNetShortsFall89

201

·
--
#HedgeFundsCMEBitcoinNetShortsFall89%
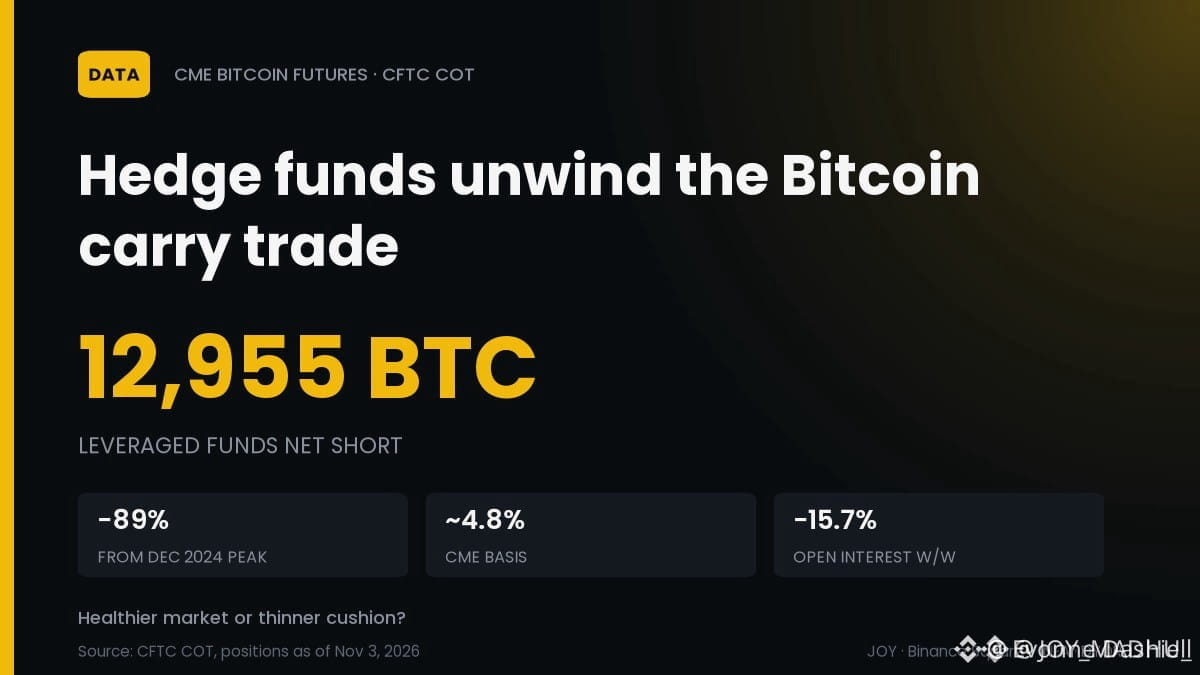
🧮 115,985 BTC to 12,955: The Bitcoin Carry Trade Is Fading
Hedge funds unwound most of the CME basis trade, so ETF flows now show more real demand and less arbitrage.
📉 Leveraged funds' net short: 12,955 BTC on Nov 3, -89% from Dec 2024
📊 Lowest net short since February 2023, per CFTC data
⚠️ CME basis ~4.8% a year, barely above Treasury yields
🏦 Open interest 17,527 contracts, down 15.7% in a week
My read: less arbitrage buying, but less hidden support on dips too.
Healthier market or thinner cushion in the next 30 days? 👇
$BTC
#Bitcoin #ETF #HedgeFundsCMEBitcoinNetShortsFall89%
#HedgeFundsCMEBitcoinNetShortsFall89%
🧮 115,985 BTC to 12,955: The Bitcoin Carry Trade Is Fading
Hedge funds unwound most of the CME basis trade, so ETF flows now show more real demand and less arbitrage.
📉 Leveraged funds' net short: 12,955 BTC on Nov 3, -89% from Dec 2024
📊 Lowest net short since February 2023, per CFTC data
⚠️ CME basis ~4.8% a year, barely above Treasury yields
🏦 Open interest 17,527 contracts, down 15.7% in a week
My read: less arbitrage buying, but less hidden support on dips too.
Healthier market or thinner cushion in the next 30 days? 👇
$BTC
#Bitcoin #ETF #HedgeFundsCMEBitcoinNetShortsFall89%
🧮 115,985 BTC to 12,955: The Bitcoin Carry Trade Is Fading
Hedge funds unwound most of the CME basis trade, so ETF flows now show more real demand and less arbitrage.
📉 Leveraged funds' net short: 12,955 BTC on Nov 3, -89% from Dec 2024
📊 Lowest net short since February 2023, per CFTC data
⚠️ CME basis ~4.8% a year, barely above Treasury yields
🏦 Open interest 17,527 contracts, down 15.7% in a week
My read: less arbitrage buying, but less hidden support on dips too.
Healthier market or thinner cushion in the next 30 days? 👇
$BTC
#Bitcoin #ETF #HedgeFundsCMEBitcoinNetShortsFall89%
27

#HedgeFundsCMEBitcoinNetShortsFall89%
$BTC 69,097 and net shorts down 89%
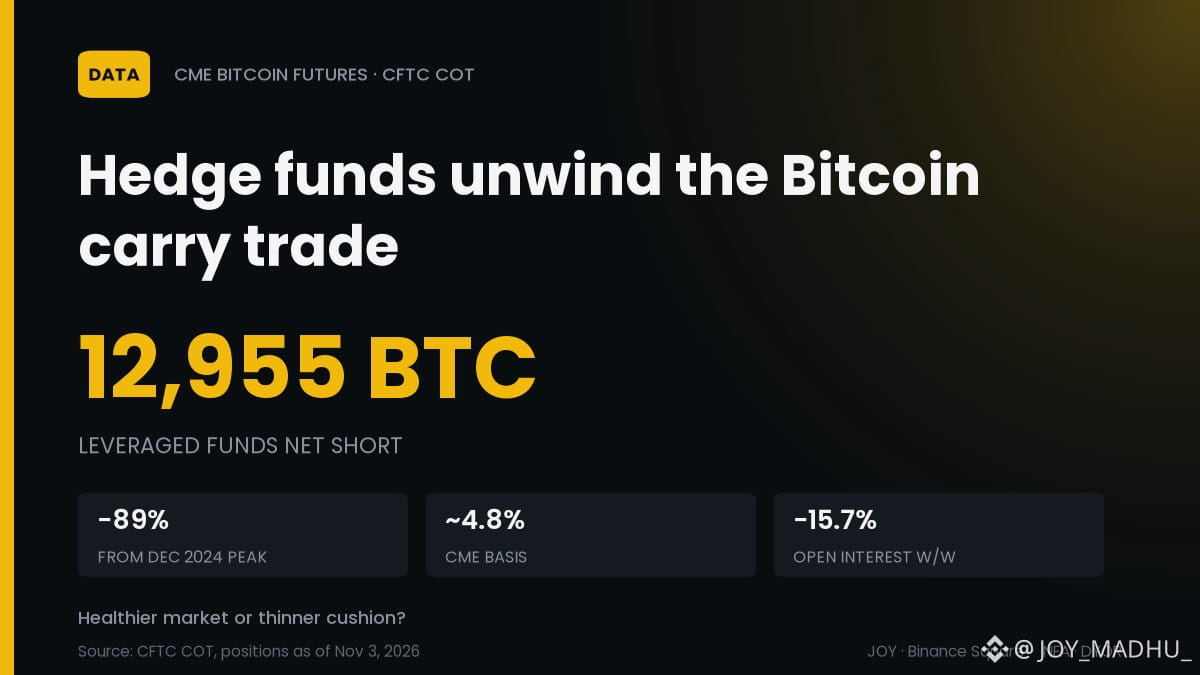
Bitcoin net shorts fell to 12,955 BTC, the lowest since Feb 2023, after an 89% collapse from the Dec 2024 peak of 115,985 BTC.
CME data on Nov 3 shows leveraged funds’ net short at 2,591 contracts.
Bitcoin ETFs report $1.5 B net outflows for the year.
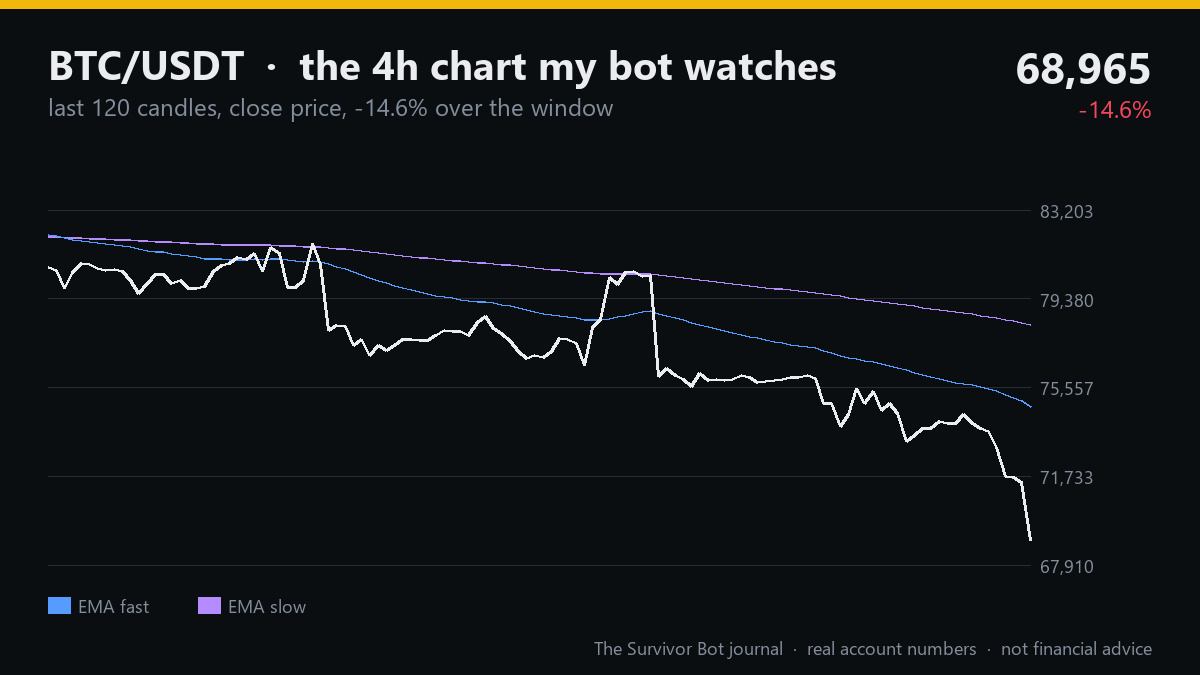
The market mood is risk-off (-0.32) and BTC’s 4h trend is down, with a daily bias also down.
These signals keep the environment bearish for BTC and discourage new long entries.
My bot has 10.17 USDT equity, down -96.64% since start, and holds no open positions.
With the current risk-off news mood and a down bias, the bot would stay flat and not open any longs today.
Levels I’m watching on BTC: 69,097 price, 12,955 BTC short count.
Follow to watch a real bot account (started with 100 USDT) survive in public, one rule at a time.
#HedgeFundsCMEBitcoinNetShortsFall89% #TheSurvivorBot
#HedgeFundsCMEBitcoinNetShortsFall89%
$BTC 69,097 and net shorts down 89%
Bitcoin net shorts fell to 12,955 BTC, the lowest since Feb 2023, after an 89% collapse from the Dec 2024 peak of 115,985 BTC.
CME data on Nov 3 shows leveraged funds’ net short at 2,591 contracts.
Bitcoin ETFs report $1.5 B net outflows for the year.
The market mood is risk-off (-0.32) and BTC’s 4h trend is down, with a daily bias also down.
These signals keep the environment bearish for BTC and discourage new long entries.
My bot has 10.17 USDT equity, down -96.64% since start, and holds no open positions.
With the current risk-off news mood and a down bias, the bot would stay flat and not open any longs today.
Levels I’m watching on BTC: 69,097 price, 12,955 BTC short count.
Follow to watch a real bot account (started with 100 USDT) survive in public, one rule at a time.
#HedgeFundsCMEBitcoinNetShortsFall89% #TheSurvivorBot
$BTC 69,097 and net shorts down 89%
Bitcoin net shorts fell to 12,955 BTC, the lowest since Feb 2023, after an 89% collapse from the Dec 2024 peak of 115,985 BTC.
CME data on Nov 3 shows leveraged funds’ net short at 2,591 contracts.
Bitcoin ETFs report $1.5 B net outflows for the year.
The market mood is risk-off (-0.32) and BTC’s 4h trend is down, with a daily bias also down.
These signals keep the environment bearish for BTC and discourage new long entries.
My bot has 10.17 USDT equity, down -96.64% since start, and holds no open positions.
With the current risk-off news mood and a down bias, the bot would stay flat and not open any longs today.
Levels I’m watching on BTC: 69,097 price, 12,955 BTC short count.
Follow to watch a real bot account (started with 100 USDT) survive in public, one rule at a time.
#HedgeFundsCMEBitcoinNetShortsFall89% #TheSurvivorBot
1
79


Hedge funds have significantly reduced their net short positions on CME Bitcoin futures, with a staggering 89% decrease. This sharp decline suggests a potential shift in sentiment, with large players becoming less bearish on Bitcoin. Historically, such a reduction in shorting can precede or coincide with upward price movements as market participants cover their positions. While not a direct guarantee of a rally, this move indicates growing confidence or a reassessment of risk by these sophisticated investors. Traders will be watching closely to see if this trend continues and if it translates into sustained price appreciation for $BTC.
Always do your own research before trading.
#HedgeFundsCMEBitcoinNetShortsFall89% $BTC
Hedge funds have significantly reduced their net short positions on CME Bitcoin futures, with a staggering 89% decrease. This sharp decline suggests a potential shift in sentiment, with large players becoming less bearish on Bitcoin. Historically, such a reduction in shorting can precede or coincide with upward price movements as market participants cover their positions. While not a direct guarantee of a rally, this move indicates growing confidence or a reassessment of risk by these sophisticated investors. Traders will be watching closely to see if this trend continues and if it translates into sustained price appreciation for $BTC .
Always do your own research before trading.
#HedgeFundsCMEBitcoinNetShortsFall89% $BTC
Always do your own research before trading.
#HedgeFundsCMEBitcoinNetShortsFall89% $BTC
95

·
--
Article
CME Bitcoin Net Shorts Narrow 89%: Latest CFTC Data Still Shows a Net Short—Don’t Treat It as Confirmation to Buy## The bottom line
Binance Square’s current trending topic interprets “CME Bitcoin net shorts down 89%” as institutions turning bullish. I’d rather break it into two points: positions have indeed narrowed, but the direction has not yet been confirmed. In the latest CFTC weekly data, leveraged funds were still net short 2,591 contracts, equivalent to about 12,955 BTC. That is neither a net-long position nor proof of spot buying.
## What happened?
At around 16:25 Beijing time, `#HedgeFundsCMEBitcoinNetShortsFall89%` ranked fifth on the Binance Square Trending page, where it had 188 people discussing it and 11,683 views. The buzz shows that the market is discussing institutional derivatives positioning, but explanations in a popular post are no substitute for the underlying data.
CME Bitcoin Net Shorts Narrow 89%: Latest CFTC Data Still Shows a Net Short—Don’t Treat It as Confirmation to Buy
## The bottom line
Binance Square’s current trending topic interprets “CME Bitcoin net shorts down 89%” as institutions turning bullish. I’d rather break it into two points: positions have indeed narrowed, but the direction has not yet been confirmed. In the latest CFTC weekly data, leveraged funds were still net short 2,591 contracts, equivalent to about 12,955 BTC. That is neither a net-long position nor proof of spot buying.
## What happened?
At around 16:25 Beijing time, `#HedgeFundsCMEBitcoinNetShortsFall89%` ranked fifth on the Binance Square Trending page, where it had 188 people discussing it and 11,683 views. The buzz shows that the market is discussing institutional derivatives positioning, but explanations in a popular post are no substitute for the underlying data.
Binance Square’s current trending topic interprets “CME Bitcoin net shorts down 89%” as institutions turning bullish. I’d rather break it into two points: positions have indeed narrowed, but the direction has not yet been confirmed. In the latest CFTC weekly data, leveraged funds were still net short 2,591 contracts, equivalent to about 12,955 BTC. That is neither a net-long position nor proof of spot buying.
## What happened?
At around 16:25 Beijing time, `#HedgeFundsCMEBitcoinNetShortsFall89%` ranked fifth on the Binance Square Trending page, where it had 188 people discussing it and 11,683 views. The buzz shows that the market is discussing institutional derivatives positioning, but explanations in a popular post are no substitute for the underlying data.
103

·
--
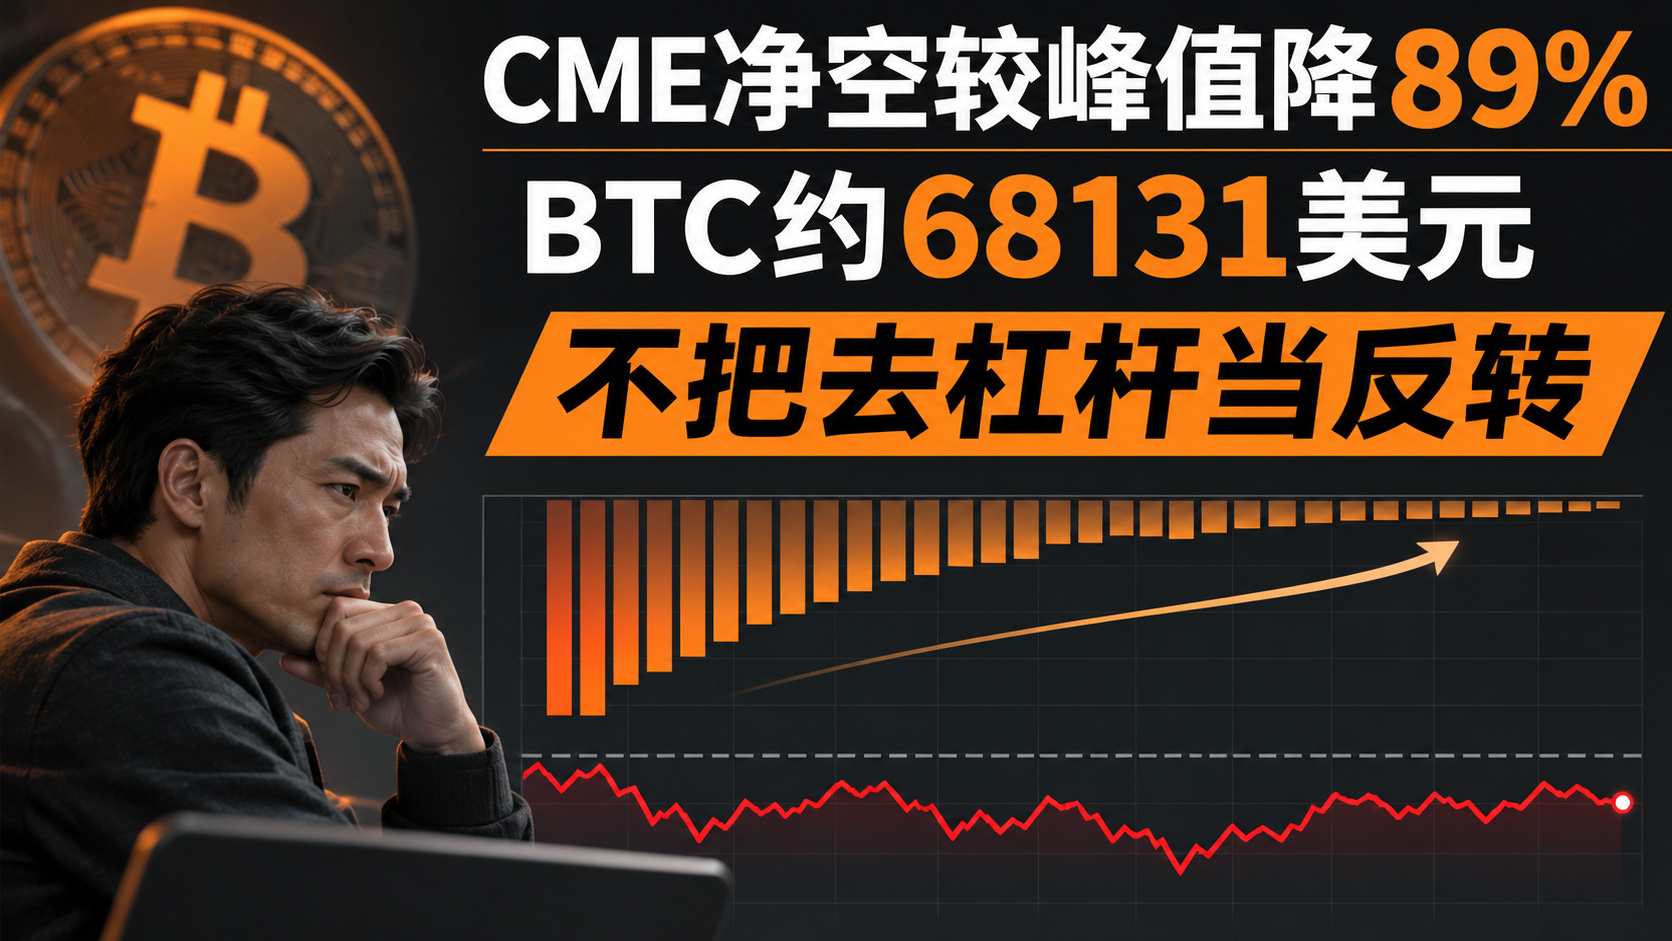
Bitcoin futures funds’ net shorts plunge nearly 90% | Spot still below $69K | I don’t mistake deleveraging for a reversal
My stance is to wait for confirmation. The topic #HedgeFundsCMEBitcoinNetShortsFall89% is currently trending on Binance Square, so I checked the U.S. Commodity Futures Trading Commission (CFTC) Commitments of Traders reports myself. On December 17, 2024, the “Leveraged Funds” category for CME standard Bitcoin futures held 3,653 long contracts and 26,850 short contracts, for net shorts of 23,197. On November 3, 2026, the same category held 5,114 long contracts and 7,705 short contracts, for net shorts of 2,591. At five BTC per contract, net shorts fell from approximately 116,000 BTC to approximately 13,000 BTC—a reduction of about 89% between those two dates. This comparison is between a peak from nearly two years ago and a weekly snapshot from ten days ago. It absolutely does not mean that 89% of shorts were just covered today, nor that all hedge funds have turned net long.
Mechanically, funds shorting futures are not necessarily betting that BTC will fall. A common basis trade involves buying spot or an ETF while simultaneously selling futures to lock in the spread between them. When the spread narrows, financing costs change, or risk budgets are cut, funds may close their futures shorts while also selling the corresponding long positions. A decline in net shorts only shows that this type of futures exposure has decreased; it does not, by itself, prove that fresh net buying is flowing into spot. The CFTC’s category also covers various leveraged trading strategies, and the data runs only through November 3, so it cannot explain every price move today. Translating “fewer shorts” directly into “a short squeeze is imminent” can easily lead to catching a falling knife.
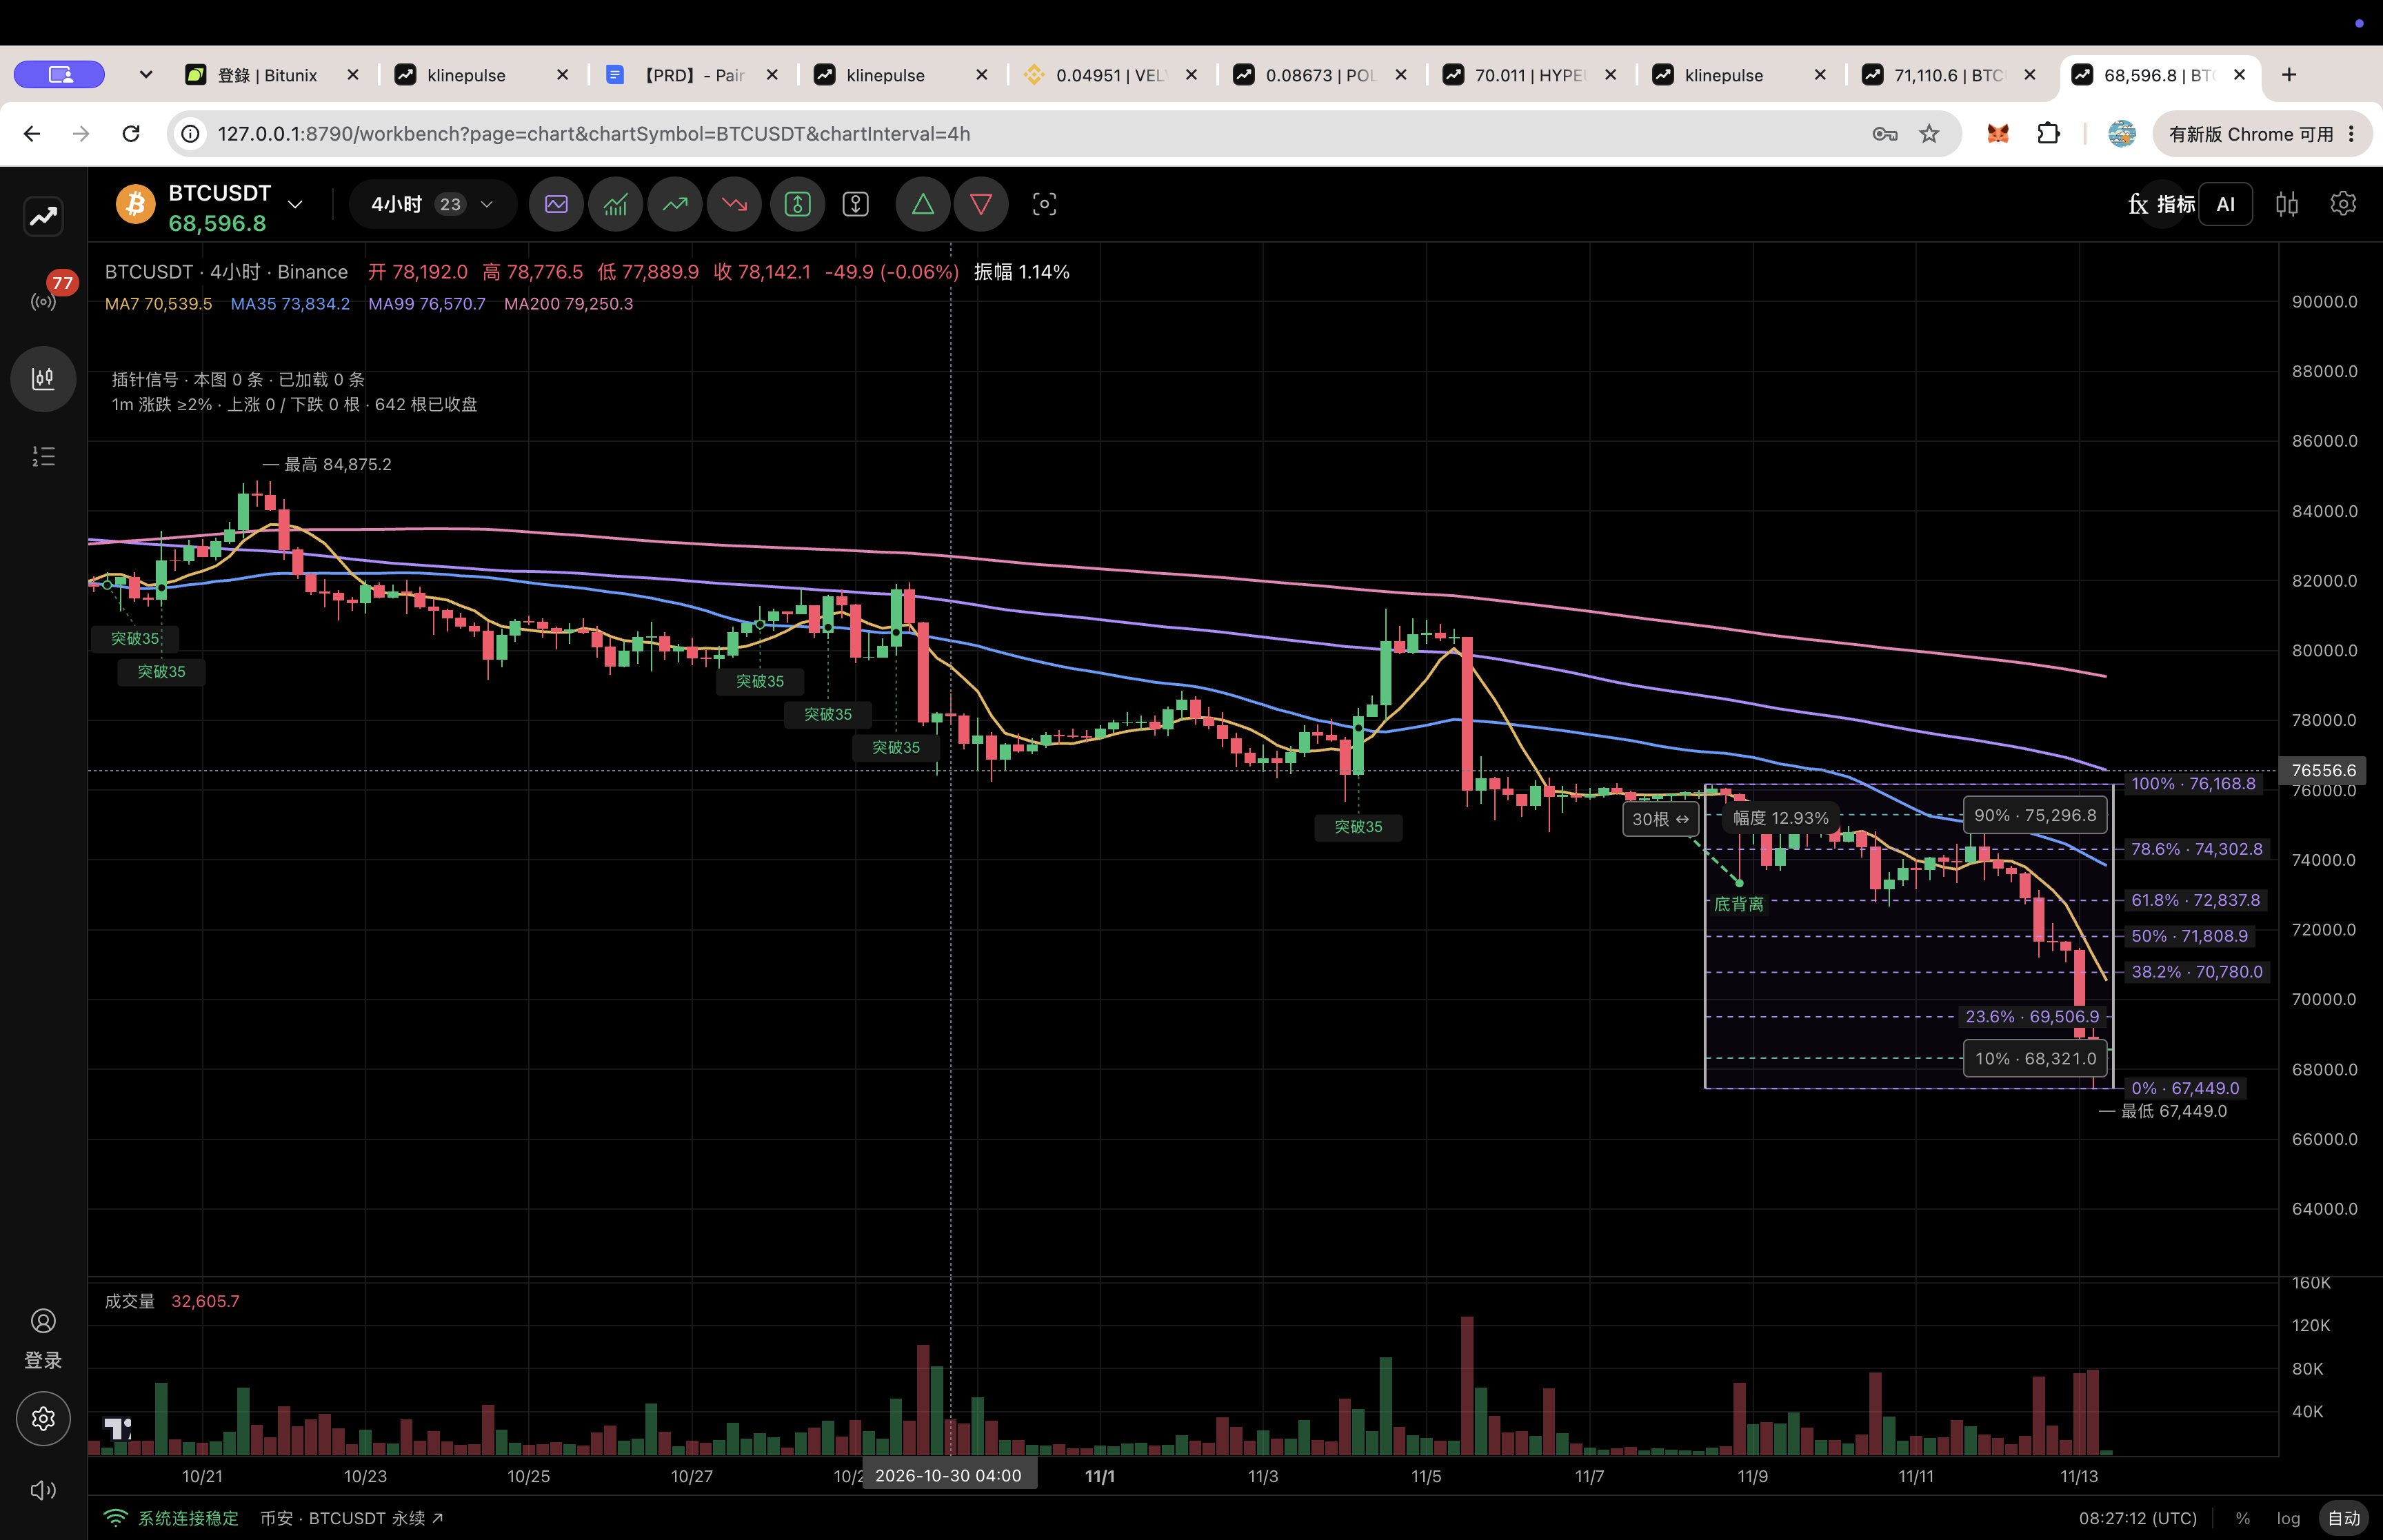
I just checked Binance BTC/USDT at around $68,131, down about 7.4% over 24 hours, with an intraday low of $67,568 and a high of $73,738. After breaking below $69,000, the price has yet to stage a sustained recovery, which shows that older positioning data has not provided support for the current price. The area around $67,500 is where I’m watching for a low; $69,000 is the first level to reclaim, and $70,500 is a stronger short-term confirmation level. If price breaks below $67,500 and then fails to rebound, my bottoming thesis is invalidated. If it can get back above $69,000 and hold on a retest, I’ll then look to $70,500. If a later CFTC report shows leveraged funds building up net shorts again, or ETF outflows continue, I’ll also lower my expectations for a rebound.
If I were trading this myself, I’d stay out for now. I’d only consider a small spot position, with no more than 2% of my total capital and no leverage. The trigger would be a 30-minute close above $69,000, followed by a successful retest with contracting volatility. My first target would be $70,500, where I’d sell half; I’d hold the rest with $72,000 in view. I’d place a stop below $67,450 and exit immediately if it’s hit. If price still can’t break above $70,500 two hours after entry, I’d reduce the position proactively; if it falls back below $69,000, I’d exit completely. If price remains weak below $67,500, I’d rather stay flat and wait for the next positioning report and spot-flow data. A plan whose conditions haven’t been triggered is not a trade, let alone a profit.
Sources: CFTC Commitments of Traders reports for CME Bitcoin futures dated December 17, 2024, and November 3, 2026; price reference: Binance spot. #HedgeFundsCMEBitcoinNetShortsFall89% #BTC
The above is solely my personal market observation and does not constitute investment advice.
Bitcoin futures funds’ net shorts plunge nearly 90% | Spot still below $69K | I don’t mistake deleveraging for a reversal
My stance is to wait for confirmation. The topic #HedgeFundsCMEBitcoinNetShortsFall89% is currently trending on Binance Square, so I checked the U.S. Commodity Futures Trading Commission (CFTC) Commitments of Traders reports myself. On December 17, 2024, the “Leveraged Funds” category for CME standard Bitcoin futures held 3,653 long contracts and 26,850 short contracts, for net shorts of 23,197. On November 3, 2026, the same category held 5,114 long contracts and 7,705 short contracts, for net shorts of 2,591. At five BTC per contract, net shorts fell from approximately 116,000 BTC to approximately 13,000 BTC—a reduction of about 89% between those two dates. This comparison is between a peak from nearly two years ago and a weekly snapshot from ten days ago. It absolutely does not mean that 89% of shorts were just covered today, nor that all hedge funds have turned net long.
Mechanically, funds shorting futures are not necessarily betting that BTC will fall. A common basis trade involves buying spot or an ETF while simultaneously selling futures to lock in the spread between them. When the spread narrows, financing costs change, or risk budgets are cut, funds may close their futures shorts while also selling the corresponding long positions. A decline in net shorts only shows that this type of futures exposure has decreased; it does not, by itself, prove that fresh net buying is flowing into spot. The CFTC’s category also covers various leveraged trading strategies, and the data runs only through November 3, so it cannot explain every price move today. Translating “fewer shorts” directly into “a short squeeze is imminent” can easily lead to catching a falling knife.
I just checked Binance BTC/USDT at around $68,131, down about 7.4% over 24 hours, with an intraday low of $67,568 and a high of $73,738. After breaking below $69,000, the price has yet to stage a sustained recovery, which shows that older positioning data has not provided support for the current price. The area around $67,500 is where I’m watching for a low; $69,000 is the first level to reclaim, and $70,500 is a stronger short-term confirmation level. If price breaks below $67,500 and then fails to rebound, my bottoming thesis is invalidated. If it can get back above $69,000 and hold on a retest, I’ll then look to $70,500. If a later CFTC report shows leveraged funds building up net shorts again, or ETF outflows continue, I’ll also lower my expectations for a rebound.
If I were trading this myself, I’d stay out for now. I’d only consider a small spot position, with no more than 2% of my total capital and no leverage. The trigger would be a 30-minute close above $69,000, followed by a successful retest with contracting volatility. My first target would be $70,500, where I’d sell half; I’d hold the rest with $72,000 in view. I’d place a stop below $67,450 and exit immediately if it’s hit. If price still can’t break above $70,500 two hours after entry, I’d reduce the position proactively; if it falls back below $69,000, I’d exit completely. If price remains weak below $67,500, I’d rather stay flat and wait for the next positioning report and spot-flow data. A plan whose conditions haven’t been triggered is not a trade, let alone a profit.
Sources: CFTC Commitments of Traders reports for CME Bitcoin futures dated December 17, 2024, and November 3, 2026; price reference: Binance spot. #HedgeFundsCMEBitcoinNetShortsFall89% #BTC
The above is solely my personal market observation and does not constitute investment advice.
My stance is to wait for confirmation. The topic #HedgeFundsCMEBitcoinNetShortsFall89% is currently trending on Binance Square, so I checked the U.S. Commodity Futures Trading Commission (CFTC) Commitments of Traders reports myself. On December 17, 2024, the “Leveraged Funds” category for CME standard Bitcoin futures held 3,653 long contracts and 26,850 short contracts, for net shorts of 23,197. On November 3, 2026, the same category held 5,114 long contracts and 7,705 short contracts, for net shorts of 2,591. At five BTC per contract, net shorts fell from approximately 116,000 BTC to approximately 13,000 BTC—a reduction of about 89% between those two dates. This comparison is between a peak from nearly two years ago and a weekly snapshot from ten days ago. It absolutely does not mean that 89% of shorts were just covered today, nor that all hedge funds have turned net long.
Mechanically, funds shorting futures are not necessarily betting that BTC will fall. A common basis trade involves buying spot or an ETF while simultaneously selling futures to lock in the spread between them. When the spread narrows, financing costs change, or risk budgets are cut, funds may close their futures shorts while also selling the corresponding long positions. A decline in net shorts only shows that this type of futures exposure has decreased; it does not, by itself, prove that fresh net buying is flowing into spot. The CFTC’s category also covers various leveraged trading strategies, and the data runs only through November 3, so it cannot explain every price move today. Translating “fewer shorts” directly into “a short squeeze is imminent” can easily lead to catching a falling knife.
I just checked Binance BTC/USDT at around $68,131, down about 7.4% over 24 hours, with an intraday low of $67,568 and a high of $73,738. After breaking below $69,000, the price has yet to stage a sustained recovery, which shows that older positioning data has not provided support for the current price. The area around $67,500 is where I’m watching for a low; $69,000 is the first level to reclaim, and $70,500 is a stronger short-term confirmation level. If price breaks below $67,500 and then fails to rebound, my bottoming thesis is invalidated. If it can get back above $69,000 and hold on a retest, I’ll then look to $70,500. If a later CFTC report shows leveraged funds building up net shorts again, or ETF outflows continue, I’ll also lower my expectations for a rebound.
If I were trading this myself, I’d stay out for now. I’d only consider a small spot position, with no more than 2% of my total capital and no leverage. The trigger would be a 30-minute close above $69,000, followed by a successful retest with contracting volatility. My first target would be $70,500, where I’d sell half; I’d hold the rest with $72,000 in view. I’d place a stop below $67,450 and exit immediately if it’s hit. If price still can’t break above $70,500 two hours after entry, I’d reduce the position proactively; if it falls back below $69,000, I’d exit completely. If price remains weak below $67,500, I’d rather stay flat and wait for the next positioning report and spot-flow data. A plan whose conditions haven’t been triggered is not a trade, let alone a profit.
Sources: CFTC Commitments of Traders reports for CME Bitcoin futures dated December 17, 2024, and November 3, 2026; price reference: Binance spot. #HedgeFundsCMEBitcoinNetShortsFall89% #BTC
The above is solely my personal market observation and does not constitute investment advice.
10
·
--
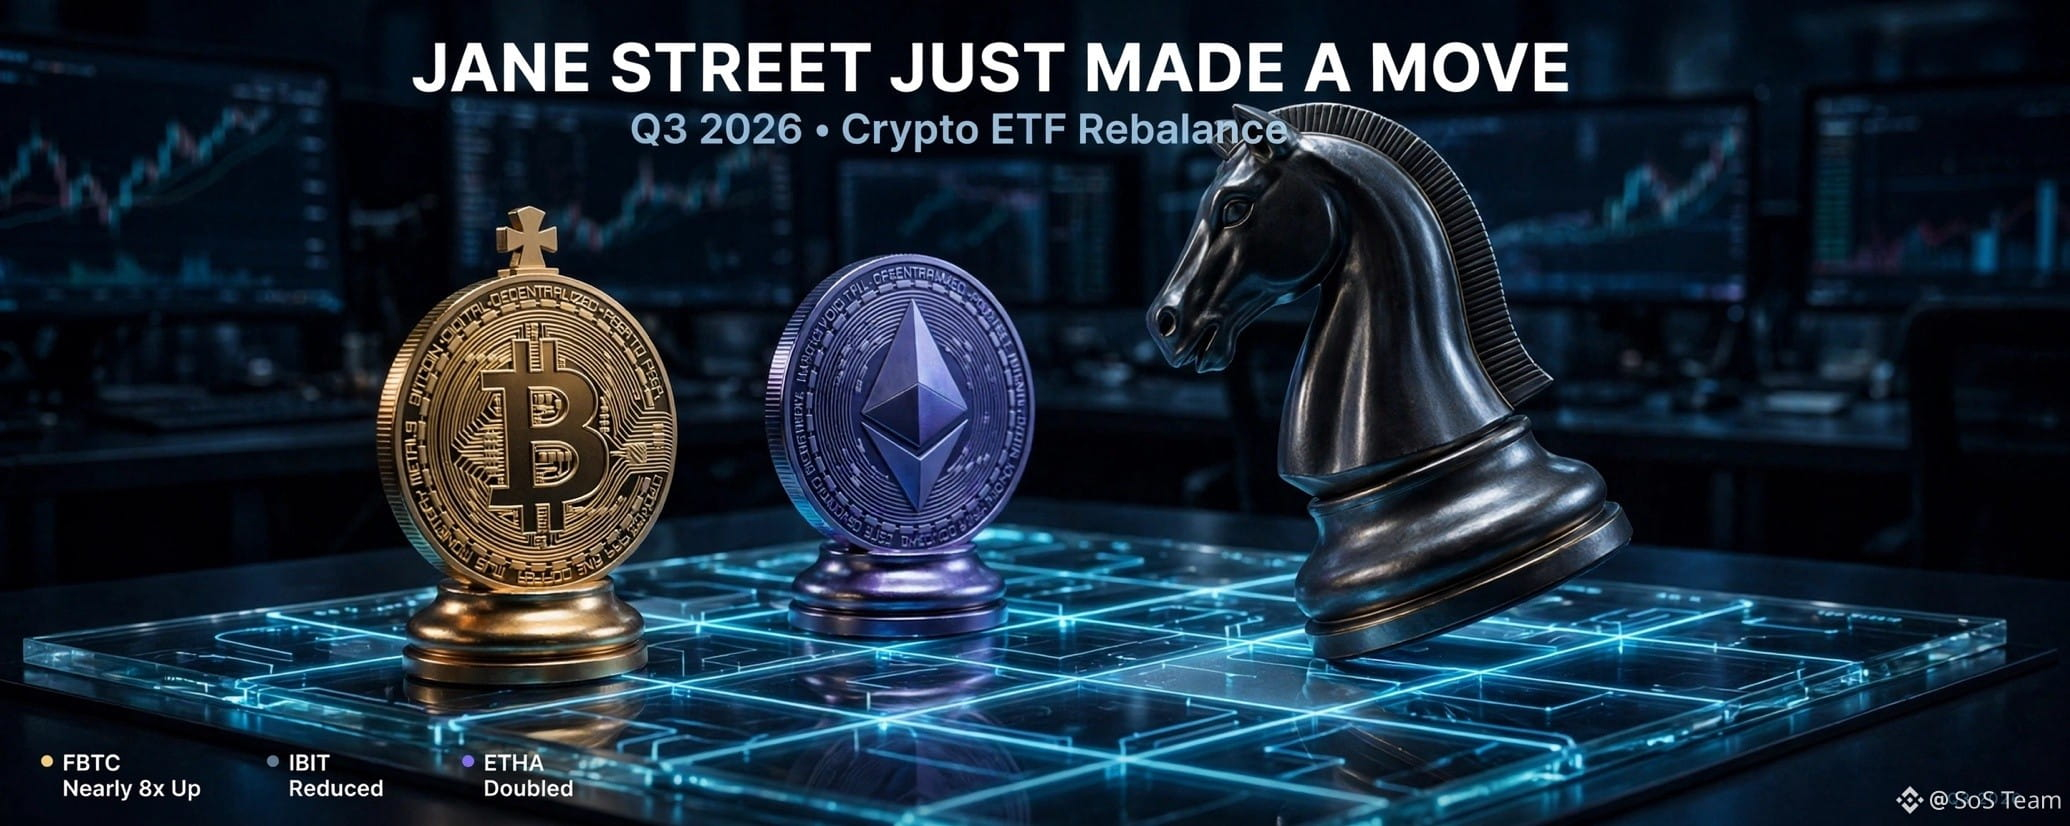
Here's what happened when Jane Street nearly octupled its Fidelity Bitcoin ETF holdings last week while most of the market was looking the other way.
Most traders see a headline like this and pile into $BTC out of FOMO, then have no idea when to exit as the same institutions start rotating out.
Jane Street operates as a market maker, not a long-term holder. Increasing their stake in the Fidelity ETF this aggressively during extreme fear, with the index at 19, could be about capturing spreads or hedging other positions rather than a conviction bet. People are searching $USDT, $BTC and $ETH right now, looking for safety or the next move. This kind of positioning from a firm like Jane Street often precedes volatility, not a clean rally.
We have watched similar plays before. Large desks scale in quietly, the news leaks, retail follows, then the unwind happens faster than anyone prices in. Combined with falling net shorts on CME and lingering ETF outflows, the risk is that this looks bullish on the surface but becomes selling pressure if fear persists.
Anyone else seeing this as a warning rather than a green light?
#JaneStreetNearlyOctuplesFidelityBitcoinETFHoldings #BitcoinETFOutflowsHit1 #HedgeFundsCMEBitcoinNetShortsFall89
Here's what happened when Jane Street nearly octupled its Fidelity Bitcoin ETF holdings last week while most of the market was looking the other way.
Most traders see a headline like this and pile into $BTC out of FOMO, then have no idea when to exit as the same institutions start rotating out.
Jane Street operates as a market maker, not a long-term holder. Increasing their stake in the Fidelity ETF this aggressively during extreme fear, with the index at 19, could be about capturing spreads or hedging other positions rather than a conviction bet. People are searching $USDT, $BTC and $ETH right now, looking for safety or the next move. This kind of positioning from a firm like Jane Street often precedes volatility, not a clean rally.
We have watched similar plays before. Large desks scale in quietly, the news leaks, retail follows, then the unwind happens faster than anyone prices in. Combined with falling net shorts on CME and lingering ETF outflows, the risk is that this looks bullish on the surface but becomes selling pressure if fear persists.
Anyone else seeing this as a warning rather than a green light?
#JaneStreetNearlyOctuplesFidelityBitcoinETFHoldings #BitcoinETFOutflowsHit1 #HedgeFundsCMEBitcoinNetShortsFall89
Most traders see a headline like this and pile into $BTC out of FOMO, then have no idea when to exit as the same institutions start rotating out.
Jane Street operates as a market maker, not a long-term holder. Increasing their stake in the Fidelity ETF this aggressively during extreme fear, with the index at 19, could be about capturing spreads or hedging other positions rather than a conviction bet. People are searching $USDT, $BTC and $ETH right now, looking for safety or the next move. This kind of positioning from a firm like Jane Street often precedes volatility, not a clean rally.
We have watched similar plays before. Large desks scale in quietly, the news leaks, retail follows, then the unwind happens faster than anyone prices in. Combined with falling net shorts on CME and lingering ETF outflows, the risk is that this looks bullish on the surface but becomes selling pressure if fear persists.
Anyone else seeing this as a warning rather than a green light?
#JaneStreetNearlyOctuplesFidelityBitcoinETFHoldings #BitcoinETFOutflowsHit1 #HedgeFundsCMEBitcoinNetShortsFall89
57
Everyone thinks Jane Street nearly octupling Fidelity Bitcoin ETF holdings is a loud buy signal for $BTC. But actually a market maker scaling inventory is not the same as a believer stacking coins for the long haul.
You have felt this one. A famous name shows up in a filing, you chase so you do not miss it, then you sit there with no exit plan while the trade slowly eats you.
Think of Jane Street like a supermarket restocking the shelves, not someone filling a personal vault. Nearly eight times more Fidelity Bitcoin ETF shares can mean they need inventory to fill client orders, hedge, or make markets. That is simply the business they run.
Three mix-ups keep showing up. Market maker inventory is not cold storage. One firm scaling a position does not rewrite every ETF flow headline. And Extreme Fear is when people sitting in $USDT either freeze or jump at the first bullish-looking print, pulling $ETH into a move that was never about Ethereum. Copying the size without copying the reason they hold it is how a filing turns into a loss.
Where do you think this actually leaves $BTC from here?
#JaneStreetNearlyOctuplesFidelityBitcoinETFHoldings #WhatWillDriveCryptoandStocks #HedgeFundsCMEBitcoinNetShortsFall89
Everyone thinks Jane Street nearly octupling Fidelity Bitcoin ETF holdings is a loud buy signal for $BTC . But actually a market maker scaling inventory is not the same as a believer stacking coins for the long haul.
You have felt this one. A famous name shows up in a filing, you chase so you do not miss it, then you sit there with no exit plan while the trade slowly eats you.
Think of Jane Street like a supermarket restocking the shelves, not someone filling a personal vault. Nearly eight times more Fidelity Bitcoin ETF shares can mean they need inventory to fill client orders, hedge, or make markets. That is simply the business they run.
Three mix-ups keep showing up. Market maker inventory is not cold storage. One firm scaling a position does not rewrite every ETF flow headline. And Extreme Fear is when people sitting in $USDT either freeze or jump at the first bullish-looking print, pulling $ETH into a move that was never about Ethereum. Copying the size without copying the reason they hold it is how a filing turns into a loss.
Where do you think this actually leaves $BTC from here?
#JaneStreetNearlyOctuplesFidelityBitcoinETFHoldings #WhatWillDriveCryptoandStocks #HedgeFundsCMEBitcoinNetShortsFall89
You have felt this one. A famous name shows up in a filing, you chase so you do not miss it, then you sit there with no exit plan while the trade slowly eats you.
Think of Jane Street like a supermarket restocking the shelves, not someone filling a personal vault. Nearly eight times more Fidelity Bitcoin ETF shares can mean they need inventory to fill client orders, hedge, or make markets. That is simply the business they run.
Three mix-ups keep showing up. Market maker inventory is not cold storage. One firm scaling a position does not rewrite every ETF flow headline. And Extreme Fear is when people sitting in $USDT either freeze or jump at the first bullish-looking print, pulling $ETH into a move that was never about Ethereum. Copying the size without copying the reason they hold it is how a filing turns into a loss.
Where do you think this actually leaves $BTC from here?
#JaneStreetNearlyOctuplesFidelityBitcoinETFHoldings #WhatWillDriveCryptoandStocks #HedgeFundsCMEBitcoinNetShortsFall89

42
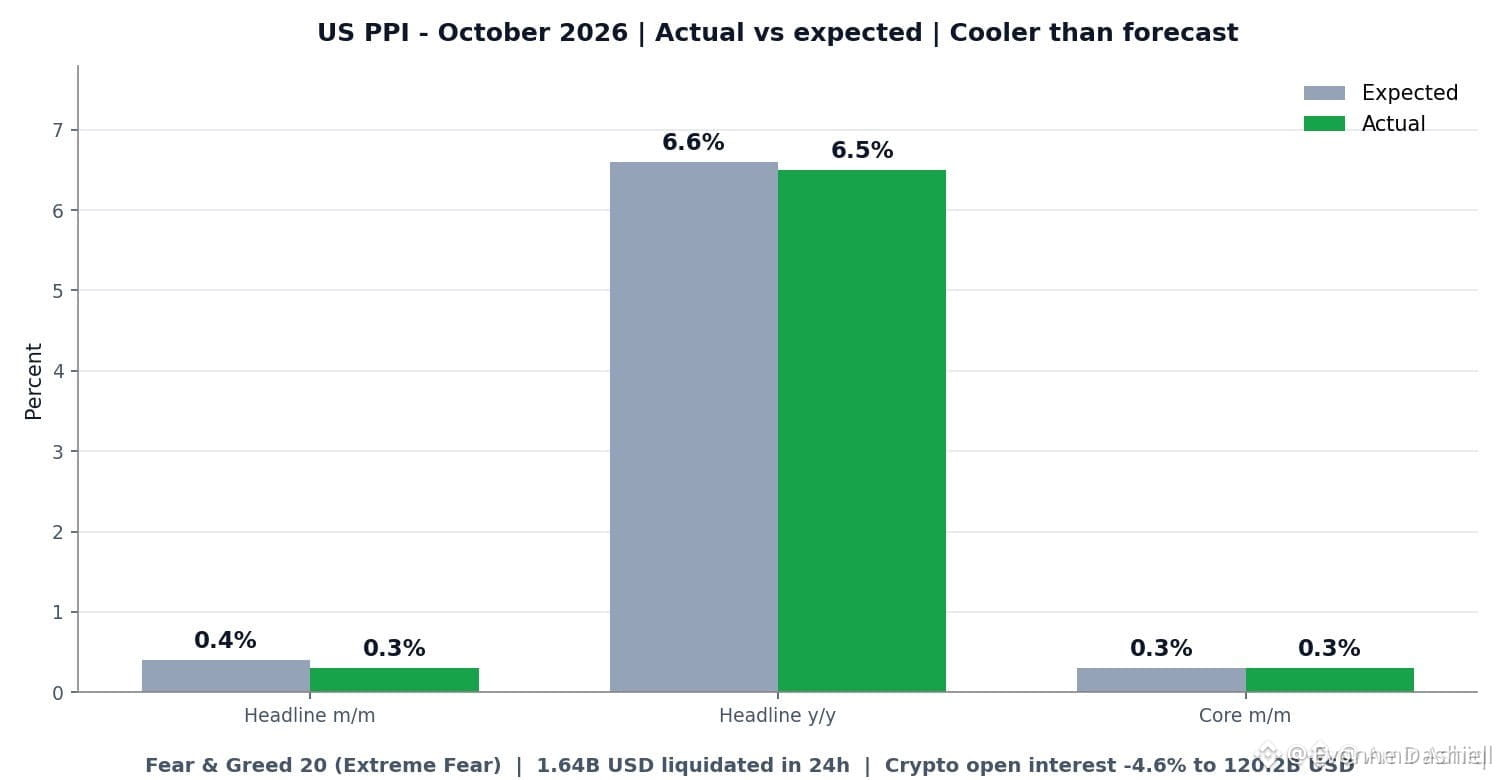
The last time crypto and stocks shared the same liquidity driver this tightly, more people got wrecked on the way down than ever made money on the way up.
Traders keep buying $BTC and $ETH the second equities tick green, then watch both reverse when the next data print hits and perps start cascading. That FOMO-on-correlation trade is how people lose months of gains in a single session.
The real driver isn't some new narrative. It's whether USD liquidity is expanding or contracting, plus ETF flows and positioning. When that tap is on, $SOL rips with everything else.
When Fear and Greed is sitting at 19 and outflows show up, stocks can still find a floor in earnings while crypto just keeps bleeding because there's no bid underneath. Correlation looks perfect until the moment it becomes a one-way liquidation machine.
Anyone else seeing this setup as more of a warning than a buy signal, or do you think the next print actually unsticks both?
#WhatWillDriveCryptoandStocks #BitcoinETFOutflowsHit1 #HedgeFundsCMEBitcoinNetShortsFall89
The last time crypto and stocks shared the same liquidity driver this tightly, more people got wrecked on the way down than ever made money on the way up.
Traders keep buying $BTC and $ETH the second equities tick green, then watch both reverse when the next data print hits and perps start cascading. That FOMO-on-correlation trade is how people lose months of gains in a single session.
The real driver isn't some new narrative. It's whether USD liquidity is expanding or contracting, plus ETF flows and positioning. When that tap is on, $SOL rips with everything else.
When Fear and Greed is sitting at 19 and outflows show up, stocks can still find a floor in earnings while crypto just keeps bleeding because there's no bid underneath. Correlation looks perfect until the moment it becomes a one-way liquidation machine.
Anyone else seeing this setup as more of a warning than a buy signal, or do you think the next print actually unsticks both?
#WhatWillDriveCryptoandStocks #BitcoinETFOutflowsHit1 #HedgeFundsCMEBitcoinNetShortsFall89
Traders keep buying $BTC and $ETH the second equities tick green, then watch both reverse when the next data print hits and perps start cascading. That FOMO-on-correlation trade is how people lose months of gains in a single session.
The real driver isn't some new narrative. It's whether USD liquidity is expanding or contracting, plus ETF flows and positioning. When that tap is on, $SOL rips with everything else.
When Fear and Greed is sitting at 19 and outflows show up, stocks can still find a floor in earnings while crypto just keeps bleeding because there's no bid underneath. Correlation looks perfect until the moment it becomes a one-way liquidation machine.
Anyone else seeing this setup as more of a warning than a buy signal, or do you think the next print actually unsticks both?
#WhatWillDriveCryptoandStocks #BitcoinETFOutflowsHit1 #HedgeFundsCMEBitcoinNetShortsFall89
63

·
--
Darling, you might have noticed something lately. I have not called a single coin, have not shilled a single token, and that is not an accident. It is a choice.
Look at the board with me. $BTC is trading near $68,800, down about 7% today and sitting below the 200-day line. Fear and Greed just printed 20, Extreme Fear. Spot $BTC ETFs have bled about $1.44B across five straight sessions. More than $650M in leveraged positions got wiped in 24 hours. And the Fed is now priced for a hike, not a cut, with PPI landing tonight.
In a market like this, calling coins is not trading, it is gambling with your followers' money. Every bounce gets sold, every breakout turns into a trap, and the leverage casino eats both sides. I would rather say nothing than shill you a coin I do not believe in.
So here is my promise. The moment the market gives me a real structure again, $BTC reclaiming its key levels, flows turning, fear cooling off, I will be back calling, louder than ever. Until then, my silence is the most honest call I can make.
Are you sitting this one out with me, or still hunting in the chop?
#HuangExitNvidiaStrategyInFocus #HedgeFundsCMEBitcoinNetShortsFall89%
All data here is for reference only and is not financial advice.
Darling, you might have noticed something lately. I have not called a single coin, have not shilled a single token, and that is not an accident. It is a choice.
Look at the board with me. $BTC is trading near $68,800, down about 7% today and sitting below the 200-day line. Fear and Greed just printed 20, Extreme Fear. Spot $BTC ETFs have bled about $1.44B across five straight sessions. More than $650M in leveraged positions got wiped in 24 hours. And the Fed is now priced for a hike, not a cut, with PPI landing tonight.
In a market like this, calling coins is not trading, it is gambling with your followers' money. Every bounce gets sold, every breakout turns into a trap, and the leverage casino eats both sides. I would rather say nothing than shill you a coin I do not believe in.
So here is my promise. The moment the market gives me a real structure again, $BTC reclaiming its key levels, flows turning, fear cooling off, I will be back calling, louder than ever. Until then, my silence is the most honest call I can make.
Are you sitting this one out with me, or still hunting in the chop?
#HuangExitNvidiaStrategyInFocus #HedgeFundsCMEBitcoinNetShortsFall89%
All data here is for reference only and is not financial advice.
Look at the board with me. $BTC is trading near $68,800, down about 7% today and sitting below the 200-day line. Fear and Greed just printed 20, Extreme Fear. Spot $BTC ETFs have bled about $1.44B across five straight sessions. More than $650M in leveraged positions got wiped in 24 hours. And the Fed is now priced for a hike, not a cut, with PPI landing tonight.
In a market like this, calling coins is not trading, it is gambling with your followers' money. Every bounce gets sold, every breakout turns into a trap, and the leverage casino eats both sides. I would rather say nothing than shill you a coin I do not believe in.
So here is my promise. The moment the market gives me a real structure again, $BTC reclaiming its key levels, flows turning, fear cooling off, I will be back calling, louder than ever. Until then, my silence is the most honest call I can make.
Are you sitting this one out with me, or still hunting in the chop?
#HuangExitNvidiaStrategyInFocus #HedgeFundsCMEBitcoinNetShortsFall89%
All data here is for reference only and is not financial advice.

Kurdude:
what a chad
1
1
237
·
--
$70,000 did not hold. $BTC is trading near $68,500, down about 7% on the day and at its lowest since August, while $ETH has slipped to about $1,920. Fear and Greed is still stuck at 20. Nearly $600M in longs got wiped in 24 hours. And while the market was falling, Louisiana decided to rewrite the rulebook. Attorney General Liz Murrill just sued 10 prediction market platforms, Kalshi, Polymarket, Robinhood, Coinbase and six more, arguing their event contracts on sports, awards and elections are illegal online gambling. She wants an immediate restraining order and an injunction. Kalshi fired back with an emergency filing of its own, and no court has ruled yet. Tonight brings US PPI at 20:30, the next number that decides whether $68,000 holds or the slide finds a new floor. When the price breaks and the rules get challenged on the same day, do you trade the chart or the courtroom first? #WhatWillDriveCryptoandStocks’NextRebound? #HedgeFundsCMEBitcoinNetShortsFall89%
$70,000 did not hold. $BTC is trading near $68,500, down about 7% on the day and at its lowest since August, while $ETH has slipped to about $1,920. Fear and Greed is still stuck at 20. Nearly $600M in longs got wiped in 24 hours. And while the market was falling, Louisiana decided to rewrite the rulebook. Attorney General Liz Murrill just sued 10 prediction market platforms, Kalshi, Polymarket, Robinhood, Coinbase and six more, arguing their event contracts on sports, awards and elections are illegal online gambling. She wants an immediate restraining order and an injunction. Kalshi fired back with an emergency filing of its own, and no court has ruled yet. Tonight brings US PPI at 20:30, the next number that decides whether $68,000 holds or the slide finds a new floor. When the price breaks and the rules get challenged on the same day, do you trade the chart or the courtroom first? #WhatWillDriveCryptoandStocks’NextRebound? #HedgeFundsCMEBitcoinNetShortsFall89%
124

·
--
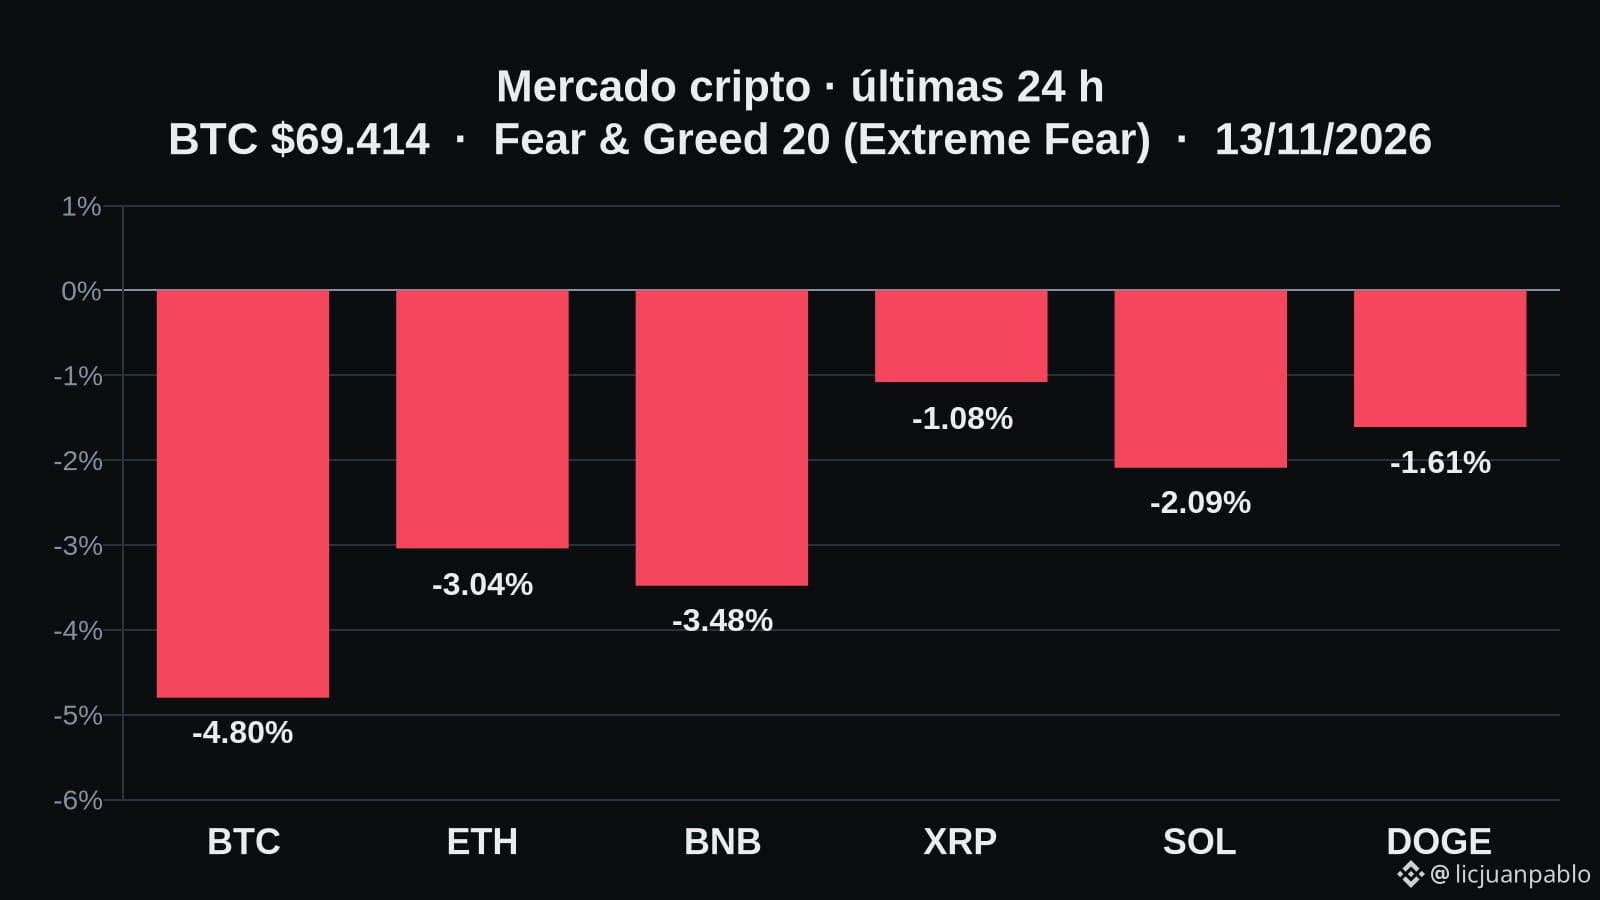
Did you see that $BTC fell 4.80% in 24 h and 8.86% in 7 d? That differential tells me bearish pressure is building, especially with the Fear & Greed Index at 20 (Extreme Fear). At the moment, I think it’s useful to monitor volume and $ETH’s reaction, which is also showing a larger decline over the week. Which signal do you think is most relevant for deciding your next analysis?
#HedgeFundsCMEBitcoinNetShortsFall89% #Bitcoin
Did you see that $BTC fell 4.80% in 24 h and 8.86% in 7 d? That differential tells me bearish pressure is building, especially with the Fear & Greed Index at 20 (Extreme Fear). At the moment, I think it’s useful to monitor volume and $ETH ’s reaction, which is also showing a larger decline over the week. Which signal do you think is most relevant for deciding your next analysis?
#HedgeFundsCMEBitcoinNetShortsFall89% #Bitcoin
#HedgeFundsCMEBitcoinNetShortsFall89% #Bitcoin
66


·
--
Let's talk about something real.
There's a quote about risk management that has always stuck with me: keeping every loss within tolerable limits is a prerequisite for staying in the game long term.
The noisier the market gets, the more important it is to stick to your own rhythm.
The same goes for $BTC . The market has always tested people.
Are you following? 👇
#市场观察 #BTC #Binance #HedgeFundsCMEBitcoinNetShortsFall89%
Let's talk about something real.
There's a quote about risk management that has always stuck with me: keeping every loss within tolerable limits is a prerequisite for staying in the game long term.
The noisier the market gets, the more important it is to stick to your own rhythm.
The same goes for $BTC . The market has always tested people.
Are you following? 👇
#市场观察 #BTC #Binance #HedgeFundsCMEBitcoinNetShortsFall89%
There's a quote about risk management that has always stuck with me: keeping every loss within tolerable limits is a prerequisite for staying in the game long term.
The noisier the market gets, the more important it is to stick to your own rhythm.
The same goes for $BTC . The market has always tested people.
Are you following? 👇
#市场观察 #BTC #Binance #HedgeFundsCMEBitcoinNetShortsFall89%

5
·
--

Article
BTC | Easy Read | 2026-11-13💡 Spotted a detail: $BTC 's VOLUME_PRICE_BREAKOUT reads 68,143.72. Volume is about 2.3 times the 20-bar average, and the close hit a new 50-bar low; no inference about what comes next.
📊 Data Snapshot
· Metric: VOLUME_PRICE_BREAKOUT
· Reading: 68,143.72
· Basis: Calculated from historical prices of closed candlesticks
Here are the data points; no need to take sides just yet
Are you watching? 👇
## How to read this data
This observation is calculated from the source interface's sequence of closed candlesticks. The indicator is a mathematical processing of historical prices; it describes only the observation point, does not predict price direction, and is not a buy or sell instruction.
BTC | Easy Read | 2026-11-13
💡 Spotted a detail: $BTC 's VOLUME_PRICE_BREAKOUT reads 68,143.72. Volume is about 2.3 times the 20-bar average, and the close hit a new 50-bar low; no inference about what comes next.
📊 Data Snapshot
· Metric: VOLUME_PRICE_BREAKOUT
· Reading: 68,143.72
· Basis: Calculated from historical prices of closed candlesticks
Here are the data points; no need to take sides just yet
Are you watching? 👇
## How to read this data
This observation is calculated from the source interface's sequence of closed candlesticks. The indicator is a mathematical processing of historical prices; it describes only the observation point, does not predict price direction, and is not a buy or sell instruction.
📊 Data Snapshot
· Metric: VOLUME_PRICE_BREAKOUT
· Reading: 68,143.72
· Basis: Calculated from historical prices of closed candlesticks
Here are the data points; no need to take sides just yet
Are you watching? 👇
## How to read this data
This observation is calculated from the source interface's sequence of closed candlesticks. The indicator is a mathematical processing of historical prices; it describes only the observation point, does not predict price direction, and is not a buy or sell instruction.
·
--

Article
BTC | Easy Read | 2026-11-13📊 The data is intriguing: $BTC ’s RANGE_LOW_24H came in at 68,143.72. The closing price fell below the lower boundary of the previous 24 complete candles; this does not claim that the break is valid or will continue
📊 Data Snapshot
· Metric: RANGE_LOW_24H
· Reading: 68,143.72
· Basis: Based on a sequence of closed candles
The numbers are right here; behind them is a whole lot of emotion
What do you make of this move? 👇
## How to read this data
This observation is calculated from the source interface’s sequence of closed candles. The indicator is a mathematical transformation of historical prices; it describes only the time of observation, does not predict price direction, and is not a buy or sell recommendation.
BTC | Easy Read | 2026-11-13
📊 The data is intriguing: $BTC ’s RANGE_LOW_24H came in at 68,143.72. The closing price fell below the lower boundary of the previous 24 complete candles; this does not claim that the break is valid or will continue
📊 Data Snapshot
· Metric: RANGE_LOW_24H
· Reading: 68,143.72
· Basis: Based on a sequence of closed candles
The numbers are right here; behind them is a whole lot of emotion
What do you make of this move? 👇
## How to read this data
This observation is calculated from the source interface’s sequence of closed candles. The indicator is a mathematical transformation of historical prices; it describes only the time of observation, does not predict price direction, and is not a buy or sell recommendation.
📊 Data Snapshot
· Metric: RANGE_LOW_24H
· Reading: 68,143.72
· Basis: Based on a sequence of closed candles
The numbers are right here; behind them is a whole lot of emotion
What do you make of this move? 👇
## How to read this data
This observation is calculated from the source interface’s sequence of closed candles. The indicator is a mathematical transformation of historical prices; it describes only the time of observation, does not predict price direction, and is not a buy or sell recommendation.
8
·
--
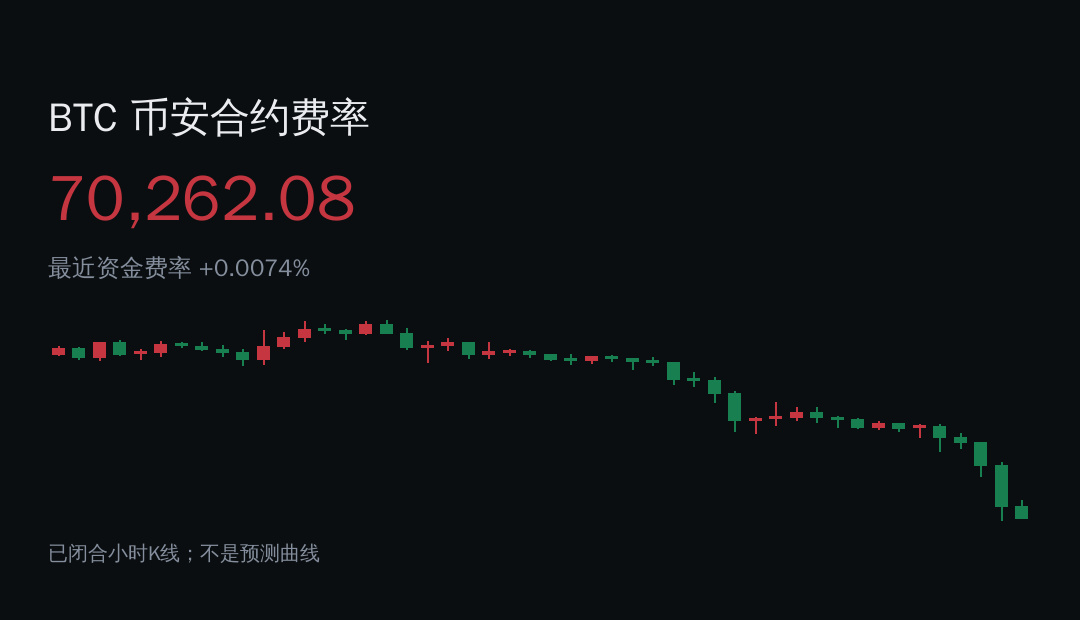
Amid all the excitement, let’s look closely at the numbers—the indicator notes for $BTC : PRICE_CHANGE_24H recorded 70,020.23. The 24h rolling price change is -5.1940%, reaching the 5% observation threshold; this does not predict the direction of prices.
📊 Data snapshot
· Indicator: PRICE_CHANGE_24H
· Reading: 70,020.23
· Methodology: Calculated from historical prices of closed candlesticks
So let’s not jump to conclusions just yet.
What do you think? 👇
#市场观察 #BTC #Binance #HedgeFundsCMEBitcoinNetShortsFall89%
Amid all the excitement, let’s look closely at the numbers—the indicator notes for $BTC : PRICE_CHANGE_24H recorded 70,020.23. The 24h rolling price change is -5.1940%, reaching the 5% observation threshold; this does not predict the direction of prices.
📊 Data snapshot
· Indicator: PRICE_CHANGE_24H
· Reading: 70,020.23
· Methodology: Calculated from historical prices of closed candlesticks
So let’s not jump to conclusions just yet.
What do you think? 👇
#市场观察 #BTC #Binance #HedgeFundsCMEBitcoinNetShortsFall89%
📊 Data snapshot
· Indicator: PRICE_CHANGE_24H
· Reading: 70,020.23
· Methodology: Calculated from historical prices of closed candlesticks
So let’s not jump to conclusions just yet.
What do you think? 👇
#市场观察 #BTC #Binance #HedgeFundsCMEBitcoinNetShortsFall89%

12
·
--
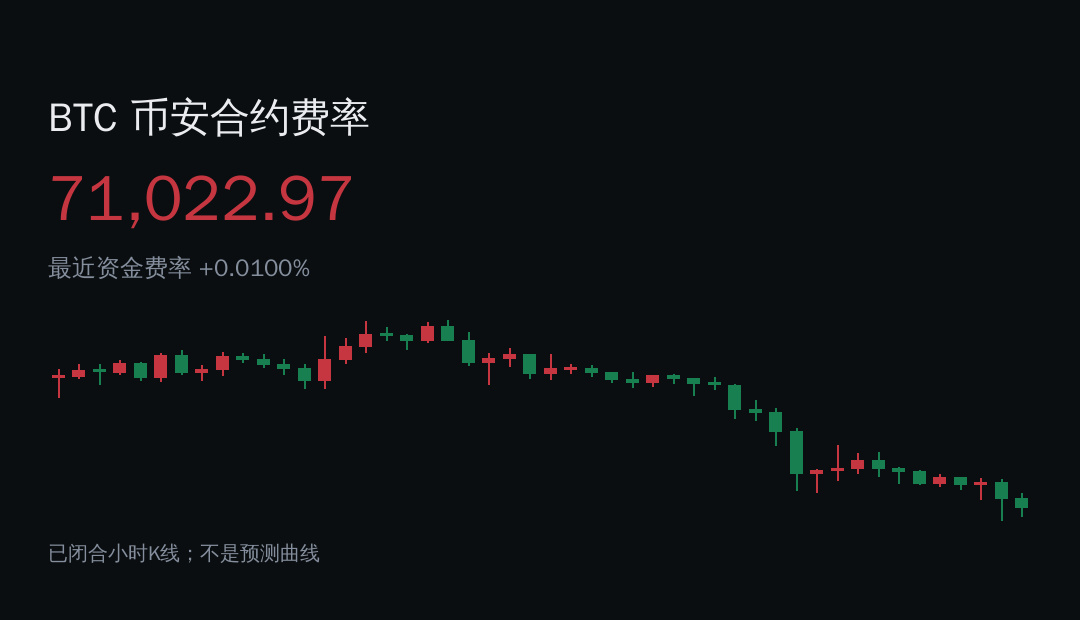
💡 Spotted a detail! The funding rate for $BTC is +0.0100%, and the mark price is 71022.97 USDT.
📊 Data snapshot
· Rate: +0.0100%
· Mark price: 71022.97 USDT
Seasoned traders know volume is more informative than price
Share your thoughts in the comments 👇
#市场观察 #BTC #Binance #HedgeFundsCMEBitcoinNetShortsFall89%
💡 Spotted a detail! The funding rate for $BTC is +0.0100%, and the mark price is 71022.97 USDT.
📊 Data snapshot
· Rate: +0.0100%
· Mark price: 71022.97 USDT
Seasoned traders know volume is more informative than price
Share your thoughts in the comments 👇
#市场观察 #BTC #Binance #HedgeFundsCMEBitcoinNetShortsFall89%
📊 Data snapshot
· Rate: +0.0100%
· Mark price: 71022.97 USDT
Seasoned traders know volume is more informative than price
Share your thoughts in the comments 👇
#市场观察 #BTC #Binance #HedgeFundsCMEBitcoinNetShortsFall89%
Log in to explore more content
Join global crypto users on Binance Square
⚡️ Get latest and useful information about crypto.
💬 Trusted by the world’s largest crypto exchange.
👍 Discover real insights from verified creators.
Email / Phone number
Trending Topics
1
#WhoWillSucceedJensenHuangatNvidia?
15,845 views
242 Discussing
2
#WhatWillDriveCryptoandStocks’NextRebound?
296,554 views
2,201 Discussing
3
#USPPIMissMayEaseBTCPressure
132,509 views
1,516 Discussing
4
#TONStrategyReports$23.97MQ3NetLoss
0 views
5 Discussing
5
#PolkadotCommunityApprovesNewStrategyWith97%Vote
0 views
25 Discussing
6
#dYdXPlansV9.9UpgradeToShiftUSDCToInjective
215 views
12 Discussing
7
#TradFiForBeginners
654,681 views
4,239 Discussing
8
#MANTRAPausesUnstakingFor7DaysAfterKeplrSecurityIncident
2,191 views
36 Discussing
9
#BitcoinCoreDisclosesTorTrafficVulnerability
61,928 views
892 Discussing
10
#BitcoinBreaksBelow200WeekMovingAverage
130,990 views
893 Discussing