

#flex
flex
12,717 views
104 Discussing
Hot
Latest

$FLEX SHORT
Will sellers hold initiative under current pressure? The indicator looks down as long as the initiative remains with the shorters, who are ready to push quotes toward the set targets. The main thing is to watch the market reaction and manage risks.
🏁Entry: 111.48
💰Target 1: 110.33123117 (+1.03%)
💰Target 2: 108.90246235 (+2.31%)
💰Target 3: 106.75930911 (+4.23%)
🛡Protection: 113.90315324 (-2.17%)
⚠️ This is not financial advice. Trade at your own risk. DYOR.
#FLEX #Bitcoin #macro 📈
$FLEX
$FLEX SHORT
Will sellers hold initiative under current pressure? The indicator looks down as long as the initiative remains with the shorters, who are ready to push quotes toward the set targets. The main thing is to watch the market reaction and manage risks.
🏁Entry: 111.48
💰Target 1: 110.33123117 (+1.03%)
💰Target 2: 108.90246235 (+2.31%)
💰Target 3: 106.75930911 (+4.23%)
🛡Protection: 113.90315324 (-2.17%)
⚠️ This is not financial advice. Trade at your own risk. DYOR.
#FLEX #Bitcoin #macro 📈
$FLEX
Will sellers hold initiative under current pressure? The indicator looks down as long as the initiative remains with the shorters, who are ready to push quotes toward the set targets. The main thing is to watch the market reaction and manage risks.
🏁Entry: 111.48
💰Target 1: 110.33123117 (+1.03%)
💰Target 2: 108.90246235 (+2.31%)
💰Target 3: 106.75930911 (+4.23%)
🛡Protection: 113.90315324 (-2.17%)
⚠️ This is not financial advice. Trade at your own risk. DYOR.
#FLEX #Bitcoin #macro 📈
$FLEX
14

·
--
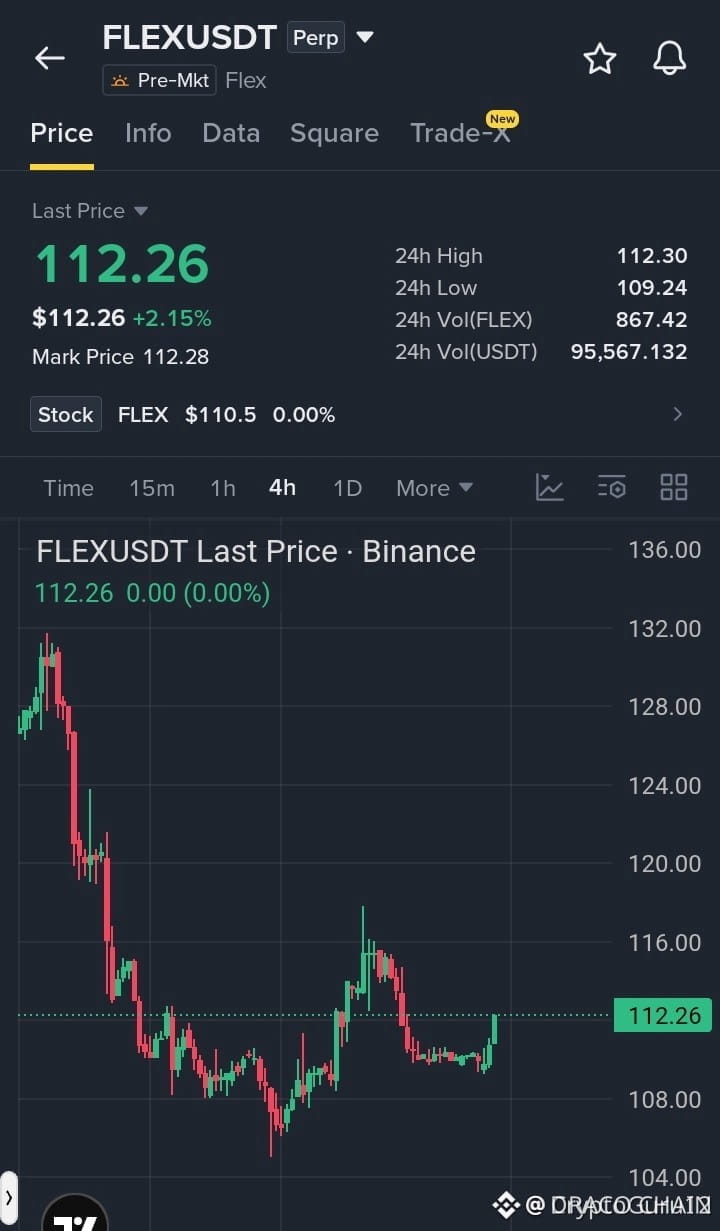
🚨 $FLEX RECLAIMS $112 STRUCTURAL PIVOT AFTER LIQUIDITY ABSORPTION IN DEMAND ZONE! 💥
Entry: 111.80 - 112.40 ⚡
Target: 113.50 / 114.50 / 116.00 🚀
Stop Loss: 110.00 ⚠️
Smart money defense across the $107–$109 accumulation floor triggered an aggressive 4H expansion, successfully reclaiming the crucial $112 structural pivot. 🔍 This move signals institutional buyers absorbing sell-side liquidity before initiating a continuation leg toward upper supply.
Holding above $112 confirms the range reclaim, clearing the path for an inefficiency fill up to the $116 resistance target. 📊 Momentum dynamics across $FLEX , $BTR , and $SKR indicate structural strength favors the bulls. 💬 Are you positioning for the extension to $116 or waiting for a secondary retest? 👇
⚠️ Not financial advice. Always manage your risk. 🛡️
🏷️ #FLEX #LongSetup #Crypto #Breakout #MarketStructure
🎯 🦈
🚨 $FLEX RECLAIMS $112 STRUCTURAL PIVOT AFTER LIQUIDITY ABSORPTION IN DEMAND ZONE! 💥
Entry: 111.80 - 112.40 ⚡
Target: 113.50 / 114.50 / 116.00 🚀
Stop Loss: 110.00 ⚠️
Smart money defense across the $107–$109 accumulation floor triggered an aggressive 4H expansion, successfully reclaiming the crucial $112 structural pivot. 🔍 This move signals institutional buyers absorbing sell-side liquidity before initiating a continuation leg toward upper supply.
Holding above $112 confirms the range reclaim, clearing the path for an inefficiency fill up to the $116 resistance target. 📊 Momentum dynamics across $FLEX , $BTR , and $SKR indicate structural strength favors the bulls. 💬 Are you positioning for the extension to $116 or waiting for a secondary retest? 👇
⚠️ Not financial advice. Always manage your risk. 🛡️
🏷️ #FLEX #LongSetup #Crypto #Breakout #MarketStructure
🎯 🦈
Entry: 111.80 - 112.40 ⚡
Target: 113.50 / 114.50 / 116.00 🚀
Stop Loss: 110.00 ⚠️
Smart money defense across the $107–$109 accumulation floor triggered an aggressive 4H expansion, successfully reclaiming the crucial $112 structural pivot. 🔍 This move signals institutional buyers absorbing sell-side liquidity before initiating a continuation leg toward upper supply.
Holding above $112 confirms the range reclaim, clearing the path for an inefficiency fill up to the $116 resistance target. 📊 Momentum dynamics across $FLEX , $BTR , and $SKR indicate structural strength favors the bulls. 💬 Are you positioning for the extension to $116 or waiting for a secondary retest? 👇
⚠️ Not financial advice. Always manage your risk. 🛡️
🏷️ #FLEX #LongSetup #Crypto #Breakout #MarketStructure
🎯 🦈
3

·
--
⚡ High Squeeze Probability on $FLEX — Shorts Paying Longs
📊 Derivatives Market Data:
• Funding Rate: -0.0433% (Annualized: ~-47.4%)
• Bias: Bearish crowded (Shorts pay) • Next Settlement: in 7h 11m
• Open Interest (OI): $300.0K
• Current Mark Price: 115.18862906
💡 Technical Interpretation:
Sellers are heavily crowding short positions and paying longs ~-47.4% APR to maintain leverage. When extreme negative funding meets any buyer absorption, the probability of a violent Short Squeeze increases dramatically.
💬 Where is your key liquidation target for $FLEX shorts? Share your view below 👇
#FLEX #ShortSqueeze #FuturesTrading #BinanceSquare
⚠️ Not financial advice. Extreme funding can precede high volatility — always use stop-losses.
⚡ High Squeeze Probability on $FLEX — Shorts Paying Longs
📊 Derivatives Market Data:
• Funding Rate: -0.0433% (Annualized: ~-47.4%)
• Bias: Bearish crowded (Shorts pay) • Next Settlement: in 7h 11m
• Open Interest (OI): $300.0K
• Current Mark Price: 115.18862906
💡 Technical Interpretation:
Sellers are heavily crowding short positions and paying longs ~-47.4% APR to maintain leverage. When extreme negative funding meets any buyer absorption, the probability of a violent Short Squeeze increases dramatically.
💬 Where is your key liquidation target for $FLEX shorts? Share your view below 👇
#FLEX #ShortSqueeze #FuturesTrading #BinanceSquare
⚠️ Not financial advice. Extreme funding can precede high volatility — always use stop-losses.
📊 Derivatives Market Data:
• Funding Rate: -0.0433% (Annualized: ~-47.4%)
• Bias: Bearish crowded (Shorts pay) • Next Settlement: in 7h 11m
• Open Interest (OI): $300.0K
• Current Mark Price: 115.18862906
💡 Technical Interpretation:
Sellers are heavily crowding short positions and paying longs ~-47.4% APR to maintain leverage. When extreme negative funding meets any buyer absorption, the probability of a violent Short Squeeze increases dramatically.
💬 Where is your key liquidation target for $FLEX shorts? Share your view below 👇
#FLEX #ShortSqueeze #FuturesTrading #BinanceSquare
⚠️ Not financial advice. Extreme funding can precede high volatility — always use stop-losses.
62
$FLEX SHORT
The structure of the move looks as if sellers are ready to keep pushing prices down.
Short-term sellers maintain the initiative, and the local background creates favorable conditions for a decline.
The risk of an upward correction is still minimal as long as the bearish scenario remains the priority.
🔹Entry zone: 107.59
🎯Take 1: 107.25122594 (+0.31%)
🎯Take 2: 106.70245188 (+0.82%)
🎯Take 3: 105.87929078 (+1.59%)
⛔️Stop: 108.62316109 (-0.96%)
⚠️ This is not financial advice. Trade at your own risk. DYOR.
#FLEX #BitcoinUpdate #TradeStories 📈
$FLEX
$FLEX SHORT
The structure of the move looks as if sellers are ready to keep pushing prices down.
Short-term sellers maintain the initiative, and the local background creates favorable conditions for a decline.
The risk of an upward correction is still minimal as long as the bearish scenario remains the priority.
🔹Entry zone: 107.59
🎯Take 1: 107.25122594 (+0.31%)
🎯Take 2: 106.70245188 (+0.82%)
🎯Take 3: 105.87929078 (+1.59%)
⛔️Stop: 108.62316109 (-0.96%)
⚠️ This is not financial advice. Trade at your own risk. DYOR.
#FLEX #BitcoinUpdate #TradeStories 📈
$FLEX
The structure of the move looks as if sellers are ready to keep pushing prices down.
Short-term sellers maintain the initiative, and the local background creates favorable conditions for a decline.
The risk of an upward correction is still minimal as long as the bearish scenario remains the priority.
🔹Entry zone: 107.59
🎯Take 1: 107.25122594 (+0.31%)
🎯Take 2: 106.70245188 (+0.82%)
🎯Take 3: 105.87929078 (+1.59%)
⛔️Stop: 108.62316109 (-0.96%)
⚠️ This is not financial advice. Trade at your own risk. DYOR.
#FLEX #BitcoinUpdate #TradeStories 📈
$FLEX
26

·
--
$FLEX Current price 107.5, down 1.249% in the past 24 hours. The funding rate is driven to 0—so neither longs nor shorts have to pay. Liquidity has contracted like this, which clearly indicates they’re waiting for direction.
The core of the Trump trade is policy expectations. As soon as anything starts to move over in the US stock market, on-chain perps swing along with it. Now that the funding rate has returned to zero, it means everyone is watching and waiting—no one is stubbornly holding their position. This is calm before the storm; once the US stock market gets a clear direction, volatility in correlated assets like $FLEX will be amplified first.
The strongest counter-evidence: both sides are lying low, and it could also simply grind downward quietly and wear people out.
Trading tag: #TradFi #链上美股 #FLEX
Where do you think this judgment is most likely to be wrong?
$FLEX Current price 107.5, down 1.249% in the past 24 hours. The funding rate is driven to 0—so neither longs nor shorts have to pay. Liquidity has contracted like this, which clearly indicates they’re waiting for direction.
The core of the Trump trade is policy expectations. As soon as anything starts to move over in the US stock market, on-chain perps swing along with it. Now that the funding rate has returned to zero, it means everyone is watching and waiting—no one is stubbornly holding their position. This is calm before the storm; once the US stock market gets a clear direction, volatility in correlated assets like $FLEX will be amplified first.
The strongest counter-evidence: both sides are lying low, and it could also simply grind downward quietly and wear people out.
Trading tag: #TradFi #链上美股 #FLEX
Where do you think this judgment is most likely to be wrong?
The core of the Trump trade is policy expectations. As soon as anything starts to move over in the US stock market, on-chain perps swing along with it. Now that the funding rate has returned to zero, it means everyone is watching and waiting—no one is stubbornly holding their position. This is calm before the storm; once the US stock market gets a clear direction, volatility in correlated assets like $FLEX will be amplified first.
The strongest counter-evidence: both sides are lying low, and it could also simply grind downward quietly and wear people out.
Trading tag: #TradFi #链上美股 #FLEX
Where do you think this judgment is most likely to be wrong?
41

Trading volume keeps shrinking, short positions continue to be held—watch it for 0
No fluff, straight to the analysis.
🔥 $FLEX #FLEX 【Main】
Current price $110.27, 24h change -4.59%
24h trading value is only $348k, bottom of the whole market
→ Volume down 49.9%; the fuel for the rebound is decreasing—continue holding shorts until it reaches 0
If it just goes sideways without rising, that’s weakness
If you want to short, wait for the rebound to $132.32, set stop-loss at $145.56
These are also good opportunities to short:
---
$SKR
Current $0.017511, 24h change -8.48%
Entry setup: place a short at $0.021013, set stop-loss at 10% ($0.023115)
---
$ALCH
Current $0.034990, 24h change -3.21%
Entry setup: place a short at $0.041988, set stop-loss at 10% ($0.046187)
---
⚠️ Small capital—test carefully, strictly follow stop-loss, and don’t trade without risk control
#短线交易 #Crypto
Trading volume keeps shrinking, short positions continue to be held—watch it for 0
No fluff, straight to the analysis.
🔥 $FLEX #FLEX 【Main】
Current price $110.27, 24h change -4.59%
24h trading value is only $348k, bottom of the whole market
→ Volume down 49.9%; the fuel for the rebound is decreasing—continue holding shorts until it reaches 0
If it just goes sideways without rising, that’s weakness
If you want to short, wait for the rebound to $132.32, set stop-loss at $145.56
These are also good opportunities to short:
---
$SKR
Current $0.017511, 24h change -8.48%
Entry setup: place a short at $0.021013, set stop-loss at 10% ($0.023115)
---
$ALCH
Current $0.034990, 24h change -3.21%
Entry setup: place a short at $0.041988, set stop-loss at 10% ($0.046187)
---
⚠️ Small capital—test carefully, strictly follow stop-loss, and don’t trade without risk control
#短线交易 #Crypto
No fluff, straight to the analysis.
🔥 $FLEX #FLEX 【Main】
Current price $110.27, 24h change -4.59%
24h trading value is only $348k, bottom of the whole market
→ Volume down 49.9%; the fuel for the rebound is decreasing—continue holding shorts until it reaches 0
If it just goes sideways without rising, that’s weakness
If you want to short, wait for the rebound to $132.32, set stop-loss at $145.56
These are also good opportunities to short:
---
$SKR
Current $0.017511, 24h change -8.48%
Entry setup: place a short at $0.021013, set stop-loss at 10% ($0.023115)
---
$ALCH
Current $0.034990, 24h change -3.21%
Entry setup: place a short at $0.041988, set stop-loss at 10% ($0.046187)
---
⚠️ Small capital—test carefully, strictly follow stop-loss, and don’t trade without risk control
#短线交易 #Crypto
87
·
--
$FLEX Over the past 24 hours, it’s down 5.278%, and the trading screen feels lifeless. The funding rate is steady at zero—neither longs nor shorts is paying anyone. This is a quiet, silent tape.
Trump’s bluster hasn’t stopped lately—tariffs, manufacturing reshoring—he’s thrown a whole combo punch. In response, traditional industrial and infrastructure stocks in the US market have shown some reaction. But when you open $FLEX ’s chart, it’s a move that has nothing to do with it. This is the most twisted part right now: macro narratives are calling it “the Trump trade,” yet on-chain, the contract underlying the US-equity index it corresponds to is expressing indifference through price declines and a zero funding rate. My take is very direct: the market is mispricing $FLEX. Either on-chain funds don’t really believe Trump can materially boost its constituent stocks, or in the short term, liquidity has been siphoned off by other hotspots.
Look at the data. Price is falling, and the funding rate is zero. This pairing is uncommon. Usually, when prices drop, you see a negative funding rate—meaning shorts are squeezing longs, and shorts have to pay. But here the funding rate is zero, suggesting shorts aren’t making a firm, aggressive bet and haven’t formed a crowded bearish consensus. Longs also haven’t been forced into the situation where they need to pay to throw in the towel. Open interest is 2722.71. The number itself isn’t huge, but combined with a zero funding rate, it points to a low-volatility, low-interest market.
The biggest cost-bearers might be those longs who were expecting the Trump linkage and positioned early. They’re now left hanging in midair: they haven’t lost much (funding is zero), and they haven’t made money either (the price is falling).
What’s the strongest counter-argument? That the “Trump trade” itself is a false premise. The underlying real-world companies behind $FLEX are barely affected. Its decline is purely collateral damage from a contraction in risk appetite across the crypto market. If that’s true, then $FLEX will next follow Big Pie (BTC) rather than paying attention to news from Washington.
The second-order effect has already appeared. If one of Trump’s speeches or policies suddenly lifts US stock index futures, the shorts in $FLEX would be the first group forced to cover. With near-zero cost to short when the funding rate is zero, these positions are quite loose—any breeze can trigger a stampede. Conversely, if the market continues to desensitize itself to political narratives, $FLEX may keep drifting lower, testing more important support levels below.
The invalidation conditions are clear: if the price of $FLEX rises back above 120, and the funding rate turns positive, I’ll admit I’m wrong. That would mean the market is starting to “buy into” Trump, longs are willing to pay to accumulate, and the whole logic flips.
Action.
Trading tag: #TradFi #链上美股 #FLEX
Where do you think this set of judgments is most likely to be wrong?
$FLEX Over the past 24 hours, it’s down 5.278%, and the trading screen feels lifeless. The funding rate is steady at zero—neither longs nor shorts is paying anyone. This is a quiet, silent tape.
Trump’s bluster hasn’t stopped lately—tariffs, manufacturing reshoring—he’s thrown a whole combo punch. In response, traditional industrial and infrastructure stocks in the US market have shown some reaction. But when you open $FLEX ’s chart, it’s a move that has nothing to do with it. This is the most twisted part right now: macro narratives are calling it “the Trump trade,” yet on-chain, the contract underlying the US-equity index it corresponds to is expressing indifference through price declines and a zero funding rate. My take is very direct: the market is mispricing $FLEX . Either on-chain funds don’t really believe Trump can materially boost its constituent stocks, or in the short term, liquidity has been siphoned off by other hotspots.
Look at the data. Price is falling, and the funding rate is zero. This pairing is uncommon. Usually, when prices drop, you see a negative funding rate—meaning shorts are squeezing longs, and shorts have to pay. But here the funding rate is zero, suggesting shorts aren’t making a firm, aggressive bet and haven’t formed a crowded bearish consensus. Longs also haven’t been forced into the situation where they need to pay to throw in the towel. Open interest is 2722.71. The number itself isn’t huge, but combined with a zero funding rate, it points to a low-volatility, low-interest market.
The biggest cost-bearers might be those longs who were expecting the Trump linkage and positioned early. They’re now left hanging in midair: they haven’t lost much (funding is zero), and they haven’t made money either (the price is falling).
What’s the strongest counter-argument? That the “Trump trade” itself is a false premise. The underlying real-world companies behind $FLEX are barely affected. Its decline is purely collateral damage from a contraction in risk appetite across the crypto market. If that’s true, then $FLEX will next follow Big Pie (BTC) rather than paying attention to news from Washington.
The second-order effect has already appeared. If one of Trump’s speeches or policies suddenly lifts US stock index futures, the shorts in $FLEX would be the first group forced to cover. With near-zero cost to short when the funding rate is zero, these positions are quite loose—any breeze can trigger a stampede. Conversely, if the market continues to desensitize itself to political narratives, $FLEX may keep drifting lower, testing more important support levels below.
The invalidation conditions are clear: if the price of $FLEX rises back above 120, and the funding rate turns positive, I’ll admit I’m wrong. That would mean the market is starting to “buy into” Trump, longs are willing to pay to accumulate, and the whole logic flips.
Action.
Trading tag: #TradFi #链上美股 #FLEX
Where do you think this set of judgments is most likely to be wrong?
Trump’s bluster hasn’t stopped lately—tariffs, manufacturing reshoring—he’s thrown a whole combo punch. In response, traditional industrial and infrastructure stocks in the US market have shown some reaction. But when you open $FLEX ’s chart, it’s a move that has nothing to do with it. This is the most twisted part right now: macro narratives are calling it “the Trump trade,” yet on-chain, the contract underlying the US-equity index it corresponds to is expressing indifference through price declines and a zero funding rate. My take is very direct: the market is mispricing $FLEX . Either on-chain funds don’t really believe Trump can materially boost its constituent stocks, or in the short term, liquidity has been siphoned off by other hotspots.
Look at the data. Price is falling, and the funding rate is zero. This pairing is uncommon. Usually, when prices drop, you see a negative funding rate—meaning shorts are squeezing longs, and shorts have to pay. But here the funding rate is zero, suggesting shorts aren’t making a firm, aggressive bet and haven’t formed a crowded bearish consensus. Longs also haven’t been forced into the situation where they need to pay to throw in the towel. Open interest is 2722.71. The number itself isn’t huge, but combined with a zero funding rate, it points to a low-volatility, low-interest market.
The biggest cost-bearers might be those longs who were expecting the Trump linkage and positioned early. They’re now left hanging in midair: they haven’t lost much (funding is zero), and they haven’t made money either (the price is falling).
What’s the strongest counter-argument? That the “Trump trade” itself is a false premise. The underlying real-world companies behind $FLEX are barely affected. Its decline is purely collateral damage from a contraction in risk appetite across the crypto market. If that’s true, then $FLEX will next follow Big Pie (BTC) rather than paying attention to news from Washington.
The second-order effect has already appeared. If one of Trump’s speeches or policies suddenly lifts US stock index futures, the shorts in $FLEX would be the first group forced to cover. With near-zero cost to short when the funding rate is zero, these positions are quite loose—any breeze can trigger a stampede. Conversely, if the market continues to desensitize itself to political narratives, $FLEX may keep drifting lower, testing more important support levels below.
The invalidation conditions are clear: if the price of $FLEX rises back above 120, and the funding rate turns positive, I’ll admit I’m wrong. That would mean the market is starting to “buy into” Trump, longs are willing to pay to accumulate, and the whole logic flips.
Action.
Trading tag: #TradFi #链上美股 #FLEX
Where do you think this set of judgments is most likely to be wrong?
27
·
--
$FLEX rose 4.886% in the past 24 hours, with the current price at 115.92—but the key is not here. The funding rate has gone to zero. Neither the long nor the short side needs to pay; the position cost is reset to zero. It’s up by nearly 5%, but no one is paying—this suggests that the people holding positions are currently in profit. If it rises further, it becomes net profit.
This usually means longs and shorts have reached a short-term balance, or that the shorts have already mostly surrendered. If there’s even a little change in geopolitics or policy, in this zero-fee environment, buying a bit can push the price up because sell pressure is light.
Trading tag: #TradFi #链上美股 #FLEX
Where do you think this kind of judgment is most likely to be wrong?
$FLEX rose 4.886% in the past 24 hours, with the current price at 115.92—but the key is not here. The funding rate has gone to zero. Neither the long nor the short side needs to pay; the position cost is reset to zero. It’s up by nearly 5%, but no one is paying—this suggests that the people holding positions are currently in profit. If it rises further, it becomes net profit.
This usually means longs and shorts have reached a short-term balance, or that the shorts have already mostly surrendered. If there’s even a little change in geopolitics or policy, in this zero-fee environment, buying a bit can push the price up because sell pressure is light.
Trading tag: #TradFi #链上美股 #FLEX
Where do you think this kind of judgment is most likely to be wrong?
This usually means longs and shorts have reached a short-term balance, or that the shorts have already mostly surrendered. If there’s even a little change in geopolitics or policy, in this zero-fee environment, buying a bit can push the price up because sell pressure is light.
Trading tag: #TradFi #链上美股 #FLEX
Where do you think this kind of judgment is most likely to be wrong?
4
·
--
$FLEX is up 4.886% to 115.92; the funding rate is still zero, and the position size is 2,744. Political and military events are causing noise, but this ticket is stable like a stone. The funding hasn’t moved, neither bulls nor bears are taking positions, and the price rise is clean. If geopolitical risk escalates, US stock index futures may get dumped first and then picked back up; with a lighter position, $FLEX is actually easier to push. Invalidation condition: if it falls below 115, this thesis is void. Action: use 0.5 of the position to test the waters; stop loss at 114.
Trading tag: #TradFi #链上美股 #FLEX
Where do you think this setup is most likely to be wrong?
$FLEX is up 4.886% to 115.92; the funding rate is still zero, and the position size is 2,744. Political and military events are causing noise, but this ticket is stable like a stone. The funding hasn’t moved, neither bulls nor bears are taking positions, and the price rise is clean. If geopolitical risk escalates, US stock index futures may get dumped first and then picked back up; with a lighter position, $FLEX is actually easier to push. Invalidation condition: if it falls below 115, this thesis is void. Action: use 0.5 of the position to test the waters; stop loss at 114.
Trading tag: #TradFi #链上美股 #FLEX
Where do you think this setup is most likely to be wrong?
Trading tag: #TradFi #链上美股 #FLEX
Where do you think this setup is most likely to be wrong?
2
·
--
$FLEX 24 hours up 4.886%, quote 115.92. The funding rate has gone to zero, and the open interest is 2744.
Political events usually hit risk assets, but this one is going up against the trend. A zero funding rate indicates neutral leverage sentiment; the rise is likely driven by spot or off-exchange demand.
Strongest counterargument: This could be a dead-cat bounce right before a major market selloff; the independent move may get dragged down at any time.
Second-order impact: If geopolitical tensions persist, capital may continue looking for non-mainstream U.S. stock contracts to use as alternative hedges.
Invalidation conditions: If the price breaks below 115 and the funding rate turns positive, then the judgment is invalid.
Trading tag: #TradFi #链上美股 #FLEX
Where do you think this setup is most likely to be wrong?
$FLEX 24 hours up 4.886%, quote 115.92. The funding rate has gone to zero, and the open interest is 2744.
Political events usually hit risk assets, but this one is going up against the trend. A zero funding rate indicates neutral leverage sentiment; the rise is likely driven by spot or off-exchange demand.
Strongest counterargument: This could be a dead-cat bounce right before a major market selloff; the independent move may get dragged down at any time.
Second-order impact: If geopolitical tensions persist, capital may continue looking for non-mainstream U.S. stock contracts to use as alternative hedges.
Invalidation conditions: If the price breaks below 115 and the funding rate turns positive, then the judgment is invalid.
Trading tag: #TradFi #链上美股 #FLEX
Where do you think this setup is most likely to be wrong?
Political events usually hit risk assets, but this one is going up against the trend. A zero funding rate indicates neutral leverage sentiment; the rise is likely driven by spot or off-exchange demand.
Strongest counterargument: This could be a dead-cat bounce right before a major market selloff; the independent move may get dragged down at any time.
Second-order impact: If geopolitical tensions persist, capital may continue looking for non-mainstream U.S. stock contracts to use as alternative hedges.
Invalidation conditions: If the price breaks below 115 and the funding rate turns positive, then the judgment is invalid.
Trading tag: #TradFi #链上美股 #FLEX
Where do you think this setup is most likely to be wrong?
1
18

·
--
INSTITUTIONAL INFLOWS IN $FLEX TRIGGERING CAPITAL ROTATION ACROSS $LAB AND $LSK ! 🚀 ⚡
Aggressive order flow expansion on $FLEX is creating an immediate liquidity spillover effect across connected assets. Smart money is actively absorbing sell-side pressure, driving momentum straight into secondary structural targets like $LAB and $LSK . 📊
Waiting for extended vertical expansion increases execution risk significantly. Positioning during this initial structural displacement offers far cleaner risk management before retail chasing creates unwanted slippage. 🌊
💡 Are you trading the primary breakout on $FLEX or positioning early for the capital rotation into $LAB and $LSK ? 👇
⚠️ Not financial advice. Always manage your risk. 🛡️
🏷️ #FLEX #Altcoins #MarketStructure #Breakout
⚡ 🦈
INSTITUTIONAL INFLOWS IN $FLEX TRIGGERING CAPITAL ROTATION ACROSS $LAB AND $LSK ! 🚀 ⚡
Aggressive order flow expansion on $FLEX is creating an immediate liquidity spillover effect across connected assets. Smart money is actively absorbing sell-side pressure, driving momentum straight into secondary structural targets like $LAB and $LSK . 📊
Waiting for extended vertical expansion increases execution risk significantly. Positioning during this initial structural displacement offers far cleaner risk management before retail chasing creates unwanted slippage. 🌊
💡 Are you trading the primary breakout on $FLEX or positioning early for the capital rotation into $LAB and $LSK ? 👇
⚠️ Not financial advice. Always manage your risk. 🛡️
🏷️ #FLEX #Altcoins #MarketStructure #Breakout
⚡ 🦈
Aggressive order flow expansion on $FLEX is creating an immediate liquidity spillover effect across connected assets. Smart money is actively absorbing sell-side pressure, driving momentum straight into secondary structural targets like $LAB and $LSK . 📊
Waiting for extended vertical expansion increases execution risk significantly. Positioning during this initial structural displacement offers far cleaner risk management before retail chasing creates unwanted slippage. 🌊
💡 Are you trading the primary breakout on $FLEX or positioning early for the capital rotation into $LAB and $LSK ? 👇
⚠️ Not financial advice. Always manage your risk. 🛡️
🏷️ #FLEX #Altcoins #MarketStructure #Breakout
⚡ 🦈

86

·
--
💥 $FLEX IGNITES MASSIVE MOMENTUM AS CAPITAL SPILLS INTO $LAB AND $LSK ! 🚀
Aggressive buyer absorption on $FLEX is creating an explosive chain reaction across the entire setup. 📊 Capital flow is already spilling over into $LAB and $LSK , preparing for a coordinated sector-wide surge before the broader market catches on.
Order books are thinning out rapidly, and waiting for a multi-x move only leaves late buyers taking the hit at peak euphoria. ⚡ Positioning early while order flow momentum is just waking up offers the cleanest risk-to-reward profile on the board.
💡 Smart money is securing prime liquidity ahead of the retail rush. 💬 Are you placing your bids while the train is at the station or waiting to chase at resistance? 👇
⚠️ Not financial advice. Always manage your risk. 🛡️
🏷️ #FLEX #LAB #LSK #Breakout #Crypto
🚀 ⚡
💥 $FLEX IGNITES MASSIVE MOMENTUM AS CAPITAL SPILLS INTO $LAB AND $LSK ! 🚀
Aggressive buyer absorption on $FLEX is creating an explosive chain reaction across the entire setup. 📊 Capital flow is already spilling over into $LAB and $LSK , preparing for a coordinated sector-wide surge before the broader market catches on.
Order books are thinning out rapidly, and waiting for a multi-x move only leaves late buyers taking the hit at peak euphoria. ⚡ Positioning early while order flow momentum is just waking up offers the cleanest risk-to-reward profile on the board.
💡 Smart money is securing prime liquidity ahead of the retail rush. 💬 Are you placing your bids while the train is at the station or waiting to chase at resistance? 👇
⚠️ Not financial advice. Always manage your risk. 🛡️
🏷️ #FLEX #LAB #LSK #Breakout #Crypto
🚀 ⚡
Aggressive buyer absorption on $FLEX is creating an explosive chain reaction across the entire setup. 📊 Capital flow is already spilling over into $LAB and $LSK , preparing for a coordinated sector-wide surge before the broader market catches on.
Order books are thinning out rapidly, and waiting for a multi-x move only leaves late buyers taking the hit at peak euphoria. ⚡ Positioning early while order flow momentum is just waking up offers the cleanest risk-to-reward profile on the board.
💡 Smart money is securing prime liquidity ahead of the retail rush. 💬 Are you placing your bids while the train is at the station or waiting to chase at resistance? 👇
⚠️ Not financial advice. Always manage your risk. 🛡️
🏷️ #FLEX #LAB #LSK #Breakout #Crypto
🚀 ⚡

54

🚨 $FLEX EXPANDS AS INSTITUTIONAL MOMENTUM BUILDS ACROSS KEY ALTS! ⚡
Smart money accumulation is quietly surfacing on $FLEX as order flow shifts aggressively toward buyer dominance. 📊 Structural compression across the lower timeframes suggests liquidity has been swept from recent lows, leaving the path of least resistance to the upside.
We are seeing early momentum alignment across $LAB and $LSK as well, pointing to a broader capital rotation into mid-cap inefficiency gaps. 💡 When key structural pivots reclaim higher ground with expanding volume, institutional expansion typically follows. 🔍 Which of these setups fits your execution framework best right now? 👇
⚠️ Not financial advice. Always manage your risk. 🛡️
🏷️ #FLEX #LAB #LSK #Crypto #MarketStructure
⚡ 🎯
🚨 $FLEX EXPANDS AS INSTITUTIONAL MOMENTUM BUILDS ACROSS KEY ALTS! ⚡
Smart money accumulation is quietly surfacing on $FLEX as order flow shifts aggressively toward buyer dominance. 📊 Structural compression across the lower timeframes suggests liquidity has been swept from recent lows, leaving the path of least resistance to the upside.
We are seeing early momentum alignment across $LAB and $LSK as well, pointing to a broader capital rotation into mid-cap inefficiency gaps. 💡 When key structural pivots reclaim higher ground with expanding volume, institutional expansion typically follows. 🔍 Which of these setups fits your execution framework best right now? 👇
⚠️ Not financial advice. Always manage your risk. 🛡️
🏷️ #FLEX #LAB #LSK #Crypto #MarketStructure
⚡ 🎯
Smart money accumulation is quietly surfacing on $FLEX as order flow shifts aggressively toward buyer dominance. 📊 Structural compression across the lower timeframes suggests liquidity has been swept from recent lows, leaving the path of least resistance to the upside.
We are seeing early momentum alignment across $LAB and $LSK as well, pointing to a broader capital rotation into mid-cap inefficiency gaps. 💡 When key structural pivots reclaim higher ground with expanding volume, institutional expansion typically follows. 🔍 Which of these setups fits your execution framework best right now? 👇
⚠️ Not financial advice. Always manage your risk. 🛡️
🏷️ #FLEX #LAB #LSK #Crypto #MarketStructure
⚡ 🎯

66

FRESH MOMENTUM UNLOCKS EXPLOSIVE UPSIDE POTENTIAL FOR $FLEX AS BUYERS TAKE CONTROL! 🚀 ⚡
$FLEX is quietly shifting gears as aggressive buyers step in to absorb overhead supply. Order flow on the lower timeframes reveals steady accumulation, setting up a prime environment for momentum continuation. 📊
When volume expands alongside structural reclaims like this, capital typically front-runs the expansion phase. ⚡ Keep $LAB and $LSK on your radar as secondary rotational targets if liquidity spreads across the sector. 💡
💬 Are you bidding this $FLEX setup early or waiting for confirmed breakout volume? 👇
⚠️ Not financial advice. Always manage your risk. 🛡️
🏷️ #FLEX #Altcoins #Crypto #Breakout #LAB
🔥 💎
FRESH MOMENTUM UNLOCKS EXPLOSIVE UPSIDE POTENTIAL FOR $FLEX AS BUYERS TAKE CONTROL! 🚀 ⚡
$FLEX is quietly shifting gears as aggressive buyers step in to absorb overhead supply. Order flow on the lower timeframes reveals steady accumulation, setting up a prime environment for momentum continuation. 📊
When volume expands alongside structural reclaims like this, capital typically front-runs the expansion phase. ⚡ Keep $LAB and $LSK on your radar as secondary rotational targets if liquidity spreads across the sector. 💡
💬 Are you bidding this $FLEX setup early or waiting for confirmed breakout volume? 👇
⚠️ Not financial advice. Always manage your risk. 🛡️
🏷️ #FLEX #Altcoins #Crypto #Breakout #LAB
🔥 💎
$FLEX is quietly shifting gears as aggressive buyers step in to absorb overhead supply. Order flow on the lower timeframes reveals steady accumulation, setting up a prime environment for momentum continuation. 📊
When volume expands alongside structural reclaims like this, capital typically front-runs the expansion phase. ⚡ Keep $LAB and $LSK on your radar as secondary rotational targets if liquidity spreads across the sector. 💡
💬 Are you bidding this $FLEX setup early or waiting for confirmed breakout volume? 👇
⚠️ Not financial advice. Always manage your risk. 🛡️
🏷️ #FLEX #Altcoins #Crypto #Breakout #LAB
🔥 💎

12
$FLEX LONG
Will buyers be able to build an upward scenario after holding the initial positions? The bulls still maintain initiative, creating good prerequisites for a steady rise in prices. If the current pace holds without sharp pullbacks, the asset has every chance to continue moving toward the set targets.
🔹Entry zone: 115.98
✅Take Profit 1: 117.83467256 (+1.60%)
✅Take Profit 2: 119.76934512 (+3.27%)
✅Take Profit 3: 122.67135395 (+5.77%)
⛔️Stop: 112.99799116 (-2.57%)
⚠️ This is not financial advice. Trade at your own risk. DYOR.
#FLEX #Crypto #Криптовалюта 📈
$FLEX
$FLEX LONG
Will buyers be able to build an upward scenario after holding the initial positions? The bulls still maintain initiative, creating good prerequisites for a steady rise in prices. If the current pace holds without sharp pullbacks, the asset has every chance to continue moving toward the set targets.
🔹Entry zone: 115.98
✅Take Profit 1: 117.83467256 (+1.60%)
✅Take Profit 2: 119.76934512 (+3.27%)
✅Take Profit 3: 122.67135395 (+5.77%)
⛔️Stop: 112.99799116 (-2.57%)
⚠️ This is not financial advice. Trade at your own risk. DYOR.
#FLEX #Crypto #Криптовалюта 📈
$FLEX
Will buyers be able to build an upward scenario after holding the initial positions? The bulls still maintain initiative, creating good prerequisites for a steady rise in prices. If the current pace holds without sharp pullbacks, the asset has every chance to continue moving toward the set targets.
🔹Entry zone: 115.98
✅Take Profit 1: 117.83467256 (+1.60%)
✅Take Profit 2: 119.76934512 (+3.27%)
✅Take Profit 3: 122.67135395 (+5.77%)
⛔️Stop: 112.99799116 (-2.57%)
⚠️ This is not financial advice. Trade at your own risk. DYOR.
#FLEX #Crypto #Криптовалюта 📈
$FLEX
9
·
--
FLEX is up nearly 7% over the past 24 hours, and the funding rate has reached above 0.0007. When geopolitical tensions are high, the longs aggressively add positions, accumulating the elevated costs from chasing.
At this funding level, a move upward would indicate bullish sentiment is building—but this is also a common structure for a top squeeze. If geopolitical risk truly triggers a flight-to-safety demand, digital assets could be mistreated as collateral damage, and FLEX—an on-chain U.S.-stock-style contract—would be hit first.
Once the longs’ funding accumulation reaches a certain point, some capital will begin to exit early. Chasing longs now is like catching a falling knife. If the price breaks below the psychological level of 110, the short-term structure will be invalidated.
Trading tag: #TradFi #链上美股 #FLEX
Where do you think this assessment is most likely to be wrong?
FLEX is up nearly 7% over the past 24 hours, and the funding rate has reached above 0.0007. When geopolitical tensions are high, the longs aggressively add positions, accumulating the elevated costs from chasing.
At this funding level, a move upward would indicate bullish sentiment is building—but this is also a common structure for a top squeeze. If geopolitical risk truly triggers a flight-to-safety demand, digital assets could be mistreated as collateral damage, and FLEX—an on-chain U.S.-stock-style contract—would be hit first.
Once the longs’ funding accumulation reaches a certain point, some capital will begin to exit early. Chasing longs now is like catching a falling knife. If the price breaks below the psychological level of 110, the short-term structure will be invalidated.
Trading tag: #TradFi #链上美股 #FLEX
Where do you think this assessment is most likely to be wrong?
At this funding level, a move upward would indicate bullish sentiment is building—but this is also a common structure for a top squeeze. If geopolitical risk truly triggers a flight-to-safety demand, digital assets could be mistreated as collateral damage, and FLEX—an on-chain U.S.-stock-style contract—would be hit first.
Once the longs’ funding accumulation reaches a certain point, some capital will begin to exit early. Chasing longs now is like catching a falling knife. If the price breaks below the psychological level of 110, the short-term structure will be invalidated.
Trading tag: #TradFi #链上美股 #FLEX
Where do you think this assessment is most likely to be wrong?
45

·
--
Bearish
$FLEX /USDT strongest bearish chart🤑
It's doesn't break resistance level and coming back to support level😱
Don't miss this golden opportunity 👇👇
Sl: 117.85
Tp: 114-112-108💥
Open short position for some profit $FLEX
{future}(FLEXUSDT)
$RAYSOL also create same pattern🎉 Check profile
{future}(RAYSOLUSDT)
#SANAlphaDesk #FLEX #USmarket
$FLEX /USDT strongest bearish chart🤑
It's doesn't break resistance level and coming back to support level😱
Don't miss this golden opportunity 👇👇
Sl: 117.85
Tp: 114-112-108💥
Open short position for some profit $FLEX
$RAYSOL also create same pattern🎉 Check profile
#SANAlphaDesk #FLEX #USmarket
It's doesn't break resistance level and coming back to support level😱
Don't miss this golden opportunity 👇👇
Sl: 117.85
Tp: 114-112-108💥
Open short position for some profit $FLEX
$RAYSOL also create same pattern🎉 Check profile
#SANAlphaDesk #FLEX #USmarket


89
·
--
$FLEX current price 116.06, up nearly 7% in 24 hours. Funding rate is 0.00077—longs are paying shorts.
This rally is very likely driven by sentiment and funding, with no corresponding political or military event actually materializing. On-chain US stock contracts mapping to geopolitical events is usually straightforward—for example, defense stocks or energy stocks. With no specific event catalyst right now, this upside move and the funding-rate structure look more like the market is pricing in the potential impact of future conflict.
The strongest counterargument is that if there is indeed a military action escalation, the relevant underlying assets would surge straight up—so going long right now is essentially betting on that.
Trading tag: #TradFi #链上美股 #FLEX
Where do you think this assessment is most likely to be wrong?
$FLEX current price 116.06, up nearly 7% in 24 hours. Funding rate is 0.00077—longs are paying shorts.
This rally is very likely driven by sentiment and funding, with no corresponding political or military event actually materializing. On-chain US stock contracts mapping to geopolitical events is usually straightforward—for example, defense stocks or energy stocks. With no specific event catalyst right now, this upside move and the funding-rate structure look more like the market is pricing in the potential impact of future conflict.
The strongest counterargument is that if there is indeed a military action escalation, the relevant underlying assets would surge straight up—so going long right now is essentially betting on that.
Trading tag: #TradFi #链上美股 #FLEX
Where do you think this assessment is most likely to be wrong?
This rally is very likely driven by sentiment and funding, with no corresponding political or military event actually materializing. On-chain US stock contracts mapping to geopolitical events is usually straightforward—for example, defense stocks or energy stocks. With no specific event catalyst right now, this upside move and the funding-rate structure look more like the market is pricing in the potential impact of future conflict.
The strongest counterargument is that if there is indeed a military action escalation, the relevant underlying assets would surge straight up—so going long right now is essentially betting on that.
Trading tag: #TradFi #链上美股 #FLEX
Where do you think this assessment is most likely to be wrong?
53

·
--
Bullish
$FLEX
{future}(FLEXUSDT)
LONG TRADE SIGNAL
$FLEX is showing a strong recovery after defending the lower range. The recent candles are pushing higher with clear buying pressure, while the move back toward the 117 area shows buyers are still in control. If this resistance breaks and holds, the next upside move could extend toward the 120–124 zone.
Trade Setup:
Entry: 114.50–116.50
TP1: 120.00
TP2: 124.00
#FLEX
$FLEX
LONG TRADE SIGNAL
$FLEX is showing a strong recovery after defending the lower range. The recent candles are pushing higher with clear buying pressure, while the move back toward the 117 area shows buyers are still in control. If this resistance breaks and holds, the next upside move could extend toward the 120–124 zone.
Trade Setup:
Entry: 114.50–116.50
TP1: 120.00
TP2: 124.00
#FLEX
LONG TRADE SIGNAL
$FLEX is showing a strong recovery after defending the lower range. The recent candles are pushing higher with clear buying pressure, while the move back toward the 117 area shows buyers are still in control. If this resistance breaks and holds, the next upside move could extend toward the 120–124 zone.
Trade Setup:
Entry: 114.50–116.50
TP1: 120.00
TP2: 124.00
#FLEX

1
15

·
--
The old dog swept over the order book. In the past 24 hours, $FLEX is up 5.505%, and the price has reached 116.52. At the same time, the funding rate has been holding steady at 0, while the open interest has climbed slightly to 2757.37 contracts. When price breaks upward and neither the funding rate nor the open interest shows extreme signals, it’s a setup I usually pay extra attention to.
From one angle, this is the resonance between on-chain perpetual contracts in Crypto and TradFi. Data-wise, as a US-stock-style on-chain perpetual, $FLEX’s movement is influenced not only by its own long-vs-short battle, but also by the broader environment—especially Bitcoin sentiment. The funding rate is 0, which means neither longs nor shorts need to pay the other right now, and the market doesn’t show obvious one-sided overcrowding. As price rises, open interest increases moderately, suggesting new capital is building positions—not merely old positions churning in a tug-of-war. Looking at it as a single signal, this appears to be a relatively healthy bullish structure.
The strongest counterargument is that this kind of mild rally lacks a spark. There’s no negative funding squeeze forcing shorts to cover, and there’s no explosive surge in open interest that would create expectations of a violent short squeeze—so the sustainability of the move is questionable. More importantly, the constraint comes from outside: if Bitcoin sees a sharp pullback, assets linked to tech stocks and crypto sentiment like this one are unlikely to stay unscathed and will get dragged down too.
My take is that this breakout looks more like genuine buy pressure being built up gradually rather than a short-term sentiment-driven move. A flat funding rate means the cost of betting on上涨 is low. Open interest growth indicates someone is taking positioning seriously. The market may be overlooking something: when overall sentiment is cautious, a rise without obvious overcrowding tends to be sturdier. The anti-consensus part is that many people see the funding rate being 0 and think it’s not exciting—but the old dog believes neutral funding combined with a rising price is precisely a signal that longs are starting to get the upper hand, but not yet overheated.
The trigger conditions are very clear: if the price pulls back to around 115 and can hold, and the open interest doesn’t noticeably shrink, I’ll consider trying a small position. If the price directly breaks below 115, or if open interest drops sharply while the funding rate quickly turns positive, I’ll fully exit and stand aside to observe. The biggest risk is that BTC might deliver a deep drop—then all risk assets will get hit, and $FLEX’s move will fail as well. In plain terms: we’re waiting for a pullback confirmation opportunity, not chasing highs.
Trading tag: #BinanceFutures #TradFi #USDⓈM #FLEX #FLEXUSDT $FLEX
The old dog swept over the order book. In the past 24 hours, $FLEX is up 5.505%, and the price has reached 116.52. At the same time, the funding rate has been holding steady at 0, while the open interest has climbed slightly to 2757.37 contracts. When price breaks upward and neither the funding rate nor the open interest shows extreme signals, it’s a setup I usually pay extra attention to.
From one angle, this is the resonance between on-chain perpetual contracts in Crypto and TradFi. Data-wise, as a US-stock-style on-chain perpetual, $FLEX ’s movement is influenced not only by its own long-vs-short battle, but also by the broader environment—especially Bitcoin sentiment. The funding rate is 0, which means neither longs nor shorts need to pay the other right now, and the market doesn’t show obvious one-sided overcrowding. As price rises, open interest increases moderately, suggesting new capital is building positions—not merely old positions churning in a tug-of-war. Looking at it as a single signal, this appears to be a relatively healthy bullish structure.
The strongest counterargument is that this kind of mild rally lacks a spark. There’s no negative funding squeeze forcing shorts to cover, and there’s no explosive surge in open interest that would create expectations of a violent short squeeze—so the sustainability of the move is questionable. More importantly, the constraint comes from outside: if Bitcoin sees a sharp pullback, assets linked to tech stocks and crypto sentiment like this one are unlikely to stay unscathed and will get dragged down too.
My take is that this breakout looks more like genuine buy pressure being built up gradually rather than a short-term sentiment-driven move. A flat funding rate means the cost of betting on上涨 is low. Open interest growth indicates someone is taking positioning seriously. The market may be overlooking something: when overall sentiment is cautious, a rise without obvious overcrowding tends to be sturdier. The anti-consensus part is that many people see the funding rate being 0 and think it’s not exciting—but the old dog believes neutral funding combined with a rising price is precisely a signal that longs are starting to get the upper hand, but not yet overheated.
The trigger conditions are very clear: if the price pulls back to around 115 and can hold, and the open interest doesn’t noticeably shrink, I’ll consider trying a small position. If the price directly breaks below 115, or if open interest drops sharply while the funding rate quickly turns positive, I’ll fully exit and stand aside to observe. The biggest risk is that BTC might deliver a deep drop—then all risk assets will get hit, and $FLEX ’s move will fail as well. In plain terms: we’re waiting for a pullback confirmation opportunity, not chasing highs.
Trading tag: #BinanceFutures #TradFi #USDⓈM #FLEX #FLEXUSDT $FLEX
From one angle, this is the resonance between on-chain perpetual contracts in Crypto and TradFi. Data-wise, as a US-stock-style on-chain perpetual, $FLEX ’s movement is influenced not only by its own long-vs-short battle, but also by the broader environment—especially Bitcoin sentiment. The funding rate is 0, which means neither longs nor shorts need to pay the other right now, and the market doesn’t show obvious one-sided overcrowding. As price rises, open interest increases moderately, suggesting new capital is building positions—not merely old positions churning in a tug-of-war. Looking at it as a single signal, this appears to be a relatively healthy bullish structure.
The strongest counterargument is that this kind of mild rally lacks a spark. There’s no negative funding squeeze forcing shorts to cover, and there’s no explosive surge in open interest that would create expectations of a violent short squeeze—so the sustainability of the move is questionable. More importantly, the constraint comes from outside: if Bitcoin sees a sharp pullback, assets linked to tech stocks and crypto sentiment like this one are unlikely to stay unscathed and will get dragged down too.
My take is that this breakout looks more like genuine buy pressure being built up gradually rather than a short-term sentiment-driven move. A flat funding rate means the cost of betting on上涨 is low. Open interest growth indicates someone is taking positioning seriously. The market may be overlooking something: when overall sentiment is cautious, a rise without obvious overcrowding tends to be sturdier. The anti-consensus part is that many people see the funding rate being 0 and think it’s not exciting—but the old dog believes neutral funding combined with a rising price is precisely a signal that longs are starting to get the upper hand, but not yet overheated.
The trigger conditions are very clear: if the price pulls back to around 115 and can hold, and the open interest doesn’t noticeably shrink, I’ll consider trying a small position. If the price directly breaks below 115, or if open interest drops sharply while the funding rate quickly turns positive, I’ll fully exit and stand aside to observe. The biggest risk is that BTC might deliver a deep drop—then all risk assets will get hit, and $FLEX ’s move will fail as well. In plain terms: we’re waiting for a pullback confirmation opportunity, not chasing highs.
Trading tag: #BinanceFutures #TradFi #USDⓈM #FLEX #FLEXUSDT $FLEX
4
Log in to explore more content
Join global crypto users on Binance Square
⚡️ Get latest and useful information about crypto.
💬 Trusted by the world’s largest crypto exchange.
👍 Discover real insights from verified creators.
Email / Phone number
Trending Topics
1
#AmazonPlansToSell$8BNvidiaChips
0 views
0 Discussing
2
#NEARFallsToAround$4.70Down14%
19,396 views
28 Discussing
3
#EthereumFoundationLaunchesZkAPIOnMainnet
9,175 views
196 Discussing
4
#EvernorthPlansNasdaqListingOct8
22,489 views
196 Discussing
5
#SECProposesCryptoCustodyFramework
21,719 views
173 Discussing
6
#IMFApproves$139MDisbursementToElSalvador
17,362 views
16 Discussing
7
#AnthropicTargetsIPOAsSoonAsMidNovember
19,401 views
185 Discussing
8
#EtherGains70.9%InQ3
221,227 views
1,462 Discussing
9
#TreasuryLetsStatesFileStablecoinCertificationsEarly
16,734 views
108 Discussing
10
#US10YearYieldNears5.3%
182,914 views
1,326 Discussing