

#ethereumfallsbelow
ethereumfallsbelow
1,019 views
112 Discussing
Hot
Latest

·
--
Ethereum below $2500 isn’t a crash it’s a filter.
The price broke below a level that had held for 6 weeks. That matters because it changed the structure.
Traders who waited for a retest of $2500 as support are now seeing it become resistance.
Volume hasn’t spiked. This isn’t panic selling. It’s slow distribution.
I’m not adding to longs. I’m watching for a close above $2550 on 2x average volume.
I’m doing nothing right now.
The thing that proves me wrong: Ethereum holds 2450 and climbs back above 2600 with rising volume in 72 hours.
What’s your setup? #EthereumFallsBelow$2500
Not financial advice. My levels, my risk.
6

Every major $ETH breakdown in the last two cycles started while traders were still sitting in greed.
You know the feeling. Price slips under a level you thought would hold and every instinct tells you to cut before it gets worse.
I have seen this movie. 2018. 2022. $ETH always looks finished when it loses a round number.
What most people miss is that Ethereum's circulating supply behaves differently now. Over a quarter of it is staked. Another chunk sits idle on L2s. That is not the same free-floating dump we used to get.
When $BTC also prints an intraday low in the same window, the correlation usually means the market is flushing leverage, not abandoning the asset. Watch $USDT leaving exchanges after these drops. That flow has marked local bottoms more times than I can count.
Where do you think this one actually finds a floor?
#EthereumFallsBelow #BitcoinDropsToIntradayLow

43

·
--
Picture this: you wake up to a cascade of price alerts as the second largest asset in crypto slips below key psychological support.
Most traders immediately panic sell at the local bottom or aggressively open leveraged longs, only to get chopped up by erratic wick action. It is that classic dilemma of trying to catch a falling knife without knowing where the structural floor actually sits.
We have seen this script play out before. In past cycles, whenever $ETH experienced sharp drawdowns against $BTC, market sentiment swung violently toward doom before capital quietly rotated back in. While short-term liquidity is shifting into defensive reserves and select DeFi protocols like $AAVE, the underlying network settlement volume tells a much steadier story than spot charts reflect.
Unlike purely speculative tokens that evaporate during corrections, major ecosystem contractions tend to flush out overleveraged derivatives and reset funding rates for sustainable structure.
Where do you see the market finding its true footing this time?
#EthereumFallsBelow #BitcoinReboundsTo #FedHikeOddsRiseTo89
Picture this: you wake up to a cascade of price alerts as the second largest asset in crypto slips below key psychological support.
Most traders immediately panic sell at the local bottom or aggressively open leveraged longs, only to get chopped up by erratic wick action. It is that classic dilemma of trying to catch a falling knife without knowing where the structural floor actually sits.
We have seen this script play out before. In past cycles, whenever $ETH experienced sharp drawdowns against $BTC , market sentiment swung violently toward doom before capital quietly rotated back in. While short-term liquidity is shifting into defensive reserves and select DeFi protocols like $AAVE , the underlying network settlement volume tells a much steadier story than spot charts reflect.
Unlike purely speculative tokens that evaporate during corrections, major ecosystem contractions tend to flush out overleveraged derivatives and reset funding rates for sustainable structure.
Where do you see the market finding its true footing this time?
#EthereumFallsBelow #BitcoinReboundsTo #FedHikeOddsRiseTo89

45
·
--
everyone thinks buying the dip on key support levels is easy money, but actually most degens are just walking straight into liquidity traps.
watching your portfolio bleed out while trying to catch a falling knife is the fastest way to get wrecked, especially when you panic rotate into dead bounces just to feel something.
ngl we saw this play out with $ETC and $DOT traders getting chopped up last week before the real dump hit. when $ETH loses critical floor levels, the entire market doesn't just bounce back in five minutes ser. what usually happens is a slow bleed where open interest stays stubbornly high while spot volume disappears, wiping out high-leverage longs step by step.
the smart play here isn't blindly longing every red candle just because the greed index is flashing warm. let the funding rates reset and wait for market structure to actually show absorption on higher timeframes instead of front-running a reversal that has no backing.
where do you think the real floor is before we see genuine spot demand step in?
#EthereumFallsBelow #BitcoinDropsToIntradayLow
37

·
--
Ethereum has recently fallen below the significant psychological level of $2400, sparking concerns among investors. This price action reflects a shift in market sentiment, potentially driven by broader macroeconomic factors or specific developments within the Ethereum ecosystem. The drop below this key support level suggests that current buying pressure is waning, and bears may be gaining control. Traders and holders will be closely watching to see if this is a temporary pullback or the beginning of a more sustained downtrend. Key indicators to monitor include trading volume, on-chain metrics, and the overall crypto market trend. The ability of Ethereum to reclaim and hold above $2400 will be crucial in determining its short-term trajectory.
Disclaimer: This is not financial advice. Always do your own research before investing.
#EthereumFallsBelow$2400 $ETH
Disclaimer: This is not financial advice. Always do your own research before investing.
#EthereumFallsBelow$2400 $ETH
17
Everyone thinks buying every $ETH dip is a cheat code but actually thats the fastest way to get your bags stuck underwater for months.
watched too many people ape in the second it falls below a round number then just sit there watching red. that pain of catching a falling knife while you keep telling yourself its just a shakeout hits different ngl.
this breakdown is a textbook case. $ETH slipping while greed is still sitting at 69 is not a healthy pullback ser. thats distribution. last cycle people stacked what they thought was support and then watched it bleed another 30 percent before any real bounce even showed up.
$BTC bouncing while eth lags is the tell. when bitcoin rebounds and ethereum refuses to tag along thats usually not a coincidence. $AAVE and the rest of the eth stack tend to get dragged right with it so if youre holding those you already know how this movie goes. fed hike odds climbing just piles more pressure on anything that isnt holding the line.
where do you think this goes from here if eth keeps losing these levels?
#EthereumFallsBelow #BitcoinReboundsTo #FedHikeOddsRiseTo89

13

·
--
1. Overview of the Ethereum Price Trend
As of 03:00 AM on September 14, 2026 (UTC), Ethereum (ETH) has the latest price of $2,512.24. Looking back at the 1-hour candlestick chart over the past 5 hours, ETH shows a clear pattern of a bottoming rebound. The first candlestick opened at $2,475.56 and closed at $2,477.10, with a relatively small range of fluctuation, indicating the market was consolidating at low levels. Then, the second candlestick displayed a lower shadow probing down; the low reached $2,464.71, but the close rebounded to $2,484.42, suggesting strong support beneath. The third candlestick continued the rebound, closing at $2,493.56. The fourth candlestick saw a surge on increased volume—its high touched $2,513.57 and it closed at $2,511.42. The gain on that single candlestick was nearly $18. The latest candlestick dipped slightly to $2,509.36, but overall it still trades above the $2,510 level. From $2,475 to $2,512, ETH rebounded by about $37 in 5 hours, up roughly 1.5%, as short-term bullish momentum gradually recovers.
2. In-depth Interpretation of Technical Indicators
Moving averages: MA7 is currently 2,494.34, MA25 is 2,498.64, and MA99 is 2,498.62. The ETH price is above all three moving averages, and the short- and mid-term averages show the early formation of a bullish alignment. EMA7 is 2,499.60, EMA25 is 2,501.24, and EMA99 is 2,501.77. Price has also broken through all the exponential moving averages, indicating the trend is turning bullish. Bollinger Bands: the upper band is 2,520.67, the middle band is 2,493.57, and the lower band is 2,466.47. The current price is trading near the upper band, implying strength in the short term; however, there is strong resistance around the $2,520 area, so it’s important to watch whether price can break through effectively.
MACD shows positive signals. The MACD value is -2.97, the signal line is -5.06, and the histogram has narrowed for four consecutive periods from -0.55 and turned positive to +2.09, forming a golden cross pattern. This suggests that short-term momentum is recovering quickly and bullish strength is increasing. If the MACD value continues moving toward the zero line and turns positive, it will confirm a medium-term bullish signal.
RSI: RSI6 is 62.24, RSI12 is 54.90, and RSI24 is 51.38. The short-term RSI has entered a relatively strong zone, while the mid-term RSI is in a neutral-to-bullish position, showing there is still room for the rebound but it has not entered an overbought range. KDJ: the K value is 67.47, D is 58.77, and J is as high as 84.87. The three lines are diverging upward, and the J value is in a high zone. Short-term bullish sentiment is strong, but there is a risk of pullback caused by the J value becoming too high.
Parabolic SAR: SAR is currently 2,465.69, far below the current price, confirming a short-term bullish trend. William’s %R (WR) is -19.24, which is in a bullish region but not yet at an extreme level. Stochastic RSI is 87.02 and the moving average value is 69.34, which has entered a high zone—there is technical pullback risk in the short term. ATR is 15.27, indicating moderate volatility, meaning the current move is a rebound but has not entered a high-volatility phase.
3. Comprehensive Signals and Market Sentiment
The AI comprehensive signal system shows that among 15 factors, 9 are bullish, 5 are bearish, and 1 is neutral—bulls make up 60%. However, the final composite indicator issues a bearish signal. Historically, the win rate for shorting is higher (66.67%), meaning bearish trades have had better results. This contradiction reflects the complexity of the current market: short-term technical conditions are improving noticeably, but mid-cycle factors still keep the downside risk in view.
From a fundamentals perspective, on September 11 ETH recorded a net inflow of $216.4 million in ETFs, and institutional confidence has clearly rebounded. Large entities have cumulatively locked 5.9 million ETH for staking, reducing circulating supply while strengthening long-term holding confidence. ETH’s Q3 return rate reached 60.6%, which is impressive. However, the US Fed’s August CPI came in hotter than expected (core month-over-month growth of 0.3%), and the probability of rate hikes at the September 16 FOMC meeting has risen to over 87%. Expectations of tighter macro liquidity are weighing on the crypto market. In addition, the US Senate will conduct a procedural vote on the CLARITY bill on September 15, and the outcome will directly affect market sentiment.
At present, the key resistance level above ETH is $2,535. If price cannot break through effectively, the short term may test support in the $2,490 to $2,500 range. The stronger support lies near $2,465—around the lower Bollinger Band and the SAR level.
4. Trending Tokens and Topics
Popular tokens with notable gains today include: REZ at a current price of $0.004881, up 30.96% over the past 24 hours; CVC at $0.03064, up 20.77% over the past 24 hours; and FIL at $0.9682, up 19.98% over the past 24 hours. All three tokens have risen significantly, reflecting a rebound in market risk appetite and rotational rebound signs among mid- and small-cap tokens.
Regarding today’s market topics, discussions about AI industry regulation continue to heat up. Meanwhile, the Bitcoin network has repeatedly seen block reorganizations, raising attention on technical security. The move after Ethereum broke below $2,500 has also sparked lively debate within the community. Investors should closely monitor the interaction between macro policy and technical factors, and handle short-term volatility cautiously.
#AnthropicCEOCallsForAISlowdown #BitcoinThirdSingleBlockReorgInFourWeeks #EthereumFallsBelow$2500
80
·
--
1. Price Trend Overview
As of 05:00 on September 14, 2026 (UTC), Ethereum’s latest price is $2,513.64. Over the past 5 hours, ETH has steadily climbed from a low of $2,484 to $2,513, with a high near $2,520. This indicates that the bulls have gained effective support around the $2,500 level. In the second wave of the rally, trading volume reached $31.17 million—its largest in the last 5 hours—before falling back to $9.45 million. The market is taking a brief pause at these higher levels.
2. Technical Indicator Interpretation
The moving average system shows a bullish alignment: MA7 at $2,501 has crossed above MA25 at $2,498 and MA99 at $2,499. The three EMA lines are also bullish: EMA7 at $2,506, EMA25 at $2,503, and EMA99 at $2,502—confirming a short-term upward trend.
For MACD, the DIF line has rebounded from -6.17 to -0.14, approaching the zero axis. The DEA signal line is at -3.43, while the histogram has expanded for four consecutive periods, reaching 3.29. A golden cross is likely imminent, and upward momentum is building. RSI values are RSI6 at 65.46, RSI12 at 57.03, and RSI24 at 52.56—neutral-to-strong but not yet overbought. KDJ readings are K at 80.81, D at 70.43, and J at 101.57; the indicators are in the overbought zone, suggesting a short-term pullback may be needed.
For Bollinger Bands, price is moving between the mid band at $2,496 and the upper band at $2,526, with $2,526 serving as a key resistance level. ATR has fallen to $14.06, indicating volatility contraction. SAR is at $2,469, below the current price, confirming short-term bullishness.
3. Composite Factors and Quant Signals
An AI quant model shows that among 15 factors, 9 are bullish, 5 bearish, and 1 neutral, with bulls accounting for 60%. However, the final composite indicator signal is bearish, with a win rate of 61.76% and an overall win rate of 68.09%. Higher-weight bearish factors contribute more to the bearish outlook: alpha15 has a bearish win rate of 61.22%, and alpha11’s bearish win rate is 51.02%. Bullish factor win rates range from 42.86% to 57.14%, indicating inconsistent direction. Having many factors does not guarantee correct direction—the key is how weighting and win rate are considered together.
4. Market Sentiment and Macro Background
CME FedWatch indicates the probability of a 25 bps rate hike by the Fed in September’s FOMC is about 87%. August core CPI rose 0.3% month-over-month, exceeding expectations; Goldman Sachs has revised its stance to expect a rate hike. Rising interest rates create liquidity pressure for the crypto market, with BTC trading sideways around $77,000.
On regulation: the U.S. Senate will hold a procedural vote on the CLARITY bill on September 15, requiring 60 votes. Most Democratic lawmakers oppose it due to ethical clauses. Polymarket predicts about a 30% chance of passage in 2026.
Fund flows have shown divergence: Bitcoin ETFs saw net outflows of $463 million last week, ending three weeks of net inflows, while Ethereum ETFs recorded a contrary net inflow of $197 million. This marks the fourth consecutive week of positive inflows. BlackRock’s ETHA led with $140 million, suggesting institutional capital is rotating from BTC toward ETH. BNB Chain has surpassed Solana and ETH in RWA growth. The global tokenized stocks market cap increased from $350 million to $2.2 billion. Uniswap’s monthly trading volume has surpassed $70 billion, providing fundamental support for ETH’s long-term value.
5. Trending Tokens and Topics
Top trending tokens today:
REZ Price $0.004623, Up 33.23%
CVC Price $0.03371, Up 32.04%
MTL Price $0.398, Up 23.60%
#AnthropicCEOCallsForAISlowdown #BitcoinThirdSingleBlockReorgInFourWeeks #EthereumFallsBelow$2500
73
·
--
1. Market Overview
Bitcoin’s current price is around $77,583. Over the past few hours, it rebounded from a low of $76,636 to around $77,700, an increase of about 1.2%. Hourly candlestick charts show BTC gradually rising after finding solid support near $76,600. The high touched $77,869. The market is currently at a critical moment: on September 15, the U.S. Senate will hold a procedural vote on the CLARITY crypto bill, while the upcoming FOMC meetings on September 16–17 are also approaching. CME futures indicate an 87% probability of a 25-basis-point rate hike. With these two major macro events overlapping, market sentiment is showing clear signs of waiting and watching.
2. Technical Indicator Analysis
Regarding moving averages: MA7 is at $77,311, MA25 at $77,136, and MA99 at $77,333. Price is trading above the short-term moving averages but slightly below MA99. If it effectively breaks through $77,500 and holds, it may open up upside room. The MACD “golden cross” has been confirmed: the histogram value has risen from -10.93 to +67.85, with the DIF line (86.72) crossing above the DEA line (18.87). Bullish momentum is accelerating. RSI6 is 62.31, RSI12 is 59.12—slightly strong in the short term, but not yet overbought. Stochastic RSI is at 94.00, already in the severe overbought zone, suggesting a potential technical pullback in the near term. KDJ shows K at 76.77, D at 70.80, and J at 88.71: all three lines are in high territory, with short-term overbought pressure. The Bollinger Bands upper band is $77,793, the middle band is $77,161, and the lower band is $76,529; the current price is close to the upper band. SAR is at $76,529 and Super Trend is at $76,675; both maintain bullish signals. ATR has fallen from 310 to 293, indicating volatility is contracting. The market is waiting for a directional catalyst to trigger.
3. Composite Signals and Market Sentiment
The AI composite signal system shows that among 15 technical factors, 9 are bullish, 5 bearish, and 1 neutral. Bullish share is 60%, and the composite indicator value of 1.42 points to a bullish direction, with a historical win rate of 84.21%. From the news perspective: last week, U.S. spot Bitcoin ETFs saw net outflows of $463 million after three consecutive weeks of net inflows—institutional funds appear to have retreated ahead of macro uncertainty. At the same time, Ethereum ETF net inflows were $197 million for the fourth consecutive week of positive inflows, indicating capital rotation within crypto assets. On the macro front, Goldman Sachs adjusted its September Fed expectations to a 25-basis-point hike, and August core CPI rose 0.3% month-over-month, exceeding expectations. The CLARITY bill requires 60 votes for support, but many Democratic lawmakers oppose it; Polymarket estimates the passage probability at roughly 30%.
4. Hot Token Updates
REZ is currently $0.004516, up 28.77% over the past 24 hours. CVC is currently $0.03229, up 27.38%. MTL is currently $0.396, up 20.73%. Strong performance in small- and mid-cap tokens suggests that risk appetite in the market still exists, but high-volatility risk should not be ignored.
5. Risk Warning
Key risks include: the Fed rate hike being nearly a certainty, which suppresses liquidity; if the CLARITY bill is not passed, regulatory uncertainty could persist. An attack on Saudi Arabia’s oil pipeline could push oil prices up to $108 per barrel, impacting global risk appetite. Technically, both stochastic RSI and KDJ indicate short-term overbought conditions. If the price cannot break above the Bollinger Bands upper band ($77,793), it may pull back to test support at the middle band ($77,161). Investors should manage position sizing and closely monitor the September 15 Senate vote and the FOMC interest-rate decision on September 17.
#AnthropicCEOCallsForAISlowdown #BitcoinThirdSingleBlockReorgInFourWeeks #EthereumFallsBelow$2500
·
--
I. Overview of Ethereum Price Trends
As of September 14, 2026, Ethereum (ETH) is trading at approximately $2,514. Over the past several hours, it has shown a mild upward trend. Based on hourly candlestick data, ETH started around $2,484, gradually climbed to a high of $2,520, and then pulled back slightly. It is currently ranging narrowly between $2,513 and $2,515. This suggests that buyers are working to keep the price above the $2,500 psychological level, but upside momentum has begun to slow.
In terms of trading volume, during the price rise, volume gradually declined from $31.18 million to $3.04 million, showing a typical volume-price divergence. This implies that the current upward move is more driven by short-covering rather than fresh buying demand. If volume cannot increase effectively afterward, the price may face downside pullback pressure.
II. In-Depth Interpretation of Technical Indicators
Regarding moving averages, the 7-day moving average is near $2,501; the 25-day moving average is at $2,498; and the 99-day moving average is at $2,499. The short-term moving average has already crossed above the mid- and long-term moving averages, forming the early structure of a bullish alignment. The 7-day EMA is at $2,506, above the 25-day EMA at $2,503 and the 99-day EMA at $2,502, further confirming that the short-term trend is biased bullish. However, the overall spacing among the three moving averages is relatively narrow, indicating that the trend has not fully unfolded and the market is still in a stage of direction selection.
The MACD indicator shows that the DIF line has rapidly rebounded from -6.17 to -0.15. The DEA line has slowly risen from -5.91 to -3.43, and the histogram has expanded for four consecutive bars to +3.28. MACD is about to complete a crossover above the zero axis, which is a key signal that the short- to mid-term momentum may strengthen. If the DIF line can cross above the zero axis further, it would form a clearer bullish trend.
For the RSI indicator, the 6-day RSI is 65.2, the 12-day RSI is 56.9, and the 24-day RSI is 52.5. The short-term RSI is in a relatively strong region but has not yet entered overbought territory. The mid-term RSI is in a neutral-to-bullish range, suggesting that there may still be some upside room. However, it is worth noting that the stochastic RSI has risen to an extreme level of 98.8, and the KDJ J value is already at 101.4, indicating a heightened risk of a technical overbought pullback in the short term.
For the Bollinger Bands, the upper band is at $2,526, the middle band at $2,496, and the lower band at $2,466. The current price is approaching the upper band, and the band width has expanded slightly, hinting that volatility may increase. If the price can break above the upper band effectively, it could open further upside space; if it is rejected near the upper band, it may retest support at the middle band.
The SAR (parabolic) indicator is currently near $2,470, far below the current price, maintaining a bullish signal. The OBV volume indicator has risen from -61186 to -33366, showing that selling pressure from capital outflows has been easing, but it is still in negative territory—net inflows have not turned positive yet.
III. Market Sentiment and Macroeconomic Factors
Based on a multi-factor signal analysis, among 15 factors, 10 are emitting bullish signals, 4 are bearish, and 1 is neutral. The bullish share is 66.7%. However, the composite indicator issues a bearish signal, and the historical win rate is 63.64%, suggesting that the price may face a technical pullback in the near term. The model performance with an overall win rate of 70.21% indicates that the market is currently in a complex scenario where bullish and bearish forces are intertwined.
On the macro front, the probability of the Fed raising rates by 25 basis points on September 16 has climbed to 87%. August core CPI came in above expectations (0.3% vs. 0.2%), prompting Goldman Sachs to shift to a rate-hike expectation. This macro headwind suppresses risk assets, including ETH. Meanwhile, on September 15, the U.S. Senate will conduct a key procedural vote on the CLARITY bill, requiring 60 votes to move it forward. If the bill passes, it would bring positive regulatory clarity for the crypto industry; if it fails, it could trigger short-term disappointment-driven selling.
In terms of capital flows, Ethereum spot ETFs recorded net inflows of $197 million last week, maintaining positive inflows for four consecutive weeks. This shows that institutional allocation intent remains firm. Since Q3, ETH’s return has reached 60.6%, demonstrating strong performance, but in the short term around $2,500 it is facing profit-taking pressure.
IV. Trending Tokens and Market Topics
Tokens with standout gains today include: REZ at a current price of $0.004567, up 29.67%; CVC at $0.03222, up 24.93%; and MTL at $0.405, up 23.48%. The active performance of these mid-to-small-cap tokens reflects that market funds are spreading from consolidation in major coins into theme-based concepts.
The most talked-about topics in the market include: the CEO of Anthropic calling for slowing AI development, sparking cross-industry discussions between technology and crypto; Bitcoin undergoing a third single-block reorg within four weeks, raising concerns about network security; and the continued surge in discussion about Ethereum breaking below $2,500, indicating that the market is closely watching ETH’s key price level.
V. Overall Assessment
Ethereum is currently at a crucial level. Technically, the short term is bullish but carries the risk of an overbought pullback. The upcoming bullish MACD crossover is a positive sign, but shrinking trading volume and the high-level stochastic RSI warn of a short-term pullback. On the macro side, rate-hike expectations are a headwind, but continued ETF inflows and expectations of a regulatory bill vote provide support. It is recommended that investors monitor the effectiveness of a valid breakout above the $2,526 upper Bollinger Band, as well as the strength of support at the $2,496 middle band. Before the dual events of the Fed’s meeting and the CLARITY bill vote are finalized, investors should remain cautious, manage position size, and avoid chasing price increases.
#AnthropicCEOCallsForAISlowdown #BitcoinThirdSingleBlockReorgInFourWeeks #EthereumFallsBelow$2500
2
·
--
I. Market Overview
Bitcoin continues its rebound trend in the early hours of September 14, 2026. The latest price is $77,474, rebounding more than $1,000 from the previous day's low of $76,388. Judging by the hourly K-line chart, BTC has shown a trend of rising volume and price together over the past several hours. Trading volume has gradually increased from $29.5 million to $52.8 million, indicating that long positions are being steadily added. Bitcoin is currently trading in the 77,000 to 77,800 range. The short-term outlook remains bullish, but the 78,000 whole-number level above still poses some resistance.
II. Technical Indicator Analysis
Moving averages: The 7-period moving average is at 77,173, and the 25-period moving average is at 77,112. Both have turned upward already. However, the 99-period moving average remains above 77,347, meaning the medium-term trend has not fully switched to a bullish phase. Price needs to hold above 77,350 to confirm a medium-term trend reversal. The EMA moving averages also show a short-term golden-cross structure: EMA7 is at 77,329, above EMA25 at 77,188. Short-term momentum indicators lean to the upside.
MACD: The MACD shows a significant change. The MACD fast line quickly surged from the negative region to 54.12, while the slow line is still in negative territory at -12.06. The histogram has expanded sharply to 66.19, which is a typical signal of a bullish momentum breakout. The fast and slow lines are about to form a golden cross. If the fast line breaks above the slow line, it would further confirm the upward trend.
RSI (Relative Strength Index): RSI6 is 75.66, already entering the overbought zone. RSI12 is 66.66, and RSI24 is 58.67. Short-term overbought conditions increase the risk of chasing prices, but coupled with the surge in trading volume, the current rise appears to have underlying capital support rather than being purely speculative. Investors should remain alert to the risk of a short-term pullback.
KDJ: The J value is as high as 97.32, with K at 75.87 and D at 65.15. J is close to an extreme level. This combination often implies a technical pullback requirement in the short term, but in strong markets the KDJ can stay “stalled” at high levels. A comprehensive judgment is needed alongside other indicators.
Bollinger Bands: Price is approaching the upper band near 77,720. The middle band is 77,092, and the lower band is 76,464. The Bollinger Band opening has widened somewhat, suggesting volatility is rising. If price holds above the upper band, it may open further upside space. If price meets resistance at the upper band and falls back, it could retest support at the middle band.
III. Market Sentiment and Macro Background
Currently, attention in the market centers on two major events. First, on September 15, the U.S. Senate will conduct a procedural vote on the CLARITY bill. The bill needs 60 votes to advance. If the vote passes, it would bring a more explicit regulatory framework for the crypto industry. The market generally expects Bitcoin to potentially challenge the $100,000 level. If the vote fails, it could trigger pullback risk in the short term.
Second, on September 16, the Federal Reserve’s FOMC interest rate decision will be released. The U.S. August CPI data came in above expectations (core CPI month-over-month rose 0.3% vs. expected 0.2%). The probability of rate hikes has risen to over 86%. Goldman Sachs has adjusted its earlier expectation of keeping rates unchanged to a 25-basis-point hike. Tighter macro liquidity expectations put pressure on risk assets, which is also an important reason Bitcoin has been repeatedly oscillating around the 77,000 area.
From the AI综合 signal perspective: among 15 factors, 8 are bullish, 6 are bearish, and 1 is neutral, with longs making up 53.3%. The综合 indicator signal is bullish, with a historical win rate of 78.72%—including a long-side win rate of 76.92%. This data suggests the market is overall biased toward longs, but the long and short forces are relatively balanced. Investors should maintain a cautious and optimistic stance.
IV. On-chain Data and Fund Flows
The OBV (On-Balance Volume) energy flow indicator has rapidly turned positive and climbed to 2,063, showing a significant increase in buying pressure. The SAR parabolic indicator has flipped to a support level at 76,415. The Supertrend indicator has also turned from the 77,456 resistance to a 76,703 support. The alignment of these trend indicators turning bullish further validates the effectiveness of the short-term rebound. The ATR volatility indicator has risen from 227 to 309, and the standard deviation has increased from 267 to 404, indicating volatility in the market is rising. Investors should strengthen risk management.
The William %R (WR) is -3.73, close to the 0 extreme zone, reflecting very strong short-term buying power. The stochastic RSI records 89.56, with its moving average at 66.27. There is short-term overbought pullback risk, but the overall trend remains upward.
V. Outlook and Strategy Suggestions
Based on the analysis above, Bitcoin’s short-term phase is in a rebound cycle, with highly concentrated bullish technical signals. However, there is still uncertainty on the macro side. The CLARITY bill vote and the Federal Reserve interest rate decision are the key variables affecting this week’s price action.
For short-term traders: if price retraces to the 77,000 to 77,100 range (the intersection of EMA25 and MA25) and stabilizes, you may consider going long with a small position size. Set a stop-loss below 76,400. The initial upside target is to watch for a break above 78,000; if there is a confirmed breakout, you could look toward 78,500 to 79,000.
For medium- to long-term investors: it is recommended to wait until macro uncertainty is resolved before making decisions. If the CLARITY bill passes and the Federal Reserve keeps rates unchanged, Bitcoin may begin a new upward cycle. Otherwise, be prepared for the risk of a pullback toward 75,000 or even lower.
With current market volatility relatively high, it is advisable to limit position size to within 10% to 20% of total capital to avoid excessive exposure in a high-volatility environment.
VI. Hot Token Gainers List
1. FIL (Filecoin): Current price $1.0148, 24-hour gain 25.45%, trading volume $47.85 million
2. REZ (Renzo): Current price $0.004732, 24-hour gain 25.02%, trading volume $42.69 million
3. CVC (Civic): Current price $0.03013, 24-hour gain 18.76%, trading volume $22.15 million
#AnthropicCEOCallsForAISlowdown #BitcoinThirdSingleBlockReorgInFourWeeks #EthereumFallsBelow$2500
1
·
--
If you are still panic selling the moment spot price sweeps local support, stop now.
Most traders get chopped up not because their macro thesis is wrong, but because they let short-term leverage flush out their positions right before the actual bounce. Watching your stop-loss get hit by a few dollars only to see the market reverse is the fastest way to drain an account.
The crowd is currently screaming bear market just because $BTC tapped a new intraday low, but the underlying order book tells a very different story. With market sentiment leaning toward greed, a sudden shakeout is standard behavior to wipe out overextended longs rather than signal a structural breakdown.
Some analysts argue this dip opens the door to a much deeper correction, yet spot demand and liquidity in $USDT remain steady across majors like $DOT. Chasing breakdowns into high-timeframe support zones has historically offered the worst risk-to-reward ratio. In my view, this drop looks far more like a classic liquidity hunt than the start of a prolonged dump.
Are you taking advantage of this dip to accumulate or waiting for confirmation at lower levels?
#BitcoinDropsToIntradayLow #EthereumFallsBelow
If you are still panic selling the moment spot price sweeps local support, stop now.
Most traders get chopped up not because their macro thesis is wrong, but because they let short-term leverage flush out their positions right before the actual bounce. Watching your stop-loss get hit by a few dollars only to see the market reverse is the fastest way to drain an account.
The crowd is currently screaming bear market just because $BTC tapped a new intraday low, but the underlying order book tells a very different story. With market sentiment leaning toward greed, a sudden shakeout is standard behavior to wipe out overextended longs rather than signal a structural breakdown.
Some analysts argue this dip opens the door to a much deeper correction, yet spot demand and liquidity in $USDT remain steady across majors like $DOT . Chasing breakdowns into high-timeframe support zones has historically offered the worst risk-to-reward ratio. In my view, this drop looks far more like a classic liquidity hunt than the start of a prolonged dump.
Are you taking advantage of this dip to accumulate or waiting for confirmation at lower levels?
#BitcoinDropsToIntradayLow #EthereumFallsBelow

34

#EthereumFallsBelow $2400
⚠️ ETHEREUM FALLS BELOW $2,400 — WHAT’S NEXT?
Ethereum has slipped below the $2,400 level, putting traders on alert as market sentiment turns cautious.
The key question now is whether this move is simply a short-term correction or the beginning of a deeper downside move. 📉
ETH bulls will be watching closely for buyers to reclaim important levels, while bears may look for continued weakness and lower support zones.
In volatile markets, the first move after a major level breaks can often be misleading. Instead of chasing the candle, I’m watching volume, support, and the broader BTC market for confirmation.
For now, patience and risk management matter more than prediction. 👀
What’s your view on ETH here — bounce or further downside?
#Ethereum! #ETH #Crypto #bitcoin.”
43
·
--
Ethereum (ETH) Recent Market Analysis and Outlook
1. Market Overview
As of September 14, 2026, the price of Ethereum is $2,512.67. The intraday price fluctuates within the $2,508 to $2,527 range. From recent candlestick trends, ETH has found support around the $2,500 level and has rebounded mildly. The current price is slightly above the 7-period and 25-period moving averages, indicating that short-term bullish momentum is gradually recovering. However, the upper band of the Bollinger Bands is at $2,529, and the price is already approaching the upper band boundary, suggesting limited upside room in the short term. Regarding trading volume, the most recently completed 1-hour candlestick shows a trading value of approximately $38.44 million USDT, which is larger than in the previous few candles, indicating that competition between bulls and bears is intensifying.
2. Interpretation of Technical Indicators
For moving averages, MA7 is $2,511.56, MA25 is $2,498.24, and MA99 is $2,500.37. They display a bullish alignment signal, with short-term moving averages crossing above the medium-term ones. The exponential moving averages also show bullish alignment: EMA7 is $2,511.03, above EMA25 at $2,505.43 and EMA99 at $2,502.93, further confirming that the short-term rebound trend is still ongoing.
The MACD indicator shows a DIF value of 1.77, a DEA signal line of -1.67, and a histogram value of 3.44. A golden cross has formed and the histogram is expanding with rising volume, indicating that bullish momentum is strengthening. This is one of the clearer bullish signals among the past 50 data points, with a historical win rate of 55.1%. The MACD histogram has remained positive for multiple consecutive periods and has been gradually expanding, suggesting that upward momentum has not yet fully exhausted.
Regarding RSI, the 6-period RSI is 67.83, the 12-period RSI is 58.57, and the 24-period RSI is 53.41. Overall, it is in a neutral-to-strong region and has not entered the overbought zone. However, in the KDJ indicator, the K value is 82.28, the D value is 77.06, and the J value is 92.72, which has already entered a relatively overbought area, implying a risk of a short-term technical pullback. The stochastic RSI is even higher at 98.45, close to an extreme level, so the market should be wary of corrections after short-term overbought conditions.
For Bollinger Bands, the price is nearing the upper band at $2,529. The middle band at $2,500 provides short-term support, while the lower band at $2,471 is a key support level. ATR is 13.80, indicating volatility is relatively low, suggesting that the market is currently in a stage of choosing direction; once the price breaks beyond the Bollinger Band boundary, it may trigger a trend expansion.
The Parabolic SAR indicator is at $2,475, below the current price, giving a bullish signal. However, the Supertrend indicator is at $2,517, and the price is slightly below that level, implying that the bull-bear dividing line is around $2,517. If the price can hold above it, the trend may turn bullish; otherwise, it may remain under pressure.
3. Composite Signals and Market Sentiment
After analyzing 15 technical factors in total, there are 8 bearish factors, 6 bullish factors, and 1 neutral factor. Bearish factors account for 53.3%, so the composite signal leans bearish. The historical win rate of bearish signals is 62.86%, and the overall win rate is 68.09%, suggesting the current rebound still faces significant pressure. Some factors provide strong bearish signals, so short-term technical pullback risk should be watched closely. On the bullish side, the MA factor win rate is 55.1%, and the alpha9 factor win rate is also 55.1%, providing some supporting evidence.
From the capital flows perspective, last week’s spot Ethereum ETF attracted $197 million in net inflows, maintaining positive inflows for the fourth consecutive week. This sharply contrasts with the $463 million net outflow from the Bitcoin ETF over the same period. This indicates that institutional funds are rotating within the crypto asset space, with Ethereum receiving relatively more favor. Institutional-level staking activity continues as well: large amounts of ETH are locked in staking contracts, reducing circulating supply and helping support price stability.
However, there is significant macro uncertainty. The probability that the Federal Reserve will raise rates by 25 basis points at the FOMC meeting on September 16 is as high as 87%. Goldman Sachs has already reversed its prior “hold steady” expectation and shifted to rate hikes. In addition, August core CPI rose 0.3% year-over-year, exceeding expectations. Moreover, the U.S. Senate will hold a crucial vote on the CLARITY Act on September 15, requiring 60 votes to move forward. The outcome could have a major impact on the entire crypto market. If the bill passes, analysts expect Bitcoin could challenge $100,000, and Ethereum would likely benefit significantly. If it does not pass, the market may face years of regulatory uncertainty, which would suppress sentiment.
4. Key Price Levels and Risk Warnings
For the short term, watch the $2,500 psychological level and the middle band of the Bollinger Bands as support. A stronger support level is the $2,471 lower band. The first resistance level above is the $2,517 Supertrend line; after a breakout, attention would turn to the recent high at $2,535. Further resistance is at the $2,529 upper Bollinger Band. The OBV indicator is -103,000, reflecting that overall selling pressure still exists. If buy orders are insufficient, the price may test the lower support again.
On the institutional side, accumulating short positions totaling around $38 million should be treated with caution. Some market makers expect a ceiling around current price levels. If the price cannot hold above $2,517, the probability of a pullback back into the $2,500 and even $2,470 range should not be ignored. This week, multiple tokens such as ARB, ZRO, and STRK face large unlocks, with a combined release of more than $50 million in new supply, which may add additional pressure to overall market sentiment.
Overall, Ethereum’s short-term technical picture shows a mixed and intertwined pattern between bulls and bears. ETF inflows and institutional capital rotation provide fundamental support, but macro risk events are clustered, some technical indicators have moved into overbought territory, and the composite signal still leans bearish. Investors are advised to closely monitor the Federal Reserve decision and the CLARITY Act voting outcome, keep position sizes controlled before macro conditions become clear, and avoid chasing price increases. If ETH can hold above $2,517 with increased trading volume, it may be worth reassessing bullish opportunities. If $2,500 support is broken, further downside risks should be anticipated.
Overview of Popular Tokens
CVC, current price $0.03817, 24h change +45.52%
REZ, current price $0.004554, 24h change +31.50%
ARK, current price $0.1964, 24h change +25.18%
#AnthropicCEOCallsForAISlowdown #BitcoinThirdSingleBlockReorgInFourWeeks #EthereumFallsBelow$2500
2
·
--
I. Market Overview
Over the past few hours, Ethereum (ETH) has shown a strong rebound. The price has risen steadily from around $2,477 to $2,518, representing an increase of approximately 1.6%. As of the time of writing, ETH’s latest quote is about $2,512, and the 24-hour trading volume remains at relatively high levels. This upmove is occurring amid heightened uncertainty in the macro environment, especially influenced by growing expectations for the Federal Reserve’s September 16 policy meeting. Market sentiment has been characterized by a complex mix of bullish and bearish factors.
II. Price Action and Technical Pattern Analysis
Looking at the 1-hour candlestick chart, ETH has formed a clear uptrend channel with five consecutive bullish candles. Starting from $2,477, the price sequentially broke through key integer levels such as $2,490, $2,500, and $2,510, with a peak reaching $2,520. Trading volume peaked on the third candle at $31.18 million, then eased afterward, suggesting that while early momentum was strong, the late-stage push has weakened somewhat.
Regarding moving averages, MA7 is $2,496, MA25 is $2,499, and MA99 is also $2,499. The current price is trading above all three moving averages, indicating a bullish alignment. The exponential moving averages show EMA7 at $2,505, EMA25 at $2,503, and EMA99 at $2,502. The short-term moving averages have crossed above the medium- and long-term averages in sequence and are spreading upward, confirming the establishment of a short-term rebound trend. For Bollinger Bands, the upper band is $2,524, the mid band is $2,495, and the lower band is $2,465. Price has moved close to the upper band, showing strong upward momentum, but it also faces technical resistance near the upper band.
III. In-Depth Interpretation of Technical Indicators
The MACD indicator shows that the fast line has risen from -6.63 to -0.98, while the slow line has fallen from -5.84 to -4.20. The histogram has shifted from -0.79 to +3.22, forming a clear bullish crossover. This change implies that bearish power is rapidly weakening, and bullish momentum is accelerating. If the fast line subsequently breaks above the zero axis, it would form a stronger mid-term buy signal.
For the RSI indicator, the 6-period RSI is 69.33, nearing the overbought threshold of 70. The 12-period RSI is 59.14, and the 24-period RSI is 53.67. The high short-term RSI suggests a technical pullback may be needed, but the medium-to-long-term RSI remains in a neutral-to-strong range, indicating there is still room for the rebound.
In the KDJ indicator, the K value is 78.55, the D value is 65.85, and the J value is as high as 103.96. A J value above 100 suggests extreme short-term overbought conditions. Historically, this often comes with a minor pullback or high-level consolidation to digest the move. Investors should be cautious about volatility caused by short-term profit-taking.
The SuperTrend indicator shows a key reversal in this round of market action: it has switched from a bearish state at $2,517 to a bullish state at $2,469, confirming a trend reversal. The SAR (parabolic) is at $2,468, far below the current price, which also supports the bullish view. Worth noting further, the StochRSI indicator has reached an extreme level of 100, and the Williams %R (WR) is -3.64, close to the zero line. Both suggest overly optimistic short-term conditions, so pullback risk should not be ignored. ATR is 14.67, indicating volatility is moderate and slightly easing, which suggests the price is moving up in an orderly way rather than being driven by a sudden surge.
IV. Comprehensive Assessment of Bullish and Bearish Factors
The system tracks 15 factors in total: 9 are bullish, 5 are bearish, and 1 is neutral. The bullish ratio is 60%. Key bullish factors include the MA5 factor (win rate 55.1%), the Alpha1 factor (win rate 57.14%), and the Alpha29 factor (win rate 44.9%). On the bearish side, the most prominent are the Alpha15 factor (win rate 59.18%) and the Alpha23 factor (win rate 55.1%). Overall, the indicator set currently issues a bearish signal, with a historical win rate of 66.67% and an average maximum return of 0.46%. This suggests there is some downside pullback pressure in the short term, and bulls should not chase prices excessively.
V. Market Sentiment and Macro Background
From a fundamentals perspective, on September 11 ETH recorded a net inflow of $216.4 million in ETFs, boosting the third-quarter return to 60.6%. At the same time, large institutions have accumulated 5.9 million ETH for staking, reducing circulating supply and providing medium-to-long-term support for prices. However, macro headwinds also cannot be ignored. In the futures market, the probability currently priced for the Federal Reserve to hike rates by 25 basis points on September 16 is as high as 87%. Goldman Sachs has already shifted its previously steady-on-hold expectation to a rate-hike expectation. Rate hikes typically weigh on risk assets such as crypto; if the decision ultimately materializes, ETH could face short-term volatility.
In addition, the U.S. Senate will hold a key procedural vote on the CLARITY bill on September 15. A total of 60 votes are needed to move it forward. Polymarket currently predicts only a 30% chance that this bill becomes law in 2026. If the bill is passed, the market generally believes it will push BTC toward $100,000, and ETH would likely benefit as well; if it is not passed, it could create short-term pressure on the crypto sector.
VI. Key Price Levels and Trading Suggestions
Major resistance levels above lie in the $2,520 to $2,524 range, corresponding to the upper Bollinger Band and the rebound high. After a breakout, attention could turn to $2,535. Key support is at $2,495 (MA25) and $2,465 (Bollinger lower band). If $2,465 breaks, the rebound structure may be damaged. Given that multiple short-term indicators are already in overbought territory, holders are advised to watch whether the breakout around $2,520 is truly valid. Those who have not entered yet may consider waiting for a pullback toward the $2,495 to $2,500 support zone before considering an entry.
VII. Trending Tokens and Topics
Today’s market has seen strong performances from several trending tokens: REZ is currently $0.004744, up 32.85%; MTL is currently $0.394, up 22.74%; and CVC is currently $0.03101, up 22.38%.
#AnthropicCEOCallsForAISlowdown #BitcoinThirdSingleBlockReorgInFourWeeks #EthereumFallsBelow$2500
·
--
1. Market Overview
Bitcoin is currently trading in a narrow range around $77,500. The latest quote is $77,593. From the hourly candlestick chart, the price has fluctuated between $77,379 and $77,895 over the past several hours, showing an overall pattern of tight consolidation. Last week, Bitcoin ETFs saw net outflows of $463 million, ending three consecutive weeks of net inflows, which has placed some short-term pressure on prices. However, recent inflows to large wallets have exceeded $50 million USDT, which to a certain extent offsets the negative impact of ETF outflows and has helped stabilize prices.
2. Technical Indicator Interpretation
From the moving average system, the 7-day moving average is $77,562, the 25-day moving average is $77,175, and the 99-day moving average is $77,319. The short-term moving averages are above the long-term moving averages, indicating a bullish alignment. The exponential moving averages show EMA7 at $77,540, EMA25 at $77,304, and EMA99 at $77,500, which also reflect a bullish trend. Regarding the Bollinger Bands: the upper band is $77,893, the middle band is $77,258, and the lower band is $76,622. The current price is close to the upper band, suggesting that short-term pullback pressure may exist.
The MACD indicator shows DIF at 127.73, DEA at 55.46, and histogram value of 72.27. All three values are positive and continue to expand, indicating that bullish momentum is strengthening. For RSI, RSI6 is 72.06, RSI12 is 64.55, and RSI24 is 57.55. The short-term RSI has entered the overbought zone but has not reached extreme levels, suggesting that upward momentum remains, though investors should watch for potential pullbacks. In the KDJ indicator, K is 82.44, D is 76.74, and J is 93.83. All three lines are at high levels, and short-term overbought signals are clear.
The Parabolic SAR (SAR) is currently at $76,661, below the current price, giving a bullish signal. ATR volatility is around $305, indicating moderate market fluctuation. The Williams %R (WR) is -10.59, placing it in the overbought range. Stochastic RSI is 93.34, also at a high level. It is worth noting that the OBV indicator is -4,479, showing a slight downward trend, which together with rising prices forms a degree of bearish divergence (top divergence). This suggests that the current rebound lacks sufficiently strong volume support, and investors should remain cautious.
3. Analysis of Bullish vs. Bearish Factors
According to quantitative factor statistics, among 15 factors, 9 are leaning bullish, 5 are leaning bearish, and 1 is neutral. Bullish factors account for 60%. Bullish factors include alpha3, alpha9, alpha15, alpha17, alpha21, alpha25, alpha29, alpha33, and alpha34. Among them, alpha34 is the strongest signal with a value of 1.54. Bearish factors include ma_factor_5, alpha1, alpha7, alpha11, and alpha23. Alpha7 provides the strongest bearish signal with a value of -0.90. The composite indicator currently issues a bearish signal, with a historical win rate of 72.34%. This signal is worth paying attention to because the composite indicator integrates judgments from multiple factors, making it relatively reliable.
4. Market Sentiment and Macroeconomic Environment
Current market sentiment is influenced by multiple macro factors. The U.S. Senate will hold a procedural vote on the CLARITY Act on September 15, requiring 60 votes to move it forward. Passage of the bill could push Bitcoin toward $100,000. However, expectations of interest-rate hikes are warming ahead of the September 17 FOMC meeting. August core CPI rose 0.3% month-over-month, exceeding expectations, and the probability of a rate hike has risen to 87%. Goldman Sachs has shifted to expecting a 25-basis-point hike. This hawkish expectation is the main factor currently suppressing risk assets.
Regarding ETF capital flows, Bitcoin ETFs had net outflows of $463 million last week, about 6,000 BTC net exited, sending a warning signal about price support in the near term. Meanwhile, Ethereum ETFs saw net inflows for four consecutive weeks totaling $197 million. XRP ETFs have had net inflows for nine consecutive weeks of about $19 million. Overall, funds appear to be rotating/diverting among different assets.
5. Trending Tokens and Topics
Tokens showing the largest gains today: CVC is trading at $0.04126, up 53.2% over the past 24 hours; REZ is trading at $0.004573, up 26.4%; and LSK is trading at $0.9186, up 24.4%.
Current market focus topics include: the Anthropic CEO calling for slowing down AI development, Bitcoin experiencing its third on-chain reorganization event within four weeks, and Ethereum breaking below $2,500.
#AnthropicCEOCallsForAISlowdown #BitcoinThirdSingleBlockReorgInFourWeeks #EthereumFallsBelow$2500
14
·
--
1. Market Overview
In the early morning of September 14, the Bitcoin price fluctuated narrowly around $77,583. Over the past 5 hours, the K-line shows BTC gradually rising from $76,808, reaching a peak of $77,869, and then consolidating around the $77,600 level. Overall, the market presents a choppy upward pattern: short-term bulls have rebounded, but the $78,000 psychological integer level still poses clear resistance. Recently, the past hour’s trading volume was about 22.41 million USDT, noticeably lower than in the previous few hours, suggesting both bulls and bears are becoming more cautious as the market waits for a directional catalyst.
2. Technical Indicator Interpretation
Moving averages: MA7 is at $77,188, MA25 at $77,122, and MA99 at $77,341. Price is trading above MA7 and MA25 but slightly below MA99, implying a short-term bullish bias while the medium-to-long-term trend has not fully turned for the better. EMA7 is $77,366 and EMA25 is $77,207; both are curling upward, and an initial bull alignment is forming.
MACD shows a clear bullish crossover signal. The histogram value rebounded to 67.09, with the DIF line at 68.32 crossing above the signal line by 1.23. Bullish momentum is still accumulating. If the histogram continues to expand, price may test the upper Bollinger Band at $77,740.
RSI6 is 71.97, entering the overbought zone. KDJ’s J value is as high as 91.37, and stochastic RSI is even higher at 99.85, indicating extreme overbought conditions. Investors should be cautious about a short-term technical pullback, though in strong trends overbought indicators may remain elevated for a period. Bollinger Band width is tightening, with ATR falling to 303.72—volatility is contracting, potentially setting up the next breakout. SAR is at $76,473, confirming the uptrend. OBV has turned positive to 211.34, with volume supporting the advance.
3. AI Composite Signals
Binance’s AI multi-factor system shows that out of 15 factors, 9 are bullish, 5 are bearish, and 1 is neutral. Bulls account for 60%, and the composite indicator value is 1.42. The signal direction is bullish, with a historical win rate as high as 84.21% and a composite win rate of 76.6%. The alpha34 factor (win rate 63.27%) and alpha9 factor (win rate 59.18%) are the core bullish drivers. Meanwhile, the alpha7 factor issues a bearish warning (win rate 61.22%), suggesting that downside risk should not be ignored.
4. Market Sentiment and Macroeconomic Background
Market attention is focused on two major events. On September 15, the U.S. Senate CLARITY Act procedural vote requires 60 votes to move forward. If it passes, it would provide a clearer regulatory framework for the crypto industry, but Polymarket forecasts the probability of it becoming law in 2026 is only 30%. On September 16, the Federal Reserve’s decision: the futures market pricing shows a high probability of a 25-basis-point rate hike at 87%. The August core CPI coming in above expectations has intensified expectations for tightening. If a hike occurs as expected, tighter liquidity could temporarily weigh on risk assets.
Institutional adoption continues to advance: Canada approved banks to support crypto deposit products. The XRP ETF has seen net inflows for nine consecutive weeks, nearing $19 million. Grayscale applied to convert its Litecoin trust into a spot Litecoin ETF. Canary Staked TRX ETF has launched with Charles Schwab Wealth.
The RWA tokenization track is growing rapidly: the global tokenized stock market cap increased from $350 million to $2.2 billion.
5. Trading Suggestions
Overall, BTC is currently led by short-term bulls, but resistance at $78,000 is evident. Multiple overbought indicators also suggest pullback risk. For aggressive traders, it’s suggested to look for pullback-long opportunities in the $77,000 to $77,200 range, with a stop-loss reference at $76,500. Conservative traders are advised to wait for the CLARITY Act procedural vote and the Fed’s rate decision to land before making positioning. Key things to watch are: panic sentiment triggered by the potential failure of the CLARITY Act and the risk of selling pressure brought by the Fed’s unexpectedly hawkish language.
Top Gainers (Popular Tokens)
REZ Current price $0.004717, 24h change +33.82%
CVC Current price $0.03130, 24h change +23.91%
MTL Current price $0.398, 24h change +21.71%
#AnthropicCEOCallsForAISlowdown #BitcoinThirdSingleBlockReorgInFourWeeks #EthereumFallsBelow$2500
2
·
--
Ethereum Market Analysis on September 14: Short-Term Pressure and Structural Opportunities Coexist
I. Market Overview
As of 07:00 UTC on September 14, Ethereum (ETH) is quoted at $2,521.6. Within the past few hours, it has been trading in a range of $2,506 to $2,527. From the hourly candlestick chart, after rebounding from the $2,506 low, ETH has gradually risen to around $2,524. Trading volume in the latest hour reached approximately $23.54 million USDT, indicating a rebound in market activity. Ethereum is currently at a critical technical level, with intensified bullish-bear conflict. Investors should closely monitor the next directional choice.
II. Interpretation of Technical Indicators
Based on moving averages, MA7 is $2,512.6, MA25 is $2,498.5, and MA99 is $2,500.4. The current price is above all three moving averages, and the short-term moving-average structure is mildly bullish. EMA7 is $2,512.8, EMA25 is $2,506.0, and EMA99 is $2,503.1. The exponential moving averages are also arranged in a bullish pattern, and the short-term trend remains favorable.
The MACD indicator shows positive changes. The MACD histogram has been expanding continuously; the latest value is 3.89. The fast line has risen from the negative region to 2.34, while the slow line remains negative at -1.55. The gap between the fast and slow lines is narrowing, suggesting an impending “golden cross” signal above the zero axis. This is a bullish signal worth watching recently, indicating that rebound momentum is building.
Regarding RSI, the 6-period RSI is 73.87, already in the overbought zone; the 12-period RSI is 62.22; and the 24-period RSI is 55.38. Elevated short-term RSI implies a technical pullback may be needed, but the mid-term RSI is still within a reasonable range, suggesting the upward trend has not ended.
The KDJ indicator is also positioned at high levels: K is 86.1, D is 78.3, and J is 101.6. A J value breaking above 100 serves as a short-term overbought warning signal. Historically, after this occurs, price often consolidates sideways for several hours or undergoes a mild pullback to digest gains.
For Bollinger Bands, the upper band is $2,530.5, the middle band is $2,500.6, and the lower band is $2,470.7. Price has approached the upper band. If it can break above the $2,530 resistance level effectively, it may open room for further upside. If it fails and falls back, it may retest the $2,500 middle band area for support.
Notably, the Supertrend indicator flipped in the latest hour to $2,474.5, a jump from the prior value of $2,517.4. This could be an early signal of a trend reversal. Investors should treat it with caution. The SAR parabola indicator is at $2,475.3, below the current price, maintaining a bullish bias.
ATR (Average True Range) is $14.49, meaning volatility is at a moderate level and there are no signs of extreme volatility. The Williams %R (WR) is -4.77, in the overbought region, which resonates with the RSI and means the probability of a short-term pullback should not be overlooked.
III. Comprehensive Signals and Factor Analysis
An AI quantitative model evaluates 15 factors for ETHUSDT in total. Of these, 3 are bullish, 11 are bearish, and 1 is neutral. Bearish factors account for 73.3%, and the composite signal assessment is bearish. The historical hit rate of this signal is 65.96%. The bearish signal hit rate is 61.11%, while the bullish signal hit rate is 81.82%.
It is worth noting that although the composite signal leans bearish, indicators such as MACD, MA5, and Alpha1 have already issued bullish signals. The internal market structure is showing signs of differentiation. Such divergence often implies a trend reversal may be brewing, but in the short term it usually remains dominated by range-bound consolidation.
IV. Macro Environment and Liquidity
On the macro front, the U.S. core CPI year/month rose by 0.3% in August, exceeding expectations. The probability of the Federal Reserve raising rates by 25 bps on September 17 has increased to 87%. Goldman Sachs has revised its earlier view of holding rates steady to an expectation of a rate hike. This hawkish signal creates short-term pressure for risk assets, including Ethereum.
In terms of liquidity, the market shows a mix of both bulls and bears. Ethereum spot ETFs have delivered net inflows for four consecutive weeks. Last week’s net inflow was about $197 million, sharply contrasting with Bitcoin ETF outflows of $463 million. In addition, Bitmine Immersion Technologies recently purchased more than 5.9 million ETH for staking, significantly reducing circulating supply.
However, at the same time, a major market maker is continuously increasing its short positions in perpetual contracts. It currently holds about $38.5 million in short exposure, suggesting an institutional-level intention to hedge or remain bearish. This tug-of-war increases uncertainty in Ethereum’s short-term direction.
Policy-wise, the U.S. Senate will hold a procedural vote on the CLARITY bill on September 15. It needs 60 votes to advance. The outcome will have an important impact on the crypto market, and investors should closely monitor it.
V. Trending Tokens and Topics
Today’s trending tokens are performing strongly:
CVC (Civic): current price $0.03935, up 49.62% over the past 24 hours
LSK (Lisk): current price $1.0636, up 34.82% over the past 24 hours
REZ (Rez): current price $0.004718, up 27.34% over the past 24 hours
#AnthropicCEOCallsForAISlowdown #BitcoinThirdSingleBlockReorgInFourWeeks #EthereumFallsBelow$2500
·
--
I. Market Overview
Bitcoin is currently trading around $77,454. Over the past few hours, the price has fluctuated within a range of $77,016 to $77,895. From recent candlestick (K-line) charts, after opening at $77,118, BTC gradually moved higher, reaching a high of $77,895, and then consolidated narrowly around $77,600. Overall, the market shows a strong, high-level choppy pattern. In the short term, bullish momentum is attempting to break above the $78,000 level, but it faces some resistance.
II. Interpretation of Technical Indicators
Regarding moving averages: the 7-period MA is currently at $77,450, the 25-period MA at $77,156, and the 99-period MA at $77,327. The short-term moving averages have already crossed above the medium- and long-term averages, forming an early-stage bullish alignment. For the EMA: the 7-period EMA is $77,511, higher than the 25-period ($77,280) and the 99-period ($77,498), further confirming a bullish short-term trend.
The MACD indicators are impressive. The DIF line has risen to 118.3, the signal line is at 39.7, and the histogram has expanded to 78.6. Bullish momentum continues to strengthen, suggesting the uptrend may still be accelerating. For RSI: the 6-period RSI is 72.2, the 12-period is 64.7, and the 24-period is 57.6. Short-term RSI has entered the edge of the overbought zone, but there is not yet a clear bearish divergence (top-divergence) signal.
In the KDJ indicator, the K value is 82.2, D is 75.0, and J is 96.6. All three lines are in the overbought region, and the J value is close to 100. Short-term pullback risk should be monitored. For the Bollinger Bands: the price is trading between the upper band at $77,865 and the middle band at $77,218. It is currently near the upper band. If the price can effectively break through the upper-band resistance, it may open up more upside room.
The SAR parabola indicator is currently at $76,583, remaining below the current price and confirming the bullish trend. The SuperTrend is also at $76,641, providing support for upward movement. ATR is $312, indicating moderate volatility with no signals of extreme swings.
III. Analysis of Bullish/Bearish Factors
Based on 15 quantitative factors in total, 9 are bullish, 5 are bearish, and 1 is neutral, meaning bulls account for 60%. However, the composite signals still lean toward a bearish view, with a historical win rate of 70.45%, implying that there may be substantial sell pressure above the current price. Notably, factors such as alpha33 and alpha34 both provide strong bullish signals with win rates above 61%, suggesting that some deeper factors remain optimistic about upside potential. The short-term bullish-bearish divergence is evident, so it is important to closely watch whether the $78,000 level can be broken convincingly.
IV. Market Sentiment and Macro Outlook
On the macro front, the probability of the Fed raising rates by 25 basis points at the Sept. 16 FOMC meeting is as high as 87%. Earlier, the August core CPI rose 0.3% month-over-month, exceeding expectations, and Goldman Sachs has shifted toward expecting a rate hike. This hawkish outlook suppresses risk assets, including Bitcoin; rising yields and tighter liquidity expectations have reduced market risk appetite.
Meanwhile, U.S. spot Bitcoin ETFs saw net outflows of $463 million last week, ending a three-week streak of net inflows. This indicates that institutional capital has pulled back somewhat amid macro uncertainty. However, large-wallet addresses have reportedly flowed in over 50 million USDT within the past few hours, partially offsetting the ETF outflow impact. This suggests that “smart money” is still positioning on dips.
On regulation: the U.S. Senate will hold a key vote on the CLARITY Act on Sept. 15, requiring 60 votes to proceed. If it passes, BTC could target $100,000. If it fails, the market faces the risk of multi-year legislative delays. Polymarket’s current approval probability is around 30%, meaning the market has partially priced in a failed scenario.
V. Overall Assessment
Bitcoin is at a critical crossroads. Technically, the short term is bullish: the MACD histogram continues to expand, the moving-average system is in a bullish configuration, and both SAR and SuperTrend provide trend support. However, KDJ and Stoch RSI have entered the overbought zone; the J value is near 100, and the risk of a short-term technical pullback cannot be ignored.
From a macro perspective, rate-hike expectations and ETF fund outflows create dual pressure, while the CLARITY Act vote injects expectations of policy tailwinds. Before the FOMC decision is finalized, the market may continue to trade in a range-bound pattern between $76,500 and $78,000.
Investors should watch for a breakout in the $78,000 to $80,000 range. A key support level is around $76,500. In terms of trading strategy, it’s advisable to avoid chasing higher prices and instead wait for low-buy opportunities after a pullback, while strictly controlling position and risk exposure.
Popular Tokens
CVC $0.03634 Up 39.98%
REZ $0.004625 Up 34.80%
ARK $0.1971 Up 24.90%
#AnthropicCEOCallsForAISlowdown #BitcoinThirdSingleBlockReorgInFourWeeks #EthereumFallsBelow$2500
8

·
--
$SNDK
{future}(SNDKUSDT)
$BTC
{future}(BTCUSDT)
$MU
{future}(MUUSDT)
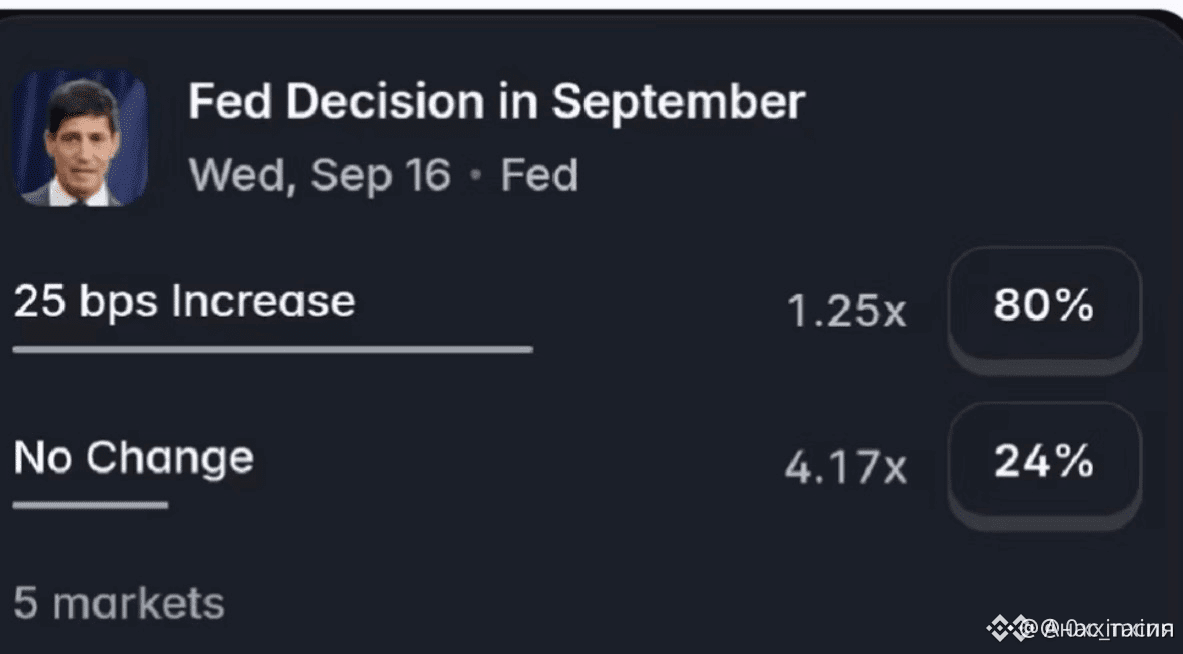
HSBC: Expects the Federal Reserve to raise rates by 25 basis points in September and December respectively
On September 14, HSBC said: It expects the Federal Reserve to raise rates by 25 basis points in September 2026 and December, respectively, after previously expecting policy to remain unchanged.#EthereumFallsBelow $2,500
$SNDK
$BTC
$MU
HSBC: Expects the Federal Reserve to raise rates by 25 basis points in September and December respectively
On September 14, HSBC said: It expects the Federal Reserve to raise rates by 25 basis points in September 2026 and December, respectively, after previously expecting policy to remain unchanged.#EthereumFallsBelow $2,500
291
Log in to explore more content
Join global crypto users on Binance Square
⚡️ Get latest and useful information about crypto.
💬 Trusted by the world’s largest crypto exchange.
👍 Discover real insights from verified creators.
Email / Phone number
Trending Topics
1
#BinancePick
3M views
152,263 Discussing
2
#EarningsSeason
5.3M views
25,868 Discussing
3
#AnthropicTTMRevenueGrewAbout1200%
24,259 views
366 Discussing
4
#AnthropicS1ExpectedToday
23,745 views
312 Discussing
5
#SouthKoreaReportedlyWeighsFourthCryptoTaxDelay
28,122 views
435 Discussing
6
#FranklinTempletonFilesForTwoDividendToBitcoinETFs
36,936 views
519 Discussing
7
#StrategyMSTRSurpassesNasdaqInMarketCap
27,810 views
375 Discussing
8
#CanadaProposesStablecoinRedemptionWithin3BusinessDays
1,260 views
36 Discussing
9
#ElectrumWalletBugLetRogueServersStealFunds
29,283 views
453 Discussing
10
#ArgentineCourtDismissesLIBRACaseAgainstMilei
44,192 views
560 Discussing