

#ethbtcratio
ethbtcratio
260 views
6 Discussing
Hot
Latest

·
--
$ETH market cap: $233 billion.
$BTC market cap: $1.33 trillion.
ETH/BTC ratio: near cycle lows.
And I want to show you why this ratio is the most important chart in crypto right now.
When ETH/BTC hits these levels — historically two things happen:
1. It bounces hard as capital rotates from BTC to ETH
2. ETH outperforms BTC for the following 3-6 months
This happened in:
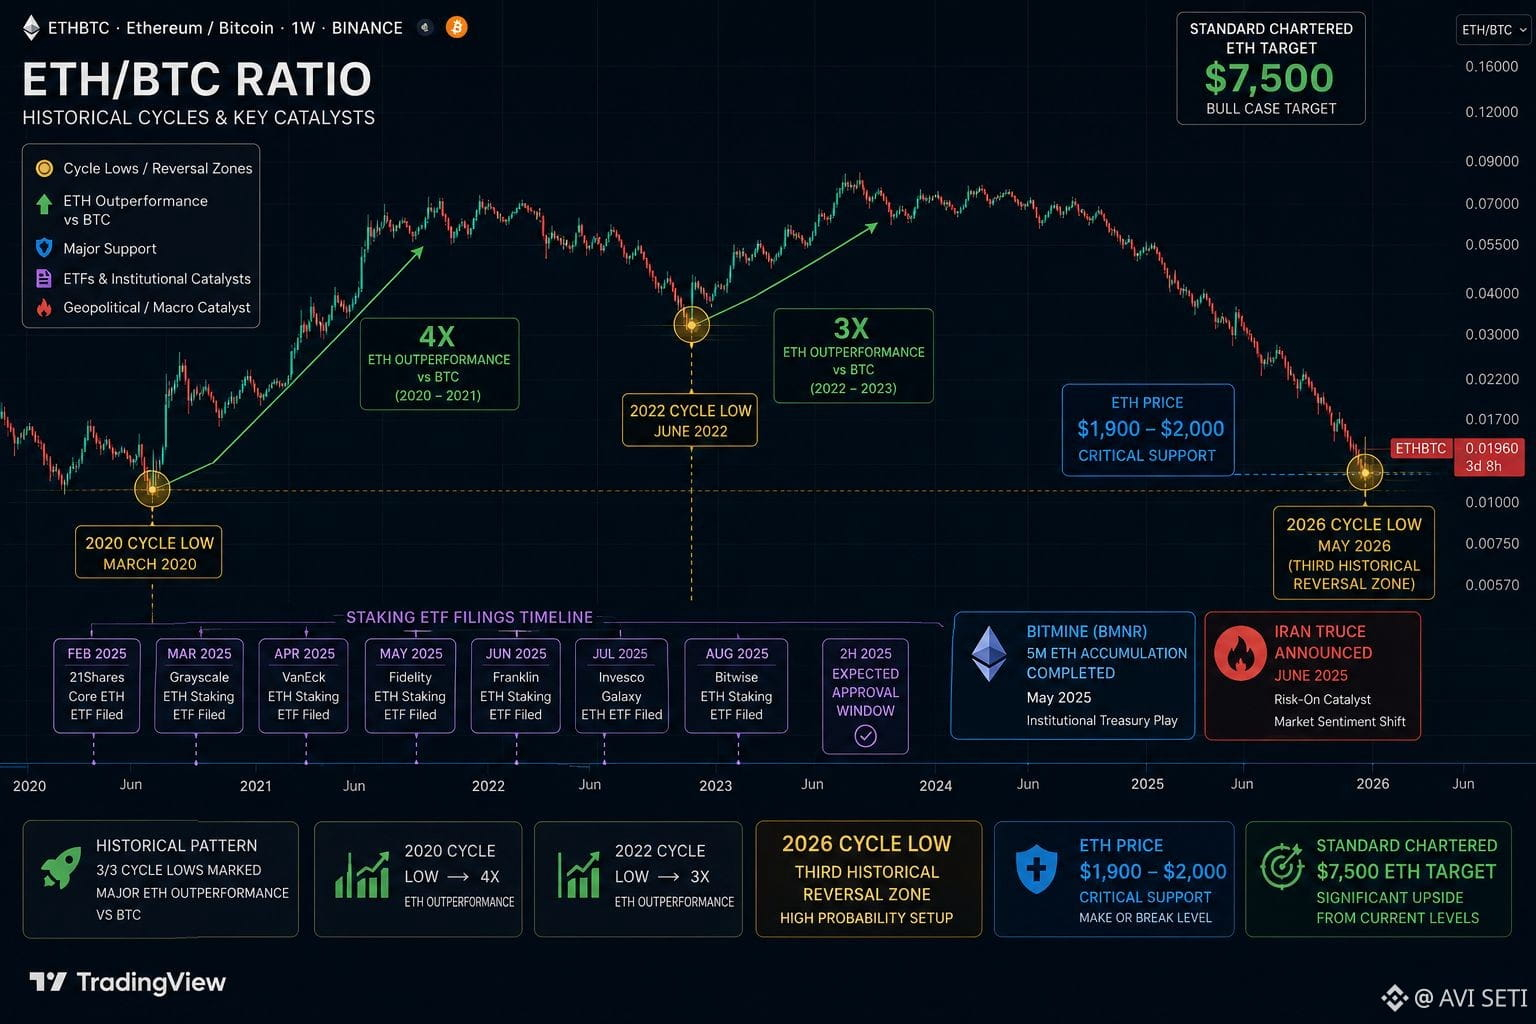
— Q4 2020: ETH/BTC at cycle lows → ETH went 4x vs BTC
— Q4 2022: ETH/BTC at cycle lows → ETH went 3x vs BTC
— Right now: ETH/BTC near cycle lows again
The catalyst this time?
🔥 Staking ETF filing: expected any week post-CLARITY Act
🔥 Bitmine: 5M ETH treasury approaching completion
🔥 Iran truce → risk-on → ETH benefits MORE than BTC
🔥 $2,000 support: held through everything
🔥 Glamsterdam upgrade: coming
📊 ETH today:
— Price: ~$1,900-$2,000 — at critical zone
— ETH/BTC ratio: near historical reversal point ✅
— $2,000 support: must hold ✅
— Staking ETF: imminent ✅
— Standard Chartered: $7,500 ✅
The ratio that predicted every ETH rally is at the same level again.
History doesn't guarantee repeats. But it rhymes loudly.
#Ethereum #ETHBTCRatio #CycleBottom #BinanceSquare #SECChairConfidentInCLARITYAct
$ETH market cap: $233 billion.
$BTC market cap: $1.33 trillion.
ETH/BTC ratio: near cycle lows.
And I want to show you why this ratio is the most important chart in crypto right now.
When ETH/BTC hits these levels — historically two things happen:
1. It bounces hard as capital rotates from BTC to ETH
2. ETH outperforms BTC for the following 3-6 months
This happened in:
— Q4 2020: ETH/BTC at cycle lows → ETH went 4x vs BTC
— Q4 2022: ETH/BTC at cycle lows → ETH went 3x vs BTC
— Right now: ETH/BTC near cycle lows again
The catalyst this time?
🔥 Staking ETF filing: expected any week post-CLARITY Act
🔥 Bitmine: 5M ETH treasury approaching completion
🔥 Iran truce → risk-on → ETH benefits MORE than BTC
🔥 $2,000 support: held through everything
🔥 Glamsterdam upgrade: coming
📊 ETH today:
— Price: ~$1,900-$2,000 — at critical zone
— ETH/BTC ratio: near historical reversal point ✅
— $2,000 support: must hold ✅
— Staking ETF: imminent ✅
— Standard Chartered: $7,500 ✅
The ratio that predicted every ETH rally is at the same level again.
History doesn't guarantee repeats. But it rhymes loudly.
#Ethereum #ETHBTCRatio #CycleBottom #BinanceSquare #SECChairConfidentInCLARITYAct
$BTC market cap: $1.33 trillion.
ETH/BTC ratio: near cycle lows.
And I want to show you why this ratio is the most important chart in crypto right now.
When ETH/BTC hits these levels — historically two things happen:
1. It bounces hard as capital rotates from BTC to ETH
2. ETH outperforms BTC for the following 3-6 months
This happened in:
— Q4 2020: ETH/BTC at cycle lows → ETH went 4x vs BTC
— Q4 2022: ETH/BTC at cycle lows → ETH went 3x vs BTC
— Right now: ETH/BTC near cycle lows again
The catalyst this time?
🔥 Staking ETF filing: expected any week post-CLARITY Act
🔥 Bitmine: 5M ETH treasury approaching completion
🔥 Iran truce → risk-on → ETH benefits MORE than BTC
🔥 $2,000 support: held through everything
🔥 Glamsterdam upgrade: coming
📊 ETH today:
— Price: ~$1,900-$2,000 — at critical zone
— ETH/BTC ratio: near historical reversal point ✅
— $2,000 support: must hold ✅
— Staking ETF: imminent ✅
— Standard Chartered: $7,500 ✅
The ratio that predicted every ETH rally is at the same level again.
History doesn't guarantee repeats. But it rhymes loudly.
#Ethereum #ETHBTCRatio #CycleBottom #BinanceSquare #SECChairConfidentInCLARITYAct
84
·
--
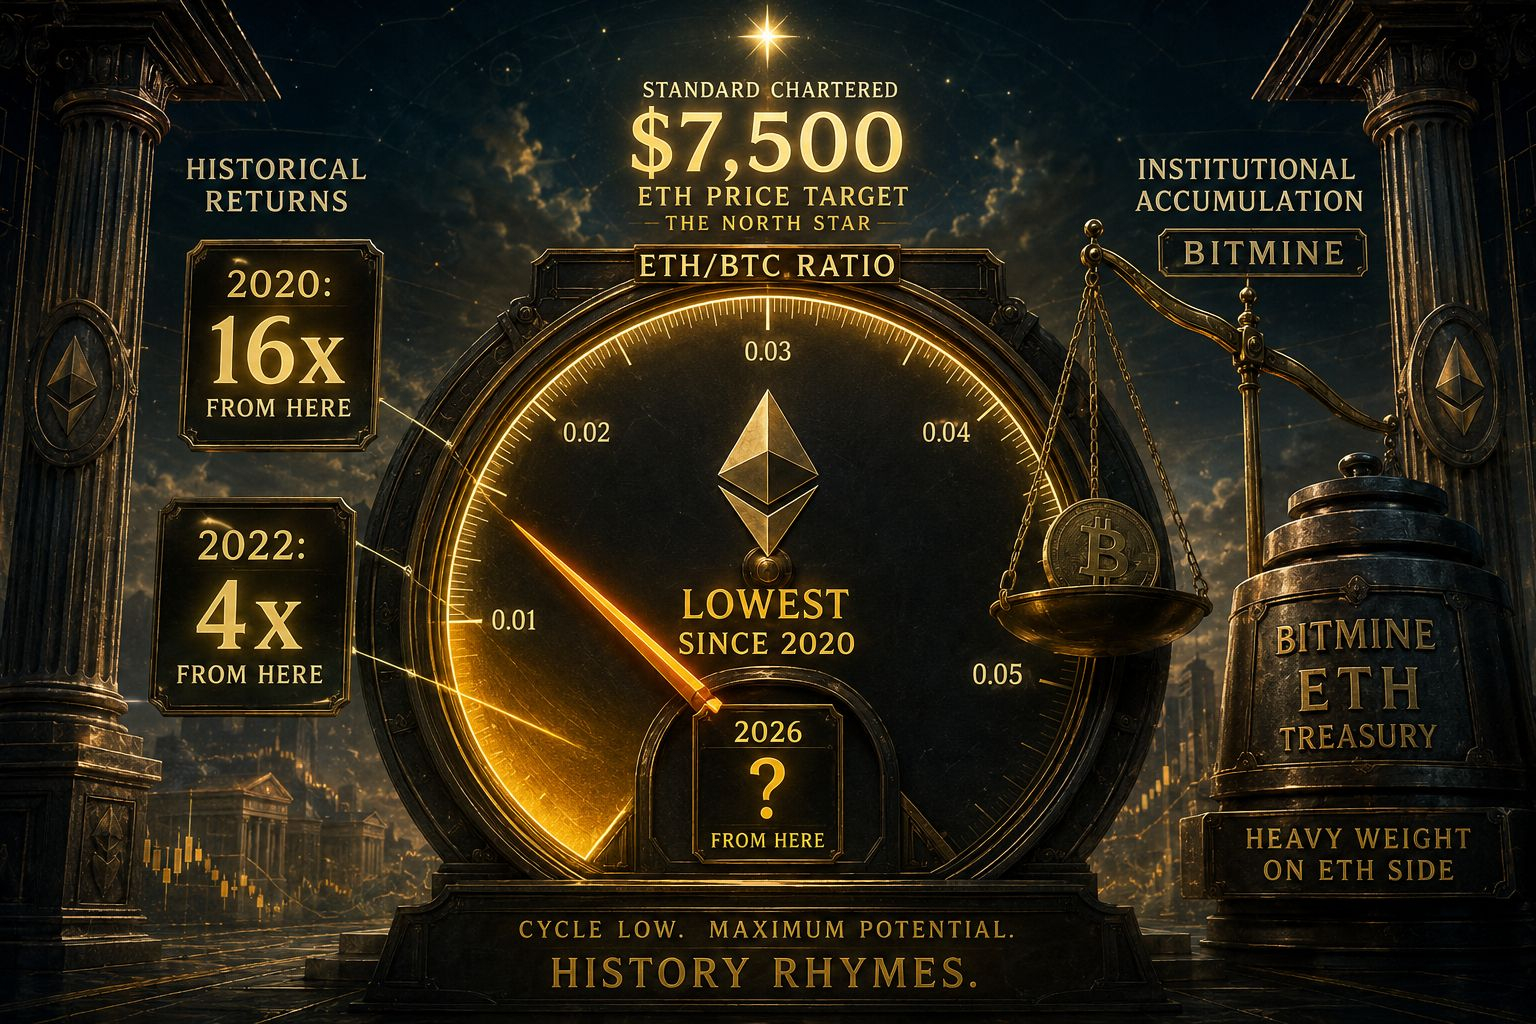
The ETH/BTC ratio just hit its lowest point since 2020.
And in 2020 — ETH went from $300 to $4,953.
I want to be honest: the $ETH price is painful right now. $1,800-$1,900 after $2,400 highs.
But the ETH/BTC ratio tells a different story than the USD price.
When ETH/BTC hits these lows — it means ETH is the most undervalued vs Bitcoin that it's been in years. And historically — this ratio has been the single most reliable ETH entry signal.
2020: ETH/BTC at lows → ETH went 16x
2022: ETH/BTC at lows → ETH went 4x from the bottom
2026: ETH/BTC at lows again
Combined with:
🔥 Bitmine approaching 5M ETH — accumulating at current prices
🔥 Staking ETF filing: expected any week
🔥 Glamsterdam upgrade coming
🔥 USDC Meta payments: running on ETH rails
🔥 Standard Chartered: $7,500 unchanged
📊 ETH today:
— Price: ~$1,800-$1,900
— ETH/BTC ratio: lowest since 2020 ✅
— 2020 from same ratio level → ETH 16x ✅
— 2022 from same ratio level → ETH 4x ✅
— Bitmine still accumulating ✅
— Standard Chartered: $7,500 ✅
The USD price is scary. The ratio is screaming opportunity.
Which one do you trust more?
#Ethereum #ETHBTCRatio #HistoricalSignal #BinanceSquare #BitcoinETFPremiumTwoYearLow
The ETH/BTC ratio just hit its lowest point since 2020.
And in 2020 — ETH went from $300 to $4,953.
I want to be honest: the $ETH price is painful right now. $1,800-$1,900 after $2,400 highs.
But the ETH/BTC ratio tells a different story than the USD price.
When ETH/BTC hits these lows — it means ETH is the most undervalued vs Bitcoin that it's been in years. And historically — this ratio has been the single most reliable ETH entry signal.
2020: ETH/BTC at lows → ETH went 16x
2022: ETH/BTC at lows → ETH went 4x from the bottom
2026: ETH/BTC at lows again
Combined with:
🔥 Bitmine approaching 5M ETH — accumulating at current prices
🔥 Staking ETF filing: expected any week
🔥 Glamsterdam upgrade coming
🔥 USDC Meta payments: running on ETH rails
🔥 Standard Chartered: $7,500 unchanged
📊 ETH today:
— Price: ~$1,800-$1,900
— ETH/BTC ratio: lowest since 2020 ✅
— 2020 from same ratio level → ETH 16x ✅
— 2022 from same ratio level → ETH 4x ✅
— Bitmine still accumulating ✅
— Standard Chartered: $7,500 ✅
The USD price is scary. The ratio is screaming opportunity.
Which one do you trust more?
#Ethereum #ETHBTCRatio #HistoricalSignal #BinanceSquare #BitcoinETFPremiumTwoYearLow
And in 2020 — ETH went from $300 to $4,953.
I want to be honest: the $ETH price is painful right now. $1,800-$1,900 after $2,400 highs.
But the ETH/BTC ratio tells a different story than the USD price.
When ETH/BTC hits these lows — it means ETH is the most undervalued vs Bitcoin that it's been in years. And historically — this ratio has been the single most reliable ETH entry signal.
2020: ETH/BTC at lows → ETH went 16x
2022: ETH/BTC at lows → ETH went 4x from the bottom
2026: ETH/BTC at lows again
Combined with:
🔥 Bitmine approaching 5M ETH — accumulating at current prices
🔥 Staking ETF filing: expected any week
🔥 Glamsterdam upgrade coming
🔥 USDC Meta payments: running on ETH rails
🔥 Standard Chartered: $7,500 unchanged
📊 ETH today:
— Price: ~$1,800-$1,900
— ETH/BTC ratio: lowest since 2020 ✅
— 2020 from same ratio level → ETH 16x ✅
— 2022 from same ratio level → ETH 4x ✅
— Bitmine still accumulating ✅
— Standard Chartered: $7,500 ✅
The USD price is scary. The ratio is screaming opportunity.
Which one do you trust more?
#Ethereum #ETHBTCRatio #HistoricalSignal #BinanceSquare #BitcoinETFPremiumTwoYearLow
180
·
--
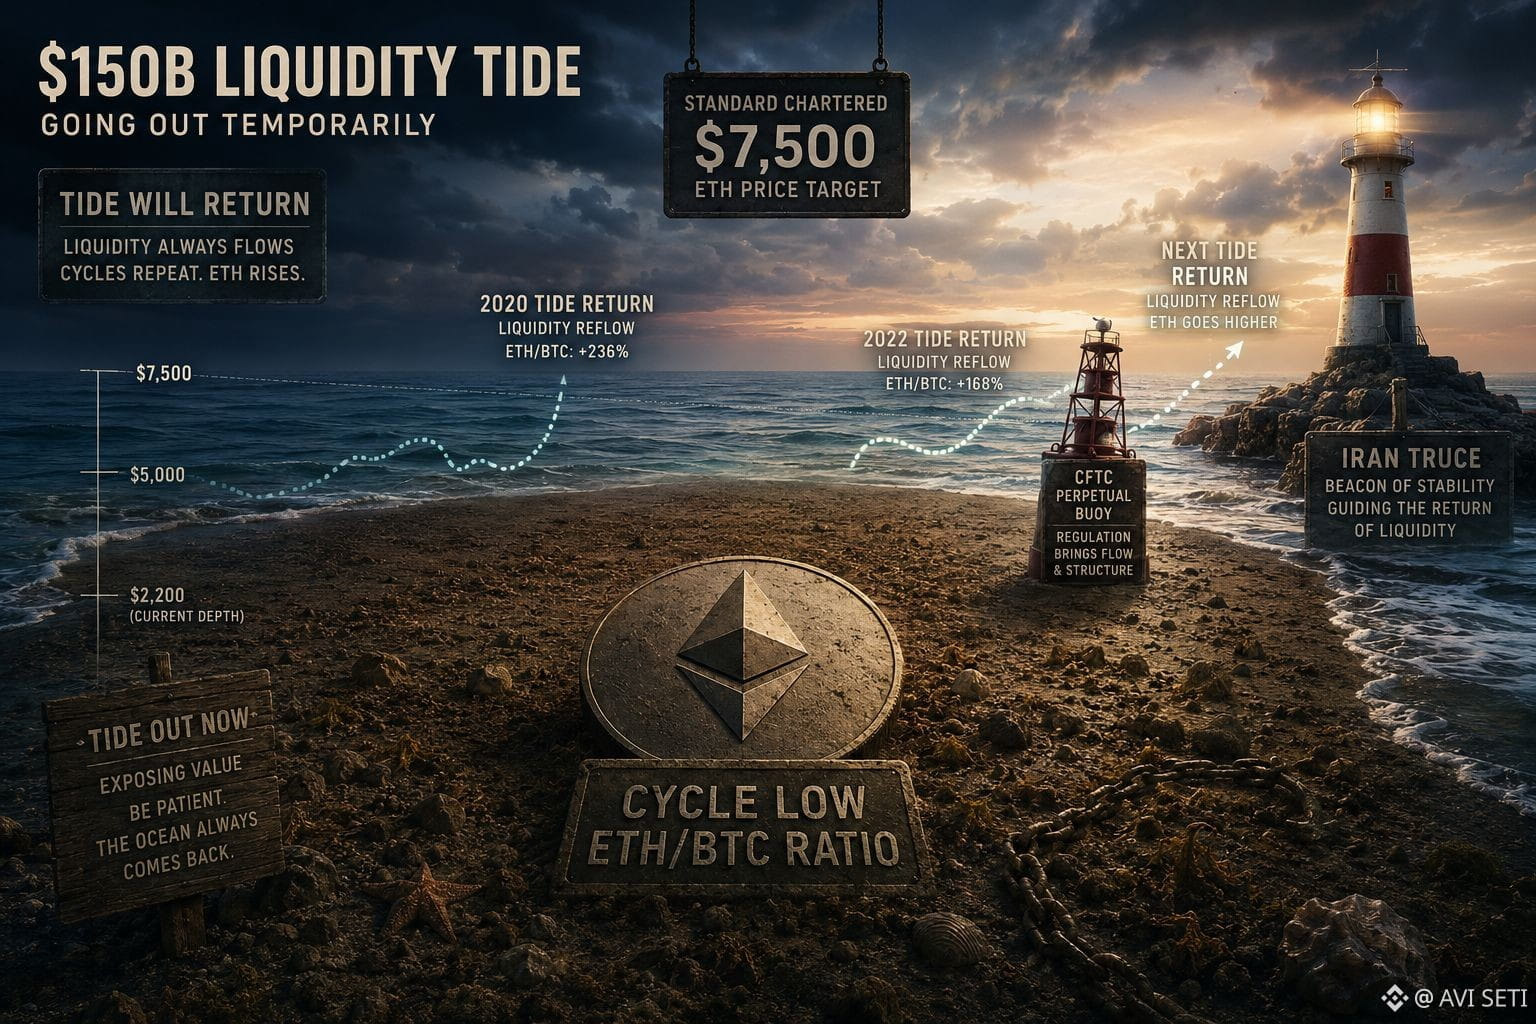
Fund manager Michael Kramer flagged a $150 billion liquidity drain incoming.
US Treasury operations pulling cash from markets.
And $ETH at $1,900-$2,000 is absorbing it.
Let me explain this simply.
When the US Treasury does large operations — they pull liquidity from financial markets. Less money available means risk assets face pressure. Stocks drop a bit. Crypto drops more.
That's part of what's been happening this week.
But here's the thing about liquidity drains — they end. They're temporary.
And when $150 billion of liquidity pressure ends — and the Iran truce gets signed — and the CFTC perpetual market opens — the liquidity flows BACK into risk assets.
ETH — at $1,900-$2,000 — is sitting at exactly the level where the liquidity reflood will matter most.
Because the ETH/BTC ratio is at cycle lows. When liquidity returns — ETH historically outperforms BTC coming off these ratio lows.
📊 ETH today:
— Price: ~$1,900-$2,000 — at critical support
— $2,000 floor: must hold on monthly close ✅
— $150B liquidity drain: temporary pressure ✅
— ETH/BTC ratio: cycle lows → historical reversal point ✅
— CFTC ETH perpetuals: coming next ✅
— Standard Chartered: $7,500 ✅
Temporary liquidity drain. Permanent structural improvements.
The math still works in ETH's favor.
#Ethereum #Liquidity #ETHBTCRatio #BinanceSquare #WintermutePredictionMarketLiquidity
Fund manager Michael Kramer flagged a $150 billion liquidity drain incoming.
US Treasury operations pulling cash from markets.
And $ETH at $1,900-$2,000 is absorbing it.
Let me explain this simply.
When the US Treasury does large operations — they pull liquidity from financial markets. Less money available means risk assets face pressure. Stocks drop a bit. Crypto drops more.
That's part of what's been happening this week.
But here's the thing about liquidity drains — they end. They're temporary.
And when $150 billion of liquidity pressure ends — and the Iran truce gets signed — and the CFTC perpetual market opens — the liquidity flows BACK into risk assets.
ETH — at $1,900-$2,000 — is sitting at exactly the level where the liquidity reflood will matter most.
Because the ETH/BTC ratio is at cycle lows. When liquidity returns — ETH historically outperforms BTC coming off these ratio lows.
📊 ETH today:
— Price: ~$1,900-$2,000 — at critical support
— $2,000 floor: must hold on monthly close ✅
— $150B liquidity drain: temporary pressure ✅
— ETH/BTC ratio: cycle lows → historical reversal point ✅
— CFTC ETH perpetuals: coming next ✅
— Standard Chartered: $7,500 ✅
Temporary liquidity drain. Permanent structural improvements.
The math still works in ETH's favor.
#Ethereum #Liquidity #ETHBTCRatio #BinanceSquare #WintermutePredictionMarketLiquidity
US Treasury operations pulling cash from markets.
And $ETH at $1,900-$2,000 is absorbing it.
Let me explain this simply.
When the US Treasury does large operations — they pull liquidity from financial markets. Less money available means risk assets face pressure. Stocks drop a bit. Crypto drops more.
That's part of what's been happening this week.
But here's the thing about liquidity drains — they end. They're temporary.
And when $150 billion of liquidity pressure ends — and the Iran truce gets signed — and the CFTC perpetual market opens — the liquidity flows BACK into risk assets.
ETH — at $1,900-$2,000 — is sitting at exactly the level where the liquidity reflood will matter most.
Because the ETH/BTC ratio is at cycle lows. When liquidity returns — ETH historically outperforms BTC coming off these ratio lows.
📊 ETH today:
— Price: ~$1,900-$2,000 — at critical support
— $2,000 floor: must hold on monthly close ✅
— $150B liquidity drain: temporary pressure ✅
— ETH/BTC ratio: cycle lows → historical reversal point ✅
— CFTC ETH perpetuals: coming next ✅
— Standard Chartered: $7,500 ✅
Temporary liquidity drain. Permanent structural improvements.
The math still works in ETH's favor.
#Ethereum #Liquidity #ETHBTCRatio #BinanceSquare #WintermutePredictionMarketLiquidity
80

·
--
The ETH/BTC Ratio Is the Altcoin Season Clock
Most traders chase altcoin gains reactively — they notice a rally already in progress and buy near the top. The smarter play is watching one ratio before it happens: ETH/BTC.
Here is why it works:
Bitcoin dominates early in every cycle. Capital enters the market through BTC first — it is the safest on-ramp, the most liquid, and the narrative anchor. Once BTC establishes a range and confidence builds, capital flows into ETH as the next layer of risk. When ETH outperforms BTC, it signals that risk appetite is genuinely expanding beyond the lead asset.
The rotation waterfall follows fast. Once ETH/BTC breaks upward, mid-cap and small-cap altcoins tend to follow within weeks. This pattern repeats cycle after cycle — it is how liquidity cascades down the market cap ladder.
What to watch:
• ETH/BTC holding above its 50-week MA = healthy rotation environment
• Stablecoin supply still expanding = dry powder in the market
• BTC dominance topping out = capital looking for new targets
Altcoin season is not random. It is a sequence. Traders who map the sequence in advance — not in hindsight — capture the full move.
Know the clock before it starts ticking.
$BTC $ETH
#AltcoinSeason #CryptoMarket #ETHBTCRatio #CyclePsychology #CryptoStrategy
The ETH/BTC Ratio Is the Altcoin Season Clock
Most traders chase altcoin gains reactively — they notice a rally already in progress and buy near the top. The smarter play is watching one ratio before it happens: ETH/BTC.
Here is why it works:
Bitcoin dominates early in every cycle. Capital enters the market through BTC first — it is the safest on-ramp, the most liquid, and the narrative anchor. Once BTC establishes a range and confidence builds, capital flows into ETH as the next layer of risk. When ETH outperforms BTC, it signals that risk appetite is genuinely expanding beyond the lead asset.
The rotation waterfall follows fast. Once ETH/BTC breaks upward, mid-cap and small-cap altcoins tend to follow within weeks. This pattern repeats cycle after cycle — it is how liquidity cascades down the market cap ladder.
What to watch:
• ETH/BTC holding above its 50-week MA = healthy rotation environment
• Stablecoin supply still expanding = dry powder in the market
• BTC dominance topping out = capital looking for new targets
Altcoin season is not random. It is a sequence. Traders who map the sequence in advance — not in hindsight — capture the full move.
Know the clock before it starts ticking.
$BTC $ETH
#AltcoinSeason #CryptoMarket #ETHBTCRatio #CyclePsychology #CryptoStrategy
Most traders chase altcoin gains reactively — they notice a rally already in progress and buy near the top. The smarter play is watching one ratio before it happens: ETH/BTC.
Here is why it works:
Bitcoin dominates early in every cycle. Capital enters the market through BTC first — it is the safest on-ramp, the most liquid, and the narrative anchor. Once BTC establishes a range and confidence builds, capital flows into ETH as the next layer of risk. When ETH outperforms BTC, it signals that risk appetite is genuinely expanding beyond the lead asset.
The rotation waterfall follows fast. Once ETH/BTC breaks upward, mid-cap and small-cap altcoins tend to follow within weeks. This pattern repeats cycle after cycle — it is how liquidity cascades down the market cap ladder.
What to watch:
• ETH/BTC holding above its 50-week MA = healthy rotation environment
• Stablecoin supply still expanding = dry powder in the market
• BTC dominance topping out = capital looking for new targets
Altcoin season is not random. It is a sequence. Traders who map the sequence in advance — not in hindsight — capture the full move.
Know the clock before it starts ticking.
$BTC $ETH
#AltcoinSeason #CryptoMarket #ETHBTCRatio #CyclePsychology #CryptoStrategy
43
·
--
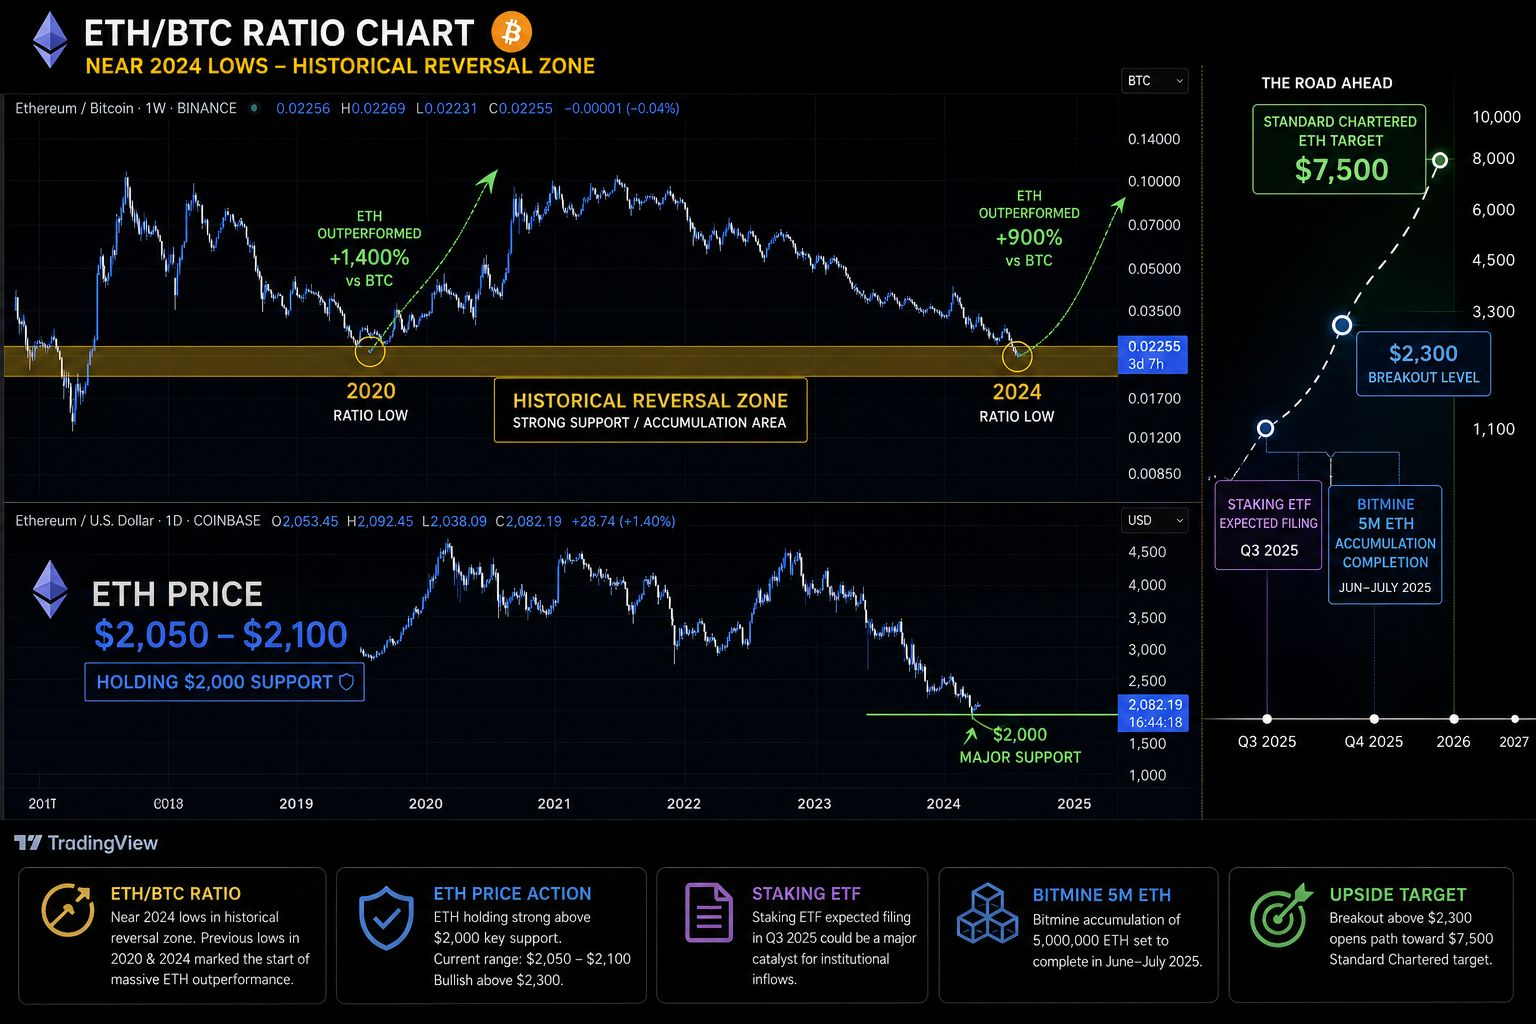
This week's headline was "ETH Brothers Wane — HYPE Brothers Wax."
$ETH underperformed. HYPE outperformed.
And that's actually setting up something interesting for $ETH.
Here's what happens when ETH underperforms for too long.
Capital rotates away. Sentiment drops. Headlines turn negative.
The ETH/BTC ratio hits lows.
And then — historically — ETH snaps back harder than anything.
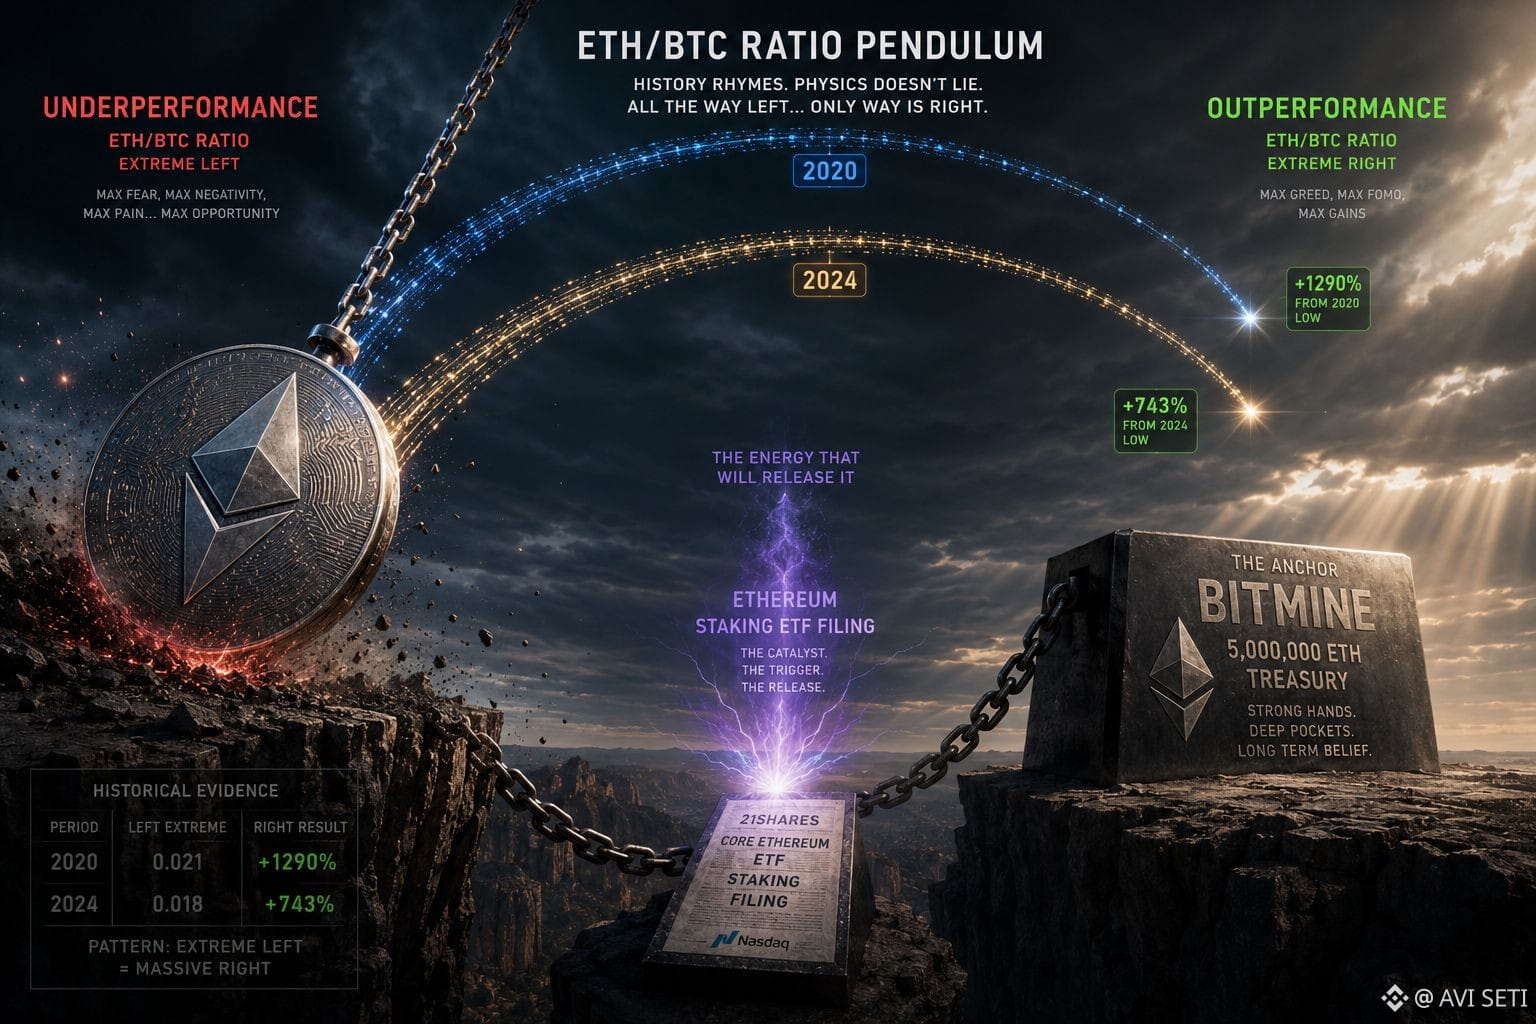
2020: ETH lagged BTC for months → then did 4x when it caught up.
2024: ETH lagged BTC for months → then ran from $1,600 to $4,000.
Right now:
— ETH/BTC ratio: near 2024 lows — historically a reversal point
— Fear & Greed at 25: ETH weak hands likely gone
— Staking ETF path: cleared — filing expected any week
— Bitmine: approaching 5M ETH treasury — accumulation almost complete
— $2,000 support: held through the weekend crash
The pattern is familiar. $ETH always arrives late.
But when it arrives — it makes up for every week of waiting.
📊 ETH today:
— Price: ~$2,050-$2,100
— ETH/BTC ratio: near reversal zone ✅
— Staking ETF filing: imminent ✅
— $2,000 support: held ✅
— Standard Chartered: $7,500 ✅
ETH is waning. Historically that's when the turnaround comes.
#Ethereum #ETHBTCRatio #Reversal #BinanceSquare #BitMineHolds$12.3BCryptoAssets
This week's headline was "ETH Brothers Wane — HYPE Brothers Wax."
$ETH underperformed. HYPE outperformed.
And that's actually setting up something interesting for $ETH .
Here's what happens when ETH underperforms for too long.
Capital rotates away. Sentiment drops. Headlines turn negative.
The ETH/BTC ratio hits lows.
And then — historically — ETH snaps back harder than anything.
2020: ETH lagged BTC for months → then did 4x when it caught up.
2024: ETH lagged BTC for months → then ran from $1,600 to $4,000.
Right now:
— ETH/BTC ratio: near 2024 lows — historically a reversal point
— Fear & Greed at 25: ETH weak hands likely gone
— Staking ETF path: cleared — filing expected any week
— Bitmine: approaching 5M ETH treasury — accumulation almost complete
— $2,000 support: held through the weekend crash
The pattern is familiar. $ETH always arrives late.
But when it arrives — it makes up for every week of waiting.
📊 ETH today:
— Price: ~$2,050-$2,100
— ETH/BTC ratio: near reversal zone ✅
— Staking ETF filing: imminent ✅
— $2,000 support: held ✅
— Standard Chartered: $7,500 ✅
ETH is waning. Historically that's when the turnaround comes.
#Ethereum #ETHBTCRatio #Reversal #BinanceSquare #BitMineHolds$12.3BCryptoAssets
$ETH underperformed. HYPE outperformed.
And that's actually setting up something interesting for $ETH .
Here's what happens when ETH underperforms for too long.
Capital rotates away. Sentiment drops. Headlines turn negative.
The ETH/BTC ratio hits lows.
And then — historically — ETH snaps back harder than anything.
2020: ETH lagged BTC for months → then did 4x when it caught up.
2024: ETH lagged BTC for months → then ran from $1,600 to $4,000.
Right now:
— ETH/BTC ratio: near 2024 lows — historically a reversal point
— Fear & Greed at 25: ETH weak hands likely gone
— Staking ETF path: cleared — filing expected any week
— Bitmine: approaching 5M ETH treasury — accumulation almost complete
— $2,000 support: held through the weekend crash
The pattern is familiar. $ETH always arrives late.
But when it arrives — it makes up for every week of waiting.
📊 ETH today:
— Price: ~$2,050-$2,100
— ETH/BTC ratio: near reversal zone ✅
— Staking ETF filing: imminent ✅
— $2,000 support: held ✅
— Standard Chartered: $7,500 ✅
ETH is waning. Historically that's when the turnaround comes.
#Ethereum #ETHBTCRatio #Reversal #BinanceSquare #BitMineHolds$12.3BCryptoAssets
127
Log in to explore more content
Join global crypto users on Binance Square
⚡️ Get latest and useful information about crypto.
💬 Trusted by the world’s largest crypto exchange.
👍 Discover real insights from verified creators.
Email / Phone number
Trending Topics
1
#UKFCAWinsCourtOrderToRecover851400Pounds
38,599 views
824 Discussing
2
#ChainlinkLaunchesCCIP2WithEnterpriseVerification
50,791 views
996 Discussing
3
#GoldFallsTo$4144
17,474 views
167 Discussing
4
#QNTFallsOver40%FromMorningHigh
98,373 views
1,389 Discussing
5
#USDTAdds845900HoldersInPast7Days
21,831 views
447 Discussing
6
#KospiFalls2.7%SamsungSKHynixDropOver5%
34,330 views
615 Discussing
7
#BitgetCEOConfirms$388MStolenInHack
5,683 views
43 Discussing
8
#BTCFallsBelow$83000
35,173 views
170 Discussing
9
#BitgetDetailsSecurityIncidentTimeline
56,070 views
764 Discussing
10
#BitcoinSpotETFs$2.39BWeeklyNetInflow
16,544 views
49 Discussing