
#captoken
captoken
2,250 views
24 Discussing
Hot
Latest

📈 CAP Token Analysis: Massive Volatility and Consolidation Following 223% Surge
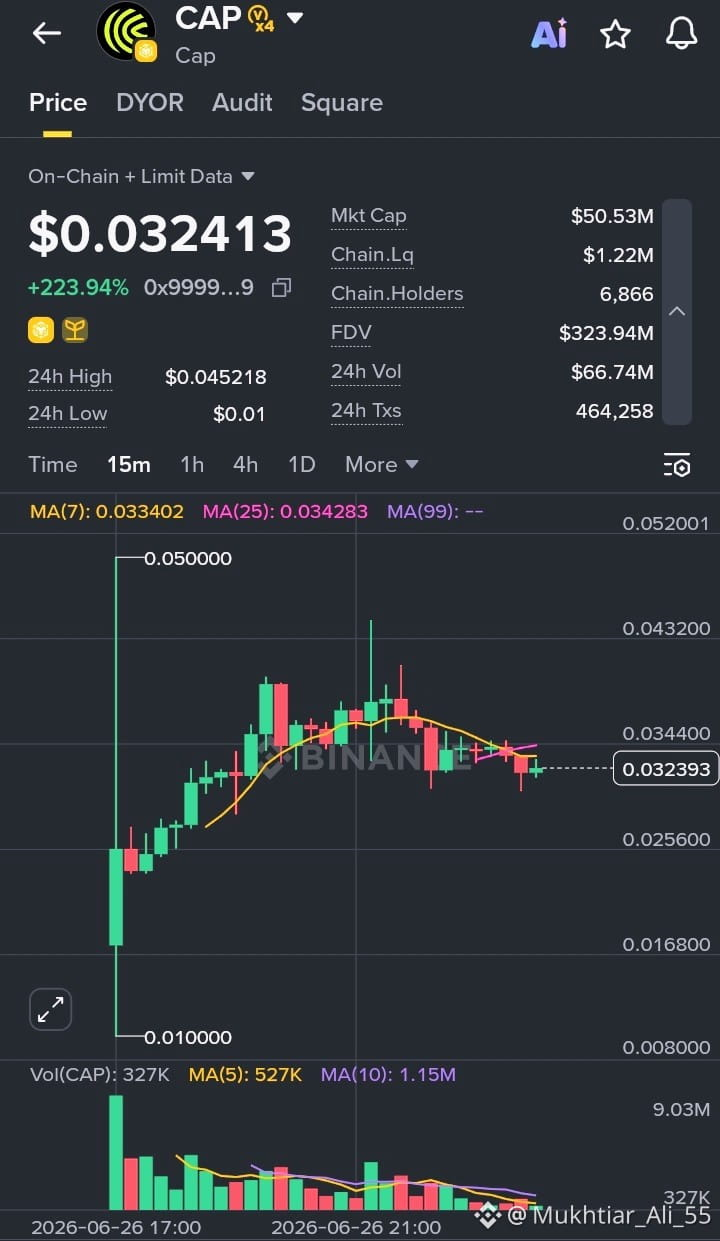
An analysis of the market data reveals explosive on-chain activity for the CAP token. It is currently trading at $0.032413, marking a massive +223.94% gain over the last 24 hours.
Key Market Metrics At a Glance
Price Action: CAP experienced an aggressive breakout from a 24-hour low of $0.01, peaking at a high of $0.045218 before entering its current consolidation phase.
Market Capitalization & FDV: The current circulating market cap stands at $50.53M, while the Fully Diluted Valuation (FDV) is positioned significantly higher at $323.94M. This gap suggests a substantial portion of the token supply remains uncirculated.
Volume & Liquidity: 24-hour trading volume reached an impressive $66.74M, surpassing the current market cap and demonstrating intense speculative interest. On-chain liquidity (Chain.Lq) is sitting at $1.22M across 464,258 transactions.
Holder Base: Total on-chain holders currently sit at 6,866.
Technical Breakdown (15-Minute Chart)
The 15-minute chart shows a classic "impulse and flags" structure. Following the initial vertical spike up to the $0.050 area, trading volume has visibly tapered off (as shown by the declining volume bars at the bottom).
Moving Averages: The price is closely hugging the short-term moving averages, with the MA(7) at $0.033402 and the MA(25) at $0.034283. A minor bearish crossover has occurred on this micro-timeframe, forcing the price slightly under both lines as volatility tightens into a wedge.
Immediate Outlook: The token is compressing into a tight trading range between $0.031 and $0.034. A decisive break above the MA(25) could reignite bullish momentum toward the recent high, while a failure to hold the $0.031 support level might lead to a deeper retracement toward the initial breakout zone.
Given the high volume-to-liquidity ratio, traders should exercise strict risk management, as sharp fluctuations are highly likely in these conditions.
#CryptoAnalysis #CAPtoken
$CAP
{alpha}(560x99991c6aabba5a096f24f250b73580f5179b9999)
📈 CAP Token Analysis: Massive Volatility and Consolidation Following 223% Surge
An analysis of the market data reveals explosive on-chain activity for the CAP token. It is currently trading at $0.032413, marking a massive +223.94% gain over the last 24 hours.
Key Market Metrics At a Glance
Price Action: CAP experienced an aggressive breakout from a 24-hour low of $0.01, peaking at a high of $0.045218 before entering its current consolidation phase.
Market Capitalization & FDV: The current circulating market cap stands at $50.53M, while the Fully Diluted Valuation (FDV) is positioned significantly higher at $323.94M. This gap suggests a substantial portion of the token supply remains uncirculated.
Volume & Liquidity: 24-hour trading volume reached an impressive $66.74M, surpassing the current market cap and demonstrating intense speculative interest. On-chain liquidity (Chain.Lq) is sitting at $1.22M across 464,258 transactions.
Holder Base: Total on-chain holders currently sit at 6,866.
Technical Breakdown (15-Minute Chart)
The 15-minute chart shows a classic "impulse and flags" structure. Following the initial vertical spike up to the $0.050 area, trading volume has visibly tapered off (as shown by the declining volume bars at the bottom).
Moving Averages: The price is closely hugging the short-term moving averages, with the MA(7) at $0.033402 and the MA(25) at $0.034283. A minor bearish crossover has occurred on this micro-timeframe, forcing the price slightly under both lines as volatility tightens into a wedge.
Immediate Outlook: The token is compressing into a tight trading range between $0.031 and $0.034. A decisive break above the MA(25) could reignite bullish momentum toward the recent high, while a failure to hold the $0.031 support level might lead to a deeper retracement toward the initial breakout zone.
Given the high volume-to-liquidity ratio, traders should exercise strict risk management, as sharp fluctuations are highly likely in these conditions.
#CryptoAnalysis #CAPtoken
$CAP
An analysis of the market data reveals explosive on-chain activity for the CAP token. It is currently trading at $0.032413, marking a massive +223.94% gain over the last 24 hours.
Key Market Metrics At a Glance
Price Action: CAP experienced an aggressive breakout from a 24-hour low of $0.01, peaking at a high of $0.045218 before entering its current consolidation phase.
Market Capitalization & FDV: The current circulating market cap stands at $50.53M, while the Fully Diluted Valuation (FDV) is positioned significantly higher at $323.94M. This gap suggests a substantial portion of the token supply remains uncirculated.
Volume & Liquidity: 24-hour trading volume reached an impressive $66.74M, surpassing the current market cap and demonstrating intense speculative interest. On-chain liquidity (Chain.Lq) is sitting at $1.22M across 464,258 transactions.
Holder Base: Total on-chain holders currently sit at 6,866.
Technical Breakdown (15-Minute Chart)
The 15-minute chart shows a classic "impulse and flags" structure. Following the initial vertical spike up to the $0.050 area, trading volume has visibly tapered off (as shown by the declining volume bars at the bottom).
Moving Averages: The price is closely hugging the short-term moving averages, with the MA(7) at $0.033402 and the MA(25) at $0.034283. A minor bearish crossover has occurred on this micro-timeframe, forcing the price slightly under both lines as volatility tightens into a wedge.
Immediate Outlook: The token is compressing into a tight trading range between $0.031 and $0.034. A decisive break above the MA(25) could reignite bullish momentum toward the recent high, while a failure to hold the $0.031 support level might lead to a deeper retracement toward the initial breakout zone.
Given the high volume-to-liquidity ratio, traders should exercise strict risk management, as sharp fluctuations are highly likely in these conditions.
#CryptoAnalysis #CAPtoken
$CAP
1
347

·
--
$CAP
{future}(CAPUSDT)
$CAP (Cap) Binance Alpha Update: 🚀
CAP is getting fresh attention on Binance Alpha after Binance launched a $100K $USDC
trading competition, running through September 24, 2026. The event has increased trading activity and visibility around CAP, making it a token to watch for volatility and momentum. �
binance.com +1
#CAP #BinanceAlpha #CapToken #CryptoUpdate #BinanceSquare
{spot}(USDCUSDT)
$CAP
$CAP (Cap) Binance Alpha Update: 🚀
CAP is getting fresh attention on Binance Alpha after Binance launched a $100K $USDC
trading competition, running through September 24, 2026. The event has increased trading activity and visibility around CAP, making it a token to watch for volatility and momentum. �
binance.com +1
#CAP #BinanceAlpha #CapToken #CryptoUpdate #BinanceSquare
$CAP (Cap) Binance Alpha Update: 🚀
CAP is getting fresh attention on Binance Alpha after Binance launched a $100K $USDC
trading competition, running through September 24, 2026. The event has increased trading activity and visibility around CAP, making it a token to watch for volatility and momentum. �
binance.com +1
#CAP #BinanceAlpha #CapToken #CryptoUpdate #BinanceSquare

324

·
--
Cap (CAP) Trading Contest on Binance Alpha: Your chance to win $100,000 USDC! 🚀💰🎯 Start now on an exciting trading adventure with the exclusive Cap (CAP) contest on the Binance Alpha platform!
🔹 Binance Wallet (Keyless) has announced the launch of a massive trading contest for the Cap (CAP) token, giving participants the chance to share a total prize pool of $100,000 USDC
🔹 The contest period runs from 17 September 2026 at 13:00 Coordinated Universal Time (UTC) until 24 September 2026 at 13:00 UTC
Cap (CAP) Trading Contest on Binance Alpha: Your chance to win $100,000 USDC! 🚀💰
🎯 Start now on an exciting trading adventure with the exclusive Cap (CAP) contest on the Binance Alpha platform!
🔹 Binance Wallet (Keyless) has announced the launch of a massive trading contest for the Cap (CAP) token, giving participants the chance to share a total prize pool of $100,000 USDC
🔹 The contest period runs from 17 September 2026 at 13:00 Coordinated Universal Time (UTC) until 24 September 2026 at 13:00 UTC
🔹 Binance Wallet (Keyless) has announced the launch of a massive trading contest for the Cap (CAP) token, giving participants the chance to share a total prize pool of $100,000 USDC
🔹 The contest period runs from 17 September 2026 at 13:00 Coordinated Universal Time (UTC) until 24 September 2026 at 13:00 UTC
95

Cap Trading Contest on Binance Alpha: Your Chance to Win a Share of $100,000! 🚀🎯🚀 Launch the biggest event in the world of crypto! Binance Wallet announces an exclusive trading contest for the Cap (CAP) token on the Binance Alpha platform, with total prizes reaching up to USD 100,000, distributed equally among the top 2,000 traders!
🔹 **What is the golden opportunity?**
During the period from 17 September 2026 at 13:00 UTC until 24 September 2026 at 13:00 UTC, any user eligible to trade Binance Alpha tokens can participate in this exciting contest. All you need to do is trade the Cap (CAP) token via the Binance Wallet (Keyless) or directly on the Binance Alpha platform.
Cap Trading Contest on Binance Alpha: Your Chance to Win a Share of $100,000! 🚀🎯
🚀 Launch the biggest event in the world of crypto! Binance Wallet announces an exclusive trading contest for the Cap (CAP) token on the Binance Alpha platform, with total prizes reaching up to USD 100,000, distributed equally among the top 2,000 traders!
🔹 **What is the golden opportunity?**
During the period from 17 September 2026 at 13:00 UTC until 24 September 2026 at 13:00 UTC, any user eligible to trade Binance Alpha tokens can participate in this exciting contest. All you need to do is trade the Cap (CAP) token via the Binance Wallet (Keyless) or directly on the Binance Alpha platform.
🔹 **What is the golden opportunity?**
During the period from 17 September 2026 at 13:00 UTC until 24 September 2026 at 13:00 UTC, any user eligible to trade Binance Alpha tokens can participate in this exciting contest. All you need to do is trade the Cap (CAP) token via the Binance Wallet (Keyless) or directly on the Binance Alpha platform.
109


Current $CAP situation: Price hovering ~$0.028 with strong 10%+ 24h gains amid listings. MC around $44M, FDV ~$285M. High liquidity on PancakeSwap & CEXs. Cap Labs bringing verifiable yield & stablecoins – real utility in DeFi! 📈 #CAPToken
Current $CAP situation: Price hovering ~$0.028 with strong 10%+ 24h gains amid listings. MC around $44M, FDV ~$285M. High liquidity on PancakeSwap & CEXs. Cap Labs bringing verifiable yield & stablecoins – real utility in DeFi! 📈 #CAPToken
172

·
--
Bullish
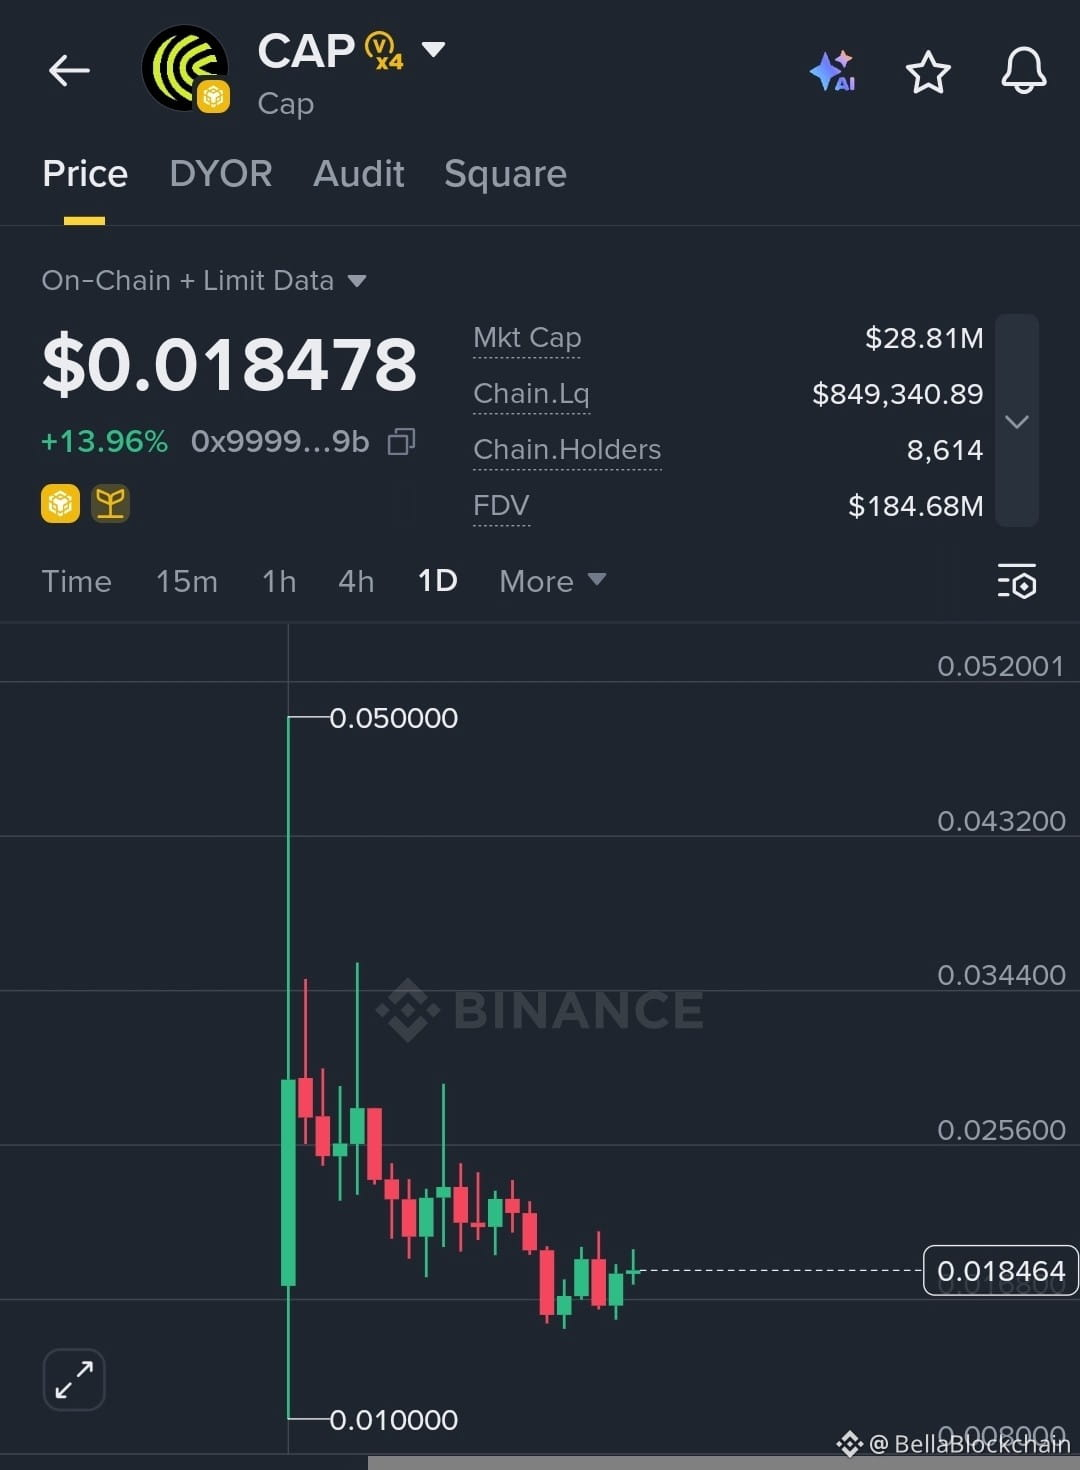
$CAP chart on the 1-day interval indicates a solid bullish recovery, climbing over 13% to sit at $0.018478. After testing a deep local support level near $0.010000 and rejecting it, the price is starting to consolidate and form a steady upward curvature. With the market cap currently valued at $28.81M and holding 8,614 holders, a sustained breakout from this accumulation range could quickly trigger a retest of previous key resistance blocks.
Target 1: $0.023500
Target 2: $0.029800
Target 3: $0.035000
#CAP #CapToken #Altcoins
$CAP
{alpha}(560x99991c6aabba5a096f24f250b73580f5179b9999)
$CAP chart on the 1-day interval indicates a solid bullish recovery, climbing over 13% to sit at $0.018478. After testing a deep local support level near $0.010000 and rejecting it, the price is starting to consolidate and form a steady upward curvature. With the market cap currently valued at $28.81M and holding 8,614 holders, a sustained breakout from this accumulation range could quickly trigger a retest of previous key resistance blocks.
Target 1: $0.023500
Target 2: $0.029800
Target 3: $0.035000
#CAP #CapToken #Altcoins
$CAP
Target 1: $0.023500
Target 2: $0.029800
Target 3: $0.035000
#CAP #CapToken #Altcoins
$CAP
1
91

·
--
Cap just shocked the market with a massive 39% surge in 24 hours, pushing its price to $0.036! 🚀
For beginners, this means the token’s value jumped significantly in a single day, likely driven by heavy trading volume hitting $55 million — nearly matching its total $56 million market cap. When volume rivals market cap, it signals intense interest and liquidity moving in and out fast. Currently ranked #399, CAP is a smaller-cap asset, so moves like this are common but risky. Always check the project fundamentals before chasing green candles, as volatility cuts both ways.
#CapToken #CryptoGainers
Do you think this rally has legs, or is it just a quick pump?
Cap just shocked the market with a massive 39% surge in 24 hours, pushing its price to $0.036! 🚀
For beginners, this means the token’s value jumped significantly in a single day, likely driven by heavy trading volume hitting $55 million — nearly matching its total $56 million market cap. When volume rivals market cap, it signals intense interest and liquidity moving in and out fast. Currently ranked #399, CAP is a smaller-cap asset, so moves like this are common but risky. Always check the project fundamentals before chasing green candles, as volatility cuts both ways.
#CapToken #CryptoGainers
Do you think this rally has legs, or is it just a quick pump?
For beginners, this means the token’s value jumped significantly in a single day, likely driven by heavy trading volume hitting $55 million — nearly matching its total $56 million market cap. When volume rivals market cap, it signals intense interest and liquidity moving in and out fast. Currently ranked #399, CAP is a smaller-cap asset, so moves like this are common but risky. Always check the project fundamentals before chasing green candles, as volatility cuts both ways.
#CapToken #CryptoGainers
Do you think this rally has legs, or is it just a quick pump?
504
Update on $CAP : High volume, active trading pairs everywhere. Protocol delivering 5%+ APY on USD stables. In current market conditions, real yield projects like this stand out. Bullish! #DeFi #CAPToken
Update on $CAP : High volume, active trading pairs everywhere. Protocol delivering 5%+ APY on USD stables. In current market conditions, real yield projects like this stand out. Bullish! #DeFi #CAPToken
220

·
--
Bullish
🚀 HIGH-VELOCITY BREAKOUT: $SYN, $ACT, and $CAP Printing Explosive Green Structural Extensions Tonight! 📊💥
Good afternoon, Square family! If you are analyzing the live liquidity rotation across active order books right now, you can instantly see where the smart money is aggressively scaling. The broader market ranges are tightening, and all major volume channels are officially bursting into these three absolute market leaders! 🐋📈
⚡ The High-Yield Assets Dominating the Grid Profiles:
Synapse : Crushing the order book depth with massive, continuous buying pressure! SYN is turning its key daily resistance lines into a solid operational launchpad, driving explosive short liquidations on lower timeframes. 🌐🔥
Act I : The AI Prophecy Rocketing heavily with intense structural :momentum! Powered by strong AI narrative accumulation and massive retail inflows, ACT is absorbing every single micro-dip instantly. 🤖📈
Cap : Igniting a beautiful vertical trend expansion! Volume profiles are spiking as institutional market makers thin out the ask-depth, pushing CAP completely into a clear bullish expansion zone. 💎🚀
💡 Immediate Tactical Execution Guide: During aggressive velocity breakout waves, waiting on the sidelines means missing the core operational trend. Look at the immediate horizontal support consolidation nodes on the 15-minute charts. If these assets hold their structural higher-low foundations during minor retracements, the immediate upside targets remain highly attractive for active spot and leverage accounts! 🛡️
The absolute strongest trends of the afternoon session are concentrated right here. Manage your risk, keep your isolated balances disciplined, and capture the profit velocity into strength! 🌊
👇 CLICK THE OFFICIAL PRICE WIDGETS BELOW TO LOAD YOUR ORDERS AND TRADE THE BREAKOUT IMMEDIATELY! 👇
#Synapse #ActITheAIProphecy #CapToken #TopGainers $BNB
🚀 HIGH-VELOCITY BREAKOUT: $SYN , $ACT , and $CAP Printing Explosive Green Structural Extensions Tonight! 📊💥
Good afternoon, Square family! If you are analyzing the live liquidity rotation across active order books right now, you can instantly see where the smart money is aggressively scaling. The broader market ranges are tightening, and all major volume channels are officially bursting into these three absolute market leaders! 🐋📈
⚡ The High-Yield Assets Dominating the Grid Profiles:
Synapse : Crushing the order book depth with massive, continuous buying pressure! SYN is turning its key daily resistance lines into a solid operational launchpad, driving explosive short liquidations on lower timeframes. 🌐🔥
Act I : The AI Prophecy Rocketing heavily with intense structural :momentum! Powered by strong AI narrative accumulation and massive retail inflows, ACT is absorbing every single micro-dip instantly. 🤖📈
Cap : Igniting a beautiful vertical trend expansion! Volume profiles are spiking as institutional market makers thin out the ask-depth, pushing CAP completely into a clear bullish expansion zone. 💎🚀
💡 Immediate Tactical Execution Guide: During aggressive velocity breakout waves, waiting on the sidelines means missing the core operational trend. Look at the immediate horizontal support consolidation nodes on the 15-minute charts. If these assets hold their structural higher-low foundations during minor retracements, the immediate upside targets remain highly attractive for active spot and leverage accounts! 🛡️
The absolute strongest trends of the afternoon session are concentrated right here. Manage your risk, keep your isolated balances disciplined, and capture the profit velocity into strength! 🌊
👇 CLICK THE OFFICIAL PRICE WIDGETS BELOW TO LOAD YOUR ORDERS AND TRADE THE BREAKOUT IMMEDIATELY! 👇
#Synapse #ActITheAIProphecy #CapToken #TopGainers $BNB
Good afternoon, Square family! If you are analyzing the live liquidity rotation across active order books right now, you can instantly see where the smart money is aggressively scaling. The broader market ranges are tightening, and all major volume channels are officially bursting into these three absolute market leaders! 🐋📈
⚡ The High-Yield Assets Dominating the Grid Profiles:
Synapse : Crushing the order book depth with massive, continuous buying pressure! SYN is turning its key daily resistance lines into a solid operational launchpad, driving explosive short liquidations on lower timeframes. 🌐🔥
Act I : The AI Prophecy Rocketing heavily with intense structural :momentum! Powered by strong AI narrative accumulation and massive retail inflows, ACT is absorbing every single micro-dip instantly. 🤖📈
Cap : Igniting a beautiful vertical trend expansion! Volume profiles are spiking as institutional market makers thin out the ask-depth, pushing CAP completely into a clear bullish expansion zone. 💎🚀
💡 Immediate Tactical Execution Guide: During aggressive velocity breakout waves, waiting on the sidelines means missing the core operational trend. Look at the immediate horizontal support consolidation nodes on the 15-minute charts. If these assets hold their structural higher-low foundations during minor retracements, the immediate upside targets remain highly attractive for active spot and leverage accounts! 🛡️
The absolute strongest trends of the afternoon session are concentrated right here. Manage your risk, keep your isolated balances disciplined, and capture the profit velocity into strength! 🌊
👇 CLICK THE OFFICIAL PRICE WIDGETS BELOW TO LOAD YOUR ORDERS AND TRADE THE BREAKOUT IMMEDIATELY! 👇
#Synapse #ActITheAIProphecy #CapToken #TopGainers $BNB
1
648
$CAP is very popular for a reason – innovative Covered Agents Protocol for USD yield & financial guarantees. Backed by top VCs. In a sideways broader market, this gem is moving. DYOR & join the wave! 💎 #CAPToken
$CAP is very popular for a reason – innovative Covered Agents Protocol for USD yield & financial guarantees. Backed by top VCs. In a sideways broader market, this gem is moving. DYOR & join the wave! 💎 #CAPToken
305

$AKE
{future}(AKEUSDT)
+20.25%, $CAP +14.81% — small caps posting the loudest green today while $BTC
{spot}(BTCUSDT)
$ETH
{spot}(ETHUSDT)
stay muted.
#AKE #CapToken #Bitcoin #Ethereum #BinanceSquare
$AKE
+20.25%, $CAP +14.81% — small caps posting the loudest green today while $BTC
$ETH
stay muted.
#AKE #CapToken #Bitcoin #Ethereum #BinanceSquare
+20.25%, $CAP +14.81% — small caps posting the loudest green today while $BTC
$ETH
stay muted.
#AKE #CapToken #Bitcoin #Ethereum #BinanceSquare
2
346
$CAP
{future}(CAPUSDT)
surging 14.81% today. $BTC
{spot}(BTCUSDT)
struggling under resistance. $ETH
{spot}(ETHUSDT)
range-bound — small caps carrying today's momentum.
#CapToken #Bitcoin #Ethereum #CryptoMomentum #BinanceSquare
$CAP
surging 14.81% today. $BTC
struggling under resistance. $ETH
range-bound — small caps carrying today's momentum.
#CapToken #Bitcoin #Ethereum #CryptoMomentum #BinanceSquare
surging 14.81% today. $BTC
struggling under resistance. $ETH
range-bound — small caps carrying today's momentum.
#CapToken #Bitcoin #Ethereum #CryptoMomentum #BinanceSquare
1
107
CAP Rockets 27% as a Single Breakout Candle Clears Every Moving Average
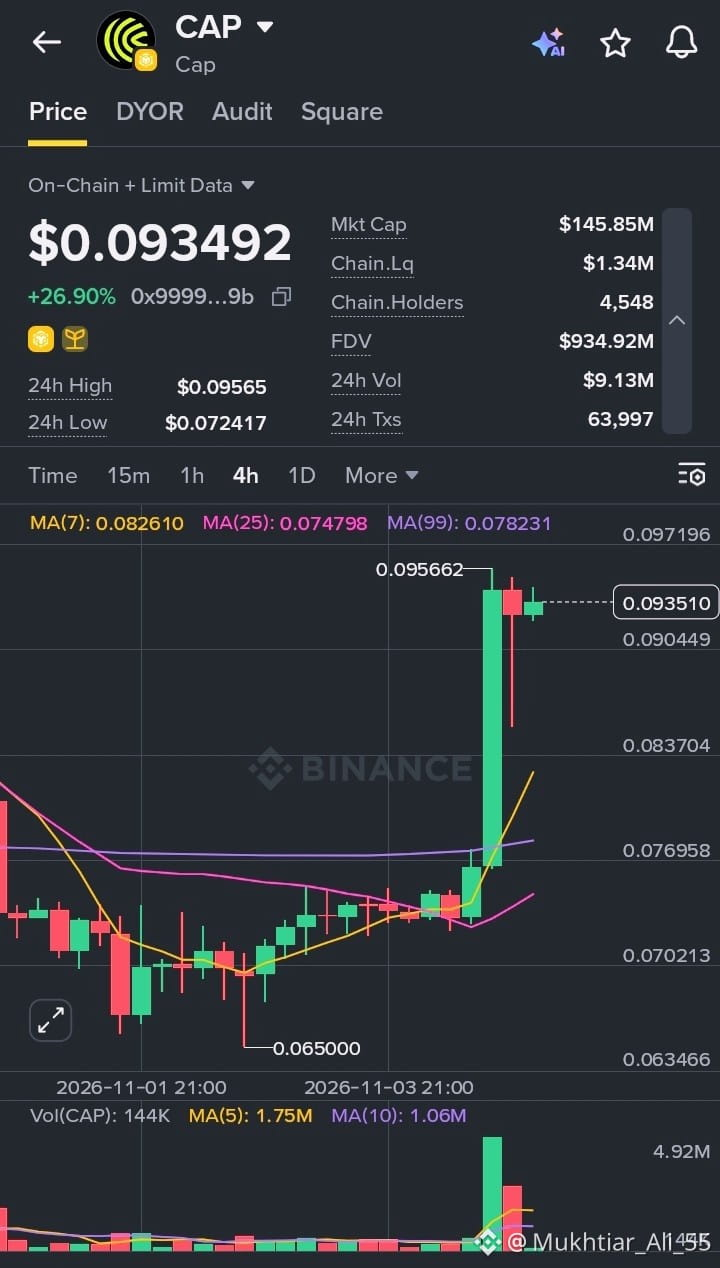
Cap has just delivered one of the sharper moves on the board, and the 4H chart shows a clean breakout after several days of quiet, range-bound trading.
After bottoming near $0.065 earlier in the week, CAP spent sessions grinding sideways and building a base. Then one massive green candle changed the picture. It’s now trading at $0.093492, up 26.90% on the day, with a 24h high of $0.09565 and a low of $0.072417. Market cap sits at $145.85M, with $9.13M in 24h volume and 4,548 on-chain holders.
What stands out:
A decisive breakout candle. One large 4H move carried price from the $0.077 area to above $0.09, slicing through resistance in a single push.
Price is above all three moving averages. CAP is well above the MA(7) at $0.082610, the MA(99) at $0.078231 and the MA(25) at $0.074798. The MA(7) has turned sharply upward, which confirms the shift in short-term momentum.
Volume exploded on the breakout. The green candle printed the heaviest volume on the chart by far, which points to genuine buying pressure rather than a thin spike.
The next candle showed some profit-taking. A red candle with a long lower wick followed, but buyers stepped in quickly and price recovered, a sign dips are being absorbed for now.
A few things to keep in mind. After a move this fast, price is stretched far from its averages, so a pullback toward the $0.083 to $0.090 zone would be healthy and wouldn’t change the bigger picture. FDV of $934.92M against a market cap of $145.85M also means a lot of supply is still to come, and on-chain liquidity of $1.34M is thin, so volatility can cut both ways.
I’m watching whether CAP can hold above $0.090 and break the $0.09566 high on steady volume. If it does, momentum stays with the bulls. If it slips back under the MA(99) near $0.078, the breakout loses its footing.
#CAP #CapToken #CryptoMarket #TechnicalAnalysis #PriceAction
$CAP
{future}(CAPUSDT)
CAP Rockets 27% as a Single Breakout Candle Clears Every Moving Average
Cap has just delivered one of the sharper moves on the board, and the 4H chart shows a clean breakout after several days of quiet, range-bound trading.
After bottoming near $0.065 earlier in the week, CAP spent sessions grinding sideways and building a base. Then one massive green candle changed the picture. It’s now trading at $0.093492, up 26.90% on the day, with a 24h high of $0.09565 and a low of $0.072417. Market cap sits at $145.85M, with $9.13M in 24h volume and 4,548 on-chain holders.
What stands out:
A decisive breakout candle. One large 4H move carried price from the $0.077 area to above $0.09, slicing through resistance in a single push.
Price is above all three moving averages. CAP is well above the MA(7) at $0.082610, the MA(99) at $0.078231 and the MA(25) at $0.074798. The MA(7) has turned sharply upward, which confirms the shift in short-term momentum.
Volume exploded on the breakout. The green candle printed the heaviest volume on the chart by far, which points to genuine buying pressure rather than a thin spike.
The next candle showed some profit-taking. A red candle with a long lower wick followed, but buyers stepped in quickly and price recovered, a sign dips are being absorbed for now.
A few things to keep in mind. After a move this fast, price is stretched far from its averages, so a pullback toward the $0.083 to $0.090 zone would be healthy and wouldn’t change the bigger picture. FDV of $934.92M against a market cap of $145.85M also means a lot of supply is still to come, and on-chain liquidity of $1.34M is thin, so volatility can cut both ways.
I’m watching whether CAP can hold above $0.090 and break the $0.09566 high on steady volume. If it does, momentum stays with the bulls. If it slips back under the MA(99) near $0.078, the breakout loses its footing.
#CAP #CapToken #CryptoMarket #TechnicalAnalysis #PriceAction
$CAP
Cap has just delivered one of the sharper moves on the board, and the 4H chart shows a clean breakout after several days of quiet, range-bound trading.
After bottoming near $0.065 earlier in the week, CAP spent sessions grinding sideways and building a base. Then one massive green candle changed the picture. It’s now trading at $0.093492, up 26.90% on the day, with a 24h high of $0.09565 and a low of $0.072417. Market cap sits at $145.85M, with $9.13M in 24h volume and 4,548 on-chain holders.
What stands out:
A decisive breakout candle. One large 4H move carried price from the $0.077 area to above $0.09, slicing through resistance in a single push.
Price is above all three moving averages. CAP is well above the MA(7) at $0.082610, the MA(99) at $0.078231 and the MA(25) at $0.074798. The MA(7) has turned sharply upward, which confirms the shift in short-term momentum.
Volume exploded on the breakout. The green candle printed the heaviest volume on the chart by far, which points to genuine buying pressure rather than a thin spike.
The next candle showed some profit-taking. A red candle with a long lower wick followed, but buyers stepped in quickly and price recovered, a sign dips are being absorbed for now.
A few things to keep in mind. After a move this fast, price is stretched far from its averages, so a pullback toward the $0.083 to $0.090 zone would be healthy and wouldn’t change the bigger picture. FDV of $934.92M against a market cap of $145.85M also means a lot of supply is still to come, and on-chain liquidity of $1.34M is thin, so volatility can cut both ways.
I’m watching whether CAP can hold above $0.090 and break the $0.09566 high on steady volume. If it does, momentum stays with the bulls. If it slips back under the MA(99) near $0.078, the breakout loses its footing.
#CAP #CapToken #CryptoMarket #TechnicalAnalysis #PriceAction
$CAP
7

·
--
CAP: The DeFi Credit Revolution Worth Watching!The next interesting opportunity in DeFi may come from a project focused on something bigger than ordinary crypto trading: decentralized credit and financial guarantees.
Meet CAP $CAP — a project aiming to connect traditional credit markets with blockchain technology.
💡 What Makes CAP Interesting?
CAP is building a decentralized credit platform where three major participants work together:
Depositors: Provide digital dollars and earn yield.Borrowers: Access credit through the platform.Underwriters: Provide financial guarantees to help protect depositors against borrower defaults.
This model aims to bring more transparency and efficiency to institutional lending through blockchain technology.
🔥 Why Should Crypto Investors Watch CAP?
Real-world utility: CAP focuses on lending and credit rather than relying entirely on speculation.DeFi innovation: Its financial guarantee model introduces an interesting approach to managing credit risk.Token utility: CAP supports governance and participation in the ecosystem.Growing ecosystem: Its development in decentralized credit makes it an interesting project to follow.
📊 Tokenomics to Watch
Maximum supply: 10 billion CAPInitial circulating supply: Approximately 1.56 billion CAPBlockchain: EthereumSector: DeFi / Lending
Source: CoinMarketCap and CAP's official website.
📈 My Outlook
$CAP is an interesting project to keep on the radar. Its long-term potential will depend on adoption, lending activity, sustainable revenue, liquidity, and token demand.
However, investors should also monitor token unlocks, market volatility, and liquidity before making any decisions.
The big question is: Can decentralized credit become one of the next major narratives in DeFi?
I'm keeping $CAP on my watchlist. What do you think about this project? 👇
#CAP #CapToken #DeFi #Binance #CryptoResearch
{future}(CAPUSDT)
CAP: The DeFi Credit Revolution Worth Watching!
The next interesting opportunity in DeFi may come from a project focused on something bigger than ordinary crypto trading: decentralized credit and financial guarantees.
Meet CAP $CAP — a project aiming to connect traditional credit markets with blockchain technology.
💡 What Makes CAP Interesting?
CAP is building a decentralized credit platform where three major participants work together:
Depositors: Provide digital dollars and earn yield.Borrowers: Access credit through the platform.Underwriters: Provide financial guarantees to help protect depositors against borrower defaults.
This model aims to bring more transparency and efficiency to institutional lending through blockchain technology.
🔥 Why Should Crypto Investors Watch CAP?
Real-world utility: CAP focuses on lending and credit rather than relying entirely on speculation.DeFi innovation: Its financial guarantee model introduces an interesting approach to managing credit risk.Token utility: CAP supports governance and participation in the ecosystem.Growing ecosystem: Its development in decentralized credit makes it an interesting project to follow.
📊 Tokenomics to Watch
Maximum supply: 10 billion CAPInitial circulating supply: Approximately 1.56 billion CAPBlockchain: EthereumSector: DeFi / Lending
Source: CoinMarketCap and CAP's official website.
📈 My Outlook
$CAP is an interesting project to keep on the radar. Its long-term potential will depend on adoption, lending activity, sustainable revenue, liquidity, and token demand.
However, investors should also monitor token unlocks, market volatility, and liquidity before making any decisions.
The big question is: Can decentralized credit become one of the next major narratives in DeFi?
I'm keeping $CAP on my watchlist. What do you think about this project? 👇
#CAP #CapToken #DeFi #Binance #CryptoResearch
Meet CAP $CAP — a project aiming to connect traditional credit markets with blockchain technology.
💡 What Makes CAP Interesting?
CAP is building a decentralized credit platform where three major participants work together:
Depositors: Provide digital dollars and earn yield.Borrowers: Access credit through the platform.Underwriters: Provide financial guarantees to help protect depositors against borrower defaults.
This model aims to bring more transparency and efficiency to institutional lending through blockchain technology.
🔥 Why Should Crypto Investors Watch CAP?
Real-world utility: CAP focuses on lending and credit rather than relying entirely on speculation.DeFi innovation: Its financial guarantee model introduces an interesting approach to managing credit risk.Token utility: CAP supports governance and participation in the ecosystem.Growing ecosystem: Its development in decentralized credit makes it an interesting project to follow.
📊 Tokenomics to Watch
Maximum supply: 10 billion CAPInitial circulating supply: Approximately 1.56 billion CAPBlockchain: EthereumSector: DeFi / Lending
Source: CoinMarketCap and CAP's official website.
📈 My Outlook
$CAP is an interesting project to keep on the radar. Its long-term potential will depend on adoption, lending activity, sustainable revenue, liquidity, and token demand.
However, investors should also monitor token unlocks, market volatility, and liquidity before making any decisions.
The big question is: Can decentralized credit become one of the next major narratives in DeFi?
I'm keeping $CAP on my watchlist. What do you think about this project? 👇
#CAP #CapToken #DeFi #Binance #CryptoResearch
1
102
CAP Climbs 10% as Price Reclaims Key Moving Averages
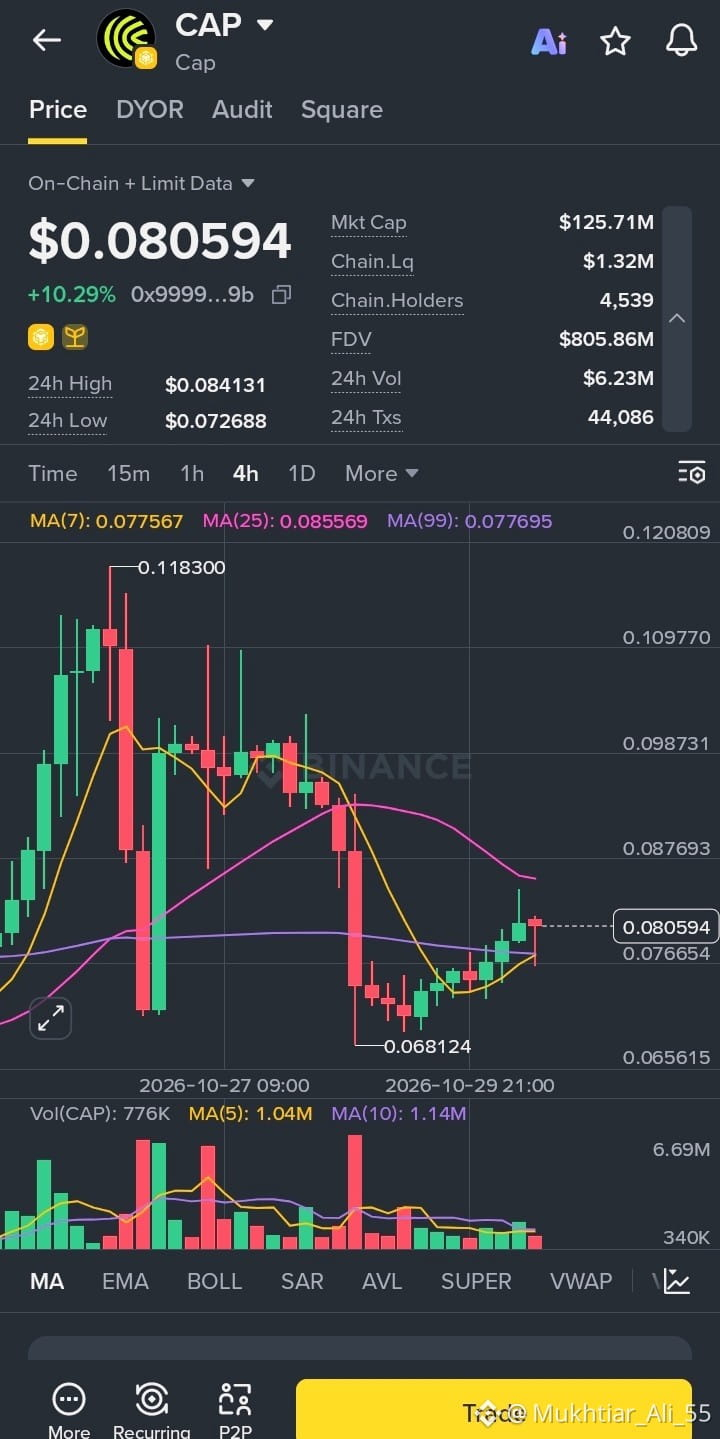
CAP is bouncing back today, trading at 0.080594 (+10.29%) after finding support at a 24h low of 0.072688 and reaching a high of 0.084131.
Here’s a quick look at the numbers:
📊 Market Cap: 125.71M
💧 24h Volume: 6.23M
👥 Holders: 4,539 on-chain
🔥 24h Transactions: 44,086
🏷️ FDV: 805.86M
On the 4H chart, price has pushed back above the MA(7) at 0.077567 and the MA(99) at 0.077695, which is an encouraging sign after the pullback from the 0.1183 peak and the dip to 0.068124. The higher lows forming on the recent candles suggest buyers are slowly regaining control.
The next hurdle is the MA(25) at 0.085569, which sits just above the 24h high of 0.084131. A clean break and hold above that area could open the door to a stronger recovery. If the bounce fades, the 0.0777 zone, where the MA(7) and MA(99) overlap, is the first support to watch, followed by the recent low near 0.0727.
Volume has been declining compared to the earlier spikes, so a pickup in buying activity would help confirm the move. Liquidity is also thin at around 1.32M, so price can swing sharply in either direction.
For now, I’m watching whether CAP can hold above 0.0777 and make a push toward 0.0855.
#CAP #CapToken #CryptoTrading #BinanceAlpha #AltcoinWatch
$CAP
{future}(CAPUSDT)
CAP Climbs 10% as Price Reclaims Key Moving Averages
CAP is bouncing back today, trading at 0.080594 (+10.29%) after finding support at a 24h low of 0.072688 and reaching a high of 0.084131.
Here’s a quick look at the numbers:
📊 Market Cap: 125.71M
💧 24h Volume: 6.23M
👥 Holders: 4,539 on-chain
🔥 24h Transactions: 44,086
🏷️ FDV: 805.86M
On the 4H chart, price has pushed back above the MA(7) at 0.077567 and the MA(99) at 0.077695, which is an encouraging sign after the pullback from the 0.1183 peak and the dip to 0.068124. The higher lows forming on the recent candles suggest buyers are slowly regaining control.
The next hurdle is the MA(25) at 0.085569, which sits just above the 24h high of 0.084131. A clean break and hold above that area could open the door to a stronger recovery. If the bounce fades, the 0.0777 zone, where the MA(7) and MA(99) overlap, is the first support to watch, followed by the recent low near 0.0727.
Volume has been declining compared to the earlier spikes, so a pickup in buying activity would help confirm the move. Liquidity is also thin at around 1.32M, so price can swing sharply in either direction.
For now, I’m watching whether CAP can hold above 0.0777 and make a push toward 0.0855.
#CAP #CapToken #CryptoTrading #BinanceAlpha #AltcoinWatch
$CAP
CAP is bouncing back today, trading at 0.080594 (+10.29%) after finding support at a 24h low of 0.072688 and reaching a high of 0.084131.
Here’s a quick look at the numbers:
📊 Market Cap: 125.71M
💧 24h Volume: 6.23M
👥 Holders: 4,539 on-chain
🔥 24h Transactions: 44,086
🏷️ FDV: 805.86M
On the 4H chart, price has pushed back above the MA(7) at 0.077567 and the MA(99) at 0.077695, which is an encouraging sign after the pullback from the 0.1183 peak and the dip to 0.068124. The higher lows forming on the recent candles suggest buyers are slowly regaining control.
The next hurdle is the MA(25) at 0.085569, which sits just above the 24h high of 0.084131. A clean break and hold above that area could open the door to a stronger recovery. If the bounce fades, the 0.0777 zone, where the MA(7) and MA(99) overlap, is the first support to watch, followed by the recent low near 0.0727.
Volume has been declining compared to the earlier spikes, so a pickup in buying activity would help confirm the move. Liquidity is also thin at around 1.32M, so price can swing sharply in either direction.
For now, I’m watching whether CAP can hold above 0.0777 and make a push toward 0.0855.
#CAP #CapToken #CryptoTrading #BinanceAlpha #AltcoinWatch
$CAP
9
🚀 CAP (Cap) Market Update: Steady Momentum & Key On-Chain Metrics
CAP is showing solid short-term strength, currently trading at $0.070352 (+4.09%) after rebounding smoothly off recent lows. The 4-hour chart reflects a steady recovery, with price action pushing above short-term moving averages like MA(7) at $0.069054 and MA(25) at $0.068388, signaling potential continuation toward resistance levels near $0.077+.
Key On-Chain & Market Highlights:
Current Price: $0.070352 (+4.09%)
Market Cap: $109.74M
Fully Diluted Valuation (FDV): $703.46M
24-Hour Trading Volume: $1.48M (12,862 transactions)
24h Range: $0.066775 (Low) – $0.072982 (High)
On-Chain Liquidity: $1.26M
Total Holders: 4,394
With consistent on-chain transaction volume and holding metrics holding firm, CAP remains an interesting setup to watch as price action tests higher moving average targets.
Always conduct your own research (DYOR) and manage risk appropriately before entering any trade!
#CryptoAnalysis #CAPToken #CryptoTrading #Altcoins #TechnicalAnalysis
$CAP
{future}(CAPUSDT)
🚀 CAP (Cap) Market Update: Steady Momentum & Key On-Chain Metrics
CAP is showing solid short-term strength, currently trading at $0.070352 (+4.09%) after rebounding smoothly off recent lows. The 4-hour chart reflects a steady recovery, with price action pushing above short-term moving averages like MA(7) at $0.069054 and MA(25) at $0.068388, signaling potential continuation toward resistance levels near $0.077+.
Key On-Chain & Market Highlights:
Current Price: $0.070352 (+4.09%)
Market Cap: $109.74M
Fully Diluted Valuation (FDV): $703.46M
24-Hour Trading Volume: $1.48M (12,862 transactions)
24h Range: $0.066775 (Low) – $0.072982 (High)
On-Chain Liquidity: $1.26M
Total Holders: 4,394
With consistent on-chain transaction volume and holding metrics holding firm, CAP remains an interesting setup to watch as price action tests higher moving average targets.
Always conduct your own research (DYOR) and manage risk appropriately before entering any trade!
#CryptoAnalysis #CAPToken #CryptoTrading #Altcoins #TechnicalAnalysis
$CAP
CAP is showing solid short-term strength, currently trading at $0.070352 (+4.09%) after rebounding smoothly off recent lows. The 4-hour chart reflects a steady recovery, with price action pushing above short-term moving averages like MA(7) at $0.069054 and MA(25) at $0.068388, signaling potential continuation toward resistance levels near $0.077+.
Key On-Chain & Market Highlights:
Current Price: $0.070352 (+4.09%)
Market Cap: $109.74M
Fully Diluted Valuation (FDV): $703.46M
24-Hour Trading Volume: $1.48M (12,862 transactions)
24h Range: $0.066775 (Low) – $0.072982 (High)
On-Chain Liquidity: $1.26M
Total Holders: 4,394
With consistent on-chain transaction volume and holding metrics holding firm, CAP remains an interesting setup to watch as price action tests higher moving average targets.
Always conduct your own research (DYOR) and manage risk appropriately before entering any trade!
#CryptoAnalysis #CAPToken #CryptoTrading #Altcoins #TechnicalAnalysis
$CAP
16
·
--
Bearish
🚨 MIDNIGHT LIQUIDATION SHOCKWAVE: $SYN Plummets -25.50% as Sellers Aggressively Target $CAP and $ACT Supports! 📉⚠️
Good evening, Square family! If you are actively monitoring your leverage accounts or checking your spot asset health before turning in tonight, the market has just triggered a massive liquidity flush. High-yield leaders from earlier sessions are now facing aggressive institutional distribution! 🐋📉
⚡ Monitoring the High-Velocity Midnight Decliners:
Synapse : An absolute textbook dump! After holding green for so long, SYN has faced a brutal structural collapse, plunging -25.50% as heavy profit-taking cascades into forced leverage liquidations. 📉💥
Cap : Losing its previous horizontal consolidation floor! CAP is down -9.00% as automated market makers pull bid depth from the books, switching the immediate trend into a clear distribution phase. 💎🛑
Act I: The AI Prophecy : Continuing its systemic weakness at -8.20%. Retail interest remains completely dried up, leaving short-sellers in absolute control of the immediate lower-timeframe clusters. 🤖🔍
💡 Capital Preservation Blueprint for the Night: Never try to catch a falling knife during a high-traffic midnight liquidation wave! When volatility spikes this aggressively, standard support nodes easily fracture. Keep your stop-losses tight, preserve your cash reserves, and wait for a clear volume-exhaustion tail on the 1-hour charts before anticipating any relief bounces. Stay disciplined! 🛡️
👇 CLICK THE LIVE OFFICIAL PRICE WIDGETS BELOW TO MONITOR REAL-TIME DEPTH AND MANAGE YOUR RISK IMMEDIATELY! 👇
#Synapse #CapToken #ActITheAIProphecy #CryptoBearout #TopLosers $BNB
🚨 MIDNIGHT LIQUIDATION SHOCKWAVE: $SYN Plummets -25.50% as Sellers Aggressively Target $CAP and $ACT Supports! 📉⚠️
Good evening, Square family! If you are actively monitoring your leverage accounts or checking your spot asset health before turning in tonight, the market has just triggered a massive liquidity flush. High-yield leaders from earlier sessions are now facing aggressive institutional distribution! 🐋📉
⚡ Monitoring the High-Velocity Midnight Decliners:
Synapse : An absolute textbook dump! After holding green for so long, SYN has faced a brutal structural collapse, plunging -25.50% as heavy profit-taking cascades into forced leverage liquidations. 📉💥
Cap : Losing its previous horizontal consolidation floor! CAP is down -9.00% as automated market makers pull bid depth from the books, switching the immediate trend into a clear distribution phase. 💎🛑
Act I: The AI Prophecy : Continuing its systemic weakness at -8.20%. Retail interest remains completely dried up, leaving short-sellers in absolute control of the immediate lower-timeframe clusters. 🤖🔍
💡 Capital Preservation Blueprint for the Night: Never try to catch a falling knife during a high-traffic midnight liquidation wave! When volatility spikes this aggressively, standard support nodes easily fracture. Keep your stop-losses tight, preserve your cash reserves, and wait for a clear volume-exhaustion tail on the 1-hour charts before anticipating any relief bounces. Stay disciplined! 🛡️
👇 CLICK THE LIVE OFFICIAL PRICE WIDGETS BELOW TO MONITOR REAL-TIME DEPTH AND MANAGE YOUR RISK IMMEDIATELY! 👇
#Synapse #CapToken #ActITheAIProphecy #CryptoBearout #TopLosers $BNB
Good evening, Square family! If you are actively monitoring your leverage accounts or checking your spot asset health before turning in tonight, the market has just triggered a massive liquidity flush. High-yield leaders from earlier sessions are now facing aggressive institutional distribution! 🐋📉
⚡ Monitoring the High-Velocity Midnight Decliners:
Synapse : An absolute textbook dump! After holding green for so long, SYN has faced a brutal structural collapse, plunging -25.50% as heavy profit-taking cascades into forced leverage liquidations. 📉💥
Cap : Losing its previous horizontal consolidation floor! CAP is down -9.00% as automated market makers pull bid depth from the books, switching the immediate trend into a clear distribution phase. 💎🛑
Act I: The AI Prophecy : Continuing its systemic weakness at -8.20%. Retail interest remains completely dried up, leaving short-sellers in absolute control of the immediate lower-timeframe clusters. 🤖🔍
💡 Capital Preservation Blueprint for the Night: Never try to catch a falling knife during a high-traffic midnight liquidation wave! When volatility spikes this aggressively, standard support nodes easily fracture. Keep your stop-losses tight, preserve your cash reserves, and wait for a clear volume-exhaustion tail on the 1-hour charts before anticipating any relief bounces. Stay disciplined! 🛡️
👇 CLICK THE LIVE OFFICIAL PRICE WIDGETS BELOW TO MONITOR REAL-TIME DEPTH AND MANAGE YOUR RISK IMMEDIATELY! 👇
#Synapse #CapToken #ActITheAIProphecy #CryptoBearout #TopLosers $BNB
1
767

·
--
🚀 **$CAP (Cap) Charging Up! Reversal in Play?** 📈
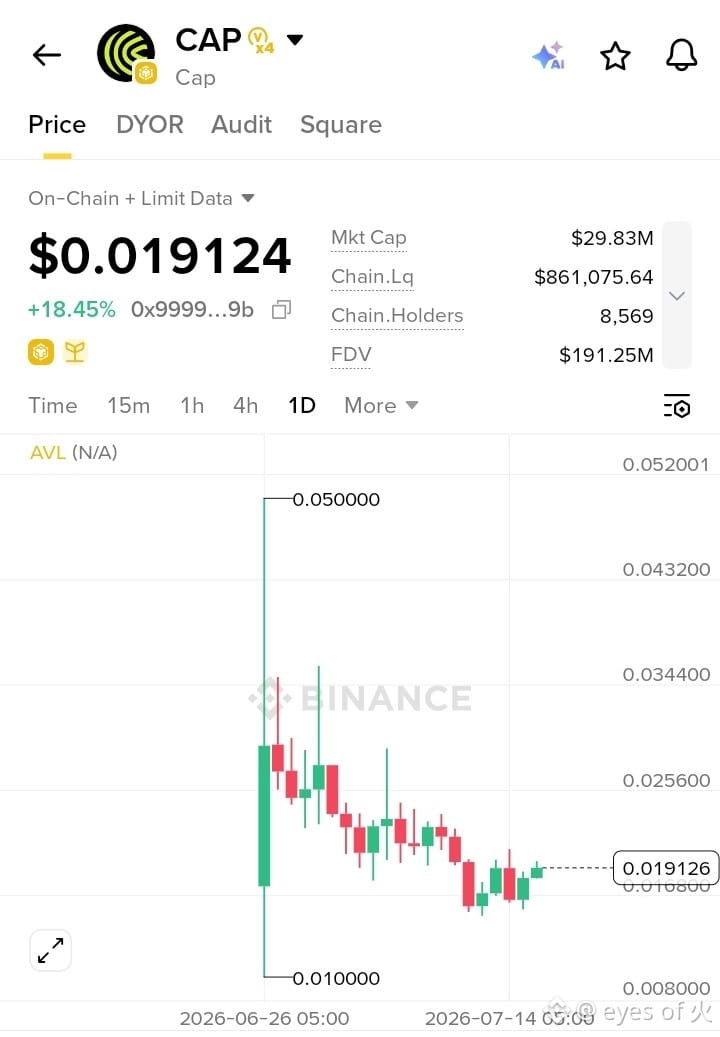
Cap ($CAP) is flashing strong bullish momentum today, currently trading at **$0.019124** with an impressive spike of **+18.45%**! The daily chart shows a neat double-bottom style recovery starting right after finding solid footing near its local low. 📉✨
📊 **Key On-Chain Metrics:**
* 💎 **Mkt Cap:** $29.83M
* 👥 **Holders:** 8,569
* 💦 **Liquidity:** $861,075.64
* ⚡ **FDV:** $191.25M
With significant buying volume stepping in today to break the localized downtrend, bulls are pushing to secure this support floor. If this upward momentum continues, we could see a quick run to test the next overhead resistance zone around $0.025. 🎯
Keep this high-momentum chart close on your watchlists! Always manage your risk and #DYOR! 🧠👇
#CapToken #CAP #CryptoTrading #Altcoins #BinanceSquare
🚀 **$CAP (Cap) Charging Up! Reversal in Play?** 📈
Cap ($CAP ) is flashing strong bullish momentum today, currently trading at **$0.019124** with an impressive spike of **+18.45%**! The daily chart shows a neat double-bottom style recovery starting right after finding solid footing near its local low. 📉✨
📊 **Key On-Chain Metrics:**
* 💎 **Mkt Cap:** $29.83M
* 👥 **Holders:** 8,569
* 💦 **Liquidity:** $861,075.64
* ⚡ **FDV:** $191.25M
With significant buying volume stepping in today to break the localized downtrend, bulls are pushing to secure this support floor. If this upward momentum continues, we could see a quick run to test the next overhead resistance zone around $0.025. 🎯
Keep this high-momentum chart close on your watchlists! Always manage your risk and #DYOR! 🧠👇
#CapToken #CAP #CryptoTrading #Altcoins #BinanceSquare
Cap ($CAP ) is flashing strong bullish momentum today, currently trading at **$0.019124** with an impressive spike of **+18.45%**! The daily chart shows a neat double-bottom style recovery starting right after finding solid footing near its local low. 📉✨
📊 **Key On-Chain Metrics:**
* 💎 **Mkt Cap:** $29.83M
* 👥 **Holders:** 8,569
* 💦 **Liquidity:** $861,075.64
* ⚡ **FDV:** $191.25M
With significant buying volume stepping in today to break the localized downtrend, bulls are pushing to secure this support floor. If this upward momentum continues, we could see a quick run to test the next overhead resistance zone around $0.025. 🎯
Keep this high-momentum chart close on your watchlists! Always manage your risk and #DYOR! 🧠👇
#CapToken #CAP #CryptoTrading #Altcoins #BinanceSquare
2
158
·
--
Bullish
🚀 HIGH-VELOCITY EXPLOSION: $SYN Printing Massive Candles While $M and $CAP Fuel Strong Bullish Continuations! 📊💥
Good afternoon, Square family! If you are scanning the live order books right now, the afternoon momentum has officially exploded into absolute overdrive. With intense European volume flooding the market, capital is rotating aggressively into top-tier volatility leaders, shattering crucial macro resistance ceilings! 🐋📈
⚡ The High-Yield Assets Dominating the Grid Profiles Right Now:
Synapse : A total market monster! SYN is leading the entire dashboard with a huge, vertical breakout, destroying heavy short liquidations on lower timeframes. Institutional buy walls are scaling up rapidly with massive continuous volume! 🌐🔥
MELD : Printing a beautiful, highly reliable medium-to-strong pump! M has successfully established a solid horizontal support foundation, absorbing minor retail dips instantly as buying pressure intensifies. 📈🚀
Cap : Igniting an impressive upward expansion! CAP is steadily thinning out the ask-depth, turning previous resistance blocks into a highly operational launchpad for the afternoon session. 💎📊
💡 Immediate Tactical Execution Guide: During aggressive velocity breakout waves, waiting on the sidelines means missing the core operational trend. Look at the immediate horizontal support consolidation nodes on the 15-minute charts. If these assets hold their structural higher-low foundations during minor retracements, the immediate upside targets remain highly attractive for active accounts! 🛡️
The strongest trends of this high-traffic session are concentrated right here. Manage your risk, keep your balances disciplined, and capture the profit velocity into strength! 🌊
👇 CLICK THE OFFICIAL PRICE WIDGETS BELOW TO LOAD YOUR ORDERS AND TRADE THIS EXPLOSIVE PUMP IMMEDIATELY! 👇
#Synapse #Meld #CapToken #CryptoBreakout #TopGainers $BNB
🚀 HIGH-VELOCITY EXPLOSION: $SYN Printing Massive Candles While $M and $CAP Fuel Strong Bullish Continuations! 📊💥
Good afternoon, Square family! If you are scanning the live order books right now, the afternoon momentum has officially exploded into absolute overdrive. With intense European volume flooding the market, capital is rotating aggressively into top-tier volatility leaders, shattering crucial macro resistance ceilings! 🐋📈
⚡ The High-Yield Assets Dominating the Grid Profiles Right Now:
Synapse : A total market monster! SYN is leading the entire dashboard with a huge, vertical breakout, destroying heavy short liquidations on lower timeframes. Institutional buy walls are scaling up rapidly with massive continuous volume! 🌐🔥
MELD : Printing a beautiful, highly reliable medium-to-strong pump! M has successfully established a solid horizontal support foundation, absorbing minor retail dips instantly as buying pressure intensifies. 📈🚀
Cap : Igniting an impressive upward expansion! CAP is steadily thinning out the ask-depth, turning previous resistance blocks into a highly operational launchpad for the afternoon session. 💎📊
💡 Immediate Tactical Execution Guide: During aggressive velocity breakout waves, waiting on the sidelines means missing the core operational trend. Look at the immediate horizontal support consolidation nodes on the 15-minute charts. If these assets hold their structural higher-low foundations during minor retracements, the immediate upside targets remain highly attractive for active accounts! 🛡️
The strongest trends of this high-traffic session are concentrated right here. Manage your risk, keep your balances disciplined, and capture the profit velocity into strength! 🌊
👇 CLICK THE OFFICIAL PRICE WIDGETS BELOW TO LOAD YOUR ORDERS AND TRADE THIS EXPLOSIVE PUMP IMMEDIATELY! 👇
#Synapse #Meld #CapToken #CryptoBreakout #TopGainers $BNB
Good afternoon, Square family! If you are scanning the live order books right now, the afternoon momentum has officially exploded into absolute overdrive. With intense European volume flooding the market, capital is rotating aggressively into top-tier volatility leaders, shattering crucial macro resistance ceilings! 🐋📈
⚡ The High-Yield Assets Dominating the Grid Profiles Right Now:
Synapse : A total market monster! SYN is leading the entire dashboard with a huge, vertical breakout, destroying heavy short liquidations on lower timeframes. Institutional buy walls are scaling up rapidly with massive continuous volume! 🌐🔥
MELD : Printing a beautiful, highly reliable medium-to-strong pump! M has successfully established a solid horizontal support foundation, absorbing minor retail dips instantly as buying pressure intensifies. 📈🚀
Cap : Igniting an impressive upward expansion! CAP is steadily thinning out the ask-depth, turning previous resistance blocks into a highly operational launchpad for the afternoon session. 💎📊
💡 Immediate Tactical Execution Guide: During aggressive velocity breakout waves, waiting on the sidelines means missing the core operational trend. Look at the immediate horizontal support consolidation nodes on the 15-minute charts. If these assets hold their structural higher-low foundations during minor retracements, the immediate upside targets remain highly attractive for active accounts! 🛡️
The strongest trends of this high-traffic session are concentrated right here. Manage your risk, keep your balances disciplined, and capture the profit velocity into strength! 🌊
👇 CLICK THE OFFICIAL PRICE WIDGETS BELOW TO LOAD YOUR ORDERS AND TRADE THIS EXPLOSIVE PUMP IMMEDIATELY! 👇
#Synapse #Meld #CapToken #CryptoBreakout #TopGainers $BNB
1
462
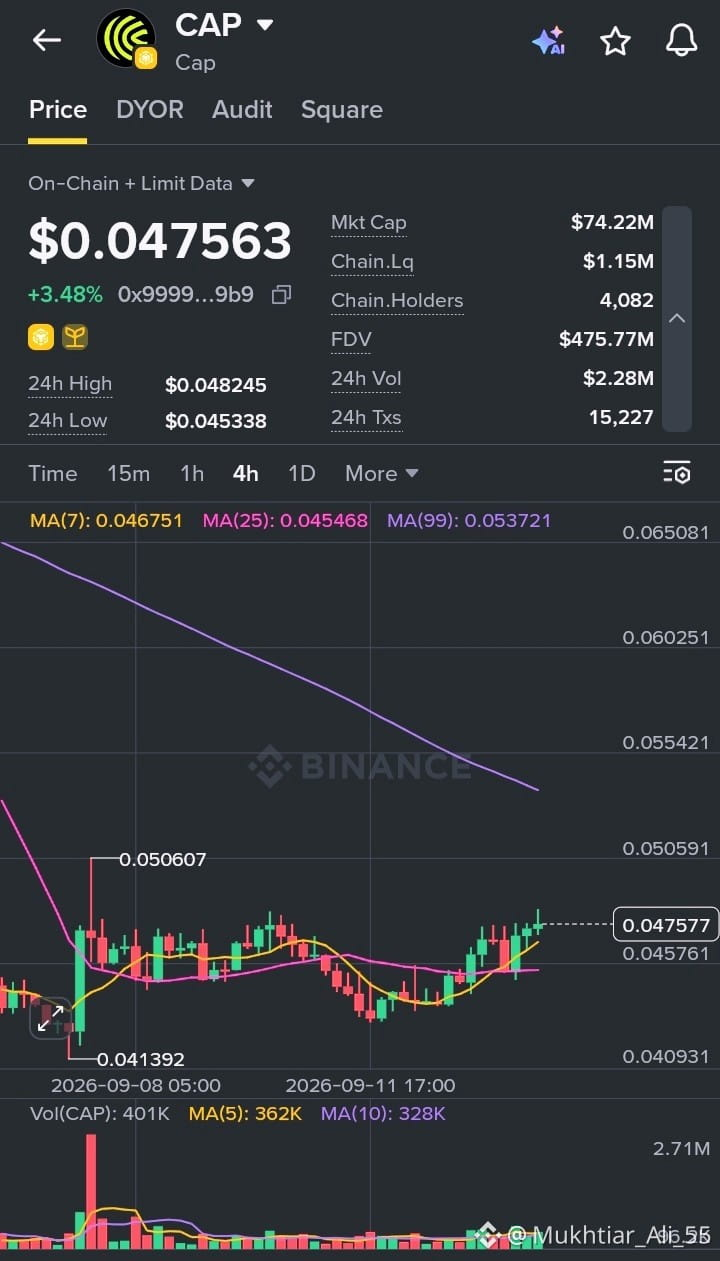
🚨 CAP ($CAP ) SHOWING STEADY STABILIZATION — WHAT THE CHART IS REALLY TELLING US 📈🔥
$CAP | CAP/USD
💰 Price: 0.047563
📈 24H Change: +3.48%
📊 24H High: 0.048245
📉 24H Low: 0.045338
💵 24H Volume (USDT): 2.28M
⚠️ Market Breakdown (4H Timeframe):
Cap just maintained a steady recovery phase, defending structural support with consistent confidence 🚀
🚀 Price bounced cleanly from the 0.045338 low up toward the 0.048245 resistance zone
🚀 Constructive green candles indicate steady buyer demand and active re-accumulation
🚀 A minor consolidation near current levels reflects a healthy pause before the next test 🧲
📉 Moving Averages Tell the Story:
📌 MA(7): 0.046751
📌 MA(25): 0.045468
📌 MA(99): 0.053721
✅ Price is trading comfortably above short-term moving averages
✅ Constructive bullish structure building after local lows
✅ Buyers stepping in to protect immediate ranges 🐂
📊 Volume Insight:
🟢 Steady volume backing the ongoing stabilization phase
💥 Confirms genuine interest and healthy market participation
⚠️ Volatility remains active — expect choppy conditions near overhead resistance
🧠 What This Means:
This is not a random bounce ❌
This is a calculated recovery phase establishing a reliable base
🔹 Short-term trend: Bullish
🔹 Momentum: Stable
🔹 Market emotion: Optimistic and disciplined ⚖️
🎯 Key Levels to Watch:
🟢 Support: 0.045 – 0.046 zone
🔴 Resistance: 0.048 – 0.053 zone
📌 A clean break and daily close above 0.048 will clear the path for a push toward higher moving averages 🚀
📌 Failure to hold the 0.045 support could invite a temporary retest of lower zones ⬇️
💡 Final Take:
🧨 CAP is navigating a crucial structural consolidation phase
🧘 Patience > chasing candles
🛡️ Risk management is critical — protect your capital
Markets reward discipline over impulse 💎
#CAP #CapToken #CryptoTrading #Altcoins #BinanceSquare
$CAP
{future}(CAPUSDT)
🚨 CAP ($CAP ) SHOWING STEADY STABILIZATION — WHAT THE CHART IS REALLY TELLING US 📈🔥
$CAP | CAP/USD
💰 Price: 0.047563
📈 24H Change: +3.48%
📊 24H High: 0.048245
📉 24H Low: 0.045338
💵 24H Volume (USDT): 2.28M
⚠️ Market Breakdown (4H Timeframe):
Cap just maintained a steady recovery phase, defending structural support with consistent confidence 🚀
🚀 Price bounced cleanly from the 0.045338 low up toward the 0.048245 resistance zone
🚀 Constructive green candles indicate steady buyer demand and active re-accumulation
🚀 A minor consolidation near current levels reflects a healthy pause before the next test 🧲
📉 Moving Averages Tell the Story:
📌 MA(7): 0.046751
📌 MA(25): 0.045468
📌 MA(99): 0.053721
✅ Price is trading comfortably above short-term moving averages
✅ Constructive bullish structure building after local lows
✅ Buyers stepping in to protect immediate ranges 🐂
📊 Volume Insight:
🟢 Steady volume backing the ongoing stabilization phase
💥 Confirms genuine interest and healthy market participation
⚠️ Volatility remains active — expect choppy conditions near overhead resistance
🧠 What This Means:
This is not a random bounce ❌
This is a calculated recovery phase establishing a reliable base
🔹 Short-term trend: Bullish
🔹 Momentum: Stable
🔹 Market emotion: Optimistic and disciplined ⚖️
🎯 Key Levels to Watch:
🟢 Support: 0.045 – 0.046 zone
🔴 Resistance: 0.048 – 0.053 zone
📌 A clean break and daily close above 0.048 will clear the path for a push toward higher moving averages 🚀
📌 Failure to hold the 0.045 support could invite a temporary retest of lower zones ⬇️
💡 Final Take:
🧨 CAP is navigating a crucial structural consolidation phase
🧘 Patience > chasing candles
🛡️ Risk management is critical — protect your capital
Markets reward discipline over impulse 💎
#CAP #CapToken #CryptoTrading #Altcoins #BinanceSquare
$CAP
$CAP | CAP/USD
💰 Price: 0.047563
📈 24H Change: +3.48%
📊 24H High: 0.048245
📉 24H Low: 0.045338
💵 24H Volume (USDT): 2.28M
⚠️ Market Breakdown (4H Timeframe):
Cap just maintained a steady recovery phase, defending structural support with consistent confidence 🚀
🚀 Price bounced cleanly from the 0.045338 low up toward the 0.048245 resistance zone
🚀 Constructive green candles indicate steady buyer demand and active re-accumulation
🚀 A minor consolidation near current levels reflects a healthy pause before the next test 🧲
📉 Moving Averages Tell the Story:
📌 MA(7): 0.046751
📌 MA(25): 0.045468
📌 MA(99): 0.053721
✅ Price is trading comfortably above short-term moving averages
✅ Constructive bullish structure building after local lows
✅ Buyers stepping in to protect immediate ranges 🐂
📊 Volume Insight:
🟢 Steady volume backing the ongoing stabilization phase
💥 Confirms genuine interest and healthy market participation
⚠️ Volatility remains active — expect choppy conditions near overhead resistance
🧠 What This Means:
This is not a random bounce ❌
This is a calculated recovery phase establishing a reliable base
🔹 Short-term trend: Bullish
🔹 Momentum: Stable
🔹 Market emotion: Optimistic and disciplined ⚖️
🎯 Key Levels to Watch:
🟢 Support: 0.045 – 0.046 zone
🔴 Resistance: 0.048 – 0.053 zone
📌 A clean break and daily close above 0.048 will clear the path for a push toward higher moving averages 🚀
📌 Failure to hold the 0.045 support could invite a temporary retest of lower zones ⬇️
💡 Final Take:
🧨 CAP is navigating a crucial structural consolidation phase
🧘 Patience > chasing candles
🛡️ Risk management is critical — protect your capital
Markets reward discipline over impulse 💎
#CAP #CapToken #CryptoTrading #Altcoins #BinanceSquare
$CAP
76
Log in to explore more content
Join global crypto users on Binance Square
⚡️ Get latest and useful information about crypto.
💬 Trusted by the world’s largest crypto exchange.
👍 Discover real insights from verified creators.
Email / Phone number
Trending Topics
1
#WhatWillDriveCryptoandStocks’NextRebound?
1,855 views
88 Discussing
2
#Anthropic’s6xIPODemandSignalsPotentialRecordRaise
531 views
29 Discussing
3
#HuangExitNvidiaStrategyInFocus
129,204 views
1,315 Discussing
4
#AnthropicRejectsIPODelayValuationinQuestion
744,350 views
5,506 Discussing
5
#HedgeFundsCMEBitcoinNetShortsFall89%
6,305 views
100 Discussing
6
#BitMineReports$6.3BNetLossForFiscal2026
17,663 views
156 Discussing
7
#TradFiForBeginners
545,671 views
3,798 Discussing
8
#SoFiExpandsSoFiUSDStablecoinToPolygon
4,944 views
87 Discussing
9
#TetherGoldXAUTCompletesKPMGAudit
6,654 views
92 Discussing
10
#ChipStocksExtendLossesAfterNvidiaCEOChange
49,295 views
521 Discussing