
#bitcoincrosses
bitcoincrosses
309 views
56 Discussing
Hot
Latest

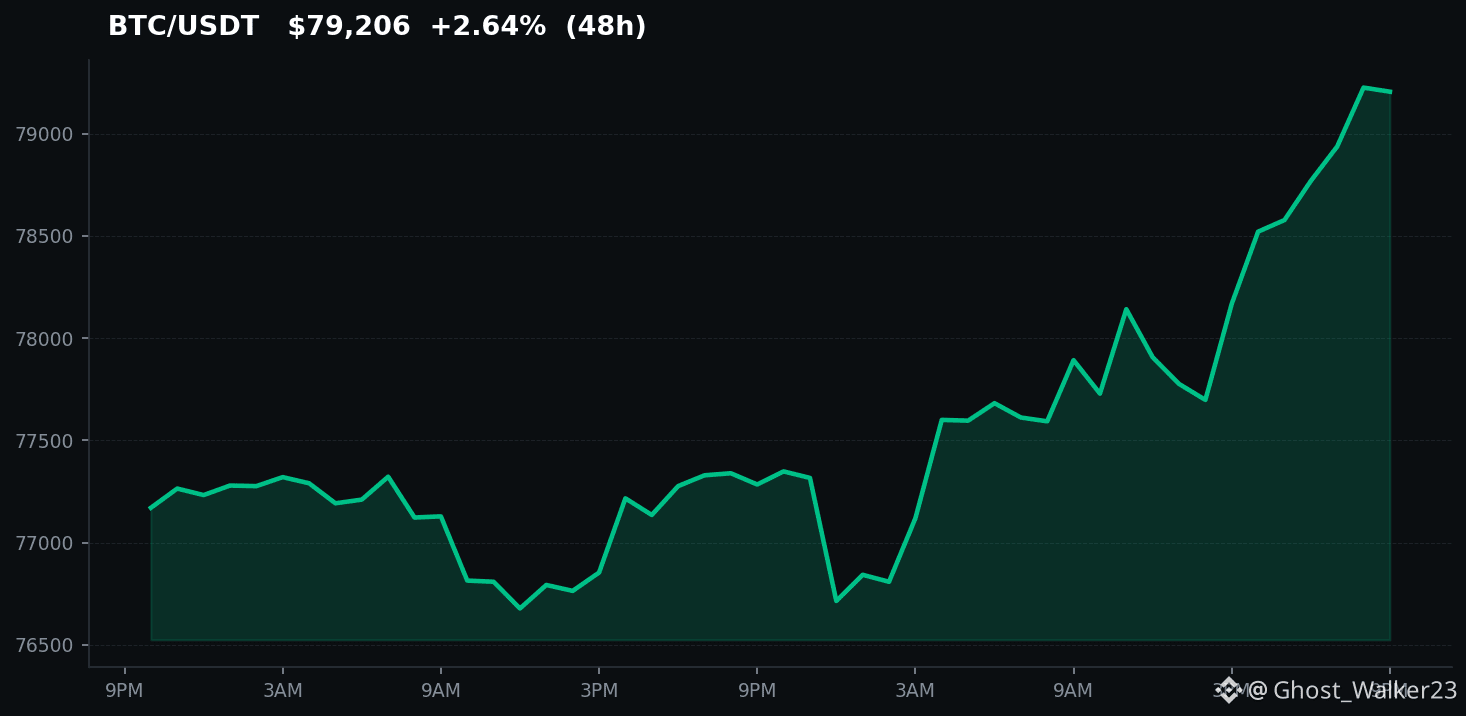
#BitcoinCrosses $BTC 78000
🚀 Bitcoin Crosses $78,000!
Bitcoin has moved above the $BTC
{future}(BTCUSDT)
78,000 mark, drawing fresh attention across the crypto market. The breakout highlights strong market activity, though volatility can remain high as traders watch whether BTC can sustain above this level.
Stay alert, manage risk, and always do your own research before making financial decisions.
Bitcoin #BTC #Crypto_Jobs🎯
#BitcoinCrosses $BTC 78000
🚀 Bitcoin Crosses $78,000!
Bitcoin has moved above the $BTC
78,000 mark, drawing fresh attention across the crypto market. The breakout highlights strong market activity, though volatility can remain high as traders watch whether BTC can sustain above this level.
Stay alert, manage risk, and always do your own research before making financial decisions.
Bitcoin #BTC #Crypto_Jobs🎯
🚀 Bitcoin Crosses $78,000!
Bitcoin has moved above the $BTC
78,000 mark, drawing fresh attention across the crypto market. The breakout highlights strong market activity, though volatility can remain high as traders watch whether BTC can sustain above this level.
Stay alert, manage risk, and always do your own research before making financial decisions.
Bitcoin #BTC #Crypto_Jobs🎯

53

Bitcoin has decisively broken through the $78,000 mark, signaling a significant bullish momentum in the market. This surge indicates strong buying pressure and growing investor confidence, potentially driven by recent positive developments or anticipation of future events. The market is now keenly watching to see if this new price level can be sustained, with many analysts suggesting further upside potential if key support levels hold. Traders are closely monitoring on-chain data and macroeconomic indicators for clues on the sustainability of this rally.
Disclaimer: This content is for informational purposes only and does not constitute investment advice.
#BitcoinCrosses$78000 $BTC
Bitcoin has decisively broken through the $78,000 mark, signaling a significant bullish momentum in the market. This surge indicates strong buying pressure and growing investor confidence, potentially driven by recent positive developments or anticipation of future events. The market is now keenly watching to see if this new price level can be sustained, with many analysts suggesting further upside potential if key support levels hold. Traders are closely monitoring on-chain data and macroeconomic indicators for clues on the sustainability of this rally.
Disclaimer: This content is for informational purposes only and does not constitute investment advice.
#BitcoinCrosses$78000 $BTC
Disclaimer: This content is for informational purposes only and does not constitute investment advice.
#BitcoinCrosses$78000 $BTC
9

·
--
#BitcoinCrosses 🚨 **Bitcoin Crosses $78,000! 🚀**
Bitcoin has broken above the **$78K level**, putting bulls back in the spotlight. 📈
The big question now: **Is this the start of another major rally, or will BTC face strong resistance around these levels?**
🔥 Bulls are watching the next breakout
⚠️ Traders should watch volatility and profit-taking
👀 Momentum + volume could be key for the next move
**What do you think?**
🟢 **BTC → $80K+ next?**
🔴 **Or a pullback before the next rally?**
Drop your prediction below 👇
#bitcoin #CryptoMarket #Bitcoinprice #BTCUSD
$BTC
{spot}(BTCUSDT)
#BitcoinCrosses 🚨 **Bitcoin Crosses $78,000! 🚀**
Bitcoin has broken above the **$78K level**, putting bulls back in the spotlight. 📈
The big question now: **Is this the start of another major rally, or will BTC face strong resistance around these levels?**
🔥 Bulls are watching the next breakout
⚠️ Traders should watch volatility and profit-taking
👀 Momentum + volume could be key for the next move
**What do you think?**
🟢 **BTC → $80K+ next?**
🔴 **Or a pullback before the next rally?**
Drop your prediction below 👇
#bitcoin #CryptoMarket #Bitcoinprice #BTCUSD
$BTC
Bitcoin has broken above the **$78K level**, putting bulls back in the spotlight. 📈
The big question now: **Is this the start of another major rally, or will BTC face strong resistance around these levels?**
🔥 Bulls are watching the next breakout
⚠️ Traders should watch volatility and profit-taking
👀 Momentum + volume could be key for the next move
**What do you think?**
🟢 **BTC → $80K+ next?**
🔴 **Or a pullback before the next rally?**
Drop your prediction below 👇
#bitcoin #CryptoMarket #Bitcoinprice #BTCUSD
$BTC
76

·
--
I. Market Overview
Bitcoin has continued to strengthen on September 14. Its latest price is $78,490. Within the day, it has risen steadily from around $77,700, with a peak of $78,712. Over the past several hours, bulls have been pushing hard; the price has already held above the $78,000 level, and the overall market tone is bullish. From the hourly K-line chart, BTC has been closing green consecutively, and trading volume has expanded notably as prices rise, indicating that bullish capital is actively moving in.
II. Interpretation of Technical Indicators
The moving average system shows a classic bullish alignment. The 7-period moving average is at $78,159, the 25-period moving average at $77,613, and the 99-period moving average at $77,342. The short-term moving averages are positioned above the mid- to long-term moving averages in sequence, confirming that the uptrend structure remains intact. The Exponential Moving Average (EMA) also displays a bullish arrangement where the 7-day MA is greater than the 25-day MA, which is greater than the 99-day MA. Moreover, the degree of divergence is increasing, suggesting that upward momentum is strengthening.
For the MACD indicator: the fast line is 314.05, the slow line is 225.00, and the histogram is 89.05. All three are in the positive region, and the histogram has been expanding—this is a typical bullish acceleration signal. However, it is worth watching whether the expansion rate of the histogram begins to slow down. In the current cycle, the histogram has edged down slightly from 93.74 to 89.05, hinting that short-term upward momentum may be starting to weaken at the margin.
Regarding the Bollinger Bands: price is trading near the upper band at $78,743, the middle band at $77,688, and the lower band at $76,633. Price staying close to the upper band indicates strong bull power, but it also implies that there may be a technical pullback toward the middle band in the short term.
For the RSI indicator: the 6-period RSI is 69.65, the 12-period RSI is 67.03, and the 24-period RSI is 62.16. The short-term RSI is nearing the overbought zone around 70 but has not yet entered it, meaning bulls still have room to run, though there is a need to watch for short-term overheating risk. In the KDJ indicator, the K value is 77.05, D is 72.13, and J is 86.89. The J value has broken above 80, so investors should pay attention to potential pullback pressure in the near term.
The ATR true volatility is 385.45, down from the prior value of 403.11. Volatility is converging at the margin, which may suggest that the market could enter a period of consolidation in the short term. The SAR Parabolic indicator is at $77,654. Price is continuously trading above the SAR, and the bulls’ stop-loss line is gradually moving up, indicating that the trend defense level is relatively healthy.
III. Composite Signals and Market Sentiment
The AI composite indicator issues a bullish signal. Out of 15 factors, 8 are bullish and 7 are bearish, giving bulls a share of 53.3%. The historical overall indicator win rate is 80.85%, with bulls at 79.17% and bears at 82.61%. Bulls currently have a slight edge, but it is not overwhelming; the market is at a key point where bulls and bears are in contention.
From the news side, the U.S. Senate will hold a procedural vote on September 15 regarding the Digital Assets Market Clarity Act, which is the most crucial legislative milestone the crypto industry faces this year. If the bill progresses smoothly, the market generally believes the positive impact has not yet been fully priced in, and BTC could attempt to challenge the $100,000 mark. At the same time, the Federal Reserve’s policy meeting scheduled for September 15–16 is underway as well. 86% of economists expect a 25-basis-point rate hike, which would be the first rate hike since July 2023. This raises pressure on macro liquidity as it may tighten at the margin.
On the fund flow front, Bitcoin spot ETFs saw net outflows of $463 million last week, ending the prior streak of three consecutive weeks of net inflows. This suggests that some institutional capital chose to take profits after prices were higher. However, buying on the corporate side remains strong. Last week, public companies collectively purchased 1,615 BTC, and Strive Asset Management has continued to increase holdings, indicating that industrial capital’s long-term confidence in BTC has not wavered.
IV. Outlook and Risk Warnings
In the short term, with BTC holding above $78,000, the technical structure for bulls remains intact. However, both RSI and KDJ have already approached overbought areas, so a technical pullback in the near term is possible. Key support to watch includes the Bollinger middle band at $77,688 and the SAR stop-loss level at $77,654. If these levels are broken, BTC may revisit the $77,000 psychological round-number area. On the upside, resistance to watch is the Bollinger upper band at $78,743. A breakout could open the door to challenging the $80,000 psychological level.
Investors should focus on two events: (1) the procedural vote result for the Digital Assets Market Clarity Act on September 15, and (2) the interest-rate decision from the Federal Reserve policy meeting. These two events will jointly determine BTC’s short-term direction. Volatility could increase significantly, so it is recommended to prepare for risk management.
V. Trending Tokens and Topics
As for today’s trending tokens in the market: ARK is up 16.97% to $0.1709, T is up 14.38% to $0.00501, and MTL is up 13.57% to $0.318. All show strong near-term breakout potential, but investors should note that smaller-cap coins can have higher volatility risk.
For trending topics, market attention is focused on three areas: BTC holding above $77,000, the probability of a Fed rate hike rising to 89%, and Bitcoin breaking above $78,000.
#BitcoinHoldsAbove$77000 #FedHikeOddsRiseTo89% #BitcoinCrosses$78000
I. Market Overview
Bitcoin has continued to strengthen on September 14. Its latest price is $78,490. Within the day, it has risen steadily from around $77,700, with a peak of $78,712. Over the past several hours, bulls have been pushing hard; the price has already held above the $78,000 level, and the overall market tone is bullish. From the hourly K-line chart, BTC has been closing green consecutively, and trading volume has expanded notably as prices rise, indicating that bullish capital is actively moving in.
II. Interpretation of Technical Indicators
The moving average system shows a classic bullish alignment. The 7-period moving average is at $78,159, the 25-period moving average at $77,613, and the 99-period moving average at $77,342. The short-term moving averages are positioned above the mid- to long-term moving averages in sequence, confirming that the uptrend structure remains intact. The Exponential Moving Average (EMA) also displays a bullish arrangement where the 7-day MA is greater than the 25-day MA, which is greater than the 99-day MA. Moreover, the degree of divergence is increasing, suggesting that upward momentum is strengthening.
For the MACD indicator: the fast line is 314.05, the slow line is 225.00, and the histogram is 89.05. All three are in the positive region, and the histogram has been expanding—this is a typical bullish acceleration signal. However, it is worth watching whether the expansion rate of the histogram begins to slow down. In the current cycle, the histogram has edged down slightly from 93.74 to 89.05, hinting that short-term upward momentum may be starting to weaken at the margin.
Regarding the Bollinger Bands: price is trading near the upper band at $78,743, the middle band at $77,688, and the lower band at $76,633. Price staying close to the upper band indicates strong bull power, but it also implies that there may be a technical pullback toward the middle band in the short term.
For the RSI indicator: the 6-period RSI is 69.65, the 12-period RSI is 67.03, and the 24-period RSI is 62.16. The short-term RSI is nearing the overbought zone around 70 but has not yet entered it, meaning bulls still have room to run, though there is a need to watch for short-term overheating risk. In the KDJ indicator, the K value is 77.05, D is 72.13, and J is 86.89. The J value has broken above 80, so investors should pay attention to potential pullback pressure in the near term.
The ATR true volatility is 385.45, down from the prior value of 403.11. Volatility is converging at the margin, which may suggest that the market could enter a period of consolidation in the short term. The SAR Parabolic indicator is at $77,654. Price is continuously trading above the SAR, and the bulls’ stop-loss line is gradually moving up, indicating that the trend defense level is relatively healthy.
III. Composite Signals and Market Sentiment
The AI composite indicator issues a bullish signal. Out of 15 factors, 8 are bullish and 7 are bearish, giving bulls a share of 53.3%. The historical overall indicator win rate is 80.85%, with bulls at 79.17% and bears at 82.61%. Bulls currently have a slight edge, but it is not overwhelming; the market is at a key point where bulls and bears are in contention.
From the news side, the U.S. Senate will hold a procedural vote on September 15 regarding the Digital Assets Market Clarity Act, which is the most crucial legislative milestone the crypto industry faces this year. If the bill progresses smoothly, the market generally believes the positive impact has not yet been fully priced in, and BTC could attempt to challenge the $100,000 mark. At the same time, the Federal Reserve’s policy meeting scheduled for September 15–16 is underway as well. 86% of economists expect a 25-basis-point rate hike, which would be the first rate hike since July 2023. This raises pressure on macro liquidity as it may tighten at the margin.
On the fund flow front, Bitcoin spot ETFs saw net outflows of $463 million last week, ending the prior streak of three consecutive weeks of net inflows. This suggests that some institutional capital chose to take profits after prices were higher. However, buying on the corporate side remains strong. Last week, public companies collectively purchased 1,615 BTC, and Strive Asset Management has continued to increase holdings, indicating that industrial capital’s long-term confidence in BTC has not wavered.
IV. Outlook and Risk Warnings
In the short term, with BTC holding above $78,000, the technical structure for bulls remains intact. However, both RSI and KDJ have already approached overbought areas, so a technical pullback in the near term is possible. Key support to watch includes the Bollinger middle band at $77,688 and the SAR stop-loss level at $77,654. If these levels are broken, BTC may revisit the $77,000 psychological round-number area. On the upside, resistance to watch is the Bollinger upper band at $78,743. A breakout could open the door to challenging the $80,000 psychological level.
Investors should focus on two events: (1) the procedural vote result for the Digital Assets Market Clarity Act on September 15, and (2) the interest-rate decision from the Federal Reserve policy meeting. These two events will jointly determine BTC’s short-term direction. Volatility could increase significantly, so it is recommended to prepare for risk management.
V. Trending Tokens and Topics
As for today’s trending tokens in the market: ARK is up 16.97% to $0.1709, T is up 14.38% to $0.00501, and MTL is up 13.57% to $0.318. All show strong near-term breakout potential, but investors should note that smaller-cap coins can have higher volatility risk.
For trending topics, market attention is focused on three areas: BTC holding above $77,000, the probability of a Fed rate hike rising to 89%, and Bitcoin breaking above $78,000.
#BitcoinHoldsAbove$77000 #FedHikeOddsRiseTo89% #BitcoinCrosses$78000
Bitcoin has continued to strengthen on September 14. Its latest price is $78,490. Within the day, it has risen steadily from around $77,700, with a peak of $78,712. Over the past several hours, bulls have been pushing hard; the price has already held above the $78,000 level, and the overall market tone is bullish. From the hourly K-line chart, BTC has been closing green consecutively, and trading volume has expanded notably as prices rise, indicating that bullish capital is actively moving in.
II. Interpretation of Technical Indicators
The moving average system shows a classic bullish alignment. The 7-period moving average is at $78,159, the 25-period moving average at $77,613, and the 99-period moving average at $77,342. The short-term moving averages are positioned above the mid- to long-term moving averages in sequence, confirming that the uptrend structure remains intact. The Exponential Moving Average (EMA) also displays a bullish arrangement where the 7-day MA is greater than the 25-day MA, which is greater than the 99-day MA. Moreover, the degree of divergence is increasing, suggesting that upward momentum is strengthening.
For the MACD indicator: the fast line is 314.05, the slow line is 225.00, and the histogram is 89.05. All three are in the positive region, and the histogram has been expanding—this is a typical bullish acceleration signal. However, it is worth watching whether the expansion rate of the histogram begins to slow down. In the current cycle, the histogram has edged down slightly from 93.74 to 89.05, hinting that short-term upward momentum may be starting to weaken at the margin.
Regarding the Bollinger Bands: price is trading near the upper band at $78,743, the middle band at $77,688, and the lower band at $76,633. Price staying close to the upper band indicates strong bull power, but it also implies that there may be a technical pullback toward the middle band in the short term.
For the RSI indicator: the 6-period RSI is 69.65, the 12-period RSI is 67.03, and the 24-period RSI is 62.16. The short-term RSI is nearing the overbought zone around 70 but has not yet entered it, meaning bulls still have room to run, though there is a need to watch for short-term overheating risk. In the KDJ indicator, the K value is 77.05, D is 72.13, and J is 86.89. The J value has broken above 80, so investors should pay attention to potential pullback pressure in the near term.
The ATR true volatility is 385.45, down from the prior value of 403.11. Volatility is converging at the margin, which may suggest that the market could enter a period of consolidation in the short term. The SAR Parabolic indicator is at $77,654. Price is continuously trading above the SAR, and the bulls’ stop-loss line is gradually moving up, indicating that the trend defense level is relatively healthy.
III. Composite Signals and Market Sentiment
The AI composite indicator issues a bullish signal. Out of 15 factors, 8 are bullish and 7 are bearish, giving bulls a share of 53.3%. The historical overall indicator win rate is 80.85%, with bulls at 79.17% and bears at 82.61%. Bulls currently have a slight edge, but it is not overwhelming; the market is at a key point where bulls and bears are in contention.
From the news side, the U.S. Senate will hold a procedural vote on September 15 regarding the Digital Assets Market Clarity Act, which is the most crucial legislative milestone the crypto industry faces this year. If the bill progresses smoothly, the market generally believes the positive impact has not yet been fully priced in, and BTC could attempt to challenge the $100,000 mark. At the same time, the Federal Reserve’s policy meeting scheduled for September 15–16 is underway as well. 86% of economists expect a 25-basis-point rate hike, which would be the first rate hike since July 2023. This raises pressure on macro liquidity as it may tighten at the margin.
On the fund flow front, Bitcoin spot ETFs saw net outflows of $463 million last week, ending the prior streak of three consecutive weeks of net inflows. This suggests that some institutional capital chose to take profits after prices were higher. However, buying on the corporate side remains strong. Last week, public companies collectively purchased 1,615 BTC, and Strive Asset Management has continued to increase holdings, indicating that industrial capital’s long-term confidence in BTC has not wavered.
IV. Outlook and Risk Warnings
In the short term, with BTC holding above $78,000, the technical structure for bulls remains intact. However, both RSI and KDJ have already approached overbought areas, so a technical pullback in the near term is possible. Key support to watch includes the Bollinger middle band at $77,688 and the SAR stop-loss level at $77,654. If these levels are broken, BTC may revisit the $77,000 psychological round-number area. On the upside, resistance to watch is the Bollinger upper band at $78,743. A breakout could open the door to challenging the $80,000 psychological level.
Investors should focus on two events: (1) the procedural vote result for the Digital Assets Market Clarity Act on September 15, and (2) the interest-rate decision from the Federal Reserve policy meeting. These two events will jointly determine BTC’s short-term direction. Volatility could increase significantly, so it is recommended to prepare for risk management.
V. Trending Tokens and Topics
As for today’s trending tokens in the market: ARK is up 16.97% to $0.1709, T is up 14.38% to $0.00501, and MTL is up 13.57% to $0.318. All show strong near-term breakout potential, but investors should note that smaller-cap coins can have higher volatility risk.
For trending topics, market attention is focused on three areas: BTC holding above $77,000, the probability of a Fed rate hike rising to 89%, and Bitcoin breaking above $78,000.
#BitcoinHoldsAbove$77000 #FedHikeOddsRiseTo89% #BitcoinCrosses$78000

🚀 Bitcoin just crossed $78,000! This surge signals strong bullish sentiment and could set the stage for further gains. With altcoins like ARK also rising, are we witnessing the start of a major alt season? Let’s discuss! 💬 #BitcoinCrosses$78000 #PONS
$BTC
👀 Síguenos para estar pendiente de las próximas oportunidades.
🚀 Bitcoin just crossed $78,000! This surge signals strong bullish sentiment and could set the stage for further gains. With altcoins like ARK also rising, are we witnessing the start of a major alt season? Let’s discuss! 💬 #BitcoinCrosses$78000 #PONS
$BTC
👀 Síguenos para estar pendiente de las próximas oportunidades.
$BTC
👀 Síguenos para estar pendiente de las próximas oportunidades.
8
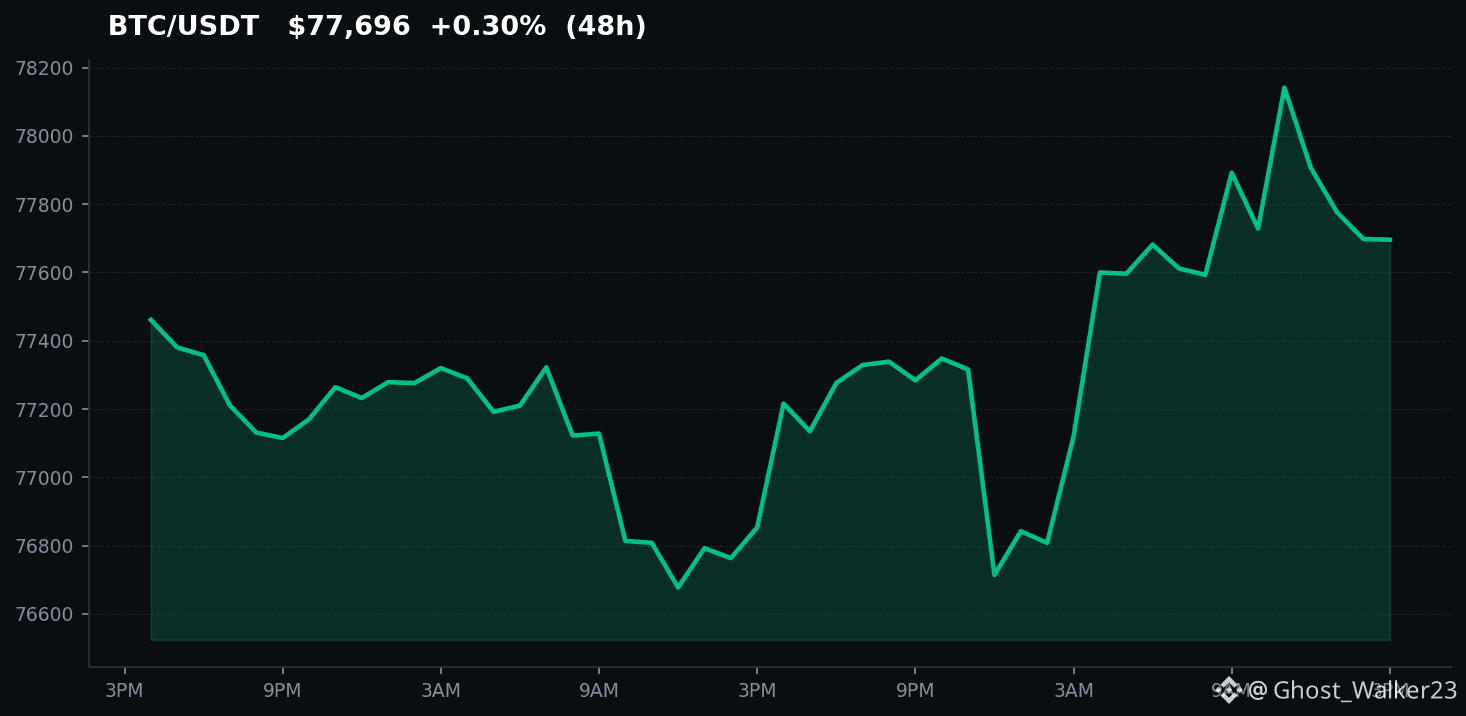
🚀 #BitcoinCrosses$78000 and the market is buzzing! With $BTC hitting this critical milestone, we could see a ripple effect that lifts altcoins like FIL and CAKE. Are you ready to seize the opportunity, or do you think this rally is short-lived? 🤔 #Crypto
📈 Follow for more real-time market breakdowns!
🚀 #BitcoinCrosses$78000 and the market is buzzing! With $BTC hitting this critical milestone, we could see a ripple effect that lifts altcoins like FIL and CAKE. Are you ready to seize the opportunity, or do you think this rally is short-lived? 🤔 #Crypto
📈 Follow for more real-time market breakdowns!
📈 Follow for more real-time market breakdowns!
·
--
1. Market Overview
Bitcoin has continued to strengthen on September 14. The latest price is $78,625. It has risen steadily from around $77,700 to the $78,700 area during the day, with an increase of about 1.2%. The hourly K-line has remained consecutively bullish, and trading volume briefly expanded to $102 million. Buyers are actively participating. However, as it approached the $79,000 level, volume fell back to $41 million, indicating weakening upside momentum.
2. Technical Indicator Readings
The moving averages are in a bullish alignment. The 7-period line at $78,191, the 25-period line at $77,622, and the 99-period line at $77,344 are diverging upward in sequence, with price trading above all moving averages. EMA7 is $78,297 and EMA25 is $77,768; short- to mid-term momentum is moving upward in sync.
MACD is strong. DIF has risen from 186 to 331, and the histogram has expanded from 40 to 103. Bullish momentum continues to expand. However, the incremental gain is narrowing, suggesting upside momentum may be nearing a marginal decline.
RSI has entered the overbought zone. RSI6 is 78.91, Stoch RSI reaches the extreme value of 100, and the Williams %R (WR) is negative at -12.69. Multiple oscillators simultaneously issue overbought signals. In the KDJ section, the J value at 91.61 deviates sharply from K and D, indicating a potential need for a technical pullback in the short term. The Bollinger Bands upper band is at $78,790; price has already touched the upper band and is in a strong resistance area.
SAR is at $77,654, and SuperTrend is at $77,332—both positioned below the price, confirming the uptrend. OBV has risen from 1,701 to 5,583, showing steady capital inflow and buyers dominating.
3. Analysis of Long vs. Short Signals
The AI signal system combines 15 factors: 8 bullish and 7 bearish. Long-vs-short signals are relatively balanced. The composite indicator provides a bearish signal, with a historical win rate of 80.77%. RSI14 issues a bearish signal. In the Alpha series, 6 are bearish and some have win rates above 57%, pointing to technical resistance. However, Alpha15, Alpha29, Alpha34, etc. still remain bullish, meaning trend support has not yet been eliminated.
4. Macroeconomic Context
The market is focused on two major events. The U.S. Senate is set for a key vote on the CLARITY Act on September 15, requiring 60 votes to advance. Bernstein believes the positive outcome has not been priced in sufficiently; Bitcoin may be poised to push toward $100,000. The Fed’s September 16 rate hike probability is 87%, with expectations for a 25-basis-point hike, which is weighing on risk assets. On liquidity, Bitcoin ETFs saw net outflows of $463 million last week. Strategy has not purchased Bitcoin for three consecutive weeks, but other companies increased holdings by over 1,600 BTC, suggesting institutional demand remains.
5. Outlook
In the short term, Bitcoin is in an overbought phase within a bullish trend. Moving averages and MACD support the upward move, but RSI overbought conditions, KDJ divergence at high levels, Bollinger upper-band resistance, and the composite bearish signal all point to the risk of a pullback. Support lies at $77,300 to $77,600; a break below or a retest could bring it toward $77,000. Resistance is at $78,800 to $79,000. If this is broken, it may challenge $80,000. It is recommended to reduce short-term long exposure moderately and wait for a pullback before entering again. Watch tomorrow’s CLARITY Act vote and the Fed decision the day after; both events will determine directional choice.
Popular Token Quick Look
MTL price $0.329, 24h change +19.20%
ARK price $0.1691, 24h change +14.72%
T price $0.00500, 24h change +14.16%
#BitcoinHoldsAbove$77000 #FedHikeOddsRiseTo89% #BitcoinCrosses$78000
1. Market Overview
Bitcoin has continued to strengthen on September 14. The latest price is $78,625. It has risen steadily from around $77,700 to the $78,700 area during the day, with an increase of about 1.2%. The hourly K-line has remained consecutively bullish, and trading volume briefly expanded to $102 million. Buyers are actively participating. However, as it approached the $79,000 level, volume fell back to $41 million, indicating weakening upside momentum.
2. Technical Indicator Readings
The moving averages are in a bullish alignment. The 7-period line at $78,191, the 25-period line at $77,622, and the 99-period line at $77,344 are diverging upward in sequence, with price trading above all moving averages. EMA7 is $78,297 and EMA25 is $77,768; short- to mid-term momentum is moving upward in sync.
MACD is strong. DIF has risen from 186 to 331, and the histogram has expanded from 40 to 103. Bullish momentum continues to expand. However, the incremental gain is narrowing, suggesting upside momentum may be nearing a marginal decline.
RSI has entered the overbought zone. RSI6 is 78.91, Stoch RSI reaches the extreme value of 100, and the Williams %R (WR) is negative at -12.69. Multiple oscillators simultaneously issue overbought signals. In the KDJ section, the J value at 91.61 deviates sharply from K and D, indicating a potential need for a technical pullback in the short term. The Bollinger Bands upper band is at $78,790; price has already touched the upper band and is in a strong resistance area.
SAR is at $77,654, and SuperTrend is at $77,332—both positioned below the price, confirming the uptrend. OBV has risen from 1,701 to 5,583, showing steady capital inflow and buyers dominating.
3. Analysis of Long vs. Short Signals
The AI signal system combines 15 factors: 8 bullish and 7 bearish. Long-vs-short signals are relatively balanced. The composite indicator provides a bearish signal, with a historical win rate of 80.77%. RSI14 issues a bearish signal. In the Alpha series, 6 are bearish and some have win rates above 57%, pointing to technical resistance. However, Alpha15, Alpha29, Alpha34, etc. still remain bullish, meaning trend support has not yet been eliminated.
4. Macroeconomic Context
The market is focused on two major events. The U.S. Senate is set for a key vote on the CLARITY Act on September 15, requiring 60 votes to advance. Bernstein believes the positive outcome has not been priced in sufficiently; Bitcoin may be poised to push toward $100,000. The Fed’s September 16 rate hike probability is 87%, with expectations for a 25-basis-point hike, which is weighing on risk assets. On liquidity, Bitcoin ETFs saw net outflows of $463 million last week. Strategy has not purchased Bitcoin for three consecutive weeks, but other companies increased holdings by over 1,600 BTC, suggesting institutional demand remains.
5. Outlook
In the short term, Bitcoin is in an overbought phase within a bullish trend. Moving averages and MACD support the upward move, but RSI overbought conditions, KDJ divergence at high levels, Bollinger upper-band resistance, and the composite bearish signal all point to the risk of a pullback. Support lies at $77,300 to $77,600; a break below or a retest could bring it toward $77,000. Resistance is at $78,800 to $79,000. If this is broken, it may challenge $80,000. It is recommended to reduce short-term long exposure moderately and wait for a pullback before entering again. Watch tomorrow’s CLARITY Act vote and the Fed decision the day after; both events will determine directional choice.
Popular Token Quick Look
MTL price $0.329, 24h change +19.20%
ARK price $0.1691, 24h change +14.72%
T price $0.00500, 24h change +14.16%
#BitcoinHoldsAbove$77000 #FedHikeOddsRiseTo89% #BitcoinCrosses$78000
Bitcoin has continued to strengthen on September 14. The latest price is $78,625. It has risen steadily from around $77,700 to the $78,700 area during the day, with an increase of about 1.2%. The hourly K-line has remained consecutively bullish, and trading volume briefly expanded to $102 million. Buyers are actively participating. However, as it approached the $79,000 level, volume fell back to $41 million, indicating weakening upside momentum.
2. Technical Indicator Readings
The moving averages are in a bullish alignment. The 7-period line at $78,191, the 25-period line at $77,622, and the 99-period line at $77,344 are diverging upward in sequence, with price trading above all moving averages. EMA7 is $78,297 and EMA25 is $77,768; short- to mid-term momentum is moving upward in sync.
MACD is strong. DIF has risen from 186 to 331, and the histogram has expanded from 40 to 103. Bullish momentum continues to expand. However, the incremental gain is narrowing, suggesting upside momentum may be nearing a marginal decline.
RSI has entered the overbought zone. RSI6 is 78.91, Stoch RSI reaches the extreme value of 100, and the Williams %R (WR) is negative at -12.69. Multiple oscillators simultaneously issue overbought signals. In the KDJ section, the J value at 91.61 deviates sharply from K and D, indicating a potential need for a technical pullback in the short term. The Bollinger Bands upper band is at $78,790; price has already touched the upper band and is in a strong resistance area.
SAR is at $77,654, and SuperTrend is at $77,332—both positioned below the price, confirming the uptrend. OBV has risen from 1,701 to 5,583, showing steady capital inflow and buyers dominating.
3. Analysis of Long vs. Short Signals
The AI signal system combines 15 factors: 8 bullish and 7 bearish. Long-vs-short signals are relatively balanced. The composite indicator provides a bearish signal, with a historical win rate of 80.77%. RSI14 issues a bearish signal. In the Alpha series, 6 are bearish and some have win rates above 57%, pointing to technical resistance. However, Alpha15, Alpha29, Alpha34, etc. still remain bullish, meaning trend support has not yet been eliminated.
4. Macroeconomic Context
The market is focused on two major events. The U.S. Senate is set for a key vote on the CLARITY Act on September 15, requiring 60 votes to advance. Bernstein believes the positive outcome has not been priced in sufficiently; Bitcoin may be poised to push toward $100,000. The Fed’s September 16 rate hike probability is 87%, with expectations for a 25-basis-point hike, which is weighing on risk assets. On liquidity, Bitcoin ETFs saw net outflows of $463 million last week. Strategy has not purchased Bitcoin for three consecutive weeks, but other companies increased holdings by over 1,600 BTC, suggesting institutional demand remains.
5. Outlook
In the short term, Bitcoin is in an overbought phase within a bullish trend. Moving averages and MACD support the upward move, but RSI overbought conditions, KDJ divergence at high levels, Bollinger upper-band resistance, and the composite bearish signal all point to the risk of a pullback. Support lies at $77,300 to $77,600; a break below or a retest could bring it toward $77,000. Resistance is at $78,800 to $79,000. If this is broken, it may challenge $80,000. It is recommended to reduce short-term long exposure moderately and wait for a pullback before entering again. Watch tomorrow’s CLARITY Act vote and the Fed decision the day after; both events will determine directional choice.
Popular Token Quick Look
MTL price $0.329, 24h change +19.20%
ARK price $0.1691, 24h change +14.72%
T price $0.00500, 24h change +14.16%
#BitcoinHoldsAbove$77000 #FedHikeOddsRiseTo89% #BitcoinCrosses$78000
1
·
--
Bitcoin Market Analysis: Intense Long-Short Battle Around the $78,000 Level
I. Overview of Price Trend
During the September 14 European session, Bitcoin displayed strong upward momentum. The price climbed steadily from the $77,692 low, reaching a high of $78,712. As of the time of writing, it was trading at $78,501. Over the past 5 hours, it has gained roughly $600, with an increase of nearly 0.8%. The $78,490 to $78,712 range has formed a short-term resistance band. Price is under pressure in this zone; the latest candlestick closed as a small bearish candle, suggesting some hesitation from the bulls at higher levels. During the rally phase, trading volume expanded significantly: the 3rd and 4th candlesticks recorded trading amounts of $89.05 million and $102 million, far exceeding the previous two candles’ $27.58 million and $32.41 million. However, the most recent candle has fallen back to $33.05 million, indicating cooling follow-buy interest.
II. Interpretation of Technical Indicators
The moving-average system is arranged in a bullish alignment. MA7 is $78,101, MA25 is $77,557, and MA99 is $77,328. Short-term moving averages are above and long-term ones below, with the spacing widening—confirming the uptrend. EMA7 is $78,146, EMA25 is $77,685, and the price is trading above all moving averages. MACD rose from 198 to 290; the signal line increased from 136 to 201; the histogram expanded from 62 to 88. Bullish momentum is accelerating release, and no top divergence has appeared yet. RSI6 is at 74.41 and has entered the overbought zone. Stochastic RSI is extremely overbought at 93.75, suggesting short-term pullback pressure. In KDJ, K is 73.35, D is 68.98, and J is 82.08—J is far ahead. If the K line flattens, a dead cross may form. The Bollinger upper band is $78,614; price is running close to it. The middle band is $77,628. ATR increased from 337 to 397, indicating greater volatility. Across 15 technical factors, 7 are bullish and 8 are bearish. The overall signal is slightly bullish, with a historical win rate of 82.98%, implying relatively high trend credibility.
III. Market Sentiment and News Drivers
On the positive side, the U.S. Senate will hold a key vote on September 15 regarding a clear regulatory bill for the digital asset market. If it advances with 60 votes, it could provide an explicit regulatory framework for the crypto industry. Bernstein analyst noted that a favorable outcome has not been fully priced in, and Bitcoin could potentially test $100,000. Corporate demand to hold coins remains strong: a listed company reportedly spent $36.60 million last week to buy 469 bitcoins.
On the negative side, ahead of the September 15–16 Federal Reserve meeting, the probability of a 25-basis-point rate hike rose to 87%, which would be the first hike since July 2023. Bitcoin spot ETFs saw net outflows of $463 million last week, ending three consecutive weeks of net inflows. At the same time, Ethereum ETFs recorded net inflows of $197 million for four consecutive weeks of positive inflows, indicating capital rotation between the two major assets. Strategy reportedly paused share buy-backs for two weeks and shifted to repurchasing preferred shares, a signal worth watching. The SAR stop-loss level is $77,481; the current price is far above this level, meaning the uptrend protection remains intact. OBV fell from 4,450 to 4,029, and the high-volume trading structure has loosened somewhat.
IV. Overall Assessment
Technically, the short term is slightly bullish: the moving averages are in bullish order, MACD momentum is expanding, and the overall factor win rate is above 80%. However, both RSI and stochastic RSI are already overbought. Price is trading close to the upper Bollinger band, so the market likely needs a short-term correction. Key support levels are the $77,628 Bollinger middle band and the $77,481 SAR stop-loss. Resistance levels are $78,614 (Bollinger upper band) and the $79,000 psychological round-number level. The CLARITY bill vote and the Fed’s rate decision are expected to land in quick succession within 48 hours. Investors are advised to manage position sizes to mitigate the risk of sharp volatility.
Popular Tokens: T at $0.00519, up 18.22%; CRWDB at $236.59, up 13.09%; SOXSB at $51.51, up 12.47%.
#BitcoinHoldsAbove$77000 #FedHikeOddsRiseTo89% #BitcoinCrosses$78000
Bitcoin Market Analysis: Intense Long-Short Battle Around the $78,000 Level
I. Overview of Price Trend
During the September 14 European session, Bitcoin displayed strong upward momentum. The price climbed steadily from the $77,692 low, reaching a high of $78,712. As of the time of writing, it was trading at $78,501. Over the past 5 hours, it has gained roughly $600, with an increase of nearly 0.8%. The $78,490 to $78,712 range has formed a short-term resistance band. Price is under pressure in this zone; the latest candlestick closed as a small bearish candle, suggesting some hesitation from the bulls at higher levels. During the rally phase, trading volume expanded significantly: the 3rd and 4th candlesticks recorded trading amounts of $89.05 million and $102 million, far exceeding the previous two candles’ $27.58 million and $32.41 million. However, the most recent candle has fallen back to $33.05 million, indicating cooling follow-buy interest.
II. Interpretation of Technical Indicators
The moving-average system is arranged in a bullish alignment. MA7 is $78,101, MA25 is $77,557, and MA99 is $77,328. Short-term moving averages are above and long-term ones below, with the spacing widening—confirming the uptrend. EMA7 is $78,146, EMA25 is $77,685, and the price is trading above all moving averages. MACD rose from 198 to 290; the signal line increased from 136 to 201; the histogram expanded from 62 to 88. Bullish momentum is accelerating release, and no top divergence has appeared yet. RSI6 is at 74.41 and has entered the overbought zone. Stochastic RSI is extremely overbought at 93.75, suggesting short-term pullback pressure. In KDJ, K is 73.35, D is 68.98, and J is 82.08—J is far ahead. If the K line flattens, a dead cross may form. The Bollinger upper band is $78,614; price is running close to it. The middle band is $77,628. ATR increased from 337 to 397, indicating greater volatility. Across 15 technical factors, 7 are bullish and 8 are bearish. The overall signal is slightly bullish, with a historical win rate of 82.98%, implying relatively high trend credibility.
III. Market Sentiment and News Drivers
On the positive side, the U.S. Senate will hold a key vote on September 15 regarding a clear regulatory bill for the digital asset market. If it advances with 60 votes, it could provide an explicit regulatory framework for the crypto industry. Bernstein analyst noted that a favorable outcome has not been fully priced in, and Bitcoin could potentially test $100,000. Corporate demand to hold coins remains strong: a listed company reportedly spent $36.60 million last week to buy 469 bitcoins.
On the negative side, ahead of the September 15–16 Federal Reserve meeting, the probability of a 25-basis-point rate hike rose to 87%, which would be the first hike since July 2023. Bitcoin spot ETFs saw net outflows of $463 million last week, ending three consecutive weeks of net inflows. At the same time, Ethereum ETFs recorded net inflows of $197 million for four consecutive weeks of positive inflows, indicating capital rotation between the two major assets. Strategy reportedly paused share buy-backs for two weeks and shifted to repurchasing preferred shares, a signal worth watching. The SAR stop-loss level is $77,481; the current price is far above this level, meaning the uptrend protection remains intact. OBV fell from 4,450 to 4,029, and the high-volume trading structure has loosened somewhat.
IV. Overall Assessment
Technically, the short term is slightly bullish: the moving averages are in bullish order, MACD momentum is expanding, and the overall factor win rate is above 80%. However, both RSI and stochastic RSI are already overbought. Price is trading close to the upper Bollinger band, so the market likely needs a short-term correction. Key support levels are the $77,628 Bollinger middle band and the $77,481 SAR stop-loss. Resistance levels are $78,614 (Bollinger upper band) and the $79,000 psychological round-number level. The CLARITY bill vote and the Fed’s rate decision are expected to land in quick succession within 48 hours. Investors are advised to manage position sizes to mitigate the risk of sharp volatility.
Popular Tokens: T at $0.00519, up 18.22%; CRWDB at $236.59, up 13.09%; SOXSB at $51.51, up 12.47%.
#BitcoinHoldsAbove$77000 #FedHikeOddsRiseTo89% #BitcoinCrosses$78000
I. Overview of Price Trend
During the September 14 European session, Bitcoin displayed strong upward momentum. The price climbed steadily from the $77,692 low, reaching a high of $78,712. As of the time of writing, it was trading at $78,501. Over the past 5 hours, it has gained roughly $600, with an increase of nearly 0.8%. The $78,490 to $78,712 range has formed a short-term resistance band. Price is under pressure in this zone; the latest candlestick closed as a small bearish candle, suggesting some hesitation from the bulls at higher levels. During the rally phase, trading volume expanded significantly: the 3rd and 4th candlesticks recorded trading amounts of $89.05 million and $102 million, far exceeding the previous two candles’ $27.58 million and $32.41 million. However, the most recent candle has fallen back to $33.05 million, indicating cooling follow-buy interest.
II. Interpretation of Technical Indicators
The moving-average system is arranged in a bullish alignment. MA7 is $78,101, MA25 is $77,557, and MA99 is $77,328. Short-term moving averages are above and long-term ones below, with the spacing widening—confirming the uptrend. EMA7 is $78,146, EMA25 is $77,685, and the price is trading above all moving averages. MACD rose from 198 to 290; the signal line increased from 136 to 201; the histogram expanded from 62 to 88. Bullish momentum is accelerating release, and no top divergence has appeared yet. RSI6 is at 74.41 and has entered the overbought zone. Stochastic RSI is extremely overbought at 93.75, suggesting short-term pullback pressure. In KDJ, K is 73.35, D is 68.98, and J is 82.08—J is far ahead. If the K line flattens, a dead cross may form. The Bollinger upper band is $78,614; price is running close to it. The middle band is $77,628. ATR increased from 337 to 397, indicating greater volatility. Across 15 technical factors, 7 are bullish and 8 are bearish. The overall signal is slightly bullish, with a historical win rate of 82.98%, implying relatively high trend credibility.
III. Market Sentiment and News Drivers
On the positive side, the U.S. Senate will hold a key vote on September 15 regarding a clear regulatory bill for the digital asset market. If it advances with 60 votes, it could provide an explicit regulatory framework for the crypto industry. Bernstein analyst noted that a favorable outcome has not been fully priced in, and Bitcoin could potentially test $100,000. Corporate demand to hold coins remains strong: a listed company reportedly spent $36.60 million last week to buy 469 bitcoins.
On the negative side, ahead of the September 15–16 Federal Reserve meeting, the probability of a 25-basis-point rate hike rose to 87%, which would be the first hike since July 2023. Bitcoin spot ETFs saw net outflows of $463 million last week, ending three consecutive weeks of net inflows. At the same time, Ethereum ETFs recorded net inflows of $197 million for four consecutive weeks of positive inflows, indicating capital rotation between the two major assets. Strategy reportedly paused share buy-backs for two weeks and shifted to repurchasing preferred shares, a signal worth watching. The SAR stop-loss level is $77,481; the current price is far above this level, meaning the uptrend protection remains intact. OBV fell from 4,450 to 4,029, and the high-volume trading structure has loosened somewhat.
IV. Overall Assessment
Technically, the short term is slightly bullish: the moving averages are in bullish order, MACD momentum is expanding, and the overall factor win rate is above 80%. However, both RSI and stochastic RSI are already overbought. Price is trading close to the upper Bollinger band, so the market likely needs a short-term correction. Key support levels are the $77,628 Bollinger middle band and the $77,481 SAR stop-loss. Resistance levels are $78,614 (Bollinger upper band) and the $79,000 psychological round-number level. The CLARITY bill vote and the Fed’s rate decision are expected to land in quick succession within 48 hours. Investors are advised to manage position sizes to mitigate the risk of sharp volatility.
Popular Tokens: T at $0.00519, up 18.22%; CRWDB at $236.59, up 13.09%; SOXSB at $51.51, up 12.47%.
#BitcoinHoldsAbove$77000 #FedHikeOddsRiseTo89% #BitcoinCrosses$78000
3
·
--
Bitcoin $78,000: Bulls vs. Bears in a Tug-of-War—A Full Technical and Macro Panorama on the Eve of the FOMC
1、Market Overview
On the afternoon of September 14, Bitcoin traded in a range of $77,500 to $78,700, with the latest price around $78,430. The hourly chart showed a pattern of initial weakness followed by a rebound. The first three candles dropped from $77,906 to $77,698, then surged back to $78,712. Trading volume expanded in tandem; during the rebound phase it reached 1,141 BTC, far above the prior average of 340 BTC, indicating clearly strengthened buying power.
2、Technical Indicator Readings
The moving average system is arranged in a bullish configuration. The 7-period MA is rising to $77,993, the 25-period MA is at $77,506, and the 99-period MA sits at $77,312. Price is trading above all three lines. EMA7 has crossed above EMA25 at $78,031, confirming a short-term bullish setup.
MACD: The DIF line pulled back from 202 to 186, then surged again to 259. The histogram expanded to 80, and bullish momentum has strengthened once more. RSI shows the 6-period rising to 75.8 into overbought territory. The 12-period at 69.9 and the 24-period at 63.5 remain in a neutral-to-bullish range; the mid-term trend hasn’t weakened, but the short-term may need a correction.
Bollinger Bands: Price rebounded from the $77,445 mid-band to the $78,481 upper-band line. After touching the upper band, there is short-term technical demand for a pullback. KDJ shows a golden cross above the 50 level, but the J value jumped quickly from 26 to 73, leaving limited upside room.
OBV (On-Balance Volume) energy flow rose continuously from 2,425 to 4,619, suggesting sustained capital inflow. ATR widened from $345 to $404, and the increased volatility reflects intensifying competition between bulls and bears. Among 15 quantitative factors, 7 are bullish and 8 are bearish; the composite indicator still issues a bullish signal, with a historical win rate as high as 82.98%.
3、Market Sentiment and Macro Backdrop
On September 15, the U.S. Senate will hold a procedural vote on the CLARITY bill. If it passes, Bernstein analysts believe BTC could move toward $100,000, because the current market is priced with a relatively pessimistic bias. However, the probability of a 25-basis-point rate hike at the Fed’s FOMC meeting is 87%, which would be the first hike since July 2023; tightening expectations are suppressing risk assets below the $80,000 level.
U.S. spot Bitcoin ETFs saw net outflows of $462.7 million last week—about 6,000 BTC—ending three consecutive weeks of net inflows. At the same time, Ethereum ETFs posted net inflows of $197 million, showing signs of rotation of capital from BTC to ETH.
At the corporate level, a certain listed company recently bought 469 BTC worth $36.6 million, while another institution holds 845,000 BTC. Ongoing institutional accumulation at the supply end is forming a strong price floor.
4、Outlook for the Next Stage
In the short term, the key support is $77,480, while resistance lies at $78,712 and the $80,000 psychological level. RSI indicates short-term overbought conditions and hints at pullback risk. With two major macro catalysts—FOMC and the CLARITY bill—approaching, volatility is expected to increase markedly within the next 48 hours. It is advisable to watch the effectiveness of the $77,480 support; if it holds and macro news turns favorable, BTC may challenge $80,000. If support fails, a retest of the $76,600 lower Bollinger Band could follow. Before major events, controlling position size in batches and setting stop-loss orders is a prudent strategy.
5、Trending Tokens
1、T current price $0.00540, 24h change +22.73%
2、REZ current price $0.004501, 24h change +14.33%
3、SOXSB current price $51.55, 24h change +12.92%
#BitcoinHoldsAbove$77000 #FedHikeOddsRiseTo89% #BitcoinCrosses$78000
Bitcoin $78,000: Bulls vs. Bears in a Tug-of-War—A Full Technical and Macro Panorama on the Eve of the FOMC
1、Market Overview
On the afternoon of September 14, Bitcoin traded in a range of $77,500 to $78,700, with the latest price around $78,430. The hourly chart showed a pattern of initial weakness followed by a rebound. The first three candles dropped from $77,906 to $77,698, then surged back to $78,712. Trading volume expanded in tandem; during the rebound phase it reached 1,141 BTC, far above the prior average of 340 BTC, indicating clearly strengthened buying power.
2、Technical Indicator Readings
The moving average system is arranged in a bullish configuration. The 7-period MA is rising to $77,993, the 25-period MA is at $77,506, and the 99-period MA sits at $77,312. Price is trading above all three lines. EMA7 has crossed above EMA25 at $78,031, confirming a short-term bullish setup.
MACD: The DIF line pulled back from 202 to 186, then surged again to 259. The histogram expanded to 80, and bullish momentum has strengthened once more. RSI shows the 6-period rising to 75.8 into overbought territory. The 12-period at 69.9 and the 24-period at 63.5 remain in a neutral-to-bullish range; the mid-term trend hasn’t weakened, but the short-term may need a correction.
Bollinger Bands: Price rebounded from the $77,445 mid-band to the $78,481 upper-band line. After touching the upper band, there is short-term technical demand for a pullback. KDJ shows a golden cross above the 50 level, but the J value jumped quickly from 26 to 73, leaving limited upside room.
OBV (On-Balance Volume) energy flow rose continuously from 2,425 to 4,619, suggesting sustained capital inflow. ATR widened from $345 to $404, and the increased volatility reflects intensifying competition between bulls and bears. Among 15 quantitative factors, 7 are bullish and 8 are bearish; the composite indicator still issues a bullish signal, with a historical win rate as high as 82.98%.
3、Market Sentiment and Macro Backdrop
On September 15, the U.S. Senate will hold a procedural vote on the CLARITY bill. If it passes, Bernstein analysts believe BTC could move toward $100,000, because the current market is priced with a relatively pessimistic bias. However, the probability of a 25-basis-point rate hike at the Fed’s FOMC meeting is 87%, which would be the first hike since July 2023; tightening expectations are suppressing risk assets below the $80,000 level.
U.S. spot Bitcoin ETFs saw net outflows of $462.7 million last week—about 6,000 BTC—ending three consecutive weeks of net inflows. At the same time, Ethereum ETFs posted net inflows of $197 million, showing signs of rotation of capital from BTC to ETH.
At the corporate level, a certain listed company recently bought 469 BTC worth $36.6 million, while another institution holds 845,000 BTC. Ongoing institutional accumulation at the supply end is forming a strong price floor.
4、Outlook for the Next Stage
In the short term, the key support is $77,480, while resistance lies at $78,712 and the $80,000 psychological level. RSI indicates short-term overbought conditions and hints at pullback risk. With two major macro catalysts—FOMC and the CLARITY bill—approaching, volatility is expected to increase markedly within the next 48 hours. It is advisable to watch the effectiveness of the $77,480 support; if it holds and macro news turns favorable, BTC may challenge $80,000. If support fails, a retest of the $76,600 lower Bollinger Band could follow. Before major events, controlling position size in batches and setting stop-loss orders is a prudent strategy.
5、Trending Tokens
1、T current price $0.00540, 24h change +22.73%
2、REZ current price $0.004501, 24h change +14.33%
3、SOXSB current price $51.55, 24h change +12.92%
#BitcoinHoldsAbove$77000 #FedHikeOddsRiseTo89% #BitcoinCrosses$78000
1、Market Overview
On the afternoon of September 14, Bitcoin traded in a range of $77,500 to $78,700, with the latest price around $78,430. The hourly chart showed a pattern of initial weakness followed by a rebound. The first three candles dropped from $77,906 to $77,698, then surged back to $78,712. Trading volume expanded in tandem; during the rebound phase it reached 1,141 BTC, far above the prior average of 340 BTC, indicating clearly strengthened buying power.
2、Technical Indicator Readings
The moving average system is arranged in a bullish configuration. The 7-period MA is rising to $77,993, the 25-period MA is at $77,506, and the 99-period MA sits at $77,312. Price is trading above all three lines. EMA7 has crossed above EMA25 at $78,031, confirming a short-term bullish setup.
MACD: The DIF line pulled back from 202 to 186, then surged again to 259. The histogram expanded to 80, and bullish momentum has strengthened once more. RSI shows the 6-period rising to 75.8 into overbought territory. The 12-period at 69.9 and the 24-period at 63.5 remain in a neutral-to-bullish range; the mid-term trend hasn’t weakened, but the short-term may need a correction.
Bollinger Bands: Price rebounded from the $77,445 mid-band to the $78,481 upper-band line. After touching the upper band, there is short-term technical demand for a pullback. KDJ shows a golden cross above the 50 level, but the J value jumped quickly from 26 to 73, leaving limited upside room.
OBV (On-Balance Volume) energy flow rose continuously from 2,425 to 4,619, suggesting sustained capital inflow. ATR widened from $345 to $404, and the increased volatility reflects intensifying competition between bulls and bears. Among 15 quantitative factors, 7 are bullish and 8 are bearish; the composite indicator still issues a bullish signal, with a historical win rate as high as 82.98%.
3、Market Sentiment and Macro Backdrop
On September 15, the U.S. Senate will hold a procedural vote on the CLARITY bill. If it passes, Bernstein analysts believe BTC could move toward $100,000, because the current market is priced with a relatively pessimistic bias. However, the probability of a 25-basis-point rate hike at the Fed’s FOMC meeting is 87%, which would be the first hike since July 2023; tightening expectations are suppressing risk assets below the $80,000 level.
U.S. spot Bitcoin ETFs saw net outflows of $462.7 million last week—about 6,000 BTC—ending three consecutive weeks of net inflows. At the same time, Ethereum ETFs posted net inflows of $197 million, showing signs of rotation of capital from BTC to ETH.
At the corporate level, a certain listed company recently bought 469 BTC worth $36.6 million, while another institution holds 845,000 BTC. Ongoing institutional accumulation at the supply end is forming a strong price floor.
4、Outlook for the Next Stage
In the short term, the key support is $77,480, while resistance lies at $78,712 and the $80,000 psychological level. RSI indicates short-term overbought conditions and hints at pullback risk. With two major macro catalysts—FOMC and the CLARITY bill—approaching, volatility is expected to increase markedly within the next 48 hours. It is advisable to watch the effectiveness of the $77,480 support; if it holds and macro news turns favorable, BTC may challenge $80,000. If support fails, a retest of the $76,600 lower Bollinger Band could follow. Before major events, controlling position size in batches and setting stop-loss orders is a prudent strategy.
5、Trending Tokens
1、T current price $0.00540, 24h change +22.73%
2、REZ current price $0.004501, 24h change +14.33%
3、SOXSB current price $51.55, 24h change +12.92%
#BitcoinHoldsAbove$77000 #FedHikeOddsRiseTo89% #BitcoinCrosses$78000
13
·
--
Recent Comprehensive Market Analysis and Outlook for Ethereum (ETH)
1. Market Overview
Ethereum is currently trading around $2,513. Based on recent candlestick patterns, ETH faced resistance at the $2,525 high and then pulled back, reaching a low of $2,505. It subsequently rebounded slightly to $2,515. Overall, the trading range has narrowed, and the market has entered a phase of directional selection. The hourly trading volume has gradually declined from $49.0 million to $9.39 million, indicating that both bulls and bears are waiting on the sidelines for catalysts to break the deadlock.
2. Interpretation of Technical Indicators
Regarding moving averages, the 7-period moving average at $2,516.9 is slightly above the current price, acting as short-term resistance. The 25-period moving average at $2,503.7 and the 99-period moving average at $2,502.5 are both below the price, providing support. The EMA indicators show EMA7 at $2,514.4 and EMA25 at $2,509.1; the gap between the short-term and mid-term moving averages is narrowing, suggesting that the price is about to face a directional breakout.
The MACD indicator shows a DIF value of 3.19, a DEA signal line of 1.73, and a histogram of 1.45. Although MACD remains above the zero line, the histogram has been continuously shrinking—from 3.61 down to 1.45—indicating that bullish momentum has clearly weakened. If DIF and DEA form a bearish “death cross” afterward, it would confirm a short-term bearish signal.
For the RSI indicator, the 6-period RSI is 53.89, the 12-period RSI is 54.02, and the 24-period RSI is 52.12. All three lines are hovering in the neutral zone, showing no strong overbought or oversold signals. However, the KDJ indicators show a clear divergence: K is 45.2, D is 61.3, and J is only 13.0. The J line sharply falls below the K and D lines, forming a bearish cross. This calls for caution regarding the risk of a short-term pullback.
On the Bollinger Bands, the upper band is at $2,534.5, the middle band at $2,507.3, and the lower band at $2,480.2. Price is moving near the middle band. The Bollinger Band opening is slightly narrowing, implying declining volatility and that a potential turning point is approaching. The ATR indicator has fallen from 15.31 to 14.37, further confirming volatility contraction. The SAR Parabolic indicator is at $2,496.9, below the current price, maintaining a bullish signal. The SuperTrend indicator is at $2,479.3, which also supports the bullish setup.
3. Analysis of Bull/Bear Factors
A comprehensive quantitative model shows that among 15 factors, 7 are bullish, 7 are bearish, and 1 is neutral—making the bull/bear ratio perfectly symmetrical. The composite signal points toward the bearish side. The historical win rate is 65.96%, with bearish win rate at 63.16% and bullish win rate at 77.78%. Notably, although the composite signal is bearish, the bullish factors have a higher historical win rate, suggesting that if the direction reverses upward, the upward move could be stronger.
The OBV (On-Balance Volume) energy flow indicator is negative and keeps declining, falling from -13,779 to -23,212. This indicates that sell pressure has increased recently and that capital is flowing out on a net basis. The Williams %R (WR) is negative at -28.31, sitting in a neutral-to-slightly-bullish area but weakening at the margin. The standard deviation has risen from 3.24 to 5.0, meaning market disagreement has increased.
4. Market Sentiment and Capital Flows
Institutional capital: Ethereum spot ETF net inflows totaled $197 million last week. Among them, BlackRock’s single ETHA product attracted $140 million, maintaining positive inflows for four consecutive weeks. In stark contrast, Bitcoin ETF net flows in the same period were a net outflow of $463 million, indicating institutional capital is rotating from Bitcoin to Ethereum. If this trend continues, it will provide solid support for ETH price.
At the macro level, the probability of the Fed raising rates by 25 basis points at the September 16 FOMC meeting is as high as 87%. Goldman Sachs has already adjusted its prior expectation of keeping rates unchanged to a hike. This macro headwind adds pressure to the broader crypto market. In addition, Wintermute has accumulated $38.47 million worth of ETH short positions on perpetual contracts, so the market should closely monitor the large short exposure held by market makers.
5. Forward Look: Key Events
On September 15, the U.S. Senate will conduct a procedural vote on the CLARITY Act, requiring 60 votes to advance. The bill aims to clarify the regulatory attribution of crypto assets. If passed, it would significantly boost market sentiment. Currently, market positioning leans bearish, so any positive outcome could trigger short covering and drive prices upward quickly. From a technical perspective, the ETH chart is forming a triangular pattern; the post-breakout target could be around $3,000.
6. Comprehensive Assessment and Strategy Suggestions
ETH is at a critical equilibrium point between bulls and bears. In the short term, the technical picture is bearish: the KDJ death cross and the narrowing MACD histogram both signal pullback risk. However, ETF inflows and the expectation of regulatory positives provide fundamental support. It is recommended that investors watch whether resistance above $2,525 can be broken. If ETH can effectively reclaim and hold above $2,535 (the upper Bollinger Band), it may open up room to the upside. If ETH breaks below the $2,480 lower Bollinger Band, it could accelerate a retest of the $2,479 SuperTrend support. Before clarity emerges regarding the CLARITY Act vote and the FOMC meeting outcome, it is advised to trade with light positions and strictly control risk.
7. Today’s Trending Tokens
QKC (QuarkChain): current price $0.003358; 24-hour change +36.56%
FIL (Filecoin): current price $0.9947; 24-hour change +19.50%
IOTA: current price $0.0466; 24-hour change +15.35%
#BitcoinCrosses$78000 #AvalancheIntegratesIntoUAEPassDigitalVault #UKSeeksViewsOnTokenizingGold
Recent Comprehensive Market Analysis and Outlook for Ethereum (ETH)
1. Market Overview
Ethereum is currently trading around $2,513. Based on recent candlestick patterns, ETH faced resistance at the $2,525 high and then pulled back, reaching a low of $2,505. It subsequently rebounded slightly to $2,515. Overall, the trading range has narrowed, and the market has entered a phase of directional selection. The hourly trading volume has gradually declined from $49.0 million to $9.39 million, indicating that both bulls and bears are waiting on the sidelines for catalysts to break the deadlock.
2. Interpretation of Technical Indicators
Regarding moving averages, the 7-period moving average at $2,516.9 is slightly above the current price, acting as short-term resistance. The 25-period moving average at $2,503.7 and the 99-period moving average at $2,502.5 are both below the price, providing support. The EMA indicators show EMA7 at $2,514.4 and EMA25 at $2,509.1; the gap between the short-term and mid-term moving averages is narrowing, suggesting that the price is about to face a directional breakout.
The MACD indicator shows a DIF value of 3.19, a DEA signal line of 1.73, and a histogram of 1.45. Although MACD remains above the zero line, the histogram has been continuously shrinking—from 3.61 down to 1.45—indicating that bullish momentum has clearly weakened. If DIF and DEA form a bearish “death cross” afterward, it would confirm a short-term bearish signal.
For the RSI indicator, the 6-period RSI is 53.89, the 12-period RSI is 54.02, and the 24-period RSI is 52.12. All three lines are hovering in the neutral zone, showing no strong overbought or oversold signals. However, the KDJ indicators show a clear divergence: K is 45.2, D is 61.3, and J is only 13.0. The J line sharply falls below the K and D lines, forming a bearish cross. This calls for caution regarding the risk of a short-term pullback.
On the Bollinger Bands, the upper band is at $2,534.5, the middle band at $2,507.3, and the lower band at $2,480.2. Price is moving near the middle band. The Bollinger Band opening is slightly narrowing, implying declining volatility and that a potential turning point is approaching. The ATR indicator has fallen from 15.31 to 14.37, further confirming volatility contraction. The SAR Parabolic indicator is at $2,496.9, below the current price, maintaining a bullish signal. The SuperTrend indicator is at $2,479.3, which also supports the bullish setup.
3. Analysis of Bull/Bear Factors
A comprehensive quantitative model shows that among 15 factors, 7 are bullish, 7 are bearish, and 1 is neutral—making the bull/bear ratio perfectly symmetrical. The composite signal points toward the bearish side. The historical win rate is 65.96%, with bearish win rate at 63.16% and bullish win rate at 77.78%. Notably, although the composite signal is bearish, the bullish factors have a higher historical win rate, suggesting that if the direction reverses upward, the upward move could be stronger.
The OBV (On-Balance Volume) energy flow indicator is negative and keeps declining, falling from -13,779 to -23,212. This indicates that sell pressure has increased recently and that capital is flowing out on a net basis. The Williams %R (WR) is negative at -28.31, sitting in a neutral-to-slightly-bullish area but weakening at the margin. The standard deviation has risen from 3.24 to 5.0, meaning market disagreement has increased.
4. Market Sentiment and Capital Flows
Institutional capital: Ethereum spot ETF net inflows totaled $197 million last week. Among them, BlackRock’s single ETHA product attracted $140 million, maintaining positive inflows for four consecutive weeks. In stark contrast, Bitcoin ETF net flows in the same period were a net outflow of $463 million, indicating institutional capital is rotating from Bitcoin to Ethereum. If this trend continues, it will provide solid support for ETH price.
At the macro level, the probability of the Fed raising rates by 25 basis points at the September 16 FOMC meeting is as high as 87%. Goldman Sachs has already adjusted its prior expectation of keeping rates unchanged to a hike. This macro headwind adds pressure to the broader crypto market. In addition, Wintermute has accumulated $38.47 million worth of ETH short positions on perpetual contracts, so the market should closely monitor the large short exposure held by market makers.
5. Forward Look: Key Events
On September 15, the U.S. Senate will conduct a procedural vote on the CLARITY Act, requiring 60 votes to advance. The bill aims to clarify the regulatory attribution of crypto assets. If passed, it would significantly boost market sentiment. Currently, market positioning leans bearish, so any positive outcome could trigger short covering and drive prices upward quickly. From a technical perspective, the ETH chart is forming a triangular pattern; the post-breakout target could be around $3,000.
6. Comprehensive Assessment and Strategy Suggestions
ETH is at a critical equilibrium point between bulls and bears. In the short term, the technical picture is bearish: the KDJ death cross and the narrowing MACD histogram both signal pullback risk. However, ETF inflows and the expectation of regulatory positives provide fundamental support. It is recommended that investors watch whether resistance above $2,525 can be broken. If ETH can effectively reclaim and hold above $2,535 (the upper Bollinger Band), it may open up room to the upside. If ETH breaks below the $2,480 lower Bollinger Band, it could accelerate a retest of the $2,479 SuperTrend support. Before clarity emerges regarding the CLARITY Act vote and the FOMC meeting outcome, it is advised to trade with light positions and strictly control risk.
7. Today’s Trending Tokens
QKC (QuarkChain): current price $0.003358; 24-hour change +36.56%
FIL (Filecoin): current price $0.9947; 24-hour change +19.50%
IOTA: current price $0.0466; 24-hour change +15.35%
#BitcoinCrosses$78000 #AvalancheIntegratesIntoUAEPassDigitalVault #UKSeeksViewsOnTokenizingGold
1. Market Overview
Ethereum is currently trading around $2,513. Based on recent candlestick patterns, ETH faced resistance at the $2,525 high and then pulled back, reaching a low of $2,505. It subsequently rebounded slightly to $2,515. Overall, the trading range has narrowed, and the market has entered a phase of directional selection. The hourly trading volume has gradually declined from $49.0 million to $9.39 million, indicating that both bulls and bears are waiting on the sidelines for catalysts to break the deadlock.
2. Interpretation of Technical Indicators
Regarding moving averages, the 7-period moving average at $2,516.9 is slightly above the current price, acting as short-term resistance. The 25-period moving average at $2,503.7 and the 99-period moving average at $2,502.5 are both below the price, providing support. The EMA indicators show EMA7 at $2,514.4 and EMA25 at $2,509.1; the gap between the short-term and mid-term moving averages is narrowing, suggesting that the price is about to face a directional breakout.
The MACD indicator shows a DIF value of 3.19, a DEA signal line of 1.73, and a histogram of 1.45. Although MACD remains above the zero line, the histogram has been continuously shrinking—from 3.61 down to 1.45—indicating that bullish momentum has clearly weakened. If DIF and DEA form a bearish “death cross” afterward, it would confirm a short-term bearish signal.
For the RSI indicator, the 6-period RSI is 53.89, the 12-period RSI is 54.02, and the 24-period RSI is 52.12. All three lines are hovering in the neutral zone, showing no strong overbought or oversold signals. However, the KDJ indicators show a clear divergence: K is 45.2, D is 61.3, and J is only 13.0. The J line sharply falls below the K and D lines, forming a bearish cross. This calls for caution regarding the risk of a short-term pullback.
On the Bollinger Bands, the upper band is at $2,534.5, the middle band at $2,507.3, and the lower band at $2,480.2. Price is moving near the middle band. The Bollinger Band opening is slightly narrowing, implying declining volatility and that a potential turning point is approaching. The ATR indicator has fallen from 15.31 to 14.37, further confirming volatility contraction. The SAR Parabolic indicator is at $2,496.9, below the current price, maintaining a bullish signal. The SuperTrend indicator is at $2,479.3, which also supports the bullish setup.
3. Analysis of Bull/Bear Factors
A comprehensive quantitative model shows that among 15 factors, 7 are bullish, 7 are bearish, and 1 is neutral—making the bull/bear ratio perfectly symmetrical. The composite signal points toward the bearish side. The historical win rate is 65.96%, with bearish win rate at 63.16% and bullish win rate at 77.78%. Notably, although the composite signal is bearish, the bullish factors have a higher historical win rate, suggesting that if the direction reverses upward, the upward move could be stronger.
The OBV (On-Balance Volume) energy flow indicator is negative and keeps declining, falling from -13,779 to -23,212. This indicates that sell pressure has increased recently and that capital is flowing out on a net basis. The Williams %R (WR) is negative at -28.31, sitting in a neutral-to-slightly-bullish area but weakening at the margin. The standard deviation has risen from 3.24 to 5.0, meaning market disagreement has increased.
4. Market Sentiment and Capital Flows
Institutional capital: Ethereum spot ETF net inflows totaled $197 million last week. Among them, BlackRock’s single ETHA product attracted $140 million, maintaining positive inflows for four consecutive weeks. In stark contrast, Bitcoin ETF net flows in the same period were a net outflow of $463 million, indicating institutional capital is rotating from Bitcoin to Ethereum. If this trend continues, it will provide solid support for ETH price.
At the macro level, the probability of the Fed raising rates by 25 basis points at the September 16 FOMC meeting is as high as 87%. Goldman Sachs has already adjusted its prior expectation of keeping rates unchanged to a hike. This macro headwind adds pressure to the broader crypto market. In addition, Wintermute has accumulated $38.47 million worth of ETH short positions on perpetual contracts, so the market should closely monitor the large short exposure held by market makers.
5. Forward Look: Key Events
On September 15, the U.S. Senate will conduct a procedural vote on the CLARITY Act, requiring 60 votes to advance. The bill aims to clarify the regulatory attribution of crypto assets. If passed, it would significantly boost market sentiment. Currently, market positioning leans bearish, so any positive outcome could trigger short covering and drive prices upward quickly. From a technical perspective, the ETH chart is forming a triangular pattern; the post-breakout target could be around $3,000.
6. Comprehensive Assessment and Strategy Suggestions
ETH is at a critical equilibrium point between bulls and bears. In the short term, the technical picture is bearish: the KDJ death cross and the narrowing MACD histogram both signal pullback risk. However, ETF inflows and the expectation of regulatory positives provide fundamental support. It is recommended that investors watch whether resistance above $2,525 can be broken. If ETH can effectively reclaim and hold above $2,535 (the upper Bollinger Band), it may open up room to the upside. If ETH breaks below the $2,480 lower Bollinger Band, it could accelerate a retest of the $2,479 SuperTrend support. Before clarity emerges regarding the CLARITY Act vote and the FOMC meeting outcome, it is advised to trade with light positions and strictly control risk.
7. Today’s Trending Tokens
QKC (QuarkChain): current price $0.003358; 24-hour change +36.56%
FIL (Filecoin): current price $0.9947; 24-hour change +19.50%
IOTA: current price $0.0466; 24-hour change +15.35%
#BitcoinCrosses$78000 #AvalancheIntegratesIntoUAEPassDigitalVault #UKSeeksViewsOnTokenizingGold
4

The conversation in the community is on fire with the week’s moves. Seeing #BitcoinHoldsAbove$77000 and the brutal moment when #BitcoinCrosses$78000 becomes a trend shows that the bulls are in full control of the board. 🐂🔥
Many people get stuck analyzing the past, but those of us in this Publique y Gana challenge know that the time to act and position ourselves is now. Price sets the pace, but strategy determines who reaps the rewards.
👇 I want you to tell me in the comments: Do you think this momentum will break through the 80k resistance in the next few days, or will there be a surprising correction?
Hit the share button if you’re going all-in this month and add your Bitcoin chart. We didn’t come here to watch—we came to win! 💪✨
$BTC #bitcoin #crypto #trading #BinanceSquareBTC #BitcoinCrosses $78000 #BitcoinHoldsAbove$77000🚨 The market doesn’t give a break! Bitcoin blows expectations out of the water. 🚀
{future}(BTCUSDT)
The conversation in the community is on fire with the week’s moves. Seeing #BitcoinHoldsAbove$77000 and the brutal moment when #BitcoinCrosses$78000 becomes a trend shows that the bulls are in full control of the board. 🐂🔥
Many people get stuck analyzing the past, but those of us in this Publique y Gana challenge know that the time to act and position ourselves is now. Price sets the pace, but strategy determines who reaps the rewards.
👇 I want you to tell me in the comments: Do you think this momentum will break through the 80k resistance in the next few days, or will there be a surprising correction?
Hit the share button if you’re going all-in this month and add your Bitcoin chart. We didn’t come here to watch—we came to win! 💪✨
$BTC #bitcoin #crypto #trading #BinanceSquareBTC #BitcoinCrosses $78000 #BitcoinHoldsAbove$77000🚨 The market doesn’t give a break! Bitcoin blows expectations out of the water. 🚀
Many people get stuck analyzing the past, but those of us in this Publique y Gana challenge know that the time to act and position ourselves is now. Price sets the pace, but strategy determines who reaps the rewards.
👇 I want you to tell me in the comments: Do you think this momentum will break through the 80k resistance in the next few days, or will there be a surprising correction?
Hit the share button if you’re going all-in this month and add your Bitcoin chart. We didn’t come here to watch—we came to win! 💪✨
$BTC #bitcoin #crypto #trading #BinanceSquareBTC #BitcoinCrosses $78000 #BitcoinHoldsAbove$77000🚨 The market doesn’t give a break! Bitcoin blows expectations out of the water. 🚀

93
·
--
I. Market Overview
As of 16:00 on September 14, 2026 (UTC), Bitcoin (BTC) latest price is $78,625. Over the past 24 hours, the price has risen from $77,698 to around $78,888, an increase of approximately 1.5%. From the hourly chart, the past 5 candlesticks show a steady upward push. The high reached $78,985, and the price has been trading above the moving average system, indicating a clear short-term bullish structure. In terms of trading volume, the first two hourly candles recorded trading amounts of $89.05 million and $102 million, respectively, before falling to $52.19 million and $21.97 million afterward. This suggests that volume expanded noticeably at the beginning of the rally, but the strength of buying has weakened since then. Watch to see whether volume can continue to increase and support a breakthrough above the $79,000 level.
II. Interpretation of Technical Indicators
The moving average system shows a bullish alignment: MA7 (78,342) is greater than MA25 (77,689) and greater than MA99 (77,359). EMA7 (78,459) is greater than EMA25 (77,860) and greater than EMA99 (77,637). All short-, mid-, and long-term moving averages are diverging upward, forming a typical trend-following upward structure. In the MACD indicator, the fast line is 376.03, the slow line is 259.02, and the histogram value 117.00 continues to expand, indicating strengthening bullish momentum and no signs of a top divergence yet. For the Bollinger Bands, the price is trading near the upper band around 78,985; the middle band is 77,781 and the lower band is 76,577. Touching the upper band usually means short-term strength but also introduces downside pressure and potential pullbacks. In the RSI indicators, RSI6 is at 82.22, RSI12 is 74.42, and RSI24 is 66.69—already in the overbought zone. For the KDJ indicator, K is 84.79, D is 77.11, and J is 100.17; with J breaking above 100, the short-term condition is extremely overbought. The stochastic RSI is also at 100, further signaling higher risk of chasing at current levels. ATR (14) is 397, indicating moderate volatility. OBV has risen from 3,194 to 6,353, showing continuous accumulation of volume that supports the price increase. The Parabolic SAR is currently at 77,854, below the current price, meaning the long-side stop-loss line is gradually moving up. The William’s %R (WR) is -6.08, close to 0, placing the short-term market in an overbought extreme area.
III. Long/Short Factors and Composite Signals
The system monitors 15 quantitative factors in total: 8 are bullish and 7 are bearish, with longs accounting for 53.33%. However, the composite signal value is around -1.10, which leans bearish. The historical win rate is 80.77%, suggesting that at the current price level there is short-term pullback risk. Specifically: the MA5 factor is bullish (win rate 46.94%); RSI14 is bearish (win rate 28.57%); Alpha1 is bullish (win rate 51.02%); Alpha3 is bearish (win rate 46.94%); Alpha7 is bearish (win rate 61.22%); Alpha9 is bullish (win rate 57.14%); Alpha15 is bullish (win rate 51.02%); Alpha29 is bullish (win rate 44.90%); Alpha33 is bullish (win rate 59.18%); Alpha34 is bullish (win rate 61.22%). Long and short factors are fairly balanced, but the composite signal more strongly favors a short-term pullback. It is advisable to avoid chasing gains and instead wait for a pullback toward moving average support before considering positioning.
IV. Market Sentiment and Macro Analysis
Current market sentiment shows a complex mix of both bullish and bearish forces. On one hand, the U.S. Senate is scheduled to hold a procedural vote on September 15 regarding the Digital Asset Market Structure Clarity Act (CLARITY Act). It requires 60 votes to move forward, making it the most influential crypto regulatory event of 2026. Bernstein analysts noted that if the bill progresses smoothly, BTC could be poised to challenge $100,000. On the other hand, the probability of the Federal Reserve raising rates by 25 basis points at the September 15–16 FOMC meeting is as high as 87%. This would be the first rate hike since July 2023. Strong August inflation data has fueled hawkish expectations. As a result, last week U.S. spot BTC ETFs saw net outflows of $462.7 million, ending the prior three consecutive weeks of net inflows. In contrast, ETH ETFs recorded net inflows of $197 million against the trend for four straight weeks, suggesting capital may be rotating from BTC toward ETH. Additionally, Strategy (formerly MicroStrategy) has now gone three consecutive weeks without buying BTC, keeping its holdings unchanged at 845,050 BTC. Meanwhile, it spent $139.3 million to repurchase its own STRC preferred shares, indicating a marginal slowdown in corporate buying demand. CryptoQuant stated that BTC needs to break above $81,700 to confirm the start of a new bull cycle. Overall, in the short term the market faces both macro pressure and regulatory catalysts, so volatility is expected to rise.
V. Trending Tokens and Topics
Among today’s top gainers, these three tokens are worth watching: ARK is currently $0.1694, up 18.88% in 24 hours, with a high of $0.2143 and $13.29 million in trading volume; MTL is currently $0.320, up 14.70%, with a high of $0.433 and $6.11 million in trading volume; QKC is currently $0.002751, up 14.48%, with a high of $0.003588 and $2.78 million in trading volume. All three are mid-to-small market cap projects with relatively large short-term fluctuations, so participants should pay close attention to risk management.
#BitcoinHoldsAbove$77000 #FedHikeOddsRiseTo89% #BitcoinCrosses$78000
I. Market Overview
As of 16:00 on September 14, 2026 (UTC), Bitcoin (BTC) latest price is $78,625. Over the past 24 hours, the price has risen from $77,698 to around $78,888, an increase of approximately 1.5%. From the hourly chart, the past 5 candlesticks show a steady upward push. The high reached $78,985, and the price has been trading above the moving average system, indicating a clear short-term bullish structure. In terms of trading volume, the first two hourly candles recorded trading amounts of $89.05 million and $102 million, respectively, before falling to $52.19 million and $21.97 million afterward. This suggests that volume expanded noticeably at the beginning of the rally, but the strength of buying has weakened since then. Watch to see whether volume can continue to increase and support a breakthrough above the $79,000 level.
II. Interpretation of Technical Indicators
The moving average system shows a bullish alignment: MA7 (78,342) is greater than MA25 (77,689) and greater than MA99 (77,359). EMA7 (78,459) is greater than EMA25 (77,860) and greater than EMA99 (77,637). All short-, mid-, and long-term moving averages are diverging upward, forming a typical trend-following upward structure. In the MACD indicator, the fast line is 376.03, the slow line is 259.02, and the histogram value 117.00 continues to expand, indicating strengthening bullish momentum and no signs of a top divergence yet. For the Bollinger Bands, the price is trading near the upper band around 78,985; the middle band is 77,781 and the lower band is 76,577. Touching the upper band usually means short-term strength but also introduces downside pressure and potential pullbacks. In the RSI indicators, RSI6 is at 82.22, RSI12 is 74.42, and RSI24 is 66.69—already in the overbought zone. For the KDJ indicator, K is 84.79, D is 77.11, and J is 100.17; with J breaking above 100, the short-term condition is extremely overbought. The stochastic RSI is also at 100, further signaling higher risk of chasing at current levels. ATR (14) is 397, indicating moderate volatility. OBV has risen from 3,194 to 6,353, showing continuous accumulation of volume that supports the price increase. The Parabolic SAR is currently at 77,854, below the current price, meaning the long-side stop-loss line is gradually moving up. The William’s %R (WR) is -6.08, close to 0, placing the short-term market in an overbought extreme area.
III. Long/Short Factors and Composite Signals
The system monitors 15 quantitative factors in total: 8 are bullish and 7 are bearish, with longs accounting for 53.33%. However, the composite signal value is around -1.10, which leans bearish. The historical win rate is 80.77%, suggesting that at the current price level there is short-term pullback risk. Specifically: the MA5 factor is bullish (win rate 46.94%); RSI14 is bearish (win rate 28.57%); Alpha1 is bullish (win rate 51.02%); Alpha3 is bearish (win rate 46.94%); Alpha7 is bearish (win rate 61.22%); Alpha9 is bullish (win rate 57.14%); Alpha15 is bullish (win rate 51.02%); Alpha29 is bullish (win rate 44.90%); Alpha33 is bullish (win rate 59.18%); Alpha34 is bullish (win rate 61.22%). Long and short factors are fairly balanced, but the composite signal more strongly favors a short-term pullback. It is advisable to avoid chasing gains and instead wait for a pullback toward moving average support before considering positioning.
IV. Market Sentiment and Macro Analysis
Current market sentiment shows a complex mix of both bullish and bearish forces. On one hand, the U.S. Senate is scheduled to hold a procedural vote on September 15 regarding the Digital Asset Market Structure Clarity Act (CLARITY Act). It requires 60 votes to move forward, making it the most influential crypto regulatory event of 2026. Bernstein analysts noted that if the bill progresses smoothly, BTC could be poised to challenge $100,000. On the other hand, the probability of the Federal Reserve raising rates by 25 basis points at the September 15–16 FOMC meeting is as high as 87%. This would be the first rate hike since July 2023. Strong August inflation data has fueled hawkish expectations. As a result, last week U.S. spot BTC ETFs saw net outflows of $462.7 million, ending the prior three consecutive weeks of net inflows. In contrast, ETH ETFs recorded net inflows of $197 million against the trend for four straight weeks, suggesting capital may be rotating from BTC toward ETH. Additionally, Strategy (formerly MicroStrategy) has now gone three consecutive weeks without buying BTC, keeping its holdings unchanged at 845,050 BTC. Meanwhile, it spent $139.3 million to repurchase its own STRC preferred shares, indicating a marginal slowdown in corporate buying demand. CryptoQuant stated that BTC needs to break above $81,700 to confirm the start of a new bull cycle. Overall, in the short term the market faces both macro pressure and regulatory catalysts, so volatility is expected to rise.
V. Trending Tokens and Topics
Among today’s top gainers, these three tokens are worth watching: ARK is currently $0.1694, up 18.88% in 24 hours, with a high of $0.2143 and $13.29 million in trading volume; MTL is currently $0.320, up 14.70%, with a high of $0.433 and $6.11 million in trading volume; QKC is currently $0.002751, up 14.48%, with a high of $0.003588 and $2.78 million in trading volume. All three are mid-to-small market cap projects with relatively large short-term fluctuations, so participants should pay close attention to risk management.
#BitcoinHoldsAbove$77000 #FedHikeOddsRiseTo89% #BitcoinCrosses$78000
As of 16:00 on September 14, 2026 (UTC), Bitcoin (BTC) latest price is $78,625. Over the past 24 hours, the price has risen from $77,698 to around $78,888, an increase of approximately 1.5%. From the hourly chart, the past 5 candlesticks show a steady upward push. The high reached $78,985, and the price has been trading above the moving average system, indicating a clear short-term bullish structure. In terms of trading volume, the first two hourly candles recorded trading amounts of $89.05 million and $102 million, respectively, before falling to $52.19 million and $21.97 million afterward. This suggests that volume expanded noticeably at the beginning of the rally, but the strength of buying has weakened since then. Watch to see whether volume can continue to increase and support a breakthrough above the $79,000 level.
II. Interpretation of Technical Indicators
The moving average system shows a bullish alignment: MA7 (78,342) is greater than MA25 (77,689) and greater than MA99 (77,359). EMA7 (78,459) is greater than EMA25 (77,860) and greater than EMA99 (77,637). All short-, mid-, and long-term moving averages are diverging upward, forming a typical trend-following upward structure. In the MACD indicator, the fast line is 376.03, the slow line is 259.02, and the histogram value 117.00 continues to expand, indicating strengthening bullish momentum and no signs of a top divergence yet. For the Bollinger Bands, the price is trading near the upper band around 78,985; the middle band is 77,781 and the lower band is 76,577. Touching the upper band usually means short-term strength but also introduces downside pressure and potential pullbacks. In the RSI indicators, RSI6 is at 82.22, RSI12 is 74.42, and RSI24 is 66.69—already in the overbought zone. For the KDJ indicator, K is 84.79, D is 77.11, and J is 100.17; with J breaking above 100, the short-term condition is extremely overbought. The stochastic RSI is also at 100, further signaling higher risk of chasing at current levels. ATR (14) is 397, indicating moderate volatility. OBV has risen from 3,194 to 6,353, showing continuous accumulation of volume that supports the price increase. The Parabolic SAR is currently at 77,854, below the current price, meaning the long-side stop-loss line is gradually moving up. The William’s %R (WR) is -6.08, close to 0, placing the short-term market in an overbought extreme area.
III. Long/Short Factors and Composite Signals
The system monitors 15 quantitative factors in total: 8 are bullish and 7 are bearish, with longs accounting for 53.33%. However, the composite signal value is around -1.10, which leans bearish. The historical win rate is 80.77%, suggesting that at the current price level there is short-term pullback risk. Specifically: the MA5 factor is bullish (win rate 46.94%); RSI14 is bearish (win rate 28.57%); Alpha1 is bullish (win rate 51.02%); Alpha3 is bearish (win rate 46.94%); Alpha7 is bearish (win rate 61.22%); Alpha9 is bullish (win rate 57.14%); Alpha15 is bullish (win rate 51.02%); Alpha29 is bullish (win rate 44.90%); Alpha33 is bullish (win rate 59.18%); Alpha34 is bullish (win rate 61.22%). Long and short factors are fairly balanced, but the composite signal more strongly favors a short-term pullback. It is advisable to avoid chasing gains and instead wait for a pullback toward moving average support before considering positioning.
IV. Market Sentiment and Macro Analysis
Current market sentiment shows a complex mix of both bullish and bearish forces. On one hand, the U.S. Senate is scheduled to hold a procedural vote on September 15 regarding the Digital Asset Market Structure Clarity Act (CLARITY Act). It requires 60 votes to move forward, making it the most influential crypto regulatory event of 2026. Bernstein analysts noted that if the bill progresses smoothly, BTC could be poised to challenge $100,000. On the other hand, the probability of the Federal Reserve raising rates by 25 basis points at the September 15–16 FOMC meeting is as high as 87%. This would be the first rate hike since July 2023. Strong August inflation data has fueled hawkish expectations. As a result, last week U.S. spot BTC ETFs saw net outflows of $462.7 million, ending the prior three consecutive weeks of net inflows. In contrast, ETH ETFs recorded net inflows of $197 million against the trend for four straight weeks, suggesting capital may be rotating from BTC toward ETH. Additionally, Strategy (formerly MicroStrategy) has now gone three consecutive weeks without buying BTC, keeping its holdings unchanged at 845,050 BTC. Meanwhile, it spent $139.3 million to repurchase its own STRC preferred shares, indicating a marginal slowdown in corporate buying demand. CryptoQuant stated that BTC needs to break above $81,700 to confirm the start of a new bull cycle. Overall, in the short term the market faces both macro pressure and regulatory catalysts, so volatility is expected to rise.
V. Trending Tokens and Topics
Among today’s top gainers, these three tokens are worth watching: ARK is currently $0.1694, up 18.88% in 24 hours, with a high of $0.2143 and $13.29 million in trading volume; MTL is currently $0.320, up 14.70%, with a high of $0.433 and $6.11 million in trading volume; QKC is currently $0.002751, up 14.48%, with a high of $0.003588 and $2.78 million in trading volume. All three are mid-to-small market cap projects with relatively large short-term fluctuations, so participants should pay close attention to risk management.
#BitcoinHoldsAbove$77000 #FedHikeOddsRiseTo89% #BitcoinCrosses$78000
·
--
1. Overview of Ethereum Price Trend
As of 16:00 on September 14, 2026 (UTC), Ethereum (ETH) latest price is $2,521. Over the past few hours, the price has steadily risen from around $2,500 to above $2,530. From the hourly candlestick chart, after ETH received effective support at $2,487, it has continued to rebound, topping out at $2,537. The short-term trend is bullish. In terms of trading volume, the recent one-hour trading value reached $45.64 million, up significantly from $35.79 million in the prior hour, indicating that long positions are gradually entering the market. However, from a more macro perspective, ETH is still trading within the narrow range of $2,500 to $2,540 and has not yet formed a trend-breaking breakout.
2. In-Depth Interpretation of Technical Indicators
Moving averages: MA7 ($2,511), MA25 ($2,508), and MA99 ($2,505) are in a bullish alignment. The price is trading above all three moving averages, suggesting a bullish short-term bias. EMA7 ($2,516) is higher than EMA25 ($2,510) and EMA99 ($2,505), which also sends a bullish signal.
MACD: The DIF value is 3.38, DEA is 1.85, and the histogram is 1.53. MACD has already formed a golden cross and continues to expand, meaning bullish momentum is strengthening. This is an important technical support for the recent rebound.
RSI: RSI6 is 68.3, RSI12 is 60.9, and RSI24 is 55.6. The short-term RSI is approaching the overbought region near 70, implying that chasing longs in the short term should be done cautiously. Stoch RSI is 75.1, which has entered the overbought zone, so a short-term technical pullback is possible.
KDJ: K is 60.9, D is 51.0, and J is 80.7. A relatively high J suggests that short-term bullish sentiment is hot, but the gap between K and D has narrowed, so investors should be alert to dulling risk after a golden cross.
Bollinger Bands: Upper band is $2,538, middle band is $2,508, and lower band is $2,478. The price is nearing the upper band. If it cannot break through the resistance zone of $2,538 to $2,540 effectively, it may fall back toward the middle band to test support.
SAR Parabolic: SAR is currently at $2,488. Price has been trading above SAR, confirming a short-term bullish setup. ATR is $16.78, indicating moderate volatility without any extreme volatility signals.
OBV: OBV has been converging from negative territory and has improved from -69,267 to 11,847, suggesting that buying power is strengthening and that money inflows are evident.
Based on 15 composite technical factors: 7 are bullish, 7 are bearish, and 1 is neutral. Overall, long and short forces are fairly balanced. The composite indicator signal is slightly bearish, and the historical win rate is as high as 82.61%, so investors should remain vigilant about short-term pullback risk.
3. Analysis of Market Sentiment and Capital Flows
Fundamentals: Ethereum spot ETF recorded a net inflow of $197 million last week. On September 11 alone, it saw a daily net inflow of $216 million, maintaining a net inflow streak for four consecutive weeks. Meanwhile, Bitcoin ETF saw a net outflow of $463 million, making the capital rotation signal quite clear. The ETH/BTC ratio has risen to the highest level since the end of January, reflecting increasing market preference for Ethereum.
Corporate level: A technology company reportedly spent 27,180 ETH to purchase them as strategic reserves. Institutional funds continue to enter, providing support for the price. In addition, major asset management firms are incorporating digital assets into traditional wealth management model portfolios, and structural demand is taking shape.
Risks cannot be ignored, however. First, on September 15, the U.S. Senate will hold a key vote on the CLARITY bill. The bill needs 60 votes to move forward, and there is currently a lack of bipartisan consensus, resulting in relatively high policy uncertainty. Second, the probability of a Fed rate hike on September 16 has risen to 87%. The target interest rate range will increase to 3.75%–4.00%, and tighter macro liquidity will put pressure on risk assets. Third, institutional market makers and capital funds have established perpetual short positions with a notional value exceeding $460 million, with the short position size being large. At the same time, more than $188 million worth of ETH has been transferred to institutional exchange wallets, and combined with scheduled “whale” recharges, near-term sell-pressure risk is rising.
4. Comprehensive Outlook and Trading Suggestions
Considering both technicals and fundamentals: ETH’s short-term technical structure is bullish, but it is already nearing the overbought zone. The key resistance levels are $2,538 to $2,540. If it can break through effectively and hold above $2,540, it may open up upward room toward $2,560 to $2,580. If it is rejected and pulls back, $2,508 (the Bollinger middle band) and $2,488 (SAR) are key support levels. In a backdrop of frequent macro events, investors are advised to closely watch the CLARITY bill vote on September 15 and the Fed’s interest-rate decision on September 16, manage position sizing, and prepare risk management measures.
5. Trending Tokens and Topics
Hot tokens leading today’s gains:
ARK (Arkham) current price $0.1734, 24-hour increase 22.8%
MTL (Metal DAO) current price $0.322, 24-hour increase 15.8%
T (Threshold Network) current price $0.00501, 24-hour increase 14.4%
The top trending topic tags right now:
#BitcoinHoldsAbove$77000 #FedHikeOddsRiseTo89% #BitcoinCrosses$78000
1. Overview of Ethereum Price Trend
As of 16:00 on September 14, 2026 (UTC), Ethereum (ETH) latest price is $2,521. Over the past few hours, the price has steadily risen from around $2,500 to above $2,530. From the hourly candlestick chart, after ETH received effective support at $2,487, it has continued to rebound, topping out at $2,537. The short-term trend is bullish. In terms of trading volume, the recent one-hour trading value reached $45.64 million, up significantly from $35.79 million in the prior hour, indicating that long positions are gradually entering the market. However, from a more macro perspective, ETH is still trading within the narrow range of $2,500 to $2,540 and has not yet formed a trend-breaking breakout.
2. In-Depth Interpretation of Technical Indicators
Moving averages: MA7 ($2,511), MA25 ($2,508), and MA99 ($2,505) are in a bullish alignment. The price is trading above all three moving averages, suggesting a bullish short-term bias. EMA7 ($2,516) is higher than EMA25 ($2,510) and EMA99 ($2,505), which also sends a bullish signal.
MACD: The DIF value is 3.38, DEA is 1.85, and the histogram is 1.53. MACD has already formed a golden cross and continues to expand, meaning bullish momentum is strengthening. This is an important technical support for the recent rebound.
RSI: RSI6 is 68.3, RSI12 is 60.9, and RSI24 is 55.6. The short-term RSI is approaching the overbought region near 70, implying that chasing longs in the short term should be done cautiously. Stoch RSI is 75.1, which has entered the overbought zone, so a short-term technical pullback is possible.
KDJ: K is 60.9, D is 51.0, and J is 80.7. A relatively high J suggests that short-term bullish sentiment is hot, but the gap between K and D has narrowed, so investors should be alert to dulling risk after a golden cross.
Bollinger Bands: Upper band is $2,538, middle band is $2,508, and lower band is $2,478. The price is nearing the upper band. If it cannot break through the resistance zone of $2,538 to $2,540 effectively, it may fall back toward the middle band to test support.
SAR Parabolic: SAR is currently at $2,488. Price has been trading above SAR, confirming a short-term bullish setup. ATR is $16.78, indicating moderate volatility without any extreme volatility signals.
OBV: OBV has been converging from negative territory and has improved from -69,267 to 11,847, suggesting that buying power is strengthening and that money inflows are evident.
Based on 15 composite technical factors: 7 are bullish, 7 are bearish, and 1 is neutral. Overall, long and short forces are fairly balanced. The composite indicator signal is slightly bearish, and the historical win rate is as high as 82.61%, so investors should remain vigilant about short-term pullback risk.
3. Analysis of Market Sentiment and Capital Flows
Fundamentals: Ethereum spot ETF recorded a net inflow of $197 million last week. On September 11 alone, it saw a daily net inflow of $216 million, maintaining a net inflow streak for four consecutive weeks. Meanwhile, Bitcoin ETF saw a net outflow of $463 million, making the capital rotation signal quite clear. The ETH/BTC ratio has risen to the highest level since the end of January, reflecting increasing market preference for Ethereum.
Corporate level: A technology company reportedly spent 27,180 ETH to purchase them as strategic reserves. Institutional funds continue to enter, providing support for the price. In addition, major asset management firms are incorporating digital assets into traditional wealth management model portfolios, and structural demand is taking shape.
Risks cannot be ignored, however. First, on September 15, the U.S. Senate will hold a key vote on the CLARITY bill. The bill needs 60 votes to move forward, and there is currently a lack of bipartisan consensus, resulting in relatively high policy uncertainty. Second, the probability of a Fed rate hike on September 16 has risen to 87%. The target interest rate range will increase to 3.75%–4.00%, and tighter macro liquidity will put pressure on risk assets. Third, institutional market makers and capital funds have established perpetual short positions with a notional value exceeding $460 million, with the short position size being large. At the same time, more than $188 million worth of ETH has been transferred to institutional exchange wallets, and combined with scheduled “whale” recharges, near-term sell-pressure risk is rising.
4. Comprehensive Outlook and Trading Suggestions
Considering both technicals and fundamentals: ETH’s short-term technical structure is bullish, but it is already nearing the overbought zone. The key resistance levels are $2,538 to $2,540. If it can break through effectively and hold above $2,540, it may open up upward room toward $2,560 to $2,580. If it is rejected and pulls back, $2,508 (the Bollinger middle band) and $2,488 (SAR) are key support levels. In a backdrop of frequent macro events, investors are advised to closely watch the CLARITY bill vote on September 15 and the Fed’s interest-rate decision on September 16, manage position sizing, and prepare risk management measures.
5. Trending Tokens and Topics
Hot tokens leading today’s gains:
ARK (Arkham) current price $0.1734, 24-hour increase 22.8%
MTL (Metal DAO) current price $0.322, 24-hour increase 15.8%
T (Threshold Network) current price $0.00501, 24-hour increase 14.4%
The top trending topic tags right now:
#BitcoinHoldsAbove$77000 #FedHikeOddsRiseTo89% #BitcoinCrosses$78000
As of 16:00 on September 14, 2026 (UTC), Ethereum (ETH) latest price is $2,521. Over the past few hours, the price has steadily risen from around $2,500 to above $2,530. From the hourly candlestick chart, after ETH received effective support at $2,487, it has continued to rebound, topping out at $2,537. The short-term trend is bullish. In terms of trading volume, the recent one-hour trading value reached $45.64 million, up significantly from $35.79 million in the prior hour, indicating that long positions are gradually entering the market. However, from a more macro perspective, ETH is still trading within the narrow range of $2,500 to $2,540 and has not yet formed a trend-breaking breakout.
2. In-Depth Interpretation of Technical Indicators
Moving averages: MA7 ($2,511), MA25 ($2,508), and MA99 ($2,505) are in a bullish alignment. The price is trading above all three moving averages, suggesting a bullish short-term bias. EMA7 ($2,516) is higher than EMA25 ($2,510) and EMA99 ($2,505), which also sends a bullish signal.
MACD: The DIF value is 3.38, DEA is 1.85, and the histogram is 1.53. MACD has already formed a golden cross and continues to expand, meaning bullish momentum is strengthening. This is an important technical support for the recent rebound.
RSI: RSI6 is 68.3, RSI12 is 60.9, and RSI24 is 55.6. The short-term RSI is approaching the overbought region near 70, implying that chasing longs in the short term should be done cautiously. Stoch RSI is 75.1, which has entered the overbought zone, so a short-term technical pullback is possible.
KDJ: K is 60.9, D is 51.0, and J is 80.7. A relatively high J suggests that short-term bullish sentiment is hot, but the gap between K and D has narrowed, so investors should be alert to dulling risk after a golden cross.
Bollinger Bands: Upper band is $2,538, middle band is $2,508, and lower band is $2,478. The price is nearing the upper band. If it cannot break through the resistance zone of $2,538 to $2,540 effectively, it may fall back toward the middle band to test support.
SAR Parabolic: SAR is currently at $2,488. Price has been trading above SAR, confirming a short-term bullish setup. ATR is $16.78, indicating moderate volatility without any extreme volatility signals.
OBV: OBV has been converging from negative territory and has improved from -69,267 to 11,847, suggesting that buying power is strengthening and that money inflows are evident.
Based on 15 composite technical factors: 7 are bullish, 7 are bearish, and 1 is neutral. Overall, long and short forces are fairly balanced. The composite indicator signal is slightly bearish, and the historical win rate is as high as 82.61%, so investors should remain vigilant about short-term pullback risk.
3. Analysis of Market Sentiment and Capital Flows
Fundamentals: Ethereum spot ETF recorded a net inflow of $197 million last week. On September 11 alone, it saw a daily net inflow of $216 million, maintaining a net inflow streak for four consecutive weeks. Meanwhile, Bitcoin ETF saw a net outflow of $463 million, making the capital rotation signal quite clear. The ETH/BTC ratio has risen to the highest level since the end of January, reflecting increasing market preference for Ethereum.
Corporate level: A technology company reportedly spent 27,180 ETH to purchase them as strategic reserves. Institutional funds continue to enter, providing support for the price. In addition, major asset management firms are incorporating digital assets into traditional wealth management model portfolios, and structural demand is taking shape.
Risks cannot be ignored, however. First, on September 15, the U.S. Senate will hold a key vote on the CLARITY bill. The bill needs 60 votes to move forward, and there is currently a lack of bipartisan consensus, resulting in relatively high policy uncertainty. Second, the probability of a Fed rate hike on September 16 has risen to 87%. The target interest rate range will increase to 3.75%–4.00%, and tighter macro liquidity will put pressure on risk assets. Third, institutional market makers and capital funds have established perpetual short positions with a notional value exceeding $460 million, with the short position size being large. At the same time, more than $188 million worth of ETH has been transferred to institutional exchange wallets, and combined with scheduled “whale” recharges, near-term sell-pressure risk is rising.
4. Comprehensive Outlook and Trading Suggestions
Considering both technicals and fundamentals: ETH’s short-term technical structure is bullish, but it is already nearing the overbought zone. The key resistance levels are $2,538 to $2,540. If it can break through effectively and hold above $2,540, it may open up upward room toward $2,560 to $2,580. If it is rejected and pulls back, $2,508 (the Bollinger middle band) and $2,488 (SAR) are key support levels. In a backdrop of frequent macro events, investors are advised to closely watch the CLARITY bill vote on September 15 and the Fed’s interest-rate decision on September 16, manage position sizing, and prepare risk management measures.
5. Trending Tokens and Topics
Hot tokens leading today’s gains:
ARK (Arkham) current price $0.1734, 24-hour increase 22.8%
MTL (Metal DAO) current price $0.322, 24-hour increase 15.8%
T (Threshold Network) current price $0.00501, 24-hour increase 14.4%
The top trending topic tags right now:
#BitcoinHoldsAbove$77000 #FedHikeOddsRiseTo89% #BitcoinCrosses$78000
6
·
--
Ethereum September 14 Market In-Depth Analysis: Can ETF Inflows Break Through Macroeconomic Pressure?
1. Market Overview
On September 14, Ethereum traded in a tight range around $2,505. The latest price is $2,505.63. From the 1-hour K-line chart, over the past 5 hours ETH experienced a move that first dipped and then rebounded: the price slightly fell from $2,509 to a low of $2,487, then quickly rebounded, reaching a high of $2,532. It is currently stabilizing around $2,523. In terms of trading volume, during the rebound phase the turnover reached $24.47 million, down from $35.79 million in the prior hour, indicating that buying power weakened during the rebound. However, looking at the overall 5-hour trend, the market’s price center of gravity is gradually moving upward, and the $2,500 psychological level is forming effective support.
2. Technical Indicator Interpretation
For the moving average system: the 7-period MA is at $2,508.9, the 25-period MA at $2,507, and the 99-period MA at $2,505. The three lines are arranged in a bullish alignment, but the spacing is very small. The latest K-line has broken above all moving averages, and the short-term signal is relatively positive.
The Exponential Moving Average (EMA) shows a similar structure. EMA7 is $2,511.5, above EMA25 at $2,508.6 and EMA99 at $2,504.4. The shorter-period EMAs continue to run above the medium-period EMAs.
The Bollinger Bands indicator shows the upper band at $2,534.9, the middle band at $2,506.9, and the lower band at $2,478.9. The current price is approaching the upper band, suggesting that short-term overbought pressure may emerge. The Bollinger Band width remains stable with no obvious signs of expansion, implying the market is still in a consolidation pattern.
The MACD indicator shows positive changes. The MACD fast line rose from 0.71 to 1.88, while the slow line dipped slightly from 1.25 to 1.38. The fast line once again crossed above the slow line, forming a golden cross. The histogram turned from negative to 0.50, releasing a short-term bullish signal. However, the fast line has not yet moved significantly far away from the slow line, so the durability of the golden cross still needs to be monitored.
For the RSI indicator: RSI6 surged from 50.6 to 68.6, RSI12 rose from 50.8 to 60.0, and RSI24 increased from 50.3 to 54.9. Short-term RSI has quickly climbed toward the overbought zone, but the medium-term RSI remains in a neutral-to-strong range. Overall, bullish momentum is strengthening, but there is still room.
For the KDJ indicator: the K value is 49.9, the D value 45.3, and the J value 59.2. The K line is about to cross above the D line. If the J value continues to rise, it will form a complete bullish golden-cross pattern. The ATR indicator rose from 16.66 to 17.44, indicating increased volatility, consistent with the upward price movement.
The Parabolic SAR indicator is currently at $2,532, above the current price, forming overhead pressure. The SuperTrend indicator remains at $2,479, far from the current price, meaning the mid-term trend is still bearish. The OBV indicator has rebounded from -76,000 to -26,000. Selling-pressure from capital outflows has eased somewhat, but it has not turned into net inflow.
Based on a combined view of 15 technical factors: there are 8 bearish factors, 6 bullish factors, and 1 neutral factor. The bearish share is 53.3%, while the bullish share is 40%. The combined indicator signal is bearish overall, with a historical win rate of 65.79%. This suggests that although the technical picture has improved in the short term, it has not fully shifted to a bullish stance. The $2,530 to $2,535 range faces strong resistance overhead.
3. Market Sentiment and Capital Flows
From the news perspective: Ethereum spot ETFs saw a net inflow of $197 million last week. On September 11 alone, net inflow was $216 million, continuing a pattern of net inflows for four consecutive weeks. In stark contrast, Bitcoin spot ETFs recorded a net outflow of $463 million over the same period, ending three consecutive weeks of inflows. Funds appear to be rotating from the Bitcoin side to the Ethereum side, and the ETH/BTC exchange rate has hit a new high since late January last year.
At the institutional level: a large technology company has been continuously buying Ethereum, with a target position size of up to 5.96 million ETH, indicating long-term capital remains confident in ETH’s fundamentals. Wall Street is also pushing the narrative around Ethereum’s application in AI settlement scenarios, with new institutional model portfolios including ETH as a core allocation.
However, risks cannot be ignored. In the perpetual futures market, institutional market makers hold short positions exceeding $525 million, which clearly suppresses short-term upside. On-chain data shows that recently 3,333 ETH were deposited into centralized exchanges, which may signal some localized profit-taking.
In the macro environment: the probability of the Federal Reserve raising rates by 25 bps on September 16 has risen to 86–87%. This would be the first rate hike since July 2023, with the target range increasing to 3.75%–4.00%. Tighter expectations create pressure for overall risk assets. Additionally, on September 15 the U.S. Senate will hold a key procedural vote on the digital asset market clarity bill (CLARITY Act), requiring 60 votes to move forward. Bernstein noted that any positive outcome has not been fully priced by the market; if the bill passes, it could drive a major rally in the crypto market.
Overall, ETH has support around the $2,500 level from capital flows. Continued ETF inflows and institutional buying provide a bottoming cushion. But macro uncertainty, institutional short positioning, and bearish short-term technical signals create overhead pressure. In the short term, watch whether the $2,535 Bollinger upper band can be broken; if the breakout fails, a retest of the $2,500 support could occur. In the medium term, the trend will largely depend on next week’s Fed interest-rate decision and the CLARITY Act vote results. Investors should prepare for both outcomes and stay cautious even if sentiment turns optimistic.
Trending Tokens:
MTL current price $0.326, up 17.27%
T current price $0.00504, up 15.07%
CRWDB current price $237.81, up 13.31%
#BitcoinHoldsAbove$77000 #FedHikeOddsRiseTo89% #BitcoinCrosses$78000
Ethereum September 14 Market In-Depth Analysis: Can ETF Inflows Break Through Macroeconomic Pressure?
1. Market Overview
On September 14, Ethereum traded in a tight range around $2,505. The latest price is $2,505.63. From the 1-hour K-line chart, over the past 5 hours ETH experienced a move that first dipped and then rebounded: the price slightly fell from $2,509 to a low of $2,487, then quickly rebounded, reaching a high of $2,532. It is currently stabilizing around $2,523. In terms of trading volume, during the rebound phase the turnover reached $24.47 million, down from $35.79 million in the prior hour, indicating that buying power weakened during the rebound. However, looking at the overall 5-hour trend, the market’s price center of gravity is gradually moving upward, and the $2,500 psychological level is forming effective support.
2. Technical Indicator Interpretation
For the moving average system: the 7-period MA is at $2,508.9, the 25-period MA at $2,507, and the 99-period MA at $2,505. The three lines are arranged in a bullish alignment, but the spacing is very small. The latest K-line has broken above all moving averages, and the short-term signal is relatively positive.
The Exponential Moving Average (EMA) shows a similar structure. EMA7 is $2,511.5, above EMA25 at $2,508.6 and EMA99 at $2,504.4. The shorter-period EMAs continue to run above the medium-period EMAs.
The Bollinger Bands indicator shows the upper band at $2,534.9, the middle band at $2,506.9, and the lower band at $2,478.9. The current price is approaching the upper band, suggesting that short-term overbought pressure may emerge. The Bollinger Band width remains stable with no obvious signs of expansion, implying the market is still in a consolidation pattern.
The MACD indicator shows positive changes. The MACD fast line rose from 0.71 to 1.88, while the slow line dipped slightly from 1.25 to 1.38. The fast line once again crossed above the slow line, forming a golden cross. The histogram turned from negative to 0.50, releasing a short-term bullish signal. However, the fast line has not yet moved significantly far away from the slow line, so the durability of the golden cross still needs to be monitored.
For the RSI indicator: RSI6 surged from 50.6 to 68.6, RSI12 rose from 50.8 to 60.0, and RSI24 increased from 50.3 to 54.9. Short-term RSI has quickly climbed toward the overbought zone, but the medium-term RSI remains in a neutral-to-strong range. Overall, bullish momentum is strengthening, but there is still room.
For the KDJ indicator: the K value is 49.9, the D value 45.3, and the J value 59.2. The K line is about to cross above the D line. If the J value continues to rise, it will form a complete bullish golden-cross pattern. The ATR indicator rose from 16.66 to 17.44, indicating increased volatility, consistent with the upward price movement.
The Parabolic SAR indicator is currently at $2,532, above the current price, forming overhead pressure. The SuperTrend indicator remains at $2,479, far from the current price, meaning the mid-term trend is still bearish. The OBV indicator has rebounded from -76,000 to -26,000. Selling-pressure from capital outflows has eased somewhat, but it has not turned into net inflow.
Based on a combined view of 15 technical factors: there are 8 bearish factors, 6 bullish factors, and 1 neutral factor. The bearish share is 53.3%, while the bullish share is 40%. The combined indicator signal is bearish overall, with a historical win rate of 65.79%. This suggests that although the technical picture has improved in the short term, it has not fully shifted to a bullish stance. The $2,530 to $2,535 range faces strong resistance overhead.
3. Market Sentiment and Capital Flows
From the news perspective: Ethereum spot ETFs saw a net inflow of $197 million last week. On September 11 alone, net inflow was $216 million, continuing a pattern of net inflows for four consecutive weeks. In stark contrast, Bitcoin spot ETFs recorded a net outflow of $463 million over the same period, ending three consecutive weeks of inflows. Funds appear to be rotating from the Bitcoin side to the Ethereum side, and the ETH/BTC exchange rate has hit a new high since late January last year.
At the institutional level: a large technology company has been continuously buying Ethereum, with a target position size of up to 5.96 million ETH, indicating long-term capital remains confident in ETH’s fundamentals. Wall Street is also pushing the narrative around Ethereum’s application in AI settlement scenarios, with new institutional model portfolios including ETH as a core allocation.
However, risks cannot be ignored. In the perpetual futures market, institutional market makers hold short positions exceeding $525 million, which clearly suppresses short-term upside. On-chain data shows that recently 3,333 ETH were deposited into centralized exchanges, which may signal some localized profit-taking.
In the macro environment: the probability of the Federal Reserve raising rates by 25 bps on September 16 has risen to 86–87%. This would be the first rate hike since July 2023, with the target range increasing to 3.75%–4.00%. Tighter expectations create pressure for overall risk assets. Additionally, on September 15 the U.S. Senate will hold a key procedural vote on the digital asset market clarity bill (CLARITY Act), requiring 60 votes to move forward. Bernstein noted that any positive outcome has not been fully priced by the market; if the bill passes, it could drive a major rally in the crypto market.
Overall, ETH has support around the $2,500 level from capital flows. Continued ETF inflows and institutional buying provide a bottoming cushion. But macro uncertainty, institutional short positioning, and bearish short-term technical signals create overhead pressure. In the short term, watch whether the $2,535 Bollinger upper band can be broken; if the breakout fails, a retest of the $2,500 support could occur. In the medium term, the trend will largely depend on next week’s Fed interest-rate decision and the CLARITY Act vote results. Investors should prepare for both outcomes and stay cautious even if sentiment turns optimistic.
Trending Tokens:
MTL current price $0.326, up 17.27%
T current price $0.00504, up 15.07%
CRWDB current price $237.81, up 13.31%
#BitcoinHoldsAbove$77000 #FedHikeOddsRiseTo89% #BitcoinCrosses$78000
1. Market Overview
On September 14, Ethereum traded in a tight range around $2,505. The latest price is $2,505.63. From the 1-hour K-line chart, over the past 5 hours ETH experienced a move that first dipped and then rebounded: the price slightly fell from $2,509 to a low of $2,487, then quickly rebounded, reaching a high of $2,532. It is currently stabilizing around $2,523. In terms of trading volume, during the rebound phase the turnover reached $24.47 million, down from $35.79 million in the prior hour, indicating that buying power weakened during the rebound. However, looking at the overall 5-hour trend, the market’s price center of gravity is gradually moving upward, and the $2,500 psychological level is forming effective support.
2. Technical Indicator Interpretation
For the moving average system: the 7-period MA is at $2,508.9, the 25-period MA at $2,507, and the 99-period MA at $2,505. The three lines are arranged in a bullish alignment, but the spacing is very small. The latest K-line has broken above all moving averages, and the short-term signal is relatively positive.
The Exponential Moving Average (EMA) shows a similar structure. EMA7 is $2,511.5, above EMA25 at $2,508.6 and EMA99 at $2,504.4. The shorter-period EMAs continue to run above the medium-period EMAs.
The Bollinger Bands indicator shows the upper band at $2,534.9, the middle band at $2,506.9, and the lower band at $2,478.9. The current price is approaching the upper band, suggesting that short-term overbought pressure may emerge. The Bollinger Band width remains stable with no obvious signs of expansion, implying the market is still in a consolidation pattern.
The MACD indicator shows positive changes. The MACD fast line rose from 0.71 to 1.88, while the slow line dipped slightly from 1.25 to 1.38. The fast line once again crossed above the slow line, forming a golden cross. The histogram turned from negative to 0.50, releasing a short-term bullish signal. However, the fast line has not yet moved significantly far away from the slow line, so the durability of the golden cross still needs to be monitored.
For the RSI indicator: RSI6 surged from 50.6 to 68.6, RSI12 rose from 50.8 to 60.0, and RSI24 increased from 50.3 to 54.9. Short-term RSI has quickly climbed toward the overbought zone, but the medium-term RSI remains in a neutral-to-strong range. Overall, bullish momentum is strengthening, but there is still room.
For the KDJ indicator: the K value is 49.9, the D value 45.3, and the J value 59.2. The K line is about to cross above the D line. If the J value continues to rise, it will form a complete bullish golden-cross pattern. The ATR indicator rose from 16.66 to 17.44, indicating increased volatility, consistent with the upward price movement.
The Parabolic SAR indicator is currently at $2,532, above the current price, forming overhead pressure. The SuperTrend indicator remains at $2,479, far from the current price, meaning the mid-term trend is still bearish. The OBV indicator has rebounded from -76,000 to -26,000. Selling-pressure from capital outflows has eased somewhat, but it has not turned into net inflow.
Based on a combined view of 15 technical factors: there are 8 bearish factors, 6 bullish factors, and 1 neutral factor. The bearish share is 53.3%, while the bullish share is 40%. The combined indicator signal is bearish overall, with a historical win rate of 65.79%. This suggests that although the technical picture has improved in the short term, it has not fully shifted to a bullish stance. The $2,530 to $2,535 range faces strong resistance overhead.
3. Market Sentiment and Capital Flows
From the news perspective: Ethereum spot ETFs saw a net inflow of $197 million last week. On September 11 alone, net inflow was $216 million, continuing a pattern of net inflows for four consecutive weeks. In stark contrast, Bitcoin spot ETFs recorded a net outflow of $463 million over the same period, ending three consecutive weeks of inflows. Funds appear to be rotating from the Bitcoin side to the Ethereum side, and the ETH/BTC exchange rate has hit a new high since late January last year.
At the institutional level: a large technology company has been continuously buying Ethereum, with a target position size of up to 5.96 million ETH, indicating long-term capital remains confident in ETH’s fundamentals. Wall Street is also pushing the narrative around Ethereum’s application in AI settlement scenarios, with new institutional model portfolios including ETH as a core allocation.
However, risks cannot be ignored. In the perpetual futures market, institutional market makers hold short positions exceeding $525 million, which clearly suppresses short-term upside. On-chain data shows that recently 3,333 ETH were deposited into centralized exchanges, which may signal some localized profit-taking.
In the macro environment: the probability of the Federal Reserve raising rates by 25 bps on September 16 has risen to 86–87%. This would be the first rate hike since July 2023, with the target range increasing to 3.75%–4.00%. Tighter expectations create pressure for overall risk assets. Additionally, on September 15 the U.S. Senate will hold a key procedural vote on the digital asset market clarity bill (CLARITY Act), requiring 60 votes to move forward. Bernstein noted that any positive outcome has not been fully priced by the market; if the bill passes, it could drive a major rally in the crypto market.
Overall, ETH has support around the $2,500 level from capital flows. Continued ETF inflows and institutional buying provide a bottoming cushion. But macro uncertainty, institutional short positioning, and bearish short-term technical signals create overhead pressure. In the short term, watch whether the $2,535 Bollinger upper band can be broken; if the breakout fails, a retest of the $2,500 support could occur. In the medium term, the trend will largely depend on next week’s Fed interest-rate decision and the CLARITY Act vote results. Investors should prepare for both outcomes and stay cautious even if sentiment turns optimistic.
Trending Tokens:
MTL current price $0.326, up 17.27%
T current price $0.00504, up 15.07%
CRWDB current price $237.81, up 13.31%
#BitcoinHoldsAbove$77000 #FedHikeOddsRiseTo89% #BitcoinCrosses$78000
·
--
Ethereum September 14 Market Analysis: A Tug-of-War at the $2,500 Battlefield and ETF Capital Inflows
1. Market Overview
As of 15:00 on September 14, ETH’s latest price is $2,505.63, trading in a range of $2,487 to $2,518 over the past 5 hours. The candlesticks show that after a rapid dip to $2,487, ETH stabilized and rebounded, closing at $2,507.66. Bulls are defending the $2,500 level. The trading volumes of the middle two candlesticks were $56.01 million and $64.43 million in USDT respectively; after sell pressure was concentrated and released, it has weakened somewhat.
2. Technical Indicator Interpretation
Regarding the moving average system: the 7-period MA has slipped to 2,508.86, the 25-period MA is trending upward at 2,505.72, and the 99-period MA remains steady around 2,504. The convergence of the three lines suggests that a directional choice may be imminent. In the MACD, the DIF has fallen from 3.15 to 0.65. The histogram has been negative for three consecutive bars, but bearish momentum is weakening; no golden cross has appeared yet. RSI6 has dipped from 45 to 34.58, then rebounded to 49.27, returning to the neutral zone. Stoch RSI has sharply dropped from 75.48 to 19.73 and has entered the oversold region, increasing the probability of a technical rebound.
For the Bollinger Bands, the three tracks are at 2,533, 2,506, and 2,479 respectively, with price hovering near the middle band. ATR has risen from 14.79 to 16.66; expanding volatility reflects intensifying market divergence. KDJ in the low zone shows signs of turning, but a golden cross has not yet formed. SAR has flipped above the price, forming resistance at 2,533, while Supertrend support sits at 2,479.
Combining 15 technical factors: bearish share is 53.33%, bullish share is 40%, producing a bearish-leaning composite signal. The historical win rate is 68.09%. Overall, the technical picture is slightly bearish, but oversold signals are present, suggesting a higher chance of a short-term rebound.
3. Market Sentiment and Capital Flows
ETH spot ETFs recorded a net inflow of $197 million last week—fourth consecutive week of positive flows. This sharply contrasts with Bitcoin ETFs’ $463 million outflow over the same period. The ETH/BTC exchange rate has hit a new high since late January 2026, showing a clear rotation of funds from Bitcoin toward Ethereum. A certain large technology company is actively increasing its ETH holdings, with its target position reaching 5.96 million ETH. Institutional-level buy signals indicate a long-term positive outlook.
On the risk side, expectations that the Fed’s September 15–16 meeting will raise rates by 25 bps have risen to 87%, which puts pressure on risk assets. On September 15, the Senate will conduct a procedural vote on the CLARITY bill—one of the most critical legislative procedures for the crypto industry this year. On-chain data shows that over $525 million in perpetual contract short positions come from institutional market makers. Recently, 3,333 ETH were transferred by “whales” to exchanges, implying considerable upward resistance in the near term.
4. Outlook for the Next Phase
Near-term support is at $2,479. If that level breaks, look for the $2,450 area. Overhead resistance lies between $2,520 and $2,533. Investors are advised to monitor how the market reacts after this week’s macro events land, and to manage position size until key risk events become clearer.
Top Gainers (Hot Tokens):
ARK current price $0.1688, 24h gain 15.54%
T current price $0.00504, 24h gain 15.07%
CRWDB current price $237.71, 24h gain 13.65%
#BitcoinHoldsAbove$77000 #FedHikeOddsRiseTo89% #BitcoinCrosses$78000
Ethereum September 14 Market Analysis: A Tug-of-War at the $2,500 Battlefield and ETF Capital Inflows
1. Market Overview
As of 15:00 on September 14, ETH’s latest price is $2,505.63, trading in a range of $2,487 to $2,518 over the past 5 hours. The candlesticks show that after a rapid dip to $2,487, ETH stabilized and rebounded, closing at $2,507.66. Bulls are defending the $2,500 level. The trading volumes of the middle two candlesticks were $56.01 million and $64.43 million in USDT respectively; after sell pressure was concentrated and released, it has weakened somewhat.
2. Technical Indicator Interpretation
Regarding the moving average system: the 7-period MA has slipped to 2,508.86, the 25-period MA is trending upward at 2,505.72, and the 99-period MA remains steady around 2,504. The convergence of the three lines suggests that a directional choice may be imminent. In the MACD, the DIF has fallen from 3.15 to 0.65. The histogram has been negative for three consecutive bars, but bearish momentum is weakening; no golden cross has appeared yet. RSI6 has dipped from 45 to 34.58, then rebounded to 49.27, returning to the neutral zone. Stoch RSI has sharply dropped from 75.48 to 19.73 and has entered the oversold region, increasing the probability of a technical rebound.
For the Bollinger Bands, the three tracks are at 2,533, 2,506, and 2,479 respectively, with price hovering near the middle band. ATR has risen from 14.79 to 16.66; expanding volatility reflects intensifying market divergence. KDJ in the low zone shows signs of turning, but a golden cross has not yet formed. SAR has flipped above the price, forming resistance at 2,533, while Supertrend support sits at 2,479.
Combining 15 technical factors: bearish share is 53.33%, bullish share is 40%, producing a bearish-leaning composite signal. The historical win rate is 68.09%. Overall, the technical picture is slightly bearish, but oversold signals are present, suggesting a higher chance of a short-term rebound.
3. Market Sentiment and Capital Flows
ETH spot ETFs recorded a net inflow of $197 million last week—fourth consecutive week of positive flows. This sharply contrasts with Bitcoin ETFs’ $463 million outflow over the same period. The ETH/BTC exchange rate has hit a new high since late January 2026, showing a clear rotation of funds from Bitcoin toward Ethereum. A certain large technology company is actively increasing its ETH holdings, with its target position reaching 5.96 million ETH. Institutional-level buy signals indicate a long-term positive outlook.
On the risk side, expectations that the Fed’s September 15–16 meeting will raise rates by 25 bps have risen to 87%, which puts pressure on risk assets. On September 15, the Senate will conduct a procedural vote on the CLARITY bill—one of the most critical legislative procedures for the crypto industry this year. On-chain data shows that over $525 million in perpetual contract short positions come from institutional market makers. Recently, 3,333 ETH were transferred by “whales” to exchanges, implying considerable upward resistance in the near term.
4. Outlook for the Next Phase
Near-term support is at $2,479. If that level breaks, look for the $2,450 area. Overhead resistance lies between $2,520 and $2,533. Investors are advised to monitor how the market reacts after this week’s macro events land, and to manage position size until key risk events become clearer.
Top Gainers (Hot Tokens):
ARK current price $0.1688, 24h gain 15.54%
T current price $0.00504, 24h gain 15.07%
CRWDB current price $237.71, 24h gain 13.65%
#BitcoinHoldsAbove$77000 #FedHikeOddsRiseTo89% #BitcoinCrosses$78000
1. Market Overview
As of 15:00 on September 14, ETH’s latest price is $2,505.63, trading in a range of $2,487 to $2,518 over the past 5 hours. The candlesticks show that after a rapid dip to $2,487, ETH stabilized and rebounded, closing at $2,507.66. Bulls are defending the $2,500 level. The trading volumes of the middle two candlesticks were $56.01 million and $64.43 million in USDT respectively; after sell pressure was concentrated and released, it has weakened somewhat.
2. Technical Indicator Interpretation
Regarding the moving average system: the 7-period MA has slipped to 2,508.86, the 25-period MA is trending upward at 2,505.72, and the 99-period MA remains steady around 2,504. The convergence of the three lines suggests that a directional choice may be imminent. In the MACD, the DIF has fallen from 3.15 to 0.65. The histogram has been negative for three consecutive bars, but bearish momentum is weakening; no golden cross has appeared yet. RSI6 has dipped from 45 to 34.58, then rebounded to 49.27, returning to the neutral zone. Stoch RSI has sharply dropped from 75.48 to 19.73 and has entered the oversold region, increasing the probability of a technical rebound.
For the Bollinger Bands, the three tracks are at 2,533, 2,506, and 2,479 respectively, with price hovering near the middle band. ATR has risen from 14.79 to 16.66; expanding volatility reflects intensifying market divergence. KDJ in the low zone shows signs of turning, but a golden cross has not yet formed. SAR has flipped above the price, forming resistance at 2,533, while Supertrend support sits at 2,479.
Combining 15 technical factors: bearish share is 53.33%, bullish share is 40%, producing a bearish-leaning composite signal. The historical win rate is 68.09%. Overall, the technical picture is slightly bearish, but oversold signals are present, suggesting a higher chance of a short-term rebound.
3. Market Sentiment and Capital Flows
ETH spot ETFs recorded a net inflow of $197 million last week—fourth consecutive week of positive flows. This sharply contrasts with Bitcoin ETFs’ $463 million outflow over the same period. The ETH/BTC exchange rate has hit a new high since late January 2026, showing a clear rotation of funds from Bitcoin toward Ethereum. A certain large technology company is actively increasing its ETH holdings, with its target position reaching 5.96 million ETH. Institutional-level buy signals indicate a long-term positive outlook.
On the risk side, expectations that the Fed’s September 15–16 meeting will raise rates by 25 bps have risen to 87%, which puts pressure on risk assets. On September 15, the Senate will conduct a procedural vote on the CLARITY bill—one of the most critical legislative procedures for the crypto industry this year. On-chain data shows that over $525 million in perpetual contract short positions come from institutional market makers. Recently, 3,333 ETH were transferred by “whales” to exchanges, implying considerable upward resistance in the near term.
4. Outlook for the Next Phase
Near-term support is at $2,479. If that level breaks, look for the $2,450 area. Overhead resistance lies between $2,520 and $2,533. Investors are advised to monitor how the market reacts after this week’s macro events land, and to manage position size until key risk events become clearer.
Top Gainers (Hot Tokens):
ARK current price $0.1688, 24h gain 15.54%
T current price $0.00504, 24h gain 15.07%
CRWDB current price $237.71, 24h gain 13.65%
#BitcoinHoldsAbove$77000 #FedHikeOddsRiseTo89% #BitcoinCrosses$78000
·
--
Ethereum September 14 Market Analysis: A Tug-of-War Around the $2,500 Level
1. Market Overview
As of 15:00 on September 14, Ethereum is trading at $2,503.53. Over the past few hours, it has been consolidating in a range of $2,487 to $2,518. This week’s macro events are packed: the CLARITY Act Senate vote is scheduled for the 15th, and the FOMC meeting will be held from the 16th to the 17th. The probability of a rate hike is 87%, so Ethereum’s short-term direction faces uncertainty.
2. Interpretation of Technical Indicators
The moving average system is arranged bearishly. MA7 is 2508.38, MA25 is 2505.59, and price has fallen below the short-term moving averages. EMA7 and EMA25 are about to form a death cross. In terms of MACD, the DIF has dropped from 3.15 to 0.38; the histogram has turned negative and expanded to -0.81. The death cross is confirmed, and bearish momentum is strengthening. RSI6 is 42.98. Stoch RSI has fallen to 14.83, nearing oversold conditions, suggesting a potential technical rebound in the short term. The KDJ indicator’s J value is only 18.67, which also hints at oversold conditions. For the Bollinger Bands, price is moving between the lower-mid and lower bands, with the lower band at $2,479 acting as a key support. SAR is positioned above 2533, confirming a bearish signal. OBV continues to decline to -40829, indicating a clear net outflow of funds.
3. Long vs. Short Factors and Market Sentiment
Among 15 quantitative factors, 8 are bullish and 6 are bearish, but the composite signal is bearish, with a historical win rate of 65.79%. Flows show divergence: last week the BTC ETF saw a net outflow of $463 million, but the ETH ETF bucked the trend with a net inflow of $197 million, marking four consecutive weeks of inflows. The whale BitMine bought 27,180 ETH, while Abraxas established a $980 million short position. Wintermute also opened a $38.47 million short position. A whale holding 39,800 ETH with 25x leverage highlights non-negligible liquidation risk. Additionally, $63.8 million in ETH was transferred to exchanges, which may indicate potential sell pressure.
4. Outlook
In the short term, ETH is expected to trade sideways in the $2,479 to $2,520 range. If it breaks below $2,479, look for support at $2,470. If it breaks above $2,520, resistance to watch is $2,533. The CLARITY Act and the FOMC meeting are the key variables this week. Under extreme positioning, any breakout could trigger a chain reaction. It is recommended to control leverage and manage risk.
Today’s trending tokens: T price $0.00517, up 17.50%; MTL price $0.323, up 13.33%; CRWDB price $236.66, up 12.91%.
#BitcoinHoldsAbove$77000 #FedHikeOddsRiseTo89% #BitcoinCrosses$78000
Ethereum September 14 Market Analysis: A Tug-of-War Around the $2,500 Level
1. Market Overview
As of 15:00 on September 14, Ethereum is trading at $2,503.53. Over the past few hours, it has been consolidating in a range of $2,487 to $2,518. This week’s macro events are packed: the CLARITY Act Senate vote is scheduled for the 15th, and the FOMC meeting will be held from the 16th to the 17th. The probability of a rate hike is 87%, so Ethereum’s short-term direction faces uncertainty.
2. Interpretation of Technical Indicators
The moving average system is arranged bearishly. MA7 is 2508.38, MA25 is 2505.59, and price has fallen below the short-term moving averages. EMA7 and EMA25 are about to form a death cross. In terms of MACD, the DIF has dropped from 3.15 to 0.38; the histogram has turned negative and expanded to -0.81. The death cross is confirmed, and bearish momentum is strengthening. RSI6 is 42.98. Stoch RSI has fallen to 14.83, nearing oversold conditions, suggesting a potential technical rebound in the short term. The KDJ indicator’s J value is only 18.67, which also hints at oversold conditions. For the Bollinger Bands, price is moving between the lower-mid and lower bands, with the lower band at $2,479 acting as a key support. SAR is positioned above 2533, confirming a bearish signal. OBV continues to decline to -40829, indicating a clear net outflow of funds.
3. Long vs. Short Factors and Market Sentiment
Among 15 quantitative factors, 8 are bullish and 6 are bearish, but the composite signal is bearish, with a historical win rate of 65.79%. Flows show divergence: last week the BTC ETF saw a net outflow of $463 million, but the ETH ETF bucked the trend with a net inflow of $197 million, marking four consecutive weeks of inflows. The whale BitMine bought 27,180 ETH, while Abraxas established a $980 million short position. Wintermute also opened a $38.47 million short position. A whale holding 39,800 ETH with 25x leverage highlights non-negligible liquidation risk. Additionally, $63.8 million in ETH was transferred to exchanges, which may indicate potential sell pressure.
4. Outlook
In the short term, ETH is expected to trade sideways in the $2,479 to $2,520 range. If it breaks below $2,479, look for support at $2,470. If it breaks above $2,520, resistance to watch is $2,533. The CLARITY Act and the FOMC meeting are the key variables this week. Under extreme positioning, any breakout could trigger a chain reaction. It is recommended to control leverage and manage risk.
Today’s trending tokens: T price $0.00517, up 17.50%; MTL price $0.323, up 13.33%; CRWDB price $236.66, up 12.91%.
#BitcoinHoldsAbove$77000 #FedHikeOddsRiseTo89% #BitcoinCrosses$78000
1. Market Overview
As of 15:00 on September 14, Ethereum is trading at $2,503.53. Over the past few hours, it has been consolidating in a range of $2,487 to $2,518. This week’s macro events are packed: the CLARITY Act Senate vote is scheduled for the 15th, and the FOMC meeting will be held from the 16th to the 17th. The probability of a rate hike is 87%, so Ethereum’s short-term direction faces uncertainty.
2. Interpretation of Technical Indicators
The moving average system is arranged bearishly. MA7 is 2508.38, MA25 is 2505.59, and price has fallen below the short-term moving averages. EMA7 and EMA25 are about to form a death cross. In terms of MACD, the DIF has dropped from 3.15 to 0.38; the histogram has turned negative and expanded to -0.81. The death cross is confirmed, and bearish momentum is strengthening. RSI6 is 42.98. Stoch RSI has fallen to 14.83, nearing oversold conditions, suggesting a potential technical rebound in the short term. The KDJ indicator’s J value is only 18.67, which also hints at oversold conditions. For the Bollinger Bands, price is moving between the lower-mid and lower bands, with the lower band at $2,479 acting as a key support. SAR is positioned above 2533, confirming a bearish signal. OBV continues to decline to -40829, indicating a clear net outflow of funds.
3. Long vs. Short Factors and Market Sentiment
Among 15 quantitative factors, 8 are bullish and 6 are bearish, but the composite signal is bearish, with a historical win rate of 65.79%. Flows show divergence: last week the BTC ETF saw a net outflow of $463 million, but the ETH ETF bucked the trend with a net inflow of $197 million, marking four consecutive weeks of inflows. The whale BitMine bought 27,180 ETH, while Abraxas established a $980 million short position. Wintermute also opened a $38.47 million short position. A whale holding 39,800 ETH with 25x leverage highlights non-negligible liquidation risk. Additionally, $63.8 million in ETH was transferred to exchanges, which may indicate potential sell pressure.
4. Outlook
In the short term, ETH is expected to trade sideways in the $2,479 to $2,520 range. If it breaks below $2,479, look for support at $2,470. If it breaks above $2,520, resistance to watch is $2,533. The CLARITY Act and the FOMC meeting are the key variables this week. Under extreme positioning, any breakout could trigger a chain reaction. It is recommended to control leverage and manage risk.
Today’s trending tokens: T price $0.00517, up 17.50%; MTL price $0.323, up 13.33%; CRWDB price $236.66, up 12.91%.
#BitcoinHoldsAbove$77000 #FedHikeOddsRiseTo89% #BitcoinCrosses$78000
171
·
--
I. Ethereum Price Trend Analysis
As of 13:00 on September 14, 2026 (UTC), Ethereum (ETH) latest price is $2,506.66. Based on the last 5 hours of candlestick (K-line) data, ETH has experienced a clear downward trend. The price has gradually retreated from around $2,525, with the lowest point reaching $2,487.84. It is currently trading in a narrow range around the $2,500 level. The most recent candlestick formed a long lower shadow, suggesting that there is some support at the $2,500 psychological integer level.
From a trading volume perspective, the volume has increased significantly during the decline. The latest 1-hour K-line’s trading value reached $56.01 million USDT, far above the $15 million to $32 million range of the previous few K-lines. The combination of rising volume and falling price indicates that selling pressure is concentrated, and the bears have dominance in the short term. However, the latest candlestick closed with a small bullish body, with the price up by $0.52, which may imply that short-term selling momentum has weakened.
II. Interpretation of Technical Indicators
For the moving average system, ETH’s current price of $2,506 has fallen below the 7-period moving average of $2,510, but it still finds support near the 25-period moving average of $2,505 and the 99-period moving average of $2,503. The trend of short-term moving averages crossing downward through the medium-term moving averages is taking shape. If the price cannot quickly reclaim the 7-period moving average, it may further test the 25-period moving average support.
The MACD indicator shows a clear bearish signal. The MACD fast line has been steadily declining from 3.66 to 0.69, while the signal line has moved down from 0.92 to 1.38. The latest MACD histogram has turned negative (–0.69), and the fast and slow lines are about to form a dead cross. This pattern often suggests that short-term upward momentum is running out, and the price may enter a correction or downward phase.
The RSI indicator also points to a bearish direction. RSI6 fell sharply from 50.53 to 35.74, RSI12 declined from 52.94 to 45.11, and RSI24 dropped from 51.58 to 47.88. All three lines are moving down together, and RSI6 is nearing the oversold zone (below 30 is oversold). This indicates strong short-term selling pressure, though it has not yet reached an extreme oversold state.
The KDJ indicator shows the J value dropping rapidly from 60.52 to 8.86. The K and D values are 33.40 and 45.67 respectively. The three lines are arranged in a bearish configuration. The J value is far below the K and D values, implying a need for a short-term technical rebound, but the overall trend remains bearish.
For Bollinger Bands: upper band $2,533, middle band $2,506, and lower band $2,479. The current price is trading near the middle band. The Bollinger Band opening has narrowed slightly, suggesting that market volatility may be entering a convergence phase.
Based on statistics from 15 technical factors, there are 8 bearish factors (53.3%), 6 bullish factors (40%), and 1 neutral factor. The composite indicator issues a bearish signal: the bear win rate is 65.79%, and the overall win rate is 68.09%, indicating that the current technical outlook is tilted bearish.
III. Market Sentiment and Macro Factors
On the news front, Ethereum ETF flows recorded $197 million in net inflows last week, continuing four consecutive weeks of net inflows. Among them, the ETHA fund under BlackRock led the way. In contrast, Bitcoin ETF in the same period saw $463 million in net outflows, with roughly 6,000 BTC withdrawn. This rotation of funds from Bitcoin to Ethereum is evident, showing that institutional investors remain confident in Ethereum’s long-term prospects.
On the corporate accumulation side, BitMine Immersion Technologies recently bought 27,180 ETH, further reinforcing the narrative of Ethereum as an institutional settlement layer. In addition, the U.S. CLARITY Act will hold a procedural vote in the Senate on September 15. If passed, it could provide major positive stimulus to the entire crypto market. Analysts noted that the market is not yet pricing in sufficient expectations of this positive news; if the bill advances smoothly, it could trigger a sharp price jump.
However, risks should not be ignored. Hyperliquid has a highly leveraged long position of 39,800 ETH (about $100 million) with 25x leverage. If the market experiences sharp volatility, it could trigger a cascade of liquidations. Meanwhile, major trading institutions have accumulated more than $460 million in short positions, which is likely to suppress upside potential in the short term. At the macro level, the probability of the Federal Reserve raising rates by 25 basis points at the FOMC meeting on September 16–17 is as high as 87%. This would be the first rate hike since July 2023 and would place clear pressure on risk assets.
Overall, ETH’s short-term technical picture is bearish but nearing the oversold area, while the long-term fundamentals remain relatively solid. Investors should closely monitor whether the $2,500 support holds or breaks, as well as the directional choices brought by this week’s CLARITY Act vote and the FOMC rate decision.
IV. Trending Tokens and Topics
Today’s hot token gainers:
T (Threshold Network) current price $0.00538, 24h gain 22.55%
REZ (Renzo) current price $0.004662, 24h gain 19.35%
FIL (Filecoin) current price $1.0182, 24h gain 12.43%
#BitcoinHoldsAbove$77000 #FedHikeOddsRiseTo89% #BitcoinCrosses$78000
I. Ethereum Price Trend Analysis
As of 13:00 on September 14, 2026 (UTC), Ethereum (ETH) latest price is $2,506.66. Based on the last 5 hours of candlestick (K-line) data, ETH has experienced a clear downward trend. The price has gradually retreated from around $2,525, with the lowest point reaching $2,487.84. It is currently trading in a narrow range around the $2,500 level. The most recent candlestick formed a long lower shadow, suggesting that there is some support at the $2,500 psychological integer level.
From a trading volume perspective, the volume has increased significantly during the decline. The latest 1-hour K-line’s trading value reached $56.01 million USDT, far above the $15 million to $32 million range of the previous few K-lines. The combination of rising volume and falling price indicates that selling pressure is concentrated, and the bears have dominance in the short term. However, the latest candlestick closed with a small bullish body, with the price up by $0.52, which may imply that short-term selling momentum has weakened.
II. Interpretation of Technical Indicators
For the moving average system, ETH’s current price of $2,506 has fallen below the 7-period moving average of $2,510, but it still finds support near the 25-period moving average of $2,505 and the 99-period moving average of $2,503. The trend of short-term moving averages crossing downward through the medium-term moving averages is taking shape. If the price cannot quickly reclaim the 7-period moving average, it may further test the 25-period moving average support.
The MACD indicator shows a clear bearish signal. The MACD fast line has been steadily declining from 3.66 to 0.69, while the signal line has moved down from 0.92 to 1.38. The latest MACD histogram has turned negative (–0.69), and the fast and slow lines are about to form a dead cross. This pattern often suggests that short-term upward momentum is running out, and the price may enter a correction or downward phase.
The RSI indicator also points to a bearish direction. RSI6 fell sharply from 50.53 to 35.74, RSI12 declined from 52.94 to 45.11, and RSI24 dropped from 51.58 to 47.88. All three lines are moving down together, and RSI6 is nearing the oversold zone (below 30 is oversold). This indicates strong short-term selling pressure, though it has not yet reached an extreme oversold state.
The KDJ indicator shows the J value dropping rapidly from 60.52 to 8.86. The K and D values are 33.40 and 45.67 respectively. The three lines are arranged in a bearish configuration. The J value is far below the K and D values, implying a need for a short-term technical rebound, but the overall trend remains bearish.
For Bollinger Bands: upper band $2,533, middle band $2,506, and lower band $2,479. The current price is trading near the middle band. The Bollinger Band opening has narrowed slightly, suggesting that market volatility may be entering a convergence phase.
Based on statistics from 15 technical factors, there are 8 bearish factors (53.3%), 6 bullish factors (40%), and 1 neutral factor. The composite indicator issues a bearish signal: the bear win rate is 65.79%, and the overall win rate is 68.09%, indicating that the current technical outlook is tilted bearish.
III. Market Sentiment and Macro Factors
On the news front, Ethereum ETF flows recorded $197 million in net inflows last week, continuing four consecutive weeks of net inflows. Among them, the ETHA fund under BlackRock led the way. In contrast, Bitcoin ETF in the same period saw $463 million in net outflows, with roughly 6,000 BTC withdrawn. This rotation of funds from Bitcoin to Ethereum is evident, showing that institutional investors remain confident in Ethereum’s long-term prospects.
On the corporate accumulation side, BitMine Immersion Technologies recently bought 27,180 ETH, further reinforcing the narrative of Ethereum as an institutional settlement layer. In addition, the U.S. CLARITY Act will hold a procedural vote in the Senate on September 15. If passed, it could provide major positive stimulus to the entire crypto market. Analysts noted that the market is not yet pricing in sufficient expectations of this positive news; if the bill advances smoothly, it could trigger a sharp price jump.
However, risks should not be ignored. Hyperliquid has a highly leveraged long position of 39,800 ETH (about $100 million) with 25x leverage. If the market experiences sharp volatility, it could trigger a cascade of liquidations. Meanwhile, major trading institutions have accumulated more than $460 million in short positions, which is likely to suppress upside potential in the short term. At the macro level, the probability of the Federal Reserve raising rates by 25 basis points at the FOMC meeting on September 16–17 is as high as 87%. This would be the first rate hike since July 2023 and would place clear pressure on risk assets.
Overall, ETH’s short-term technical picture is bearish but nearing the oversold area, while the long-term fundamentals remain relatively solid. Investors should closely monitor whether the $2,500 support holds or breaks, as well as the directional choices brought by this week’s CLARITY Act vote and the FOMC rate decision.
IV. Trending Tokens and Topics
Today’s hot token gainers:
T (Threshold Network) current price $0.00538, 24h gain 22.55%
REZ (Renzo) current price $0.004662, 24h gain 19.35%
FIL (Filecoin) current price $1.0182, 24h gain 12.43%
#BitcoinHoldsAbove$77000 #FedHikeOddsRiseTo89% #BitcoinCrosses$78000
As of 13:00 on September 14, 2026 (UTC), Ethereum (ETH) latest price is $2,506.66. Based on the last 5 hours of candlestick (K-line) data, ETH has experienced a clear downward trend. The price has gradually retreated from around $2,525, with the lowest point reaching $2,487.84. It is currently trading in a narrow range around the $2,500 level. The most recent candlestick formed a long lower shadow, suggesting that there is some support at the $2,500 psychological integer level.
From a trading volume perspective, the volume has increased significantly during the decline. The latest 1-hour K-line’s trading value reached $56.01 million USDT, far above the $15 million to $32 million range of the previous few K-lines. The combination of rising volume and falling price indicates that selling pressure is concentrated, and the bears have dominance in the short term. However, the latest candlestick closed with a small bullish body, with the price up by $0.52, which may imply that short-term selling momentum has weakened.
II. Interpretation of Technical Indicators
For the moving average system, ETH’s current price of $2,506 has fallen below the 7-period moving average of $2,510, but it still finds support near the 25-period moving average of $2,505 and the 99-period moving average of $2,503. The trend of short-term moving averages crossing downward through the medium-term moving averages is taking shape. If the price cannot quickly reclaim the 7-period moving average, it may further test the 25-period moving average support.
The MACD indicator shows a clear bearish signal. The MACD fast line has been steadily declining from 3.66 to 0.69, while the signal line has moved down from 0.92 to 1.38. The latest MACD histogram has turned negative (–0.69), and the fast and slow lines are about to form a dead cross. This pattern often suggests that short-term upward momentum is running out, and the price may enter a correction or downward phase.
The RSI indicator also points to a bearish direction. RSI6 fell sharply from 50.53 to 35.74, RSI12 declined from 52.94 to 45.11, and RSI24 dropped from 51.58 to 47.88. All three lines are moving down together, and RSI6 is nearing the oversold zone (below 30 is oversold). This indicates strong short-term selling pressure, though it has not yet reached an extreme oversold state.
The KDJ indicator shows the J value dropping rapidly from 60.52 to 8.86. The K and D values are 33.40 and 45.67 respectively. The three lines are arranged in a bearish configuration. The J value is far below the K and D values, implying a need for a short-term technical rebound, but the overall trend remains bearish.
For Bollinger Bands: upper band $2,533, middle band $2,506, and lower band $2,479. The current price is trading near the middle band. The Bollinger Band opening has narrowed slightly, suggesting that market volatility may be entering a convergence phase.
Based on statistics from 15 technical factors, there are 8 bearish factors (53.3%), 6 bullish factors (40%), and 1 neutral factor. The composite indicator issues a bearish signal: the bear win rate is 65.79%, and the overall win rate is 68.09%, indicating that the current technical outlook is tilted bearish.
III. Market Sentiment and Macro Factors
On the news front, Ethereum ETF flows recorded $197 million in net inflows last week, continuing four consecutive weeks of net inflows. Among them, the ETHA fund under BlackRock led the way. In contrast, Bitcoin ETF in the same period saw $463 million in net outflows, with roughly 6,000 BTC withdrawn. This rotation of funds from Bitcoin to Ethereum is evident, showing that institutional investors remain confident in Ethereum’s long-term prospects.
On the corporate accumulation side, BitMine Immersion Technologies recently bought 27,180 ETH, further reinforcing the narrative of Ethereum as an institutional settlement layer. In addition, the U.S. CLARITY Act will hold a procedural vote in the Senate on September 15. If passed, it could provide major positive stimulus to the entire crypto market. Analysts noted that the market is not yet pricing in sufficient expectations of this positive news; if the bill advances smoothly, it could trigger a sharp price jump.
However, risks should not be ignored. Hyperliquid has a highly leveraged long position of 39,800 ETH (about $100 million) with 25x leverage. If the market experiences sharp volatility, it could trigger a cascade of liquidations. Meanwhile, major trading institutions have accumulated more than $460 million in short positions, which is likely to suppress upside potential in the short term. At the macro level, the probability of the Federal Reserve raising rates by 25 basis points at the FOMC meeting on September 16–17 is as high as 87%. This would be the first rate hike since July 2023 and would place clear pressure on risk assets.
Overall, ETH’s short-term technical picture is bearish but nearing the oversold area, while the long-term fundamentals remain relatively solid. Investors should closely monitor whether the $2,500 support holds or breaks, as well as the directional choices brought by this week’s CLARITY Act vote and the FOMC rate decision.
IV. Trending Tokens and Topics
Today’s hot token gainers:
T (Threshold Network) current price $0.00538, 24h gain 22.55%
REZ (Renzo) current price $0.004662, 24h gain 19.35%
FIL (Filecoin) current price $1.0182, 24h gain 12.43%
#BitcoinHoldsAbove$77000 #FedHikeOddsRiseTo89% #BitcoinCrosses$78000
·
--
I. Market Overview
Bitcoin is currently trading around $78,150. Over the past few hours, the price quickly rebounded from a low of $77,481 to $78,376, showing strong rebound momentum. From the Bollinger Bands indicator, the upper band is at $78,442, the middle band at $77,560, and the lower band at $76,678. The current price is already close to the upper band, indicating that in the short term the price has entered a relatively strong zone. However, the Bollinger Band width is expanding, with the standard deviation rising from 143 to 252, suggesting that market volatility is increasing. Investors should be cautious about the risk of a potential short-term pullback.
II. Interpretation of Technical Indicators
From the moving averages, the 7-day MA is at $77,971, the 25-day MA is at $77,500, and the 99-day MA is at $77,310. The three moving averages are arranged in a bullish formation, and the price is holding above all of them—this is a signal that the short-term trend is biased bullish. In terms of EMA, the 7-period EMA is at $77,992, the 25-period EMA at $77,607, and the 99-period EMA at $77,566, which also reflects a bullish structure. The MACD shows the DIF line at 247.17, the signal line at 177.00, and the histogram at 70.18. MACD remains positive and the histogram is continuously expanding, indicating that bullish momentum is strengthening. Regarding RSI, the 6-period RSI is 72.93, the 12-period RSI is 67.82, and the 24-period RSI is 62.05; overall it is in a neutral-to-strong area. However, the 6-period RSI is already approaching the 70 overbought line, so the risk of chasing price higher in the short term should not be ignored. In the KDJ indicator, the K value is 69.96, the D value is 67.26, and the J value is 75.36. The three lines are diverging upward, but the J value is somewhat high, so short-term pullback risk should be monitored. ATR is $386, which is higher than earlier, confirming that volatility is expanding. The SAR parabolic indicator is currently at $77,482, and the price is trading above the SAR, maintaining a bullish signal.
III. Analysis of Composite Signals
The AI composite signal system gives a bearish judgment for BTCUSDT. Among 15 quantitative factors, 5 are bullish and 10 are bearish, meaning the bearish ratio is as high as 66.67%. The composite indicator value is -1.24, and the signal direction is bearish. The historical win rate is as high as 83.33%. This suggests that although the technical picture is slightly bullish in the short term, the statistical factors indicate that pullback risk should not be overlooked. In particular, the alpha9 factor shows a sharp outflow of funds, while factors such as alpha23 and alpha25 also send bearish signals, implying that the current rebound may lack sustained capital support. The divergence between bullish and bearish factors reflects the market’s hesitant stance ahead of major macro events.
IV. Market Sentiment and Macro Factors
The current market is being hit by multiple macro events. The U.S. Senate will hold a procedural vote on the CLARITY bill on September 15. This is one of the most important crypto-market structure legislations in recent years, and it requires 60 votes to move forward. If the bill is unexpectedly passed, Bernstein analysts believe Bitcoin could surge to $100,000; however, the probability of passage priced in by the prediction market is currently only about 30%. On the other hand, the federal funds futures market prices the probability of a 25-basis-point Fed rate hike on September 17 at as high as 87%. This would be the first hike since July 2023, and tighter expectations would clearly suppress risk assets. In addition, U.S. spot Bitcoin ETFs saw net redemptions of $463 million last week, roughly 6,000 Bitcoins were withdrawn, ending three consecutive weeks of net inflows. This indicates slowing institutional demand. Nevertheless, listed companies continue to accumulate Bitcoin, which to some extent offsets the redemption pressure from ETF flows.
V. Trading Recommendations
Given the contradictory setup—technical indicators lean bullish, while quantitative signals lean bearish—investors should remain cautious. For short-term support, watch $77,500 (the 25-day MA) and $76,678 (the lower Bollinger Band). For resistance, watch $78,490 (recent high) and $78,442 (the upper Bollinger Band). In this week’s dense stream of macro events, the CLARITY bill vote and the Fed’s policy meeting will dominate market direction. It is advisable to control position sizing, avoid chasing rallies or panic selling, closely monitor how the market reacts after policy developments, and wait until the direction becomes clearer before making decisions.
Trending Token Updates
T (Threatence) current price: $0.00549, 24h change: +24.49%
REZ (Renzo) current price: $0.004427, 24h change: +16.56%
FIL (Filecoin) current price: $0.9923, 24h change: +13.65%
#BitcoinHoldsAbove$77000 #FedHikeOddsRiseTo89% #BitcoinCrosses$78000
I. Market Overview
Bitcoin is currently trading around $78,150. Over the past few hours, the price quickly rebounded from a low of $77,481 to $78,376, showing strong rebound momentum. From the Bollinger Bands indicator, the upper band is at $78,442, the middle band at $77,560, and the lower band at $76,678. The current price is already close to the upper band, indicating that in the short term the price has entered a relatively strong zone. However, the Bollinger Band width is expanding, with the standard deviation rising from 143 to 252, suggesting that market volatility is increasing. Investors should be cautious about the risk of a potential short-term pullback.
II. Interpretation of Technical Indicators
From the moving averages, the 7-day MA is at $77,971, the 25-day MA is at $77,500, and the 99-day MA is at $77,310. The three moving averages are arranged in a bullish formation, and the price is holding above all of them—this is a signal that the short-term trend is biased bullish. In terms of EMA, the 7-period EMA is at $77,992, the 25-period EMA at $77,607, and the 99-period EMA at $77,566, which also reflects a bullish structure. The MACD shows the DIF line at 247.17, the signal line at 177.00, and the histogram at 70.18. MACD remains positive and the histogram is continuously expanding, indicating that bullish momentum is strengthening. Regarding RSI, the 6-period RSI is 72.93, the 12-period RSI is 67.82, and the 24-period RSI is 62.05; overall it is in a neutral-to-strong area. However, the 6-period RSI is already approaching the 70 overbought line, so the risk of chasing price higher in the short term should not be ignored. In the KDJ indicator, the K value is 69.96, the D value is 67.26, and the J value is 75.36. The three lines are diverging upward, but the J value is somewhat high, so short-term pullback risk should be monitored. ATR is $386, which is higher than earlier, confirming that volatility is expanding. The SAR parabolic indicator is currently at $77,482, and the price is trading above the SAR, maintaining a bullish signal.
III. Analysis of Composite Signals
The AI composite signal system gives a bearish judgment for BTCUSDT. Among 15 quantitative factors, 5 are bullish and 10 are bearish, meaning the bearish ratio is as high as 66.67%. The composite indicator value is -1.24, and the signal direction is bearish. The historical win rate is as high as 83.33%. This suggests that although the technical picture is slightly bullish in the short term, the statistical factors indicate that pullback risk should not be overlooked. In particular, the alpha9 factor shows a sharp outflow of funds, while factors such as alpha23 and alpha25 also send bearish signals, implying that the current rebound may lack sustained capital support. The divergence between bullish and bearish factors reflects the market’s hesitant stance ahead of major macro events.
IV. Market Sentiment and Macro Factors
The current market is being hit by multiple macro events. The U.S. Senate will hold a procedural vote on the CLARITY bill on September 15. This is one of the most important crypto-market structure legislations in recent years, and it requires 60 votes to move forward. If the bill is unexpectedly passed, Bernstein analysts believe Bitcoin could surge to $100,000; however, the probability of passage priced in by the prediction market is currently only about 30%. On the other hand, the federal funds futures market prices the probability of a 25-basis-point Fed rate hike on September 17 at as high as 87%. This would be the first hike since July 2023, and tighter expectations would clearly suppress risk assets. In addition, U.S. spot Bitcoin ETFs saw net redemptions of $463 million last week, roughly 6,000 Bitcoins were withdrawn, ending three consecutive weeks of net inflows. This indicates slowing institutional demand. Nevertheless, listed companies continue to accumulate Bitcoin, which to some extent offsets the redemption pressure from ETF flows.
V. Trading Recommendations
Given the contradictory setup—technical indicators lean bullish, while quantitative signals lean bearish—investors should remain cautious. For short-term support, watch $77,500 (the 25-day MA) and $76,678 (the lower Bollinger Band). For resistance, watch $78,490 (recent high) and $78,442 (the upper Bollinger Band). In this week’s dense stream of macro events, the CLARITY bill vote and the Fed’s policy meeting will dominate market direction. It is advisable to control position sizing, avoid chasing rallies or panic selling, closely monitor how the market reacts after policy developments, and wait until the direction becomes clearer before making decisions.
Trending Token Updates
T (Threatence) current price: $0.00549, 24h change: +24.49%
REZ (Renzo) current price: $0.004427, 24h change: +16.56%
FIL (Filecoin) current price: $0.9923, 24h change: +13.65%
#BitcoinHoldsAbove$77000 #FedHikeOddsRiseTo89% #BitcoinCrosses$78000
Bitcoin is currently trading around $78,150. Over the past few hours, the price quickly rebounded from a low of $77,481 to $78,376, showing strong rebound momentum. From the Bollinger Bands indicator, the upper band is at $78,442, the middle band at $77,560, and the lower band at $76,678. The current price is already close to the upper band, indicating that in the short term the price has entered a relatively strong zone. However, the Bollinger Band width is expanding, with the standard deviation rising from 143 to 252, suggesting that market volatility is increasing. Investors should be cautious about the risk of a potential short-term pullback.
II. Interpretation of Technical Indicators
From the moving averages, the 7-day MA is at $77,971, the 25-day MA is at $77,500, and the 99-day MA is at $77,310. The three moving averages are arranged in a bullish formation, and the price is holding above all of them—this is a signal that the short-term trend is biased bullish. In terms of EMA, the 7-period EMA is at $77,992, the 25-period EMA at $77,607, and the 99-period EMA at $77,566, which also reflects a bullish structure. The MACD shows the DIF line at 247.17, the signal line at 177.00, and the histogram at 70.18. MACD remains positive and the histogram is continuously expanding, indicating that bullish momentum is strengthening. Regarding RSI, the 6-period RSI is 72.93, the 12-period RSI is 67.82, and the 24-period RSI is 62.05; overall it is in a neutral-to-strong area. However, the 6-period RSI is already approaching the 70 overbought line, so the risk of chasing price higher in the short term should not be ignored. In the KDJ indicator, the K value is 69.96, the D value is 67.26, and the J value is 75.36. The three lines are diverging upward, but the J value is somewhat high, so short-term pullback risk should be monitored. ATR is $386, which is higher than earlier, confirming that volatility is expanding. The SAR parabolic indicator is currently at $77,482, and the price is trading above the SAR, maintaining a bullish signal.
III. Analysis of Composite Signals
The AI composite signal system gives a bearish judgment for BTCUSDT. Among 15 quantitative factors, 5 are bullish and 10 are bearish, meaning the bearish ratio is as high as 66.67%. The composite indicator value is -1.24, and the signal direction is bearish. The historical win rate is as high as 83.33%. This suggests that although the technical picture is slightly bullish in the short term, the statistical factors indicate that pullback risk should not be overlooked. In particular, the alpha9 factor shows a sharp outflow of funds, while factors such as alpha23 and alpha25 also send bearish signals, implying that the current rebound may lack sustained capital support. The divergence between bullish and bearish factors reflects the market’s hesitant stance ahead of major macro events.
IV. Market Sentiment and Macro Factors
The current market is being hit by multiple macro events. The U.S. Senate will hold a procedural vote on the CLARITY bill on September 15. This is one of the most important crypto-market structure legislations in recent years, and it requires 60 votes to move forward. If the bill is unexpectedly passed, Bernstein analysts believe Bitcoin could surge to $100,000; however, the probability of passage priced in by the prediction market is currently only about 30%. On the other hand, the federal funds futures market prices the probability of a 25-basis-point Fed rate hike on September 17 at as high as 87%. This would be the first hike since July 2023, and tighter expectations would clearly suppress risk assets. In addition, U.S. spot Bitcoin ETFs saw net redemptions of $463 million last week, roughly 6,000 Bitcoins were withdrawn, ending three consecutive weeks of net inflows. This indicates slowing institutional demand. Nevertheless, listed companies continue to accumulate Bitcoin, which to some extent offsets the redemption pressure from ETF flows.
V. Trading Recommendations
Given the contradictory setup—technical indicators lean bullish, while quantitative signals lean bearish—investors should remain cautious. For short-term support, watch $77,500 (the 25-day MA) and $76,678 (the lower Bollinger Band). For resistance, watch $78,490 (recent high) and $78,442 (the upper Bollinger Band). In this week’s dense stream of macro events, the CLARITY bill vote and the Fed’s policy meeting will dominate market direction. It is advisable to control position sizing, avoid chasing rallies or panic selling, closely monitor how the market reacts after policy developments, and wait until the direction becomes clearer before making decisions.
Trending Token Updates
T (Threatence) current price: $0.00549, 24h change: +24.49%
REZ (Renzo) current price: $0.004427, 24h change: +16.56%
FIL (Filecoin) current price: $0.9923, 24h change: +13.65%
#BitcoinHoldsAbove$77000 #FedHikeOddsRiseTo89% #BitcoinCrosses$78000
·
--
Ethereum (ETH) Market Analysis: The Long vs Short Game Around the $2,500 Level and Short-Term Directional Outlook
On September 14, 2026, the Ethereum price traded in a tight range near $2,500. The latest traded price is around $2,506. Over the past few hours, the ETH price has gradually pulled back from a high of $2,535, with a low of $2,487. It is currently in a critical zone where bulls and bears are fiercely battling. This article analyzes ETH’s short-term outlook from four dimensions: price action, technical indicators, market sentiment, and the macro environment.
I. Price Action Analysis
Based on hourly candlestick data, ETH has shown a clear downward trend over the past 5 hours. The price slid continuously from $2,523 to around $2,505, a drop of about 0.7%. Notably, the most recent candlestick shows signs of stabilization: after finding support at $2,487, price rebounded to $2,508. Meanwhile, trading volume surged significantly to 41.5 million USDT, noticeably higher than in the previous few hours. This suggests that strong buy-side support exists in the $2,480–$2,490 range. From the Bollinger Bands indicator, the price is currently hovering around the midline at $2,507. The upper band at $2,534 acts as near-term resistance, while the lower band at $2,480 is the key support. If price can hold effectively above the midline, it may attempt a push toward the upper band; if price breaks below the lower band, it could trigger further pullback.
II. Interpretation of Technical Indicators
The MACD indicator shows the fast line falling steadily from 3.85 to 2.10, while the slow line has risen from 0.24 to 1.69. The gap between the two is rapidly narrowing, and the histogram has shrunk from 3.61 to 0.41. This suggests that earlier bullish momentum is weakening. If the fast line crosses below the slow line to form a bearish “dead cross,” it would confirm a short-term bearish signal. Regarding the RSI indicator, RSI6 is 46.43, RSI12 is 50.20, and RSI24 is 50.26; all three are in the neutral zone, indicating that bullish and bearish forces are relatively balanced. In the KDJ indicator, K is 41.78, D is 53.74, and J is only 17.87. The very low J value points to heavy short-term oversold pressure and implies a need for a technical rebound. Based on 15 technical factors in total, 8 are bearish (53.3%), 6 are bullish (40%), and 1 is neutral. The aggregated signal points to the bearish direction, with a historical win rate of 65.79%. However, the historical win rate of bullish factors is as high as 77.78%, suggesting that if the price turns upward, the upside room could be quite meaningful.
III. Market Sentiment and Fund Flows
On the news front, Ethereum ETFs attracted a net inflow of $197 million last week, continuing a streak of net inflows for four consecutive weeks. Among them, BlackRock’s ETHA led with $140 million. This contrasts sharply with Bitcoin ETFs’ net outflow of $463 million last week, indicating that institutional capital is rotating toward Ethereum. In addition, BitMine recently purchased 27,180 ETH, further reinforcing the institutional-grade settlement asset narrative for Ethereum. Still, risk factors cannot be ignored. On Hyperliquid, there is an approximately 39,800 ETH (about $100 million) 25x leveraged long position. If the market experiences sharp volatility, it could trigger a cascade of liquidations. Meanwhile, major trading institutions have collectively built more than $460 million in short positions, exerting clear pressure on price in the short term. The OBV indicator has continued to fall into negative territory, which also verifies the net outflow trend.
IV. Macro Environment and Short-Term Outlook
This week’s macro events are highly concentrated. On September 15, the U.S. Senate will hold a procedural vote on the CLARITY bill. This bill is the most important crypto market-structure legislation in recent years. If passed, it would be a major positive for the entire crypto industry. In addition, the Fed’s September 17 interest-rate decision is approaching. The futures market is pricing an 87% probability of a 25-basis-point rate hike, which would be the first hike since July 2023 and could cause a short-term shock to risk assets. For Ethereum, $2,480 is a key short-term support level; if it breaks, price may dip into the $2,450 area. Resistance is at $2,535; after a breakout, Ethereum could challenge $2,560. Investors are advised to closely monitor the CLARITY bill vote outcome and the Fed decision, and to manage position risk in an environment with high macro uncertainty.
Hot Tokens to Watch
1. QKC (QuarkChain): current price $0.002916, up 17.82% in the past 24 hours
2. FIL (Filecoin): current price $0.9903, up 17.20% in the past 24 hours
3. T (Threshold): current price $0.00516, up 16.48% in the past 24 hours
#BitcoinHoldsAbove$77000 #BitcoinCrosses$78000 #AvalancheIntegratesIntoUAEPassDigitalVault
Ethereum (ETH) Market Analysis: The Long vs Short Game Around the $2,500 Level and Short-Term Directional Outlook
On September 14, 2026, the Ethereum price traded in a tight range near $2,500. The latest traded price is around $2,506. Over the past few hours, the ETH price has gradually pulled back from a high of $2,535, with a low of $2,487. It is currently in a critical zone where bulls and bears are fiercely battling. This article analyzes ETH’s short-term outlook from four dimensions: price action, technical indicators, market sentiment, and the macro environment.
I. Price Action Analysis
Based on hourly candlestick data, ETH has shown a clear downward trend over the past 5 hours. The price slid continuously from $2,523 to around $2,505, a drop of about 0.7%. Notably, the most recent candlestick shows signs of stabilization: after finding support at $2,487, price rebounded to $2,508. Meanwhile, trading volume surged significantly to 41.5 million USDT, noticeably higher than in the previous few hours. This suggests that strong buy-side support exists in the $2,480–$2,490 range. From the Bollinger Bands indicator, the price is currently hovering around the midline at $2,507. The upper band at $2,534 acts as near-term resistance, while the lower band at $2,480 is the key support. If price can hold effectively above the midline, it may attempt a push toward the upper band; if price breaks below the lower band, it could trigger further pullback.
II. Interpretation of Technical Indicators
The MACD indicator shows the fast line falling steadily from 3.85 to 2.10, while the slow line has risen from 0.24 to 1.69. The gap between the two is rapidly narrowing, and the histogram has shrunk from 3.61 to 0.41. This suggests that earlier bullish momentum is weakening. If the fast line crosses below the slow line to form a bearish “dead cross,” it would confirm a short-term bearish signal. Regarding the RSI indicator, RSI6 is 46.43, RSI12 is 50.20, and RSI24 is 50.26; all three are in the neutral zone, indicating that bullish and bearish forces are relatively balanced. In the KDJ indicator, K is 41.78, D is 53.74, and J is only 17.87. The very low J value points to heavy short-term oversold pressure and implies a need for a technical rebound. Based on 15 technical factors in total, 8 are bearish (53.3%), 6 are bullish (40%), and 1 is neutral. The aggregated signal points to the bearish direction, with a historical win rate of 65.79%. However, the historical win rate of bullish factors is as high as 77.78%, suggesting that if the price turns upward, the upside room could be quite meaningful.
III. Market Sentiment and Fund Flows
On the news front, Ethereum ETFs attracted a net inflow of $197 million last week, continuing a streak of net inflows for four consecutive weeks. Among them, BlackRock’s ETHA led with $140 million. This contrasts sharply with Bitcoin ETFs’ net outflow of $463 million last week, indicating that institutional capital is rotating toward Ethereum. In addition, BitMine recently purchased 27,180 ETH, further reinforcing the institutional-grade settlement asset narrative for Ethereum. Still, risk factors cannot be ignored. On Hyperliquid, there is an approximately 39,800 ETH (about $100 million) 25x leveraged long position. If the market experiences sharp volatility, it could trigger a cascade of liquidations. Meanwhile, major trading institutions have collectively built more than $460 million in short positions, exerting clear pressure on price in the short term. The OBV indicator has continued to fall into negative territory, which also verifies the net outflow trend.
IV. Macro Environment and Short-Term Outlook
This week’s macro events are highly concentrated. On September 15, the U.S. Senate will hold a procedural vote on the CLARITY bill. This bill is the most important crypto market-structure legislation in recent years. If passed, it would be a major positive for the entire crypto industry. In addition, the Fed’s September 17 interest-rate decision is approaching. The futures market is pricing an 87% probability of a 25-basis-point rate hike, which would be the first hike since July 2023 and could cause a short-term shock to risk assets. For Ethereum, $2,480 is a key short-term support level; if it breaks, price may dip into the $2,450 area. Resistance is at $2,535; after a breakout, Ethereum could challenge $2,560. Investors are advised to closely monitor the CLARITY bill vote outcome and the Fed decision, and to manage position risk in an environment with high macro uncertainty.
Hot Tokens to Watch
1. QKC (QuarkChain): current price $0.002916, up 17.82% in the past 24 hours
2. FIL (Filecoin): current price $0.9903, up 17.20% in the past 24 hours
3. T (Threshold): current price $0.00516, up 16.48% in the past 24 hours
#BitcoinHoldsAbove$77000 #BitcoinCrosses$78000 #AvalancheIntegratesIntoUAEPassDigitalVault
On September 14, 2026, the Ethereum price traded in a tight range near $2,500. The latest traded price is around $2,506. Over the past few hours, the ETH price has gradually pulled back from a high of $2,535, with a low of $2,487. It is currently in a critical zone where bulls and bears are fiercely battling. This article analyzes ETH’s short-term outlook from four dimensions: price action, technical indicators, market sentiment, and the macro environment.
I. Price Action Analysis
Based on hourly candlestick data, ETH has shown a clear downward trend over the past 5 hours. The price slid continuously from $2,523 to around $2,505, a drop of about 0.7%. Notably, the most recent candlestick shows signs of stabilization: after finding support at $2,487, price rebounded to $2,508. Meanwhile, trading volume surged significantly to 41.5 million USDT, noticeably higher than in the previous few hours. This suggests that strong buy-side support exists in the $2,480–$2,490 range. From the Bollinger Bands indicator, the price is currently hovering around the midline at $2,507. The upper band at $2,534 acts as near-term resistance, while the lower band at $2,480 is the key support. If price can hold effectively above the midline, it may attempt a push toward the upper band; if price breaks below the lower band, it could trigger further pullback.
II. Interpretation of Technical Indicators
The MACD indicator shows the fast line falling steadily from 3.85 to 2.10, while the slow line has risen from 0.24 to 1.69. The gap between the two is rapidly narrowing, and the histogram has shrunk from 3.61 to 0.41. This suggests that earlier bullish momentum is weakening. If the fast line crosses below the slow line to form a bearish “dead cross,” it would confirm a short-term bearish signal. Regarding the RSI indicator, RSI6 is 46.43, RSI12 is 50.20, and RSI24 is 50.26; all three are in the neutral zone, indicating that bullish and bearish forces are relatively balanced. In the KDJ indicator, K is 41.78, D is 53.74, and J is only 17.87. The very low J value points to heavy short-term oversold pressure and implies a need for a technical rebound. Based on 15 technical factors in total, 8 are bearish (53.3%), 6 are bullish (40%), and 1 is neutral. The aggregated signal points to the bearish direction, with a historical win rate of 65.79%. However, the historical win rate of bullish factors is as high as 77.78%, suggesting that if the price turns upward, the upside room could be quite meaningful.
III. Market Sentiment and Fund Flows
On the news front, Ethereum ETFs attracted a net inflow of $197 million last week, continuing a streak of net inflows for four consecutive weeks. Among them, BlackRock’s ETHA led with $140 million. This contrasts sharply with Bitcoin ETFs’ net outflow of $463 million last week, indicating that institutional capital is rotating toward Ethereum. In addition, BitMine recently purchased 27,180 ETH, further reinforcing the institutional-grade settlement asset narrative for Ethereum. Still, risk factors cannot be ignored. On Hyperliquid, there is an approximately 39,800 ETH (about $100 million) 25x leveraged long position. If the market experiences sharp volatility, it could trigger a cascade of liquidations. Meanwhile, major trading institutions have collectively built more than $460 million in short positions, exerting clear pressure on price in the short term. The OBV indicator has continued to fall into negative territory, which also verifies the net outflow trend.
IV. Macro Environment and Short-Term Outlook
This week’s macro events are highly concentrated. On September 15, the U.S. Senate will hold a procedural vote on the CLARITY bill. This bill is the most important crypto market-structure legislation in recent years. If passed, it would be a major positive for the entire crypto industry. In addition, the Fed’s September 17 interest-rate decision is approaching. The futures market is pricing an 87% probability of a 25-basis-point rate hike, which would be the first hike since July 2023 and could cause a short-term shock to risk assets. For Ethereum, $2,480 is a key short-term support level; if it breaks, price may dip into the $2,450 area. Resistance is at $2,535; after a breakout, Ethereum could challenge $2,560. Investors are advised to closely monitor the CLARITY bill vote outcome and the Fed decision, and to manage position risk in an environment with high macro uncertainty.
Hot Tokens to Watch
1. QKC (QuarkChain): current price $0.002916, up 17.82% in the past 24 hours
2. FIL (Filecoin): current price $0.9903, up 17.20% in the past 24 hours
3. T (Threshold): current price $0.00516, up 16.48% in the past 24 hours
#BitcoinHoldsAbove$77000 #BitcoinCrosses$78000 #AvalancheIntegratesIntoUAEPassDigitalVault
1
·
--
I. Review of Bitcoin Price Trends
As of 12:00 (UTC) on September 14, 2026, Bitcoin (BTC) latest price is $77,824, with a gain of about 1.3% over the past 24 hours. From the hourly chart, the price has been oscillating within the range of $77,400 to $78,370. Recently, the price rebounded from around $76,700 to the $77,800 level, indicating some buy support at lower prices. However, trading volume shows a gradual shrinking trend. The latest hour’s trading value is approximately $24.62 million, down clearly from $56 million in the previous few hours, suggesting that market participation has decreased and that the bulls have not yet formed a strong breakout.
II. In-Depth Interpretation of Technical Indicators
In terms of moving averages, the 7-hour moving average is at $77,846, the 25-hour moving average at $77,423, and the 99-hour moving average at $77,301. Price is trading above the 25-hour and 99-hour moving averages, but it is relatively close to the 7-hour moving average, so the short-term direction is not entirely clear. For the Bollinger Bands, the upper band is $78,244, the middle band is $77,488, and the lower band is $76,733. The current price is between the middle and upper bands, which is neutral to slightly bullish, though overhead pressure near the upper band remains noticeable.
For the MACD indicator, the DIF line is 181.65, the DEA line is 153.25, and the histogram value is 28.40. The histogram has been narrowing for several consecutive hours, falling from 92.37 to 28.40, indicating that bullish momentum is gradually weakening. If the histogram continues to shrink and even forms a dead cross later, the risk of a short-term pullback will increase.
For the RSI indicator, the 6-period RSI is 54.84, the 12-period RSI is 57.24, and the 24-period RSI is 55.46. All three are in the neutral range of 50 to 60, meaning the market is neither overbought nor oversold. This suggests the market is in a phase of directional selection. For the KDJ indicator, K is 49.82, D is 62.50, and J is 24.49. With J at a relatively low level, if the K line moves upward and crosses above the D line, it could form a golden-cross buy signal.
Worth noting is that the combined technical signal system shows that among the current 15 factors, 8 are bearish and 7 are bullish. Bearish share is 53.33%, bullish share is 46.67%. The overall indicator provides a bearish signal, with a historical win rate of 72.73%. This implies that in the short term the technical picture is slightly tilted toward a pullback, but the disagreement between bulls and bears is not large—overall the market is in a stalemate.
III. Market Sentiment and Macro Outlook
In the macro environment, the probability of the Fed raising rates by 25 basis points on September 17 is as high as 87%. This would be the first rate hike since July 2023, exerting a clear drag on risk assets. Last week, Bitcoin spot ETF net outflows totaled $463 million, ending the prior streak of net inflows for three consecutive weeks, indicating that institutional demand has weakened in the near term.
However, there are also positive factors. On September 15, the U.S. Senate will hold a procedural vote on the CLARITY Act. This bill is one of the most important crypto market-structure legislative efforts in recent years. If passed, it would provide legal certainty for institutional capital to enter the crypto market. Bernstein, an analysis firm, warned that the market has not yet priced in the likelihood of the bill’s passage sufficiently. If it is unexpectedly passed, BTC could surge toward the $100,000 level.
In addition, institutional buying is still ongoing. Recently, an institution bought 469 BTC at an average price of $77,954, for a total value of about $36.6 million, suggesting that even at current levels there is still large capital willing to step in. CryptoQuant noted that BTC needs to break above $81,700 to confirm the start of a new bull cycle. The current price is still about 5% below that threshold.
IV. Overall Assessment
In the short term, Bitcoin is maintaining a narrow trading range between $77,000 and $78,000. The technical outlook is slightly bearish, though the disagreement is not significant, while the macro picture is caught in a dual battle between pressure from rate hikes and supportive policy developments. If the CLARITY Act advances smoothly, it could become a catalyst for an upside breakout; if the bill is stalled or fails alongside the rate-hike implementation, the probability of a short-term pullback toward the $76,000 area would increase. Investors should closely monitor the Senate vote on Tuesday and the Fed rate decision on Wednesday, prepare for both scenarios, and manage position sizing and risk.
V. Watchlist: Popular Tokens
1. QKC (QuarkChain): Current price $0.003162, 24-hour gain 28.02%, trading volume $2.11 million, daily high $0.003588, daily low $0.002360.
2. T (Threshold): Current price $0.00520, 24-hour gain 18.18%, trading volume $7.43 million, daily high $0.00610, daily low $0.00431.
3. FIL (Filecoin): Current price $0.9891, 24-hour gain 18.16%, trading volume $63.48 million, daily high $1.0370, daily low $0.8340.
#BitcoinHoldsAbove$77000 #BitcoinCrosses$78000 #AvalancheIntegratesIntoUAEPassDigitalVault
I. Review of Bitcoin Price Trends
As of 12:00 (UTC) on September 14, 2026, Bitcoin (BTC) latest price is $77,824, with a gain of about 1.3% over the past 24 hours. From the hourly chart, the price has been oscillating within the range of $77,400 to $78,370. Recently, the price rebounded from around $76,700 to the $77,800 level, indicating some buy support at lower prices. However, trading volume shows a gradual shrinking trend. The latest hour’s trading value is approximately $24.62 million, down clearly from $56 million in the previous few hours, suggesting that market participation has decreased and that the bulls have not yet formed a strong breakout.
II. In-Depth Interpretation of Technical Indicators
In terms of moving averages, the 7-hour moving average is at $77,846, the 25-hour moving average at $77,423, and the 99-hour moving average at $77,301. Price is trading above the 25-hour and 99-hour moving averages, but it is relatively close to the 7-hour moving average, so the short-term direction is not entirely clear. For the Bollinger Bands, the upper band is $78,244, the middle band is $77,488, and the lower band is $76,733. The current price is between the middle and upper bands, which is neutral to slightly bullish, though overhead pressure near the upper band remains noticeable.
For the MACD indicator, the DIF line is 181.65, the DEA line is 153.25, and the histogram value is 28.40. The histogram has been narrowing for several consecutive hours, falling from 92.37 to 28.40, indicating that bullish momentum is gradually weakening. If the histogram continues to shrink and even forms a dead cross later, the risk of a short-term pullback will increase.
For the RSI indicator, the 6-period RSI is 54.84, the 12-period RSI is 57.24, and the 24-period RSI is 55.46. All three are in the neutral range of 50 to 60, meaning the market is neither overbought nor oversold. This suggests the market is in a phase of directional selection. For the KDJ indicator, K is 49.82, D is 62.50, and J is 24.49. With J at a relatively low level, if the K line moves upward and crosses above the D line, it could form a golden-cross buy signal.
Worth noting is that the combined technical signal system shows that among the current 15 factors, 8 are bearish and 7 are bullish. Bearish share is 53.33%, bullish share is 46.67%. The overall indicator provides a bearish signal, with a historical win rate of 72.73%. This implies that in the short term the technical picture is slightly tilted toward a pullback, but the disagreement between bulls and bears is not large—overall the market is in a stalemate.
III. Market Sentiment and Macro Outlook
In the macro environment, the probability of the Fed raising rates by 25 basis points on September 17 is as high as 87%. This would be the first rate hike since July 2023, exerting a clear drag on risk assets. Last week, Bitcoin spot ETF net outflows totaled $463 million, ending the prior streak of net inflows for three consecutive weeks, indicating that institutional demand has weakened in the near term.
However, there are also positive factors. On September 15, the U.S. Senate will hold a procedural vote on the CLARITY Act. This bill is one of the most important crypto market-structure legislative efforts in recent years. If passed, it would provide legal certainty for institutional capital to enter the crypto market. Bernstein, an analysis firm, warned that the market has not yet priced in the likelihood of the bill’s passage sufficiently. If it is unexpectedly passed, BTC could surge toward the $100,000 level.
In addition, institutional buying is still ongoing. Recently, an institution bought 469 BTC at an average price of $77,954, for a total value of about $36.6 million, suggesting that even at current levels there is still large capital willing to step in. CryptoQuant noted that BTC needs to break above $81,700 to confirm the start of a new bull cycle. The current price is still about 5% below that threshold.
IV. Overall Assessment
In the short term, Bitcoin is maintaining a narrow trading range between $77,000 and $78,000. The technical outlook is slightly bearish, though the disagreement is not significant, while the macro picture is caught in a dual battle between pressure from rate hikes and supportive policy developments. If the CLARITY Act advances smoothly, it could become a catalyst for an upside breakout; if the bill is stalled or fails alongside the rate-hike implementation, the probability of a short-term pullback toward the $76,000 area would increase. Investors should closely monitor the Senate vote on Tuesday and the Fed rate decision on Wednesday, prepare for both scenarios, and manage position sizing and risk.
V. Watchlist: Popular Tokens
1. QKC (QuarkChain): Current price $0.003162, 24-hour gain 28.02%, trading volume $2.11 million, daily high $0.003588, daily low $0.002360.
2. T (Threshold): Current price $0.00520, 24-hour gain 18.18%, trading volume $7.43 million, daily high $0.00610, daily low $0.00431.
3. FIL (Filecoin): Current price $0.9891, 24-hour gain 18.16%, trading volume $63.48 million, daily high $1.0370, daily low $0.8340.
#BitcoinHoldsAbove$77000 #BitcoinCrosses$78000 #AvalancheIntegratesIntoUAEPassDigitalVault
As of 12:00 (UTC) on September 14, 2026, Bitcoin (BTC) latest price is $77,824, with a gain of about 1.3% over the past 24 hours. From the hourly chart, the price has been oscillating within the range of $77,400 to $78,370. Recently, the price rebounded from around $76,700 to the $77,800 level, indicating some buy support at lower prices. However, trading volume shows a gradual shrinking trend. The latest hour’s trading value is approximately $24.62 million, down clearly from $56 million in the previous few hours, suggesting that market participation has decreased and that the bulls have not yet formed a strong breakout.
II. In-Depth Interpretation of Technical Indicators
In terms of moving averages, the 7-hour moving average is at $77,846, the 25-hour moving average at $77,423, and the 99-hour moving average at $77,301. Price is trading above the 25-hour and 99-hour moving averages, but it is relatively close to the 7-hour moving average, so the short-term direction is not entirely clear. For the Bollinger Bands, the upper band is $78,244, the middle band is $77,488, and the lower band is $76,733. The current price is between the middle and upper bands, which is neutral to slightly bullish, though overhead pressure near the upper band remains noticeable.
For the MACD indicator, the DIF line is 181.65, the DEA line is 153.25, and the histogram value is 28.40. The histogram has been narrowing for several consecutive hours, falling from 92.37 to 28.40, indicating that bullish momentum is gradually weakening. If the histogram continues to shrink and even forms a dead cross later, the risk of a short-term pullback will increase.
For the RSI indicator, the 6-period RSI is 54.84, the 12-period RSI is 57.24, and the 24-period RSI is 55.46. All three are in the neutral range of 50 to 60, meaning the market is neither overbought nor oversold. This suggests the market is in a phase of directional selection. For the KDJ indicator, K is 49.82, D is 62.50, and J is 24.49. With J at a relatively low level, if the K line moves upward and crosses above the D line, it could form a golden-cross buy signal.
Worth noting is that the combined technical signal system shows that among the current 15 factors, 8 are bearish and 7 are bullish. Bearish share is 53.33%, bullish share is 46.67%. The overall indicator provides a bearish signal, with a historical win rate of 72.73%. This implies that in the short term the technical picture is slightly tilted toward a pullback, but the disagreement between bulls and bears is not large—overall the market is in a stalemate.
III. Market Sentiment and Macro Outlook
In the macro environment, the probability of the Fed raising rates by 25 basis points on September 17 is as high as 87%. This would be the first rate hike since July 2023, exerting a clear drag on risk assets. Last week, Bitcoin spot ETF net outflows totaled $463 million, ending the prior streak of net inflows for three consecutive weeks, indicating that institutional demand has weakened in the near term.
However, there are also positive factors. On September 15, the U.S. Senate will hold a procedural vote on the CLARITY Act. This bill is one of the most important crypto market-structure legislative efforts in recent years. If passed, it would provide legal certainty for institutional capital to enter the crypto market. Bernstein, an analysis firm, warned that the market has not yet priced in the likelihood of the bill’s passage sufficiently. If it is unexpectedly passed, BTC could surge toward the $100,000 level.
In addition, institutional buying is still ongoing. Recently, an institution bought 469 BTC at an average price of $77,954, for a total value of about $36.6 million, suggesting that even at current levels there is still large capital willing to step in. CryptoQuant noted that BTC needs to break above $81,700 to confirm the start of a new bull cycle. The current price is still about 5% below that threshold.
IV. Overall Assessment
In the short term, Bitcoin is maintaining a narrow trading range between $77,000 and $78,000. The technical outlook is slightly bearish, though the disagreement is not significant, while the macro picture is caught in a dual battle between pressure from rate hikes and supportive policy developments. If the CLARITY Act advances smoothly, it could become a catalyst for an upside breakout; if the bill is stalled or fails alongside the rate-hike implementation, the probability of a short-term pullback toward the $76,000 area would increase. Investors should closely monitor the Senate vote on Tuesday and the Fed rate decision on Wednesday, prepare for both scenarios, and manage position sizing and risk.
V. Watchlist: Popular Tokens
1. QKC (QuarkChain): Current price $0.003162, 24-hour gain 28.02%, trading volume $2.11 million, daily high $0.003588, daily low $0.002360.
2. T (Threshold): Current price $0.00520, 24-hour gain 18.18%, trading volume $7.43 million, daily high $0.00610, daily low $0.00431.
3. FIL (Filecoin): Current price $0.9891, 24-hour gain 18.16%, trading volume $63.48 million, daily high $1.0370, daily low $0.8340.
#BitcoinHoldsAbove$77000 #BitcoinCrosses$78000 #AvalancheIntegratesIntoUAEPassDigitalVault
Log in to explore more content
Join global crypto users on Binance Square
⚡️ Get latest and useful information about crypto.
💬 Trusted by the world’s largest crypto exchange.
👍 Discover real insights from verified creators.
Email / Phone number
Trending Topics
1
#BitcoinReboundsTo$79K
1,173 views
44 Discussing
2
#FedHikeOddsRiseTo89%
48,717 views
844 Discussing
3
#RLUSDSupplyHitsRecord$2.442B
2,173 views
45 Discussing
4
#AvalancheIntegratesIntoUAEPassDigitalVault
54,091 views
881 Discussing
5
#UKSeeksViewsOnTokenizingGold
40,845 views
654 Discussing
6
#AnthropicCEOCallsForAISlowdown
213,191 views
3,169 Discussing
7
#RevolutDataLeakReportedlyPostedAttackersThreatenDailyReleases
3,996 views
81 Discussing
8
#BrazilCentralBankRaisesVASPCapitalRequirements
34,830 views
756 Discussing
9
#BitcoinThirdSingleBlockReorgInFourWeeks
84,154 views
1,566 Discussing
10
#EthereumFallsBelow$2500
6,730 views
93 Discussing