

#51
51
3,562 views
45 Discussing
Hot
Latest

·
--
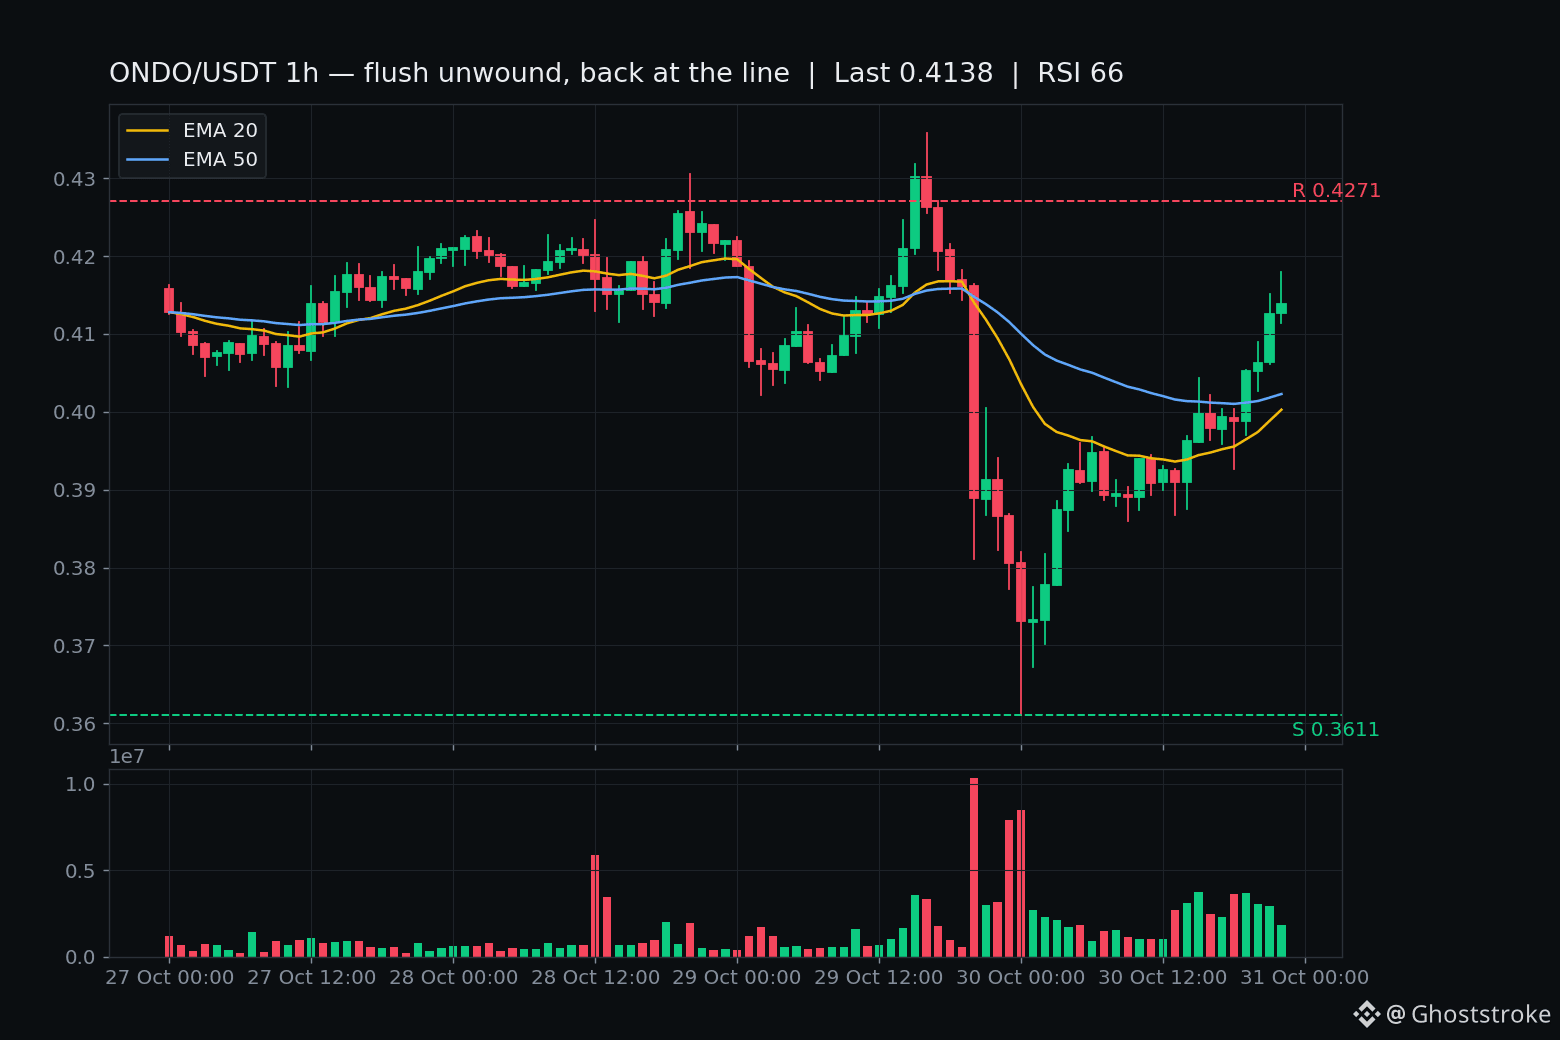
$ONDO just went from $0.3611 to $0.4180 in 19 hours. The flush I covered yesterday is unwinding.
Tape since post 348: the flush bar took out the $0.3811 line on closed candles — 23:00 UTC printed $0.3806, 00:00 UTC tagged $0.3611 on $3.14M, the day's heaviest hourly bar. New 48h low confirmed, never posted. Then the grind: $0.378–$0.395 on quiet bars through the morning. The recovery started at 13:00 UTC and didn't stop — eight hours of green, each on $1M+, heavier than the pre-flush chop: $0.3910 → $0.4126 → $0.4138. Now the forming hour is printing $0.4170, above the $0.4162 pre-flush line for the first time.
That's the named reclaim trigger from yesterday's post. But discipline: the 22:00 close was $0.4138, still under the line. The 00:00 UTC close (05:30 IST) is the decider — a closed hour above $0.4162 with volume = flush officially failed; a close back under = the reclaim is still contested.
Not an Ondo headline story — no fresh timed catalyst tonight. Context only: two days ago Ondo joined DTCC's tokenization-service rollout (Yahoo Finance + TradingView carried it) — the RWA bellwether got flushed on Intel macro anyway, same excuse as everything else this week. Macro gave the excuse; the weak tape did the work.
Honest side: rank #51, $1.84B — large-cap wash, not a dying coin. RSI recovered from 30 to 66, back above EMA20/EMA50. But 4.87B of 10B circulating — the unlock overhang hasn't gone anywhere.
Levels: $0.4180 the 24h high — a close above opens $0.4271. $0.4162 the line — the 00:00 UTC close decides. $0.4005 now reclaimed — a close back below means the recovery is losing steam. $0.3611 the flush low — a close below that and we're back in air.
Not a call, either way.
Does the 00:00 UTC close print above $0.4162, or does the line reject it on the first test?
7
·
--
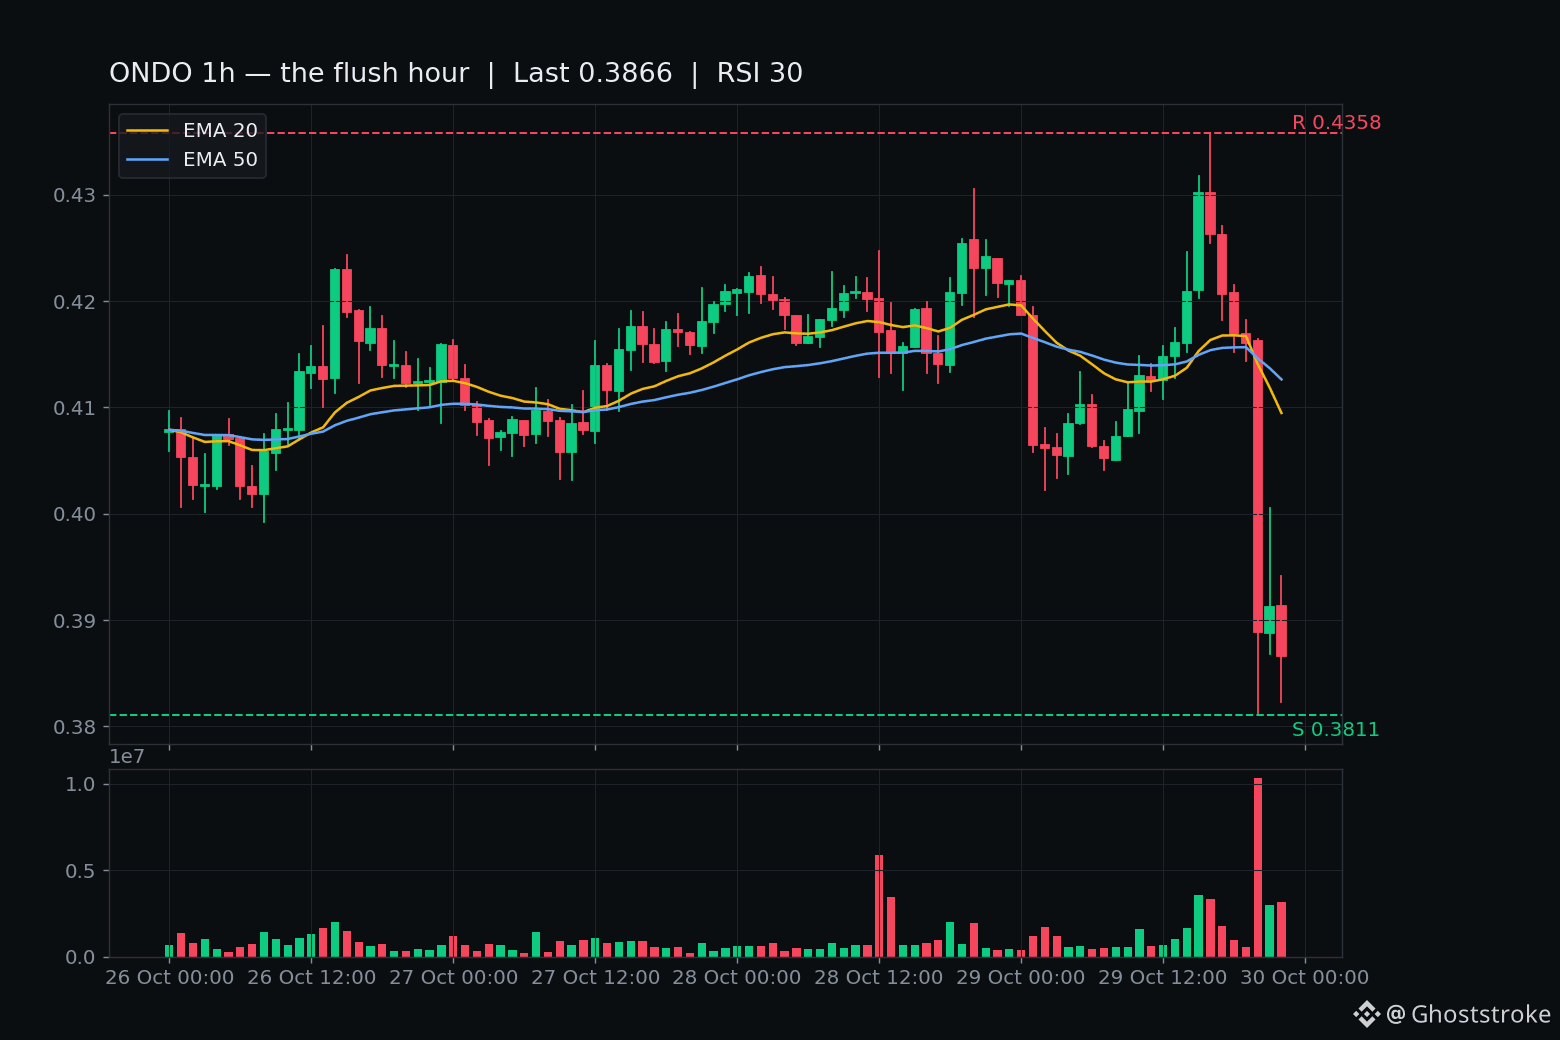
$ONDO just lost -10% in one hour. The RWA bellwether fell through thin air — there was no floor under it.
The tape: all day it chopped $0.4108–$0.4182 on quiet bars, the kind of tape that feels stable. Then 20:00 UTC — O $0.4162, L $0.3811, C $0.3889 on $4.09M. That's the day's biggest ONDO hourly bar by miles, roughly 10x normal hourly flow, and it took the price through -6.6% in sixty minutes. The 21:00 dead-cat bounced to $0.4005 and got rejected on the spot. 22:00 closed $0.3866. The forming 23:00 hour just printed $0.3773 — a fresh 24h and 48h low, live ~$0.3782, UNCLOSED (that's live tape, not a level yet).
Be straight about what this is NOT: there is no fresh Ondo headline. I checked — stale quote pages and an old BlackRock surge piece, nothing timed to the flush. The 20:00 hour is the Intel earnings flush: Q3 beat, Q4 guide killed at $15–16B vs ~$17.1B expected, BTC -2.7% on $230M of volume, the same hour that washed NEAR, ARB, WLD, ENA, AAVE, INJ and LINK tonight. ONDO fell ~3.7x harder than BTC. Macro provided the excuse — but the weak tape did the work. ONDO's prior 48h low was $0.3811, printed BY that same bar. Nothing below it on the chart. Air.
The honest side: this is a rank #51, $1.84B coin — a large-cap wash, not a dying coin. 1h RSI 30 is the oversold edge, not washed out. And the real overhang: only 4.87B of 10B ONDO circulate. Down -82% from the $2.14 ATH.
Levels I'm watching: $0.4005 (the dead-cat high — first rejection, hourly close above = flush losing steam); $0.4162 (the pre-flush chop zone — reclaim it with volume = flush failed); $0.3811 (the flush bar's low — a closed hour under it confirms the new 48h low, and under that there's no shelf in the window).
Not a call, either way. Question for the overnight tape: does $ONDO take back $0.40 with real volume before the Asia open, or does $0.3773 get a closed candle under it first?
5

·
--
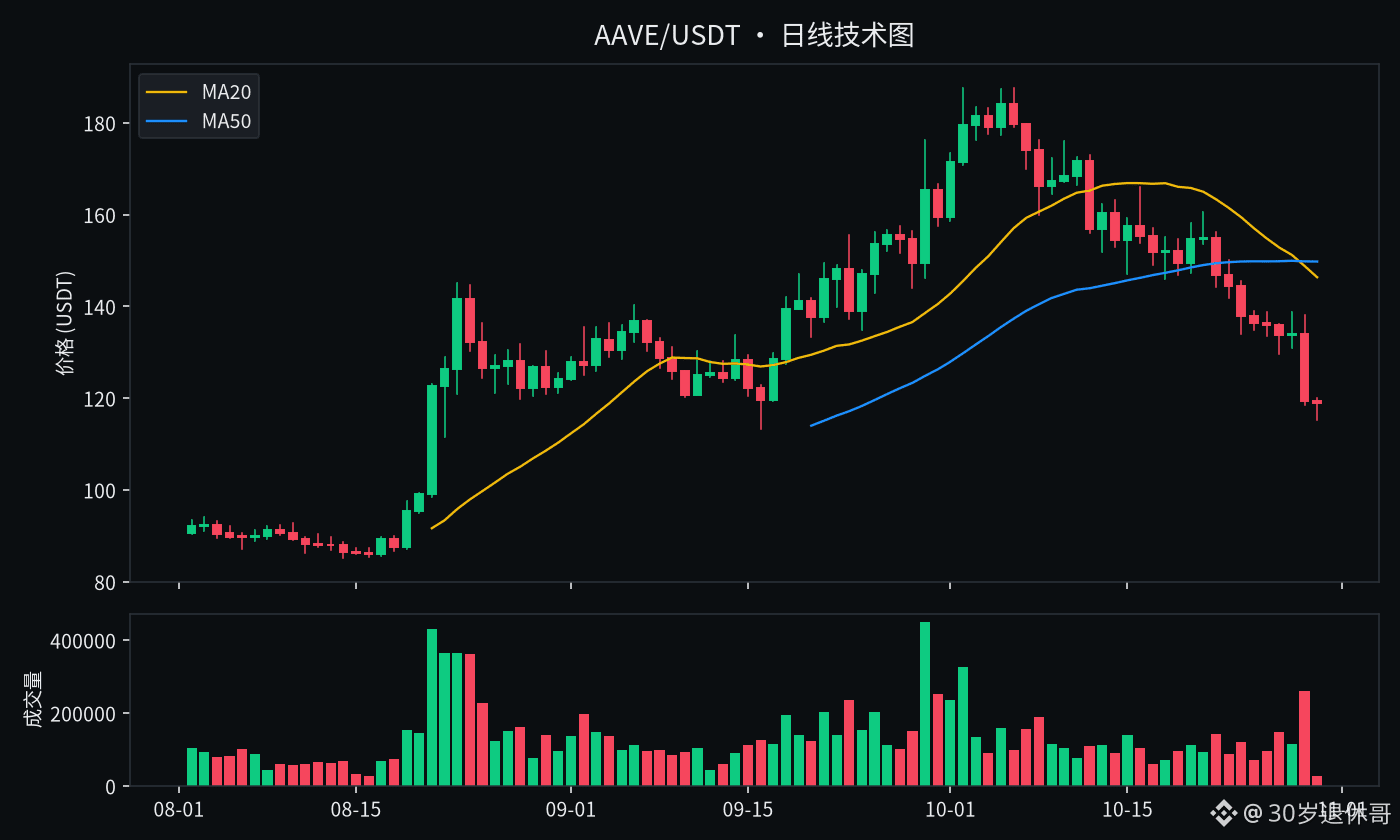
💣 Don’t get dizzy chasing the bounce: $AAVE I’m 【bearish】
【View】$AAVE (Aave) → Bearish
Ranked around #51 by market cap, currently around 118.91. MA20 ≈ 146.33 and MA50 ≈ 149.76; price is below both moving averages, and each bounce looks more like an opportunity for trapped holders to exit. When the trend is bearish, “buying the dip” can easily turn into “catching a falling knife.” Key levels: resistance ≈ 173.03, support ≈ 115.23. I’ll reconsider if price can reclaim 134.64 decisively—in that case, I’ll admit I’m wrong and turn neutral. Volume has risen to 2.4 times the 20-day average; the market is making its position clear.
📌 Reference levels (daily ATR ≈ 9.26)
Direction: Short
Entry: 118.91–123.54
TP1: 107.80 TP2: 94.38 TP3: 80.96
SL: 134.64
Keep an eye on whether a bounce to 173.03 gets rejected, and whether 115.23 holds.
Are you still holding $AAVE ? Can you hold on, or are you ready to admit you’re wrong? Let’s discuss in the comments.
⚠️ Disclaimer: This is only my personal opinion, not investment advice. Please be aware of the risks.
$BTC $ETH $AAVE #看空 #WriteToEarn
161

Article
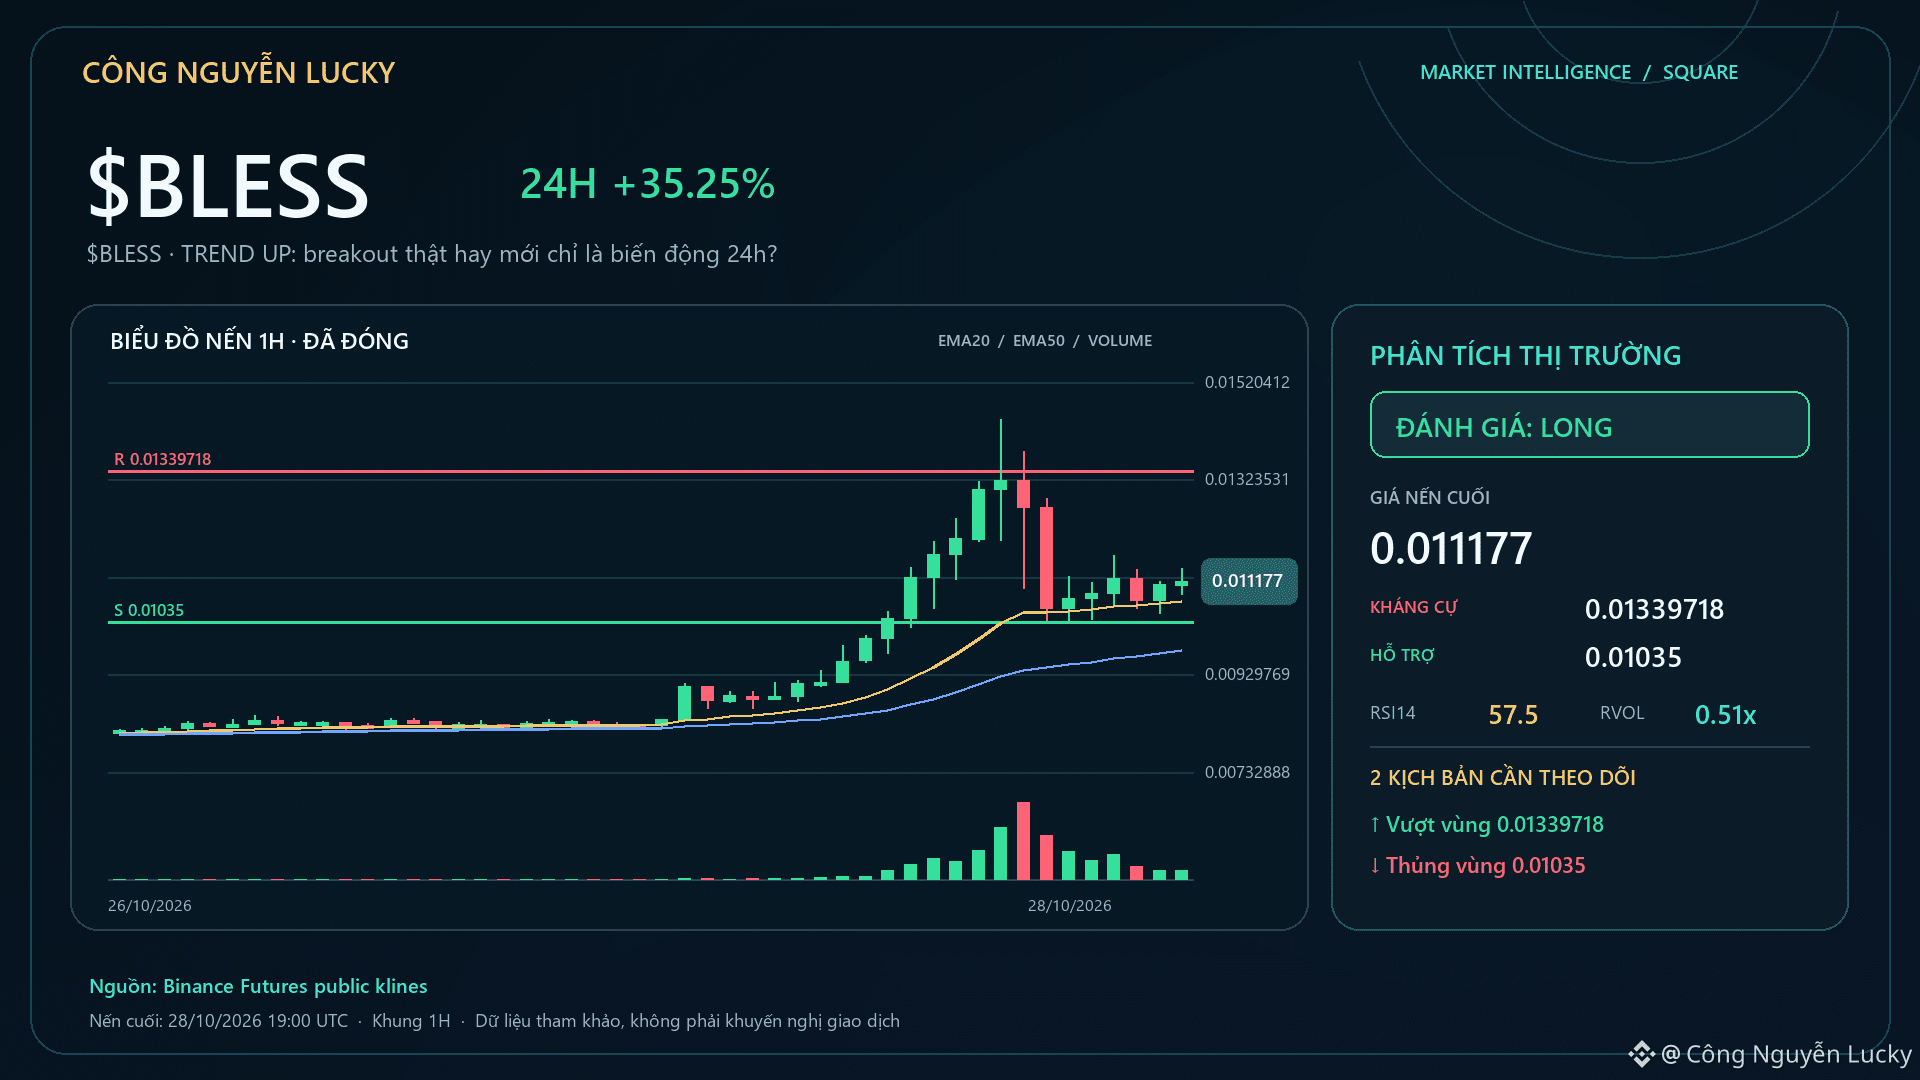
$BLESS · TREND UP: A real breakout or just 24-hour volatility?🔥 $BLESS Up +33.49% — but the percentage gain alone isn’t enough to call this a good setup. Snapshot: 0.011064 · 24h +33.49% · volume ~207.9M USDT · 2,825,794 trades. 🟢 Bullish/continuation case: A break above 0.014442 on expanding volume would make the continuation scenario more credible.
🔴 Bearish/cooling case: Failing to hold the highs and falling back below the midpoint at 0.0113595 would strengthen the cooling-off scenario. 🎯 Preferred trend: **LONG · STRONG · 87/100**.
$BLESS · TREND UP: A real breakout or just 24-hour volatility?
🔥 $BLESS Up +33.49% — but the percentage gain alone isn’t enough to call this a good setup. Snapshot: 0.011064 · 24h +33.49% · volume ~207.9M USDT · 2,825,794 trades. 🟢 Bullish/continuation case: A break above 0.014442 on expanding volume would make the continuation scenario more credible.
🔴 Bearish/cooling case: Failing to hold the highs and falling back below the midpoint at 0.0113595 would strengthen the cooling-off scenario. 🎯 Preferred trend: **LONG · STRONG · 87/100**.
🔴 Bearish/cooling case: Failing to hold the highs and falling back below the midpoint at 0.0113595 would strengthen the cooling-off scenario. 🎯 Preferred trend: **LONG · STRONG · 87/100**.
314

·
--
Verified
Two are clawing back losses; one is losing volume | 4h Top 3 Gainers
1️⃣ $DASH|DASH/USDT|Price: $51.78|24h trading volume: 7.27 million U
Project: Dash is a payment-focused public blockchain forked from Bitcoin in 2014. It features near-instant transactions and optional private transfers, and runs on a two-tier network of miners and masternodes.
Latest update: Private transfers on the Evolution mainnet are live. Cross-chain swaps on DashPay are set to launch in June, and Dash Platform v5.0 is in development for October.
Total supply: 12.88 million|Market cap: 667 million U|Market cap rank: #92
Change: 4h 【+4.44%】|24h −3.22%|7d +5.31%
Momentum: Volume in the latest hourly candle was 1.06× the 24h average. The close was at the 98% mark of that 4h range, 4.78% below the 24h high. The previous 4h candle was −2.06%.
Takeaway: The close landed almost right at this 4h candle’s high, with buyers pushing prices up through the end of the session. Most of the previous night’s losses have been recovered.
2️⃣ $PEPE|PEPE/USDT|Price: $0.00000451|24h trading volume: 56.92 million U
Project: PEPE is a frog-themed meme coin on Ethereum, launched in April 2023. It has no utility or roadmap and relies on community-driven awareness.
Latest update: No major recent developments. Within the past week, it once gained 14% in a single day, leading the CoinDesk 100 Index, with no clear catalyst at the time.
Total supply: 420.69 trillion|Market cap: 1.893 billion U|Market cap rank: #51
Change: 4h 【+4.20%】|24h −3.43%|7d +14.76%
Momentum: Volume in the latest hourly candle was 1.08× the 24h average. The close was at the 89% mark of that 4h range, 3.63% below the 24h high. The previous 4h candle was −2.28%.
Takeaway: Volume was only slightly above average, yet the price closed in the upper part of the range. This rebound took relatively little buying pressure, and sellers at lower levels have not applied sustained pressure.
3️⃣ $BMT|BMT/USDT|Price: $0.0385|24h trading volume: 58.38 million U
Project: Bubblemaps is an on-chain holdings visualization tool that displays token-holding addresses as bubbles. Larger bubbles represent larger holdings, and connecting lines indicate that addresses have transferred tokens between each other.
Latest update: Upbit opened BMT/KRW trading on October 24 at 11:00 Beijing time. Deposits and withdrawals are supported only on the Solana network.
Total supply: 1 billion|Market cap: 29.05 million U|Market cap rank: #664
Change: 4h 【+4.05%】|24h +75.08%|7d +128.22%
Momentum: Volume in the latest hourly candle was just 0.46× the 24h average. The close was at the 62% mark of that 4h range, 25.16% below the 24h high. The previous 4h candle was +6.12%.
Takeaway: The high reached on listing day has yet to be recovered, and end-of-session volume fell to less than half the average, indicating participation was clearly below the daily average.
Summary: BMT is pulling back from its post-listing highs, while DASH and PEPE have just turned positive after falling. Over the 7-day period, BMT remains the strongest, up +128%.
When you look at the gainers’ board, do you usually check the 4h or 24h performance?
This is not investment advice. DYOR.
Two are clawing back losses; one is losing volume | 4h Top 3 Gainers
1️⃣ $DASH |DASH/USDT|Price: $51.78|24h trading volume: 7.27 million U
Project: Dash is a payment-focused public blockchain forked from Bitcoin in 2014. It features near-instant transactions and optional private transfers, and runs on a two-tier network of miners and masternodes.
Latest update: Private transfers on the Evolution mainnet are live. Cross-chain swaps on DashPay are set to launch in June, and Dash Platform v5.0 is in development for October.
Total supply: 12.88 million|Market cap: 667 million U|Market cap rank: #92
Change: 4h 【+4.44%】|24h −3.22%|7d +5.31%
Momentum: Volume in the latest hourly candle was 1.06× the 24h average. The close was at the 98% mark of that 4h range, 4.78% below the 24h high. The previous 4h candle was −2.06%.
Takeaway: The close landed almost right at this 4h candle’s high, with buyers pushing prices up through the end of the session. Most of the previous night’s losses have been recovered.
2️⃣ $PEPE |PEPE/USDT|Price: $0.00000451|24h trading volume: 56.92 million U
Project: PEPE is a frog-themed meme coin on Ethereum, launched in April 2023. It has no utility or roadmap and relies on community-driven awareness.
Latest update: No major recent developments. Within the past week, it once gained 14% in a single day, leading the CoinDesk 100 Index, with no clear catalyst at the time.
Total supply: 420.69 trillion|Market cap: 1.893 billion U|Market cap rank: #51
Change: 4h 【+4.20%】|24h −3.43%|7d +14.76%
Momentum: Volume in the latest hourly candle was 1.08× the 24h average. The close was at the 89% mark of that 4h range, 3.63% below the 24h high. The previous 4h candle was −2.28%.
Takeaway: Volume was only slightly above average, yet the price closed in the upper part of the range. This rebound took relatively little buying pressure, and sellers at lower levels have not applied sustained pressure.
3️⃣ $BMT |BMT/USDT|Price: $0.0385|24h trading volume: 58.38 million U
Project: Bubblemaps is an on-chain holdings visualization tool that displays token-holding addresses as bubbles. Larger bubbles represent larger holdings, and connecting lines indicate that addresses have transferred tokens between each other.
Latest update: Upbit opened BMT/KRW trading on October 24 at 11:00 Beijing time. Deposits and withdrawals are supported only on the Solana network.
Total supply: 1 billion|Market cap: 29.05 million U|Market cap rank: #664
Change: 4h 【+4.05%】|24h +75.08%|7d +128.22%
Momentum: Volume in the latest hourly candle was just 0.46× the 24h average. The close was at the 62% mark of that 4h range, 25.16% below the 24h high. The previous 4h candle was +6.12%.
Takeaway: The high reached on listing day has yet to be recovered, and end-of-session volume fell to less than half the average, indicating participation was clearly below the daily average.
Summary: BMT is pulling back from its post-listing highs, while DASH and PEPE have just turned positive after falling. Over the 7-day period, BMT remains the strongest, up +128%.
When you look at the gainers’ board, do you usually check the 4h or 24h performance?
This is not investment advice. DYOR.
1
1
642

·
--
$4 is finally showing some movement.
It’s up a little over 1% on the 15m chart, and the price has just broken through the upper end of the last 20 or so 5m candles. The aggressive buy/sell imbalance is 26.4%, with a ratio of 1.72—clearly leaning bullish. OI is up 0.31% over 15m and 0.82% over 1h, suggesting new leveraged longs are coming in; this isn’t purely a spot-driven move.
However, 24h trading volume is only $15M, so liquidity is still on the thin side. Whether the breakout holds depends on whether volume picks up from here. Its anomaly percentile is 86.7%, ranking #14 across the entire pool, so it’s definitely showing up on the radar—but its notional change ranks only #51. There are new entrants, but the size is still modest.
First, watch whether the price can hold this range’s upper boundary on a retest. Talk about continuation only if it holds.

·
--
PEPE news today - October 18 🐸👀
✅ Current price now: ❤️
✅ $0.00000383 - down 79.1% today 💚
✅ Volume: $133.92M in 24 hours
✅ Market cap: $1.65B - rank #51 M USDT ✅ Volume: Binance PEPE/USDT 12.2
over the last 24 hours
Important levels:
Today's support: $0.0000039 - staying above it would be good
Resistance: $0.0000042 (the price on October 14)
October targets: $0.00000499, then $0.00000595
If volume rises by +53% from now
#PEPE #MemeCoin

5
625

·
--
$BAT This drop is pretty interesting.
It fell 2.34% in just 15m, with volume surging to 5.88x. The price closed below the lows of nearly 20 5m candles, and the aggressive trade imbalance was -12.4%—clear selling pressure.
But the key isn't price; it's OI. 15m futures OI was down 0.19%, 1h OI down 0.01%, with notional value continuing to make new lows. This is a classic deleveraging drop—not shorts pushing the price down, but longs capitulating and exiting. Stop-losses and passive position reductions are mixed together. In theory, this isn't the worst structure: clearing out the excess can make room for a bigger move.
However, the OI anomaly percentile is still at 85.3%, with an all-pool anomaly rank of #51 and a notional change rank of #32. The elevated readings suggest positions are still fairly crowded, so this wick might not be the last one.
Be cautious about chasing shorts, and don't rush to catch the falling knife. 24h trading volume is only 65M, so liquidity is mediocre; moves at the extremes are often fakeouts. I'll see whether OI keeps falling in the next period.
4

·
--
𝗦𝗼𝗺𝗲𝘁𝗵𝗶𝗻𝗴 𝗯𝗶𝗴 𝗶𝘀 𝗯𝗿𝗲𝘄𝗶𝗻𝗴 𝗼𝗻 @𝘆𝗶𝗲𝗹𝗱𝗯𝗮𝘀𝗶𝘀?
While everyone watches noise, the real story is scaling: proposal #51 adds a strategic reserve for crvUSD stability, and that unlocks higher TVL, deeper BTC/ETH liquidity, and more fees for LPs + veYB
Asymmetric setup for the next 10x, maybe 100x potential if the flywheel kicks in
Alpha: scaling is coming 🚀
36
·
--
$LDO This dip isn’t too violent, but the structure looks pretty ugly.
The price broke below the lower bound; the active trade volume is down by -55.4%, the buy-sell ratio is 0.29, and sell pressure is pounding as buyers chase. The key point is that the OI has been contracting for several consecutive periods: 1h -0.80%, with nominal value down around $350k. And the funding rate is still sitting in a high percentile recently—this doesn’t look like brand-new shorts entering; it looks more like longs are pulling their ladder back themselves: deleveraging, stop-losses, and position reduction all in one go.
Trading volume is 2.2x, with an 88.9% percentile anomaly across the whole pool, but nominal change only ranks #51. What does that mean? The abnormality is real, but the size isn’t that big—this is the kind of drop where “depth has been confirmed, but it hasn’t reached panic.”
With this kind of structure, I usually don’t rush to catch it. High funding rate + falling OI + aggressive selling stacked together—short-term rebounds are likely to get knocked back. Wait until OI stops falling, funding eases a bit, and then see if there’s an opportunity.
3
·
--
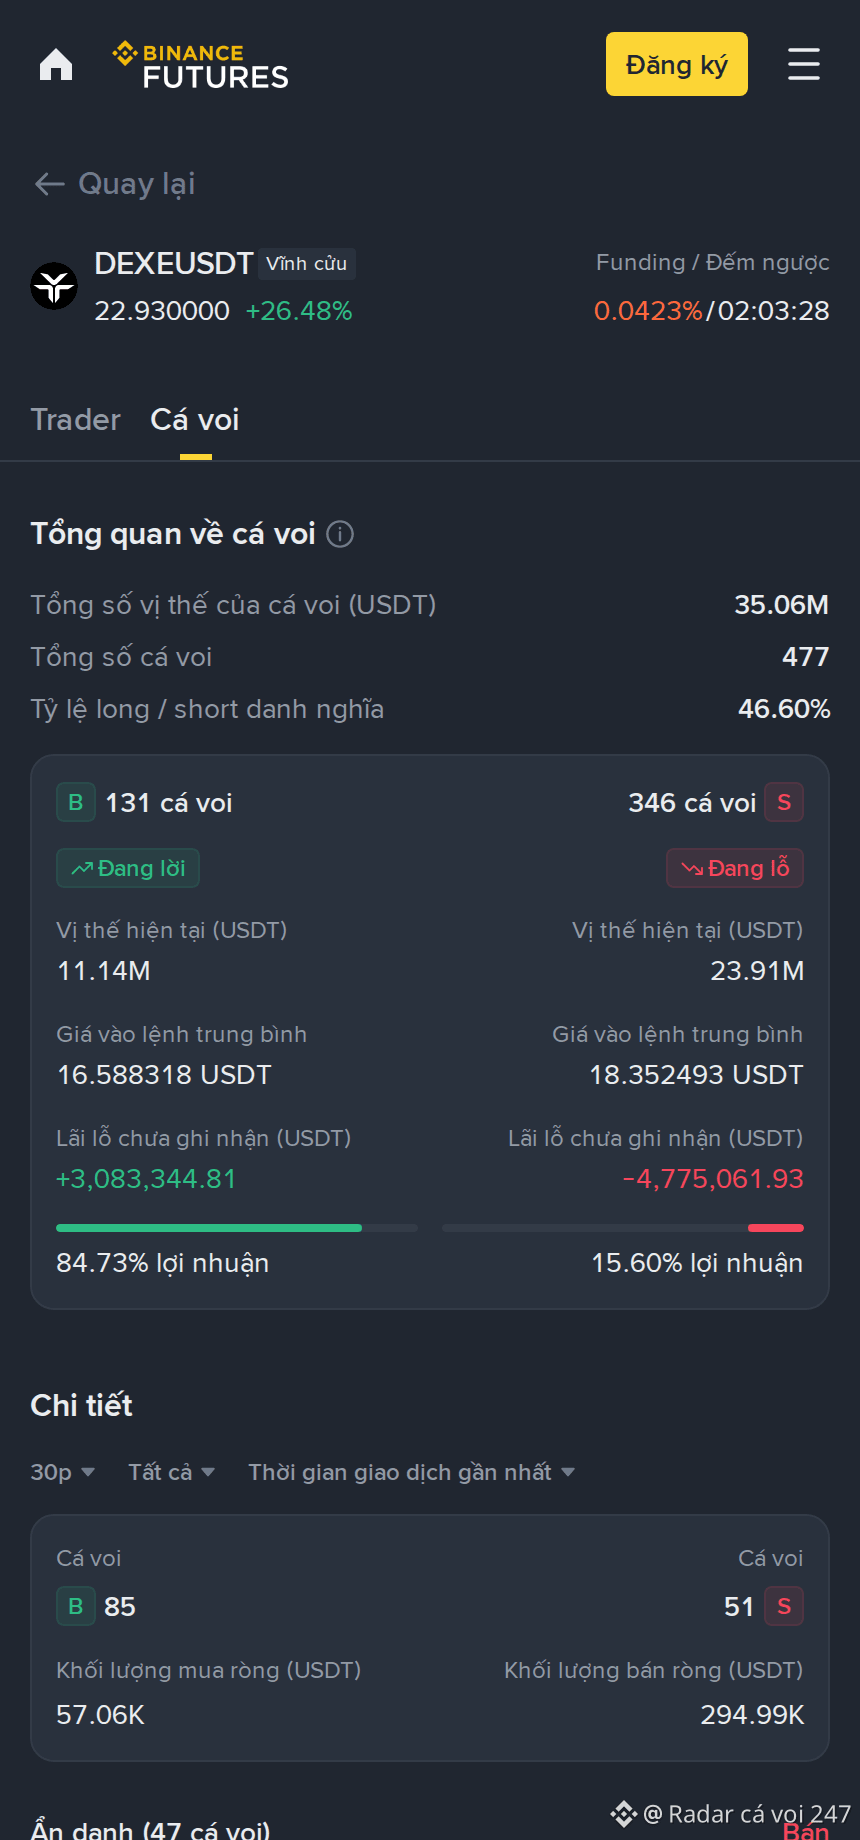
The market's acting a bit weird:
$DEXE $SYN
Whale Radar #51
$DEXE just entered the watch zone.
A rise of +25.82% isn't too loud, but enough to catch some eyes.
Whales aren’t loud, but this phase is definitely not boring.
Whales aren’t talking, but the chart’s got the mic on.
Vote quickly:
A. Whales win
B. Retail wins
C. Wallets need a break
Follow to see which coin keeps wallets up at night.
Sometimes the market doesn’t need to shout, just needs to blink at the right moment.
Watching from the sidelines is also a skill.
189

·
--
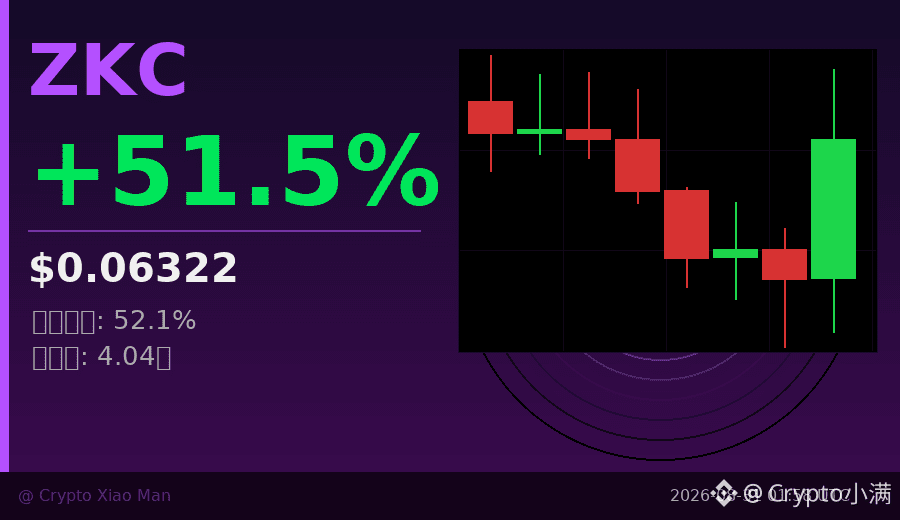
It went up 51%, but the people going long are fewer than the people shorting—
Today, ZKC’s intraday high touched 0.0708. It rallied from a low of 0.0415, gaining more than 70%, and has since pulled back to around 0.063.
The strange part is on the contracts side: the funding rate is negative (-0.109%), which means the shorts are paying the longs. But the long/short ratio data shows that shorts (52.1%) are still more than longs (47.9%).
In plain language, what it means is: the spot price got pushed up strongly, but the contract market participants aren’t buying it—shorts are still in the majority, and they’re continuously paying costs to keep their short positions.
This kind of divergence usually has two possible outcomes:
One is that the shorts can’t hold on and are forced to close, which then pushes another wave of upward movement;
Two is that the buying strength on the spot market weakens, the price falls back, and the shorts actually end up profiting.
From the candlestick chart, the recent eight candles have been in a choppy, ranging consolidation pattern. The biggest-volume candle was the one during the rebound—volume picked up, but the following candles’ volume has been shrinking, and the momentum hasn’t confirmed a continued move.
High turnover, large price swings, and a split in sentiment—this situation usually means it’s not time for the dust to settle yet.
$ZKC #资金费率背离 #51%暴涨
Click the small card below to quickly check the行情👇
55
Article
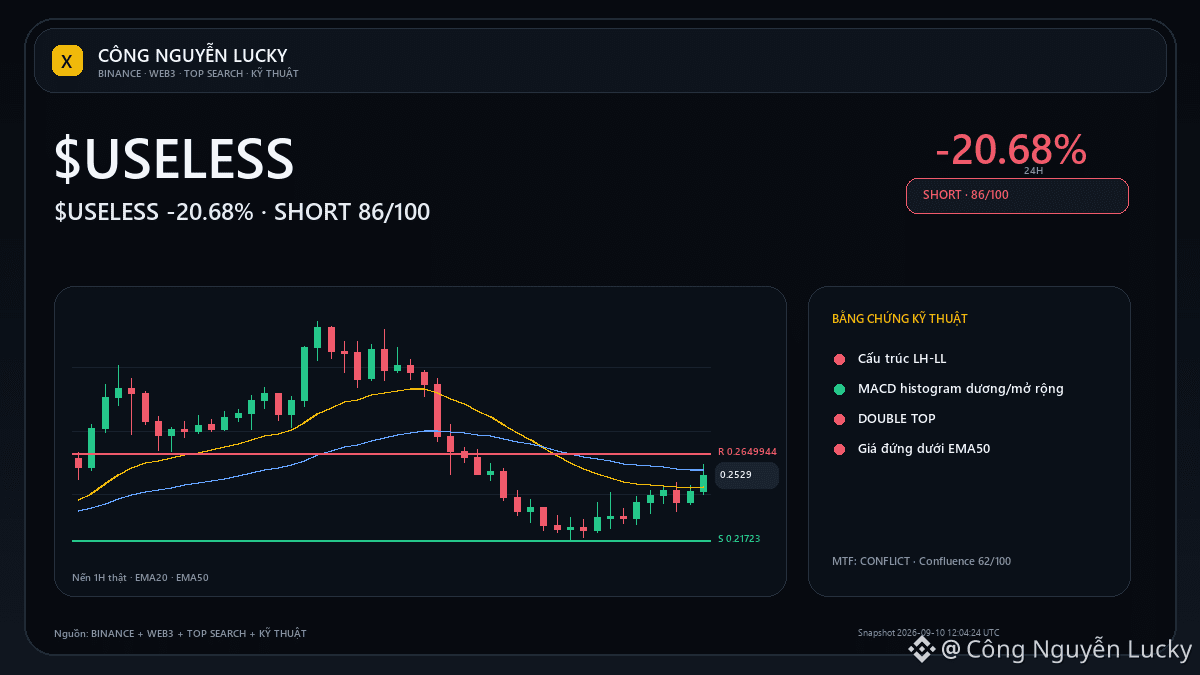
$USELESS: Fib 0.618 is the trend-testing zone📐 $USELESS: instead of chasing the price, I’m looking at the Fibonacci 0.618 zone around 0.24627332 of the most recent swing.
Market: 0.25137 · 24h -20.68% · volume ~277.2M USDT · 5,150,781 trades.
Technical context: MIXED · SHORT bias 62/100.
Golden zone 0.50–0.618: 0.24627332–0.26365.
Confirmation point: price reacts correctly in the Fib zone and maintains the dominant structure/EMA.
Invalidation point: breaks 0.2649944 with momentum against the bias.
$USELESS: Fib 0.618 is the trend-testing zone
📐 $USELESS : instead of chasing the price, I’m looking at the Fibonacci 0.618 zone around 0.24627332 of the most recent swing.
Market: 0.25137 · 24h -20.68% · volume ~277.2M USDT · 5,150,781 trades.
Technical context: MIXED · SHORT bias 62/100.
Golden zone 0.50–0.618: 0.24627332–0.26365.
Confirmation point: price reacts correctly in the Fib zone and maintains the dominant structure/EMA.
Invalidation point: breaks 0.2649944 with momentum against the bias.
10

·
--
Pump.fun ($PUMP) Surges 10.13%: What’s Driving the Rally?
Pump.fun ($PUMP) is surging, up 10.13% in the past 24 hours. The token's massive $409.56M trading volume is fueling the momentum. Community engagement and recent updates are keeping the hype alive. Traders are watching closely as $PUMP climbs the ranks, now at #51 by market cap. If the trend continues, $PUMP could see more significant gains. ⚡🔥
Follow for more crypto setups.
#HahaProfit #PumpFun
Pump.fun ($PUMP ) Surges 10.13%: What’s Driving the Rally?
Pump.fun ($PUMP ) is surging, up 10.13% in the past 24 hours. The token's massive $409.56M trading volume is fueling the momentum. Community engagement and recent updates are keeping the hype alive. Traders are watching closely as $PUMP climbs the ranks, now at #51 by market cap. If the trend continues, $PUMP could see more significant gains. ⚡🔥
Follow for more crypto setups.
#HahaProfit #PumpFun

·
--
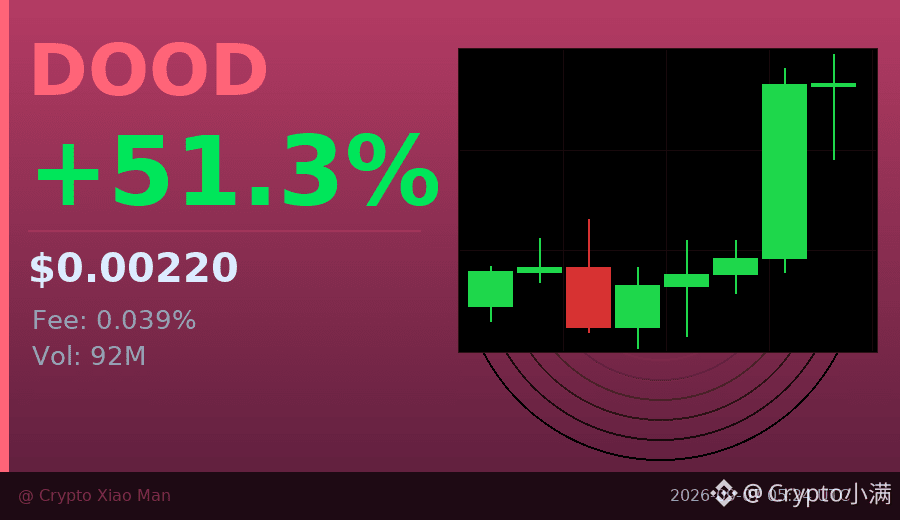
51% single-day gain, but the funding rate soared to 0.039%—what does that mean?
DOOD jumped straight from 0.0014 to 0.0022 today, with trading volume surging to 92 million USDT. The hourly candles have been closing green in a row, which looks strong? But take a closer look: 60% of traders are long, and the funding rate is absurdly positive.
Simply put: longs are too crowded. Every 8 hours, longs have to pay 0.039% to shorts. If the price pulls back even a little, these leveraged longs will rush to close positions, which could actually accelerate the drop.
I’m not saying it must fall, but chasing higher in this kind of sentiment makes the risk-reward ratio unattractive. If you really like it, waiting for a pullback or buying in batches is more prudent.
$DOOD #资金费率预警 #51%
Click the small card below to quickly check the market 👇
43
·
--
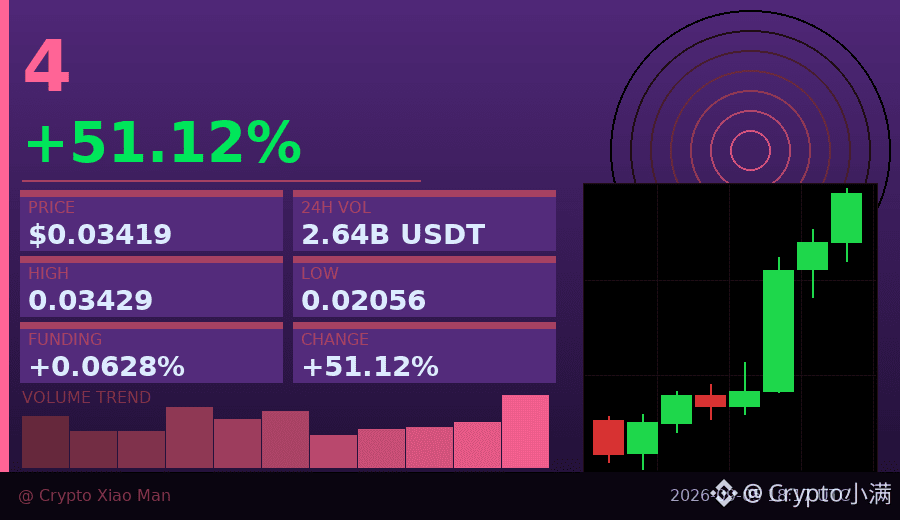
What does a funding rate of 62.75% mean?
For holding 4, longs pay shorts nearly 0.008% per hour.
This kind of extreme rate usually appears at two moments: either a pullback is about to happen, or the trend is so strong that shorts dare not turn around.
In the past 24 hours, it has risen 51%, with trading volume of 264 million U, and the hourly chart has closed green consecutively.
The long/short ratio is 53% to 47%, which is not extremely crowded, indicating there is still room.
The key is whether it can hold the 0.032 support in the next 1-2 hours.
If it holds, the funding rate will gradually return to normal; if it fails, long-side liquidation will happen quickly.
$4 #资金费率预警 #51%
Click the small card below to quickly view the market 👇
418

·
--
Bullish
60-SECOND ALPHA #51 | $IOST
$IOST is getting fresh attention after a strong move, but the more interesting part is what is happening underneath the chart. IOST 3.0 is focusing on Layer 2 scaling, RWA tokenization and PayFi infrastructure.
That makes IOST a useful reminder that an old token can still create a new narrative when its technology and positioning evolve.
The lesson: A new narrative can give an old project a second life.
{future}(IOSTUSDT)
60-SECOND ALPHA #51 | $IOST
$IOST is getting fresh attention after a strong move, but the more interesting part is what is happening underneath the chart. IOST 3.0 is focusing on Layer 2 scaling, RWA tokenization and PayFi infrastructure.
That makes IOST a useful reminder that an old token can still create a new narrative when its technology and positioning evolve.
The lesson: A new narrative can give an old project a second life.

61

·
--
** Technical Analysis 101: How to Identify Support and Resistance Levels? 📊Pump.fun (PUMPUSDT) is trending right now!
Rank: #51
** Hello crypto traders! 👋 Today, we’ll learn step by step how to identify support and resistance levels—an essential concept in technical analysis. This knowledge will play a critical role in your trading decisions. 🎯 **Step 1: What are Support and Resistance? 🤔** - **Support:** When an asset’s price falls to a certain level, the level that prevents further declines and helps the price rise again is called support. 📈 - **Resistance:** When an asset’s price rises to a certain level, the level that prevents further upside and causes the price to fall again is called resistance. 📉 **Step 2: Identifying Support and Resistance Levels on the Chart 📊** Think of it like this: You bounce a ball off the ground—the ball stays down for a while, then rises again. The ground where it rests is like a support level. You toss the ball upward, and after a point, its speed slows down—this point acts like a resistance level. 🎾 **Example:** let’s take a look at the chart: - **Identifying a Support Level:** The price is currently around $79,217.97 over the last 24 hours. Let’s say over the past few days, the price fluctuated between $78,000 and $79,000. If the price drops into this range again, $78,000 can be considered a support level. 📊 - **Identifying a Resistance Level:** If over the past few days the price tested the $80,000 level but couldn’t break above it, then $80,000 can be seen as a resistance level. 🚀 **Step 3: Practical Application Suggestions 📈** 1
** Technical Analysis 101: How to Identify Support and Resistance Levels? 📊
Pump.fun (PUMPUSDT) is trending right now!
Rank: #51
** Hello crypto traders! 👋 Today, we’ll learn step by step how to identify support and resistance levels—an essential concept in technical analysis. This knowledge will play a critical role in your trading decisions. 🎯 **Step 1: What are Support and Resistance? 🤔** - **Support:** When an asset’s price falls to a certain level, the level that prevents further declines and helps the price rise again is called support. 📈 - **Resistance:** When an asset’s price rises to a certain level, the level that prevents further upside and causes the price to fall again is called resistance. 📉 **Step 2: Identifying Support and Resistance Levels on the Chart 📊** Think of it like this: You bounce a ball off the ground—the ball stays down for a while, then rises again. The ground where it rests is like a support level. You toss the ball upward, and after a point, its speed slows down—this point acts like a resistance level. 🎾 **Example:** let’s take a look at the chart: - **Identifying a Support Level:** The price is currently around $79,217.97 over the last 24 hours. Let’s say over the past few days, the price fluctuated between $78,000 and $79,000. If the price drops into this range again, $78,000 can be considered a support level. 📊 - **Identifying a Resistance Level:** If over the past few days the price tested the $80,000 level but couldn’t break above it, then $80,000 can be seen as a resistance level. 🚀 **Step 3: Practical Application Suggestions 📈** 1
28
·
--
While Falling 7K, How Did UNI Fly 11%? (Fine Details)**Pump.fun (PUMPUSDT) is trending right now!
Rank: #51
**TITLE: While Falling 7K, How Did UNI Fly 11%? (Fine Details)** Today I saw it at $77,450 and it sparked the question: “Did I miss this?” While the market was down **1.5%**, **UNI made an 11% pump**—and even from just **$5.83**. Look, you can’t just ignore this. The interesting part is that, as I noticed **its volume exceeded $675 million** during a **2% dip** too. So while the main coins were being sold off, **UNI rose 11%**. What does this indicate? Now I’ll give you the details. ### **The Pumpers: UNI, DOT, LTC Stand Out** UNI led the way yesterday with a **11.18% increase** and **$81 million in volume**. That’s **7.3% of the 24-hour trading volume**—so there’s definitely serious interest. So why? Did **Uniswap’s new updates on Layer 2s** trigger it? Or was it just a move where buyers acted early? DOT rose **3.69%** as well, drawing attention with **$6.8 million in volume**. I think interest in Polkadot’s parachains is increasing—but will this rise last? Or is it just a short-term “ape in”? LTC also separated positively, up **2.32%** with **$16 million in volume**. Did Litecoin’s approach to the halving have an impact? Or was it just a reflection of traders’ expectations for an “altcoin season”? --- ### **The Decliners: SOL, ETH, XRP** SOL was among the biggest losers with a **2.94% drop** and **$253 million in volume**. But pay attention—**it closed below $100**. Was this a resistance test, or a real s
While Falling 7K, How Did UNI Fly 11%? (Fine Details)**
Pump.fun (PUMPUSDT) is trending right now!
Rank: #51
**TITLE: While Falling 7K, How Did UNI Fly 11%? (Fine Details)** Today I saw it at $77,450 and it sparked the question: “Did I miss this?” While the market was down **1.5%**, **UNI made an 11% pump**—and even from just **$5.83**. Look, you can’t just ignore this. The interesting part is that, as I noticed **its volume exceeded $675 million** during a **2% dip** too. So while the main coins were being sold off, **UNI rose 11%**. What does this indicate? Now I’ll give you the details. ### **The Pumpers: UNI, DOT, LTC Stand Out** UNI led the way yesterday with a **11.18% increase** and **$81 million in volume**. That’s **7.3% of the 24-hour trading volume**—so there’s definitely serious interest. So why? Did **Uniswap’s new updates on Layer 2s** trigger it? Or was it just a move where buyers acted early? DOT rose **3.69%** as well, drawing attention with **$6.8 million in volume**. I think interest in Polkadot’s parachains is increasing—but will this rise last? Or is it just a short-term “ape in”? LTC also separated positively, up **2.32%** with **$16 million in volume**. Did Litecoin’s approach to the halving have an impact? Or was it just a reflection of traders’ expectations for an “altcoin season”? --- ### **The Decliners: SOL, ETH, XRP** SOL was among the biggest losers with a **2.94% drop** and **$253 million in volume**. But pay attention—**it closed below $100**. Was this a resistance test, or a real s
137
Article
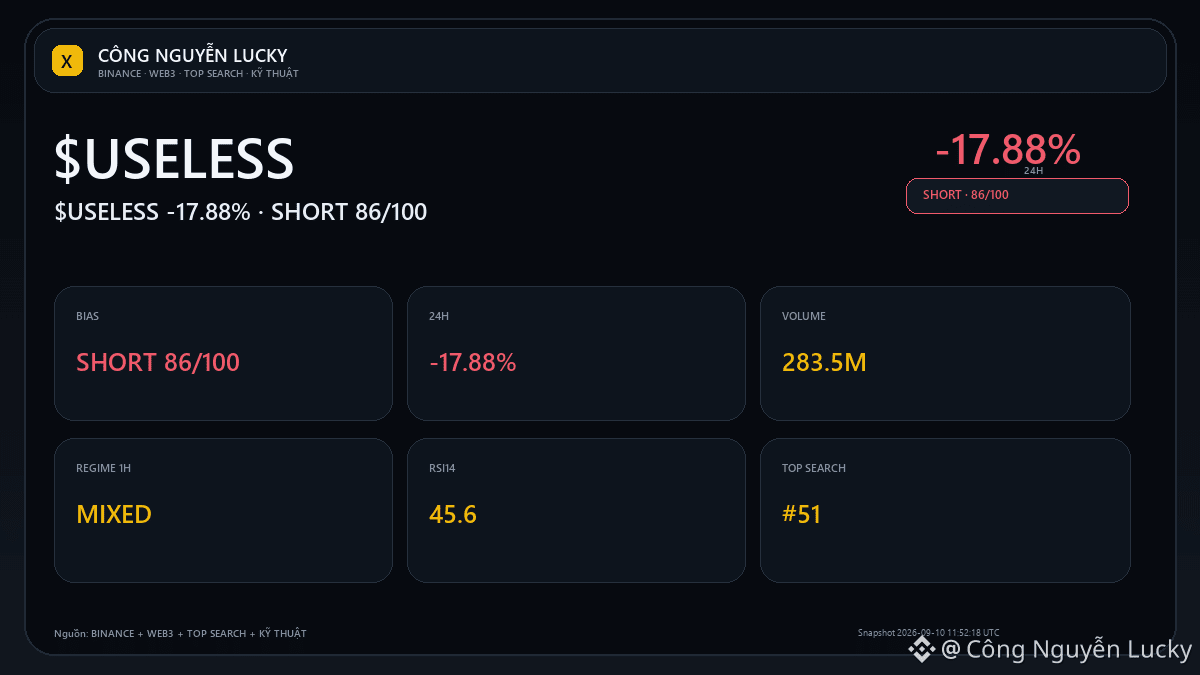
$USELESS -17.88%: what other data confirms this strong run?$USELESS is enough volatility for both bull and bear to have reasons. I split the two cases to avoid telling only one-sided stories.
Snapshot: 0.2555 · 24h -17.88% · volume ~283.5M USDT · 5,220,966 trades.
🟢 Bull/continuation case: Breaking 0.21723 with an expanding volume will make the continuation scenario more credible.
🔴 Bear/cooling case: Failing to hold the lower zone and reclaiming the midpoint at 0.270265 will weaken the selling pressure.
$USELESS -17.88%: what other data confirms this strong run?
$USELESS is enough volatility for both bull and bear to have reasons. I split the two cases to avoid telling only one-sided stories.
Snapshot: 0.2555 · 24h -17.88% · volume ~283.5M USDT · 5,220,966 trades.
🟢 Bull/continuation case: Breaking 0.21723 with an expanding volume will make the continuation scenario more credible.
🔴 Bear/cooling case: Failing to hold the lower zone and reclaiming the midpoint at 0.270265 will weaken the selling pressure.
3
Log in to explore more content
Join global crypto users on Binance Square
⚡️ Get latest and useful information about crypto.
💬 Trusted by the world’s largest crypto exchange.
👍 Discover real insights from verified creators.
Email / Phone number
Trending Topics
1
#BinanceRestoresWithdrawalsForEthereumNetwork&BNBSmartChain
257 views
24 Discussing
2
#BinanceUpdatesProofofReservesAddresses
3,234 views
157 Discussing
3
#BinanceToResumePhaseOneOfWithdrawals
19,397 views
487 Discussing
4
#BinanceHadAlreadyCovered$6BofHackLoss
2,153 views
60 Discussing
5
#FBIConfirmsNorthKoreaIsResponsibleForBinanceCryptoHack
14,434 views
68 Discussing
6
#BinanceSAFUFundTransferCompleted7499BTC
87,447 views
1,410 Discussing
7
#CZDismissesClaimsBinanceHackWasPredicted
5,307 views
156 Discussing
8
#BinanceRecovery90% of stolen assets
223,581 views
229 Discussing
9
#YiHe:ProofOfReserves:10TokensAt100%Backing
198,566 views
1,191 Discussing
10
#BackedNotBroken:RichardTengSaysUsersBearNoLoss
69,834 views
719 Discussing