
#38
38
5,972 views
68 Discussing
Hot
Latest

·
--
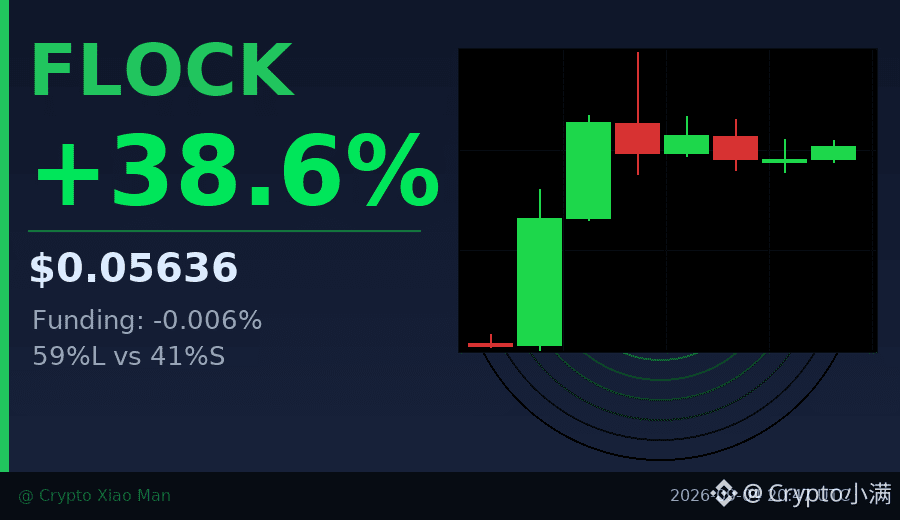
38% single-day gain, but the funding rate is negative — creating an interesting divergence in FLOCK.
The price was pulled up from 0.037 to 0.056, trading volume surged to 170 million USDT, and the hourly chart closed bullishly for several consecutive periods. A funding rate of -0.006% shows that longs are not aggressively using leverage; instead, they are following cautiously.
The long-short ratio of 59% to 41% shows longs have the upper hand, but not by an extreme margin. This combination of “price rising + funding staying calm” is often more sustainable than one-sided frenzy.
The key is whether the previous high at 0.065 can be broken; if it holds above that level, the next target is the 0.07 psychological mark.
$FLOCK #资金背离 #38%
Click the card below to quickly check the market👇
38% single-day gain, but the funding rate is negative — creating an interesting divergence in FLOCK.
The price was pulled up from 0.037 to 0.056, trading volume surged to 170 million USDT, and the hourly chart closed bullishly for several consecutive periods. A funding rate of -0.006% shows that longs are not aggressively using leverage; instead, they are following cautiously.
The long-short ratio of 59% to 41% shows longs have the upper hand, but not by an extreme margin. This combination of “price rising + funding staying calm” is often more sustainable than one-sided frenzy.
The key is whether the previous high at 0.065 can be broken; if it holds above that level, the next target is the 0.07 psychological mark.
$FLOCK #资金背离 #38%
Click the card below to quickly check the market👇
The price was pulled up from 0.037 to 0.056, trading volume surged to 170 million USDT, and the hourly chart closed bullishly for several consecutive periods. A funding rate of -0.006% shows that longs are not aggressively using leverage; instead, they are following cautiously.
The long-short ratio of 59% to 41% shows longs have the upper hand, but not by an extreme margin. This combination of “price rising + funding staying calm” is often more sustainable than one-sided frenzy.
The key is whether the previous high at 0.065 can be broken; if it holds above that level, the next target is the 0.07 psychological mark.
$FLOCK #资金背离 #38%
Click the card below to quickly check the market👇
6
·
--
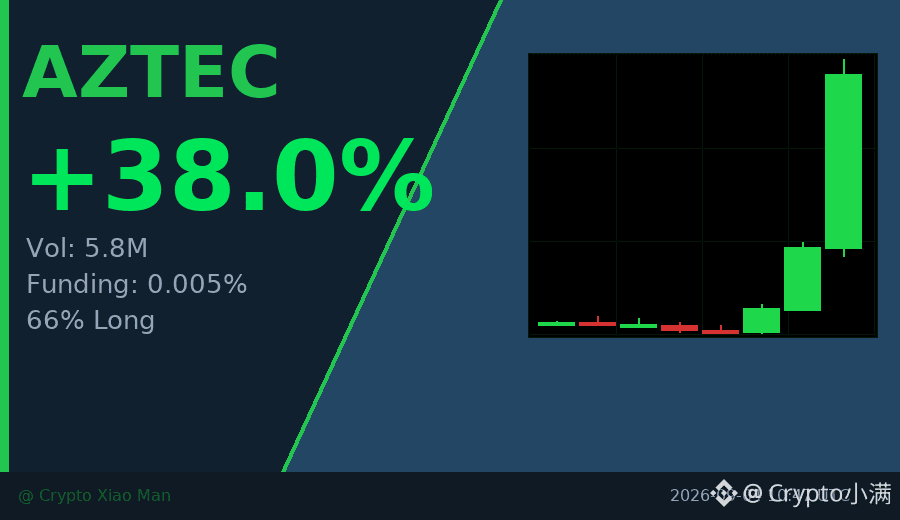
38% rise, trading volume 5.8M USDT——AZTEC This move isn’t a normal rebound.
The funding rate is only 0.005%, which means longs aren’t crowded yet; the long/short ratio is 66% vs 34%—some people are bullish, but nowhere near crazy.
The key is the K-line: three consecutive hourly candles closing bullish; the last one shows a clear volume expansion, rising from 0.0138 all the way to 0.0175—the buy orders are real.
This combination of “price surge + mild funding + increased volume” is often more worth paying attention to than a pure, sudden breakout.
Of course, for low market-cap tokens the volatility is higher—don’t chase the price; wait for a pullback and look for support.
$AZTEC #低市值爆发 #38% rise
Click the small card below to quickly check the行情 👇
38% rise, trading volume 5.8M USDT——AZTEC This move isn’t a normal rebound.
The funding rate is only 0.005%, which means longs aren’t crowded yet; the long/short ratio is 66% vs 34%—some people are bullish, but nowhere near crazy.
The key is the K-line: three consecutive hourly candles closing bullish; the last one shows a clear volume expansion, rising from 0.0138 all the way to 0.0175—the buy orders are real.
This combination of “price surge + mild funding + increased volume” is often more worth paying attention to than a pure, sudden breakout.
Of course, for low market-cap tokens the volatility is higher—don’t chase the price; wait for a pullback and look for support.
$AZTEC #低市值爆发 #38% rise
Click the small card below to quickly check the行情 👇
The funding rate is only 0.005%, which means longs aren’t crowded yet; the long/short ratio is 66% vs 34%—some people are bullish, but nowhere near crazy.
The key is the K-line: three consecutive hourly candles closing bullish; the last one shows a clear volume expansion, rising from 0.0138 all the way to 0.0175—the buy orders are real.
This combination of “price surge + mild funding + increased volume” is often more worth paying attention to than a pure, sudden breakout.
Of course, for low market-cap tokens the volatility is higher—don’t chase the price; wait for a pullback and look for support.
$AZTEC #低市值爆发 #38% rise
Click the small card below to quickly check the行情 👇
14
·
--
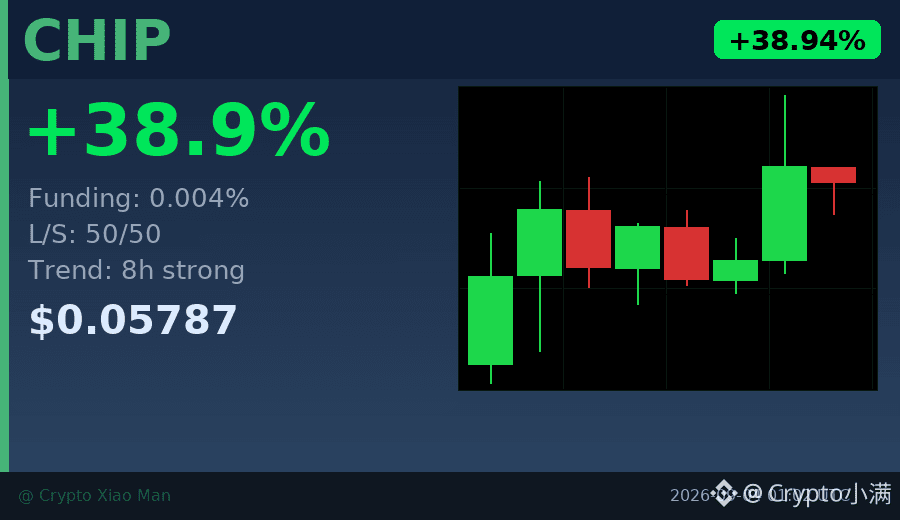
38% surge, but the funding rate is almost zero—what does that mean?
Today, CHIP moved from 0.041 to 0.058, with volume nearing 120 million USDT.
What’s most interesting is that the long/short ratio is 50/50—no one is betting on a direction, yet the price still climbed on its own.
Usually after a big rally, people start chasing longs, but this time everyone is staying very calm.
Either the main players are quietly accumulating, or retail traders haven’t reacted yet.
The overall trend is stronger within 8 hours, but funding didn’t keep up—this divergence is worth paying attention to.
If the funding rate stays this low, there may still be room to move higher.
$CHIP #资金费率背离 #38%
Click the small card below to quickly view the行情👇
38% surge, but the funding rate is almost zero—what does that mean?
Today, CHIP moved from 0.041 to 0.058, with volume nearing 120 million USDT.
What’s most interesting is that the long/short ratio is 50/50—no one is betting on a direction, yet the price still climbed on its own.
Usually after a big rally, people start chasing longs, but this time everyone is staying very calm.
Either the main players are quietly accumulating, or retail traders haven’t reacted yet.
The overall trend is stronger within 8 hours, but funding didn’t keep up—this divergence is worth paying attention to.
If the funding rate stays this low, there may still be room to move higher.
$CHIP #资金费率背离 #38%
Click the small card below to quickly view the行情👇
Today, CHIP moved from 0.041 to 0.058, with volume nearing 120 million USDT.
What’s most interesting is that the long/short ratio is 50/50—no one is betting on a direction, yet the price still climbed on its own.
Usually after a big rally, people start chasing longs, but this time everyone is staying very calm.
Either the main players are quietly accumulating, or retail traders haven’t reacted yet.
The overall trend is stronger within 8 hours, but funding didn’t keep up—this divergence is worth paying attention to.
If the funding rate stays this low, there may still be room to move higher.
$CHIP #资金费率背离 #38%
Click the small card below to quickly view the行情👇
106

⚖️ $BR: rather than choosing a side immediately, here are two competing arguments. Snapshot: 0.64628 · 24h +23.26% · volume ~802.6M USDT · 13,922,684 trades. 🟢 Bull/continuation case: Breaking above 0.71377 with expanding volume would make the continuation scenario more credible.
🔴 Bear/cooling case: Failing to hold the high and dropping back below the midpoint 0.596305 would make the cooling scenario more evident. 🎯 Preferred trend: **LONG · STRONG · 85/100**.
Key basis: 24h price +23.26%; price is at 71/100 within the 24h range; stronger than BTC by +23.00 percentage points.
Additional confirmation when: holding above 0.596305 and breaking 0.71377 with volume/flow continuing to validate.
Invalidate/cancel the direction if: losing 0.596305 with weakening taker/Leader flow. 📌 If you’re tracking $BR, open the cashtag to check the price, liquidity, and the current market context before deciding. 🔎 **Evidence check — LONG 85/100**
• 1H: SQUEEZE; RSI14 58.7; confluence 94/100.
• Notable technicals: Bollinger squeeze; EMA 20/50/200 stacking upward.
• 1H and 4H are aligned in the same direction.
• Price 0.64628; 24h +23.26%; volume 802.6M.
• Binance Top Search #38. 🧭 **Levels to watch:** Support 0.5771017 · Resistance 0.6856593 · confirm: hold above 0.596305 and break 0.71377 with volume/flow continuing to validate · invalidation: lose 0.596305 with weakening taker/Leader flow Reference sources: Binance Futures Market + Binance Top Search + Binance Klines / Technical · snapshot 2026-09-17 11:40:04 UTC
💬 **Discussion angle:** What confirmation are you waiting for with $BR: a clear breakout above resistance or a retest that holds the zone before going in?
⚠️ This market analysis is for reference only, not a commitment of profit. Each person should do their own research (DYOR), manage risk themselves, and be responsible for their trading decisions. $BR $BTC
⚖️ $BR : rather than choosing a side immediately, here are two competing arguments. Snapshot: 0.64628 · 24h +23.26% · volume ~802.6M USDT · 13,922,684 trades. 🟢 Bull/continuation case: Breaking above 0.71377 with expanding volume would make the continuation scenario more credible.
🔴 Bear/cooling case: Failing to hold the high and dropping back below the midpoint 0.596305 would make the cooling scenario more evident. 🎯 Preferred trend: **LONG · STRONG · 85/100**.
Key basis: 24h price +23.26%; price is at 71/100 within the 24h range; stronger than BTC by +23.00 percentage points.
Additional confirmation when: holding above 0.596305 and breaking 0.71377 with volume/flow continuing to validate.
Invalidate/cancel the direction if: losing 0.596305 with weakening taker/Leader flow. 📌 If you’re tracking $BR , open the cashtag to check the price, liquidity, and the current market context before deciding. 🔎 **Evidence check — LONG 85/100**
• 1H: SQUEEZE; RSI14 58.7; confluence 94/100.
• Notable technicals: Bollinger squeeze; EMA 20/50/200 stacking upward.
• 1H and 4H are aligned in the same direction.
• Price 0.64628; 24h +23.26%; volume 802.6M.
• Binance Top Search #38. 🧭 **Levels to watch:** Support 0.5771017 · Resistance 0.6856593 · confirm: hold above 0.596305 and break 0.71377 with volume/flow continuing to validate · invalidation: lose 0.596305 with weakening taker/Leader flow Reference sources: Binance Futures Market + Binance Top Search + Binance Klines / Technical · snapshot 2026-09-17 11:40:04 UTC
💬 **Discussion angle:** What confirmation are you waiting for with $BR : a clear breakout above resistance or a retest that holds the zone before going in?
⚠️ This market analysis is for reference only, not a commitment of profit. Each person should do their own research (DYOR), manage risk themselves, and be responsible for their trading decisions. $BR $BTC
🔴 Bear/cooling case: Failing to hold the high and dropping back below the midpoint 0.596305 would make the cooling scenario more evident. 🎯 Preferred trend: **LONG · STRONG · 85/100**.
Key basis: 24h price +23.26%; price is at 71/100 within the 24h range; stronger than BTC by +23.00 percentage points.
Additional confirmation when: holding above 0.596305 and breaking 0.71377 with volume/flow continuing to validate.
Invalidate/cancel the direction if: losing 0.596305 with weakening taker/Leader flow. 📌 If you’re tracking $BR , open the cashtag to check the price, liquidity, and the current market context before deciding. 🔎 **Evidence check — LONG 85/100**
• 1H: SQUEEZE; RSI14 58.7; confluence 94/100.
• Notable technicals: Bollinger squeeze; EMA 20/50/200 stacking upward.
• 1H and 4H are aligned in the same direction.
• Price 0.64628; 24h +23.26%; volume 802.6M.
• Binance Top Search #38. 🧭 **Levels to watch:** Support 0.5771017 · Resistance 0.6856593 · confirm: hold above 0.596305 and break 0.71377 with volume/flow continuing to validate · invalidation: lose 0.596305 with weakening taker/Leader flow Reference sources: Binance Futures Market + Binance Top Search + Binance Klines / Technical · snapshot 2026-09-17 11:40:04 UTC
💬 **Discussion angle:** What confirmation are you waiting for with $BR : a clear breakout above resistance or a retest that holds the zone before going in?
⚠️ This market analysis is for reference only, not a commitment of profit. Each person should do their own research (DYOR), manage risk themselves, and be responsible for their trading decisions. $BR $BTC
1
164

·
--
$VTHO This move has some real substance.
In 15m, it directly pulled up 3.15%. Volume hit 2.67x. The Z value is 6.46. The closing price is above the upper bound of the range of the last 20 5m candles. The active buy/sell ratio is 2.41—bullish is very obvious.
But what’s interesting is that OI didn’t rise; it actually fell. In 1h it’s -0.11%, and in 15m it’s -0.25%. When price goes up and positions drop, this combination usually means short covering or position unwinding—not new longs entering with conviction. So part of this rally is shorts being forced to cover; the momentum/fuel attribute is more bullish.
Nominal change is positive though: 152K USDT. The pool’s abnormal percentile is 85.3%, ranking #24 for the whole pool. Nominal change ranks #38, and the abnormality is relatively high.
Over 24h, the trading value is 80.84M USDT. Liquidity depth is sufficient—it’s not the kind of book that dies after a quick push.
Structurally, the breakout is real and the volume is real too, but the OI divergence at this point can’t be ignored. If it’s purely driven by short covering, whether the move can continue depends on whether there are fresh long buyers stepping in. Without follow-through, a retest of the upper edge of the breakout range is very likely.
First, let’s see if it can hold this level.
$VTHO This move has some real substance.
In 15m, it directly pulled up 3.15%. Volume hit 2.67x. The Z value is 6.46. The closing price is above the upper bound of the range of the last 20 5m candles. The active buy/sell ratio is 2.41—bullish is very obvious.
But what’s interesting is that OI didn’t rise; it actually fell. In 1h it’s -0.11%, and in 15m it’s -0.25%. When price goes up and positions drop, this combination usually means short covering or position unwinding—not new longs entering with conviction. So part of this rally is shorts being forced to cover; the momentum/fuel attribute is more bullish.
Nominal change is positive though: 152K USDT. The pool’s abnormal percentile is 85.3%, ranking #24 for the whole pool. Nominal change ranks #38, and the abnormality is relatively high.
Over 24h, the trading value is 80.84M USDT. Liquidity depth is sufficient—it’s not the kind of book that dies after a quick push.
Structurally, the breakout is real and the volume is real too, but the OI divergence at this point can’t be ignored. If it’s purely driven by short covering, whether the move can continue depends on whether there are fresh long buyers stepping in. Without follow-through, a retest of the upper edge of the breakout range is very likely.
First, let’s see if it can hold this level.
In 15m, it directly pulled up 3.15%. Volume hit 2.67x. The Z value is 6.46. The closing price is above the upper bound of the range of the last 20 5m candles. The active buy/sell ratio is 2.41—bullish is very obvious.
But what’s interesting is that OI didn’t rise; it actually fell. In 1h it’s -0.11%, and in 15m it’s -0.25%. When price goes up and positions drop, this combination usually means short covering or position unwinding—not new longs entering with conviction. So part of this rally is shorts being forced to cover; the momentum/fuel attribute is more bullish.
Nominal change is positive though: 152K USDT. The pool’s abnormal percentile is 85.3%, ranking #24 for the whole pool. Nominal change ranks #38, and the abnormality is relatively high.
Over 24h, the trading value is 80.84M USDT. Liquidity depth is sufficient—it’s not the kind of book that dies after a quick push.
Structurally, the breakout is real and the volume is real too, but the OI divergence at this point can’t be ignored. If it’s purely driven by short covering, whether the move can continue depends on whether there are fresh long buyers stepping in. Without follow-through, a retest of the upper edge of the breakout range is very likely.
First, let’s see if it can hold this level.
13

·
--
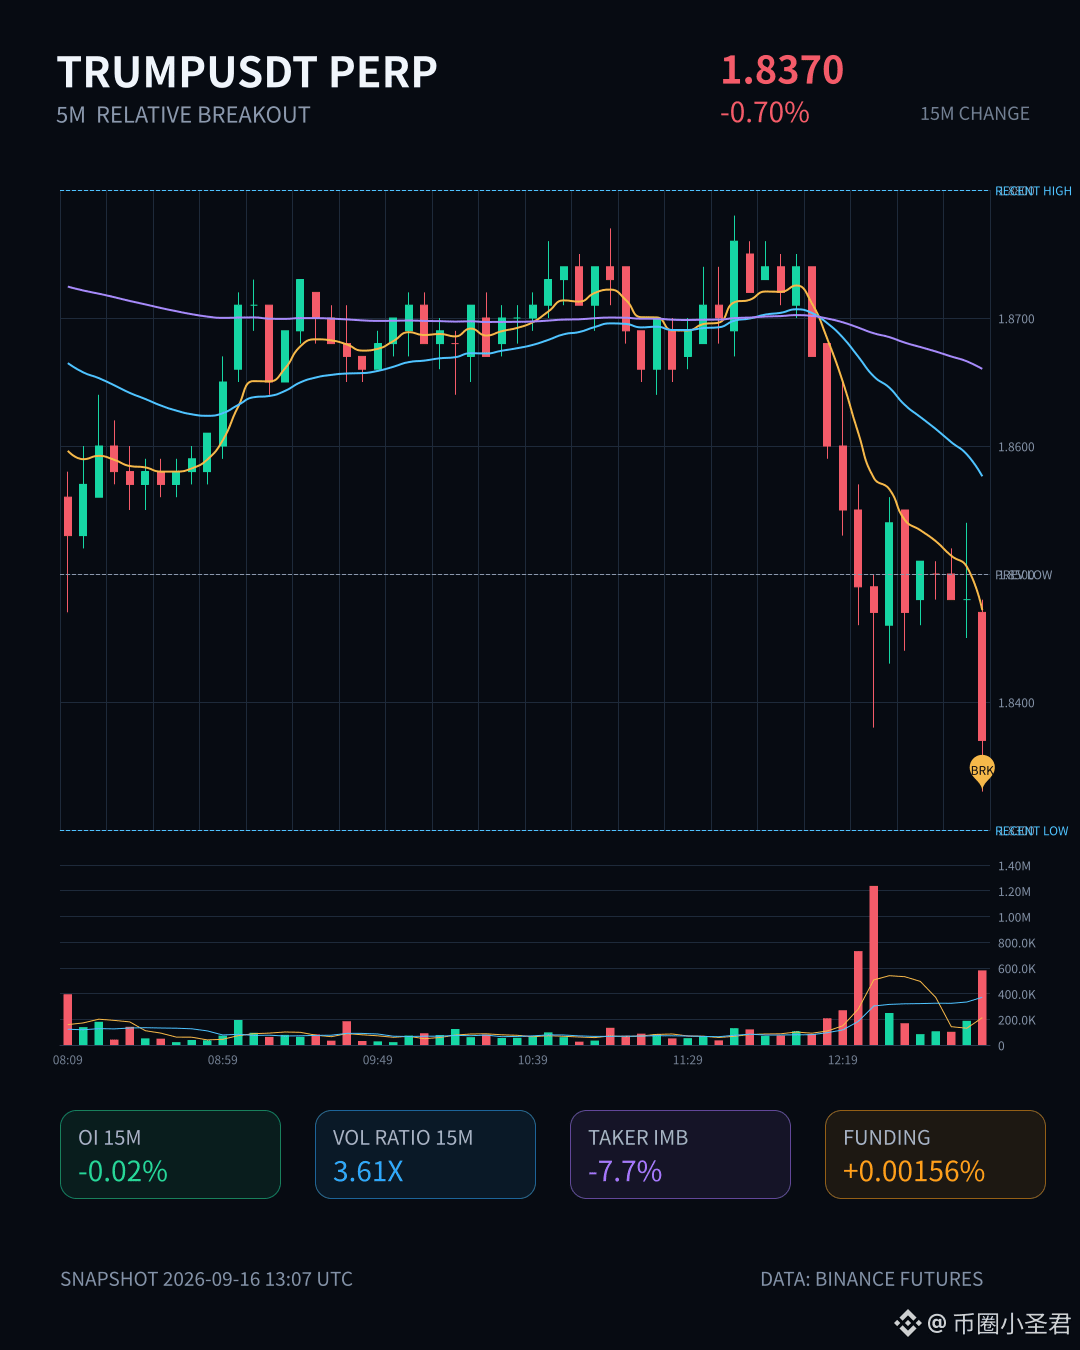
$TRUMP 15m This momentum can be put into 3.61x, yet the price only drops 0.70%. It has fallen below the lower bound of the recent 20-candle 5m range—not really like a panic selloff; more like the longs are slowly laying down their arms. OI (1h) nominally shrank 1.5%, active trades were down -7.7%, buy/sell ratio is 0.86—everything smells like deleveraging. The abnormal percentile is 85.1%; the whole pool ranks #38. The data is telling you to pay attention, but the price hasn’t crashed yet. This kind of divergence either builds up for a bounce, or it’s just the quiet phase before the next leg down.
$TRUMP 15m This momentum can be put into 3.61x, yet the price only drops 0.70%. It has fallen below the lower bound of the recent 20-candle 5m range—not really like a panic selloff; more like the longs are slowly laying down their arms. OI (1h) nominally shrank 1.5%, active trades were down -7.7%, buy/sell ratio is 0.86—everything smells like deleveraging. The abnormal percentile is 85.1%; the whole pool ranks #38. The data is telling you to pay attention, but the price hasn’t crashed yet. This kind of divergence either builds up for a bounce, or it’s just the quiet phase before the next leg down.
50

·
--
$STEEM This one has some substance.
In 15m, it pulled up nearly 3 points straight away: volume surged to 4x, volatility Z hit 5.7—this isn’t the usual slow, grinding kind of movement.
The key is that OI is rising in sync: in 15m and 1h, it’s +1.27% and +1.14% respectively, with nominal change of 113K. Price is up along with OI—this is a typical leveraged long entry structure, not the kind of “overweight” from short-covering.
It’s at the 94.4th abnormal percentile. In the whole pool it ranks as #11, with nominal change at #38—these are front-row numbers even across the entire pool.
Aggressive trades are 22.1% higher, buy/sell ratio is 1.57, and buy orders are clearly more主动.
It has also already broken above the upper edge of the last ~20 consecutive 5mK candles. 24h turnover is 27.9M, and the order book depth is keeping up as well.
It’s continuing across multiple consecutive cycles, not just a single spike. This kind of structure appearing suddenly from an old coin is worth watching to see if it can hold the breakout and stay firm afterward.
$STEEM This one has some substance.
In 15m, it pulled up nearly 3 points straight away: volume surged to 4x, volatility Z hit 5.7—this isn’t the usual slow, grinding kind of movement.
The key is that OI is rising in sync: in 15m and 1h, it’s +1.27% and +1.14% respectively, with nominal change of 113K. Price is up along with OI—this is a typical leveraged long entry structure, not the kind of “overweight” from short-covering.
It’s at the 94.4th abnormal percentile. In the whole pool it ranks as #11, with nominal change at #38—these are front-row numbers even across the entire pool.
Aggressive trades are 22.1% higher, buy/sell ratio is 1.57, and buy orders are clearly more主动.
It has also already broken above the upper edge of the last ~20 consecutive 5mK candles. 24h turnover is 27.9M, and the order book depth is keeping up as well.
It’s continuing across multiple consecutive cycles, not just a single spike. This kind of structure appearing suddenly from an old coin is worth watching to see if it can hold the breakout and stay firm afterward.
In 15m, it pulled up nearly 3 points straight away: volume surged to 4x, volatility Z hit 5.7—this isn’t the usual slow, grinding kind of movement.
The key is that OI is rising in sync: in 15m and 1h, it’s +1.27% and +1.14% respectively, with nominal change of 113K. Price is up along with OI—this is a typical leveraged long entry structure, not the kind of “overweight” from short-covering.
It’s at the 94.4th abnormal percentile. In the whole pool it ranks as #11, with nominal change at #38—these are front-row numbers even across the entire pool.
Aggressive trades are 22.1% higher, buy/sell ratio is 1.57, and buy orders are clearly more主动.
It has also already broken above the upper edge of the last ~20 consecutive 5mK candles. 24h turnover is 27.9M, and the order book depth is keeping up as well.
It’s continuing across multiple consecutive cycles, not just a single spike. This kind of structure appearing suddenly from an old coin is worth watching to see if it can hold the breakout and stay firm afterward.
·
--
$AERO This 15m period is kind of interesting.
Price dropped 0.74%, volume surged straight to 2.18x, and the volatility Z also got pulled up to 2.10. The close even broke below the lower edge of the last ~20 5m periods. Active trading volume was down -18%, the buy-sell ratio was 0.69, and sell pressure is undeniably real.
But looking at OI: in the 15m window it’s only +0.01%, in the 1h window +0.33%, and the nominal numbers are still negative—-159K and -216K. When price is falling while OI barely increases, it looks more like newly added leveraged shorts are pushing, rather than old longs being liquidated and triggering a cascade.
The anomaly percentile is 92.1%, ranked #7 in the whole pool, nominal change #38, and depth confirmation has also passed. This structure is something to watch: if the shorts keep adding, there may still be room to the downside. But on the other hand, if volume can’t keep up, short covering could happen quickly.
24h turnover is 13.51M—not thick. Don’t get carried away.
$AERO This 15m period is kind of interesting.
Price dropped 0.74%, volume surged straight to 2.18x, and the volatility Z also got pulled up to 2.10. The close even broke below the lower edge of the last ~20 5m periods. Active trading volume was down -18%, the buy-sell ratio was 0.69, and sell pressure is undeniably real.
But looking at OI: in the 15m window it’s only +0.01%, in the 1h window +0.33%, and the nominal numbers are still negative—-159K and -216K. When price is falling while OI barely increases, it looks more like newly added leveraged shorts are pushing, rather than old longs being liquidated and triggering a cascade.
The anomaly percentile is 92.1%, ranked #7 in the whole pool, nominal change #38, and depth confirmation has also passed. This structure is something to watch: if the shorts keep adding, there may still be room to the downside. But on the other hand, if volume can’t keep up, short covering could happen quickly.
24h turnover is 13.51M—not thick. Don’t get carried away.
Price dropped 0.74%, volume surged straight to 2.18x, and the volatility Z also got pulled up to 2.10. The close even broke below the lower edge of the last ~20 5m periods. Active trading volume was down -18%, the buy-sell ratio was 0.69, and sell pressure is undeniably real.
But looking at OI: in the 15m window it’s only +0.01%, in the 1h window +0.33%, and the nominal numbers are still negative—-159K and -216K. When price is falling while OI barely increases, it looks more like newly added leveraged shorts are pushing, rather than old longs being liquidated and triggering a cascade.
The anomaly percentile is 92.1%, ranked #7 in the whole pool, nominal change #38, and depth confirmation has also passed. This structure is something to watch: if the shorts keep adding, there may still be room to the downside. But on the other hand, if volume can’t keep up, short covering could happen quickly.
24h turnover is 13.51M—not thick. Don’t get carried away.
1
·
--
$MINA This wave is a bit interesting.
In the 15m timeframe, it’s up 3.44% and the volume directly hit 3.81x. The volatility (Z) reached 5.72, and the closing price even broke above the upper band of the last 20 5m candles.
But the key point isn’t the price—it’s the OI.
The 15m OI is -0.37%, yet the notional is +3.09%. In the 1h timeframe, OI is +0.54% and the notional is +2.54%. The OI abnormal percentile is 99.4%—#1 in the whole pool, and #38 in notional changes.
Price is rising, but OI isn’t keeping up. This structure is more like short covering or positions being passively unwound, not like a large influx of new longs.
Active trades are off by 3.9%, with a buy/sell ratio of 1.08. The buy side has a slight advantage, but not to an overwhelming extent.
The 24h turnover is 19.78M USDT. The depth is there—multiple consecutive periods show follow-through, so it isn’t just a single wick.
My take is: in this kind of position, either shorts are being forced into a corner, or someone is trying a probing push. With such an extreme percentile and the #1 rank in the whole pool, it’s worth watching whether subsequent OI can turn positive. If OI continues to diverge, then the sustainability of this rebound will have to be questioned.
Let’s watch for now—no rush to act.
$MINA This wave is a bit interesting.
In the 15m timeframe, it’s up 3.44% and the volume directly hit 3.81x. The volatility (Z) reached 5.72, and the closing price even broke above the upper band of the last 20 5m candles.
But the key point isn’t the price—it’s the OI.
The 15m OI is -0.37%, yet the notional is +3.09%. In the 1h timeframe, OI is +0.54% and the notional is +2.54%. The OI abnormal percentile is 99.4%—#1 in the whole pool, and #38 in notional changes.
Price is rising, but OI isn’t keeping up. This structure is more like short covering or positions being passively unwound, not like a large influx of new longs.
Active trades are off by 3.9%, with a buy/sell ratio of 1.08. The buy side has a slight advantage, but not to an overwhelming extent.
The 24h turnover is 19.78M USDT. The depth is there—multiple consecutive periods show follow-through, so it isn’t just a single wick.
My take is: in this kind of position, either shorts are being forced into a corner, or someone is trying a probing push. With such an extreme percentile and the #1 rank in the whole pool, it’s worth watching whether subsequent OI can turn positive. If OI continues to diverge, then the sustainability of this rebound will have to be questioned.
Let’s watch for now—no rush to act.
In the 15m timeframe, it’s up 3.44% and the volume directly hit 3.81x. The volatility (Z) reached 5.72, and the closing price even broke above the upper band of the last 20 5m candles.
But the key point isn’t the price—it’s the OI.
The 15m OI is -0.37%, yet the notional is +3.09%. In the 1h timeframe, OI is +0.54% and the notional is +2.54%. The OI abnormal percentile is 99.4%—#1 in the whole pool, and #38 in notional changes.
Price is rising, but OI isn’t keeping up. This structure is more like short covering or positions being passively unwound, not like a large influx of new longs.
Active trades are off by 3.9%, with a buy/sell ratio of 1.08. The buy side has a slight advantage, but not to an overwhelming extent.
The 24h turnover is 19.78M USDT. The depth is there—multiple consecutive periods show follow-through, so it isn’t just a single wick.
My take is: in this kind of position, either shorts are being forced into a corner, or someone is trying a probing push. With such an extreme percentile and the #1 rank in the whole pool, it’s worth watching whether subsequent OI can turn positive. If OI continues to diverge, then the sustainability of this rebound will have to be questioned.
Let’s watch for now—no rush to act.
2
·
--
ACE 15m pulled a run and the price broke above the upper edge of the 5m around 20 units; volume hit 1.69x, the Z-value is 2.96—this is already fairly extreme volatility.
But the OI looks interesting: for the 15m contract, -0.04%, and for the 1h, -0.43%. As the price goes up, the position size is actually decreasing. This structure is very likely short-covering push rather than new long positions actively entering. The difference in passive vs active fills is only 0.4%, the buy/sell ratio is 1.01, and chasing higher isn’t strong.
However, the OI percentile is abnormal at 94.8%—the whole pool’s abnormal rank is #3, and the notional change rank is #38—indicating that this signal really does rank near the top across the entire market. The 24h traded value is 11.84M, and the order book has confirmation.
The key is whether it can hold here. If it’s purely a short-covering move, once the cover is done it may lose momentum. The 20-5m upper edge has just been broken—observe the pullback and confirmation first.
ACE 15m pulled a run and the price broke above the upper edge of the 5m around 20 units; volume hit 1.69x, the Z-value is 2.96—this is already fairly extreme volatility.
But the OI looks interesting: for the 15m contract, -0.04%, and for the 1h, -0.43%. As the price goes up, the position size is actually decreasing. This structure is very likely short-covering push rather than new long positions actively entering. The difference in passive vs active fills is only 0.4%, the buy/sell ratio is 1.01, and chasing higher isn’t strong.
However, the OI percentile is abnormal at 94.8%—the whole pool’s abnormal rank is #3, and the notional change rank is #38—indicating that this signal really does rank near the top across the entire market. The 24h traded value is 11.84M, and the order book has confirmation.
The key is whether it can hold here. If it’s purely a short-covering move, once the cover is done it may lose momentum. The 20-5m upper edge has just been broken—observe the pullback and confirmation first.
But the OI looks interesting: for the 15m contract, -0.04%, and for the 1h, -0.43%. As the price goes up, the position size is actually decreasing. This structure is very likely short-covering push rather than new long positions actively entering. The difference in passive vs active fills is only 0.4%, the buy/sell ratio is 1.01, and chasing higher isn’t strong.
However, the OI percentile is abnormal at 94.8%—the whole pool’s abnormal rank is #3, and the notional change rank is #38—indicating that this signal really does rank near the top across the entire market. The 24h traded value is 11.84M, and the order book has confirmation.
The key is whether it can hold here. If it’s purely a short-covering move, once the cover is done it may lose momentum. The 20-5m upper edge has just been broken—observe the pullback and confirmation first.
13
·
--
This dip in ETH isn’t particularly severe—on the 15m chart it’s only -0.18%, but there’s been continuous bleeding underneath the price action.
In the past hour, OI (open interest) dropped by 0.45%, with notional down by 57.11 million U. Along with price moving lower, this is a very typical deleveraging by longs. It’s not new shorts coming in to smash it—it's the longs themselves getting liquidated and cutting positions. On the 5m Binance, the liquidation proxy hit 171K; sell-side liquidations were more concentrated, and a round of stop-loss orders got swept.
What’s more interesting is that volume is only 0.75x, while the volatility Z is 0.51—shrinking volume with a slow, bearish drift. Nobody’s stepping in. Aggressive volume is down 4.9%, buy/sell ratio is 0.91: sell pressure isn’t that aggressive, but the buy side is weaker. Over 24h there’s still $15.3B in trading volume, and the pool is deep enough, so this level of OI contraction hasn’t triggered a chain-reaction liquidation for now. Liquidation pressure is concentrated on Binance futures, so it’s essentially localized “bloodletting.”
The anomaly percentile is 62.1%, overall pool #38; meanwhile, the notional change ranks as high as #2. In plain terms: the move isn’t big, but the capital is quietly withdrawing. I’m not really in the mood to catch this falling knife—I’d rather wait for the OI to stop bleeding and for aggressive buying to return. In this kind of drifting-down tape, catching knives often means you end up being the one who catches the last batch of stop-losses.
This dip in ETH isn’t particularly severe—on the 15m chart it’s only -0.18%, but there’s been continuous bleeding underneath the price action.
In the past hour, OI (open interest) dropped by 0.45%, with notional down by 57.11 million U. Along with price moving lower, this is a very typical deleveraging by longs. It’s not new shorts coming in to smash it—it's the longs themselves getting liquidated and cutting positions. On the 5m Binance, the liquidation proxy hit 171K; sell-side liquidations were more concentrated, and a round of stop-loss orders got swept.
What’s more interesting is that volume is only 0.75x, while the volatility Z is 0.51—shrinking volume with a slow, bearish drift. Nobody’s stepping in. Aggressive volume is down 4.9%, buy/sell ratio is 0.91: sell pressure isn’t that aggressive, but the buy side is weaker. Over 24h there’s still $15.3B in trading volume, and the pool is deep enough, so this level of OI contraction hasn’t triggered a chain-reaction liquidation for now. Liquidation pressure is concentrated on Binance futures, so it’s essentially localized “bloodletting.”
The anomaly percentile is 62.1%, overall pool #38; meanwhile, the notional change ranks as high as #2. In plain terms: the move isn’t big, but the capital is quietly withdrawing. I’m not really in the mood to catch this falling knife—I’d rather wait for the OI to stop bleeding and for aggressive buying to return. In this kind of drifting-down tape, catching knives often means you end up being the one who catches the last batch of stop-losses.
In the past hour, OI (open interest) dropped by 0.45%, with notional down by 57.11 million U. Along with price moving lower, this is a very typical deleveraging by longs. It’s not new shorts coming in to smash it—it's the longs themselves getting liquidated and cutting positions. On the 5m Binance, the liquidation proxy hit 171K; sell-side liquidations were more concentrated, and a round of stop-loss orders got swept.
What’s more interesting is that volume is only 0.75x, while the volatility Z is 0.51—shrinking volume with a slow, bearish drift. Nobody’s stepping in. Aggressive volume is down 4.9%, buy/sell ratio is 0.91: sell pressure isn’t that aggressive, but the buy side is weaker. Over 24h there’s still $15.3B in trading volume, and the pool is deep enough, so this level of OI contraction hasn’t triggered a chain-reaction liquidation for now. Liquidation pressure is concentrated on Binance futures, so it’s essentially localized “bloodletting.”
The anomaly percentile is 62.1%, overall pool #38; meanwhile, the notional change ranks as high as #2. In plain terms: the move isn’t big, but the capital is quietly withdrawing. I’m not really in the mood to catch this falling knife—I’d rather wait for the OI to stop bleeding and for aggressive buying to return. In this kind of drifting-down tape, catching knives often means you end up being the one who catches the last batch of stop-losses.
4
·
--
ATOM This move feels a bit off.
In the 15m, price dropped straight by 1.72%, volume surged to 2.90x, volatility (Z) reached 2.70, and the close also fell below the lower bound of the last 20 consecutive 5m candles. This isn’t the kind of low-volume, slow bearish drift—someone is actively smashing it down. Active trading shows a negative spread of -20.4%, buy-sell ratio at 0.66, with sell pressure clearly dominant.
But what really catches my attention is the OI. As price falls, OI is actually being slightly lifted: 15m +0.02%, 1h +0.08%. The nominal change is negative, which suggests it’s not simply long-liquidation clearing—more like new leveraged short positions entering. The abnormal percentile is 76%, in the full pool #29; nominal change ranks #38. It’s not extremely abnormal on its own, but combined with the breakout breakdown on heavy volume, this setup is worth watching.
Simply put: someone is betting on it continuing lower, using leverage.
After the breakdown, I’m watching two points now—first, whether the level that was broken can be reclaimed quickly; if it can’t be reclaimed, this lower bound will turn into resistance. Second, if OI keeps building up while price doesn’t bounce, the fuel for a short squeeze is also accumulating, so it wouldn’t be surprising to see a sharp reversal needle in the opposite direction.
With 24h turnover only 39M, liquidity isn’t thick. Don’t chase at this spot—wait for confirmation. $ATOM
ATOM This move feels a bit off.
In the 15m, price dropped straight by 1.72%, volume surged to 2.90x, volatility (Z) reached 2.70, and the close also fell below the lower bound of the last 20 consecutive 5m candles. This isn’t the kind of low-volume, slow bearish drift—someone is actively smashing it down. Active trading shows a negative spread of -20.4%, buy-sell ratio at 0.66, with sell pressure clearly dominant.
But what really catches my attention is the OI. As price falls, OI is actually being slightly lifted: 15m +0.02%, 1h +0.08%. The nominal change is negative, which suggests it’s not simply long-liquidation clearing—more like new leveraged short positions entering. The abnormal percentile is 76%, in the full pool #29; nominal change ranks #38. It’s not extremely abnormal on its own, but combined with the breakout breakdown on heavy volume, this setup is worth watching.
Simply put: someone is betting on it continuing lower, using leverage.
After the breakdown, I’m watching two points now—first, whether the level that was broken can be reclaimed quickly; if it can’t be reclaimed, this lower bound will turn into resistance. Second, if OI keeps building up while price doesn’t bounce, the fuel for a short squeeze is also accumulating, so it wouldn’t be surprising to see a sharp reversal needle in the opposite direction.
With 24h turnover only 39M, liquidity isn’t thick. Don’t chase at this spot—wait for confirmation. $ATOM
In the 15m, price dropped straight by 1.72%, volume surged to 2.90x, volatility (Z) reached 2.70, and the close also fell below the lower bound of the last 20 consecutive 5m candles. This isn’t the kind of low-volume, slow bearish drift—someone is actively smashing it down. Active trading shows a negative spread of -20.4%, buy-sell ratio at 0.66, with sell pressure clearly dominant.
But what really catches my attention is the OI. As price falls, OI is actually being slightly lifted: 15m +0.02%, 1h +0.08%. The nominal change is negative, which suggests it’s not simply long-liquidation clearing—more like new leveraged short positions entering. The abnormal percentile is 76%, in the full pool #29; nominal change ranks #38. It’s not extremely abnormal on its own, but combined with the breakout breakdown on heavy volume, this setup is worth watching.
Simply put: someone is betting on it continuing lower, using leverage.
After the breakdown, I’m watching two points now—first, whether the level that was broken can be reclaimed quickly; if it can’t be reclaimed, this lower bound will turn into resistance. Second, if OI keeps building up while price doesn’t bounce, the fuel for a short squeeze is also accumulating, so it wouldn’t be surprising to see a sharp reversal needle in the opposite direction.
With 24h turnover only 39M, liquidity isn’t thick. Don’t chase at this spot—wait for confirmation. $ATOM

9

·
--
Bullish
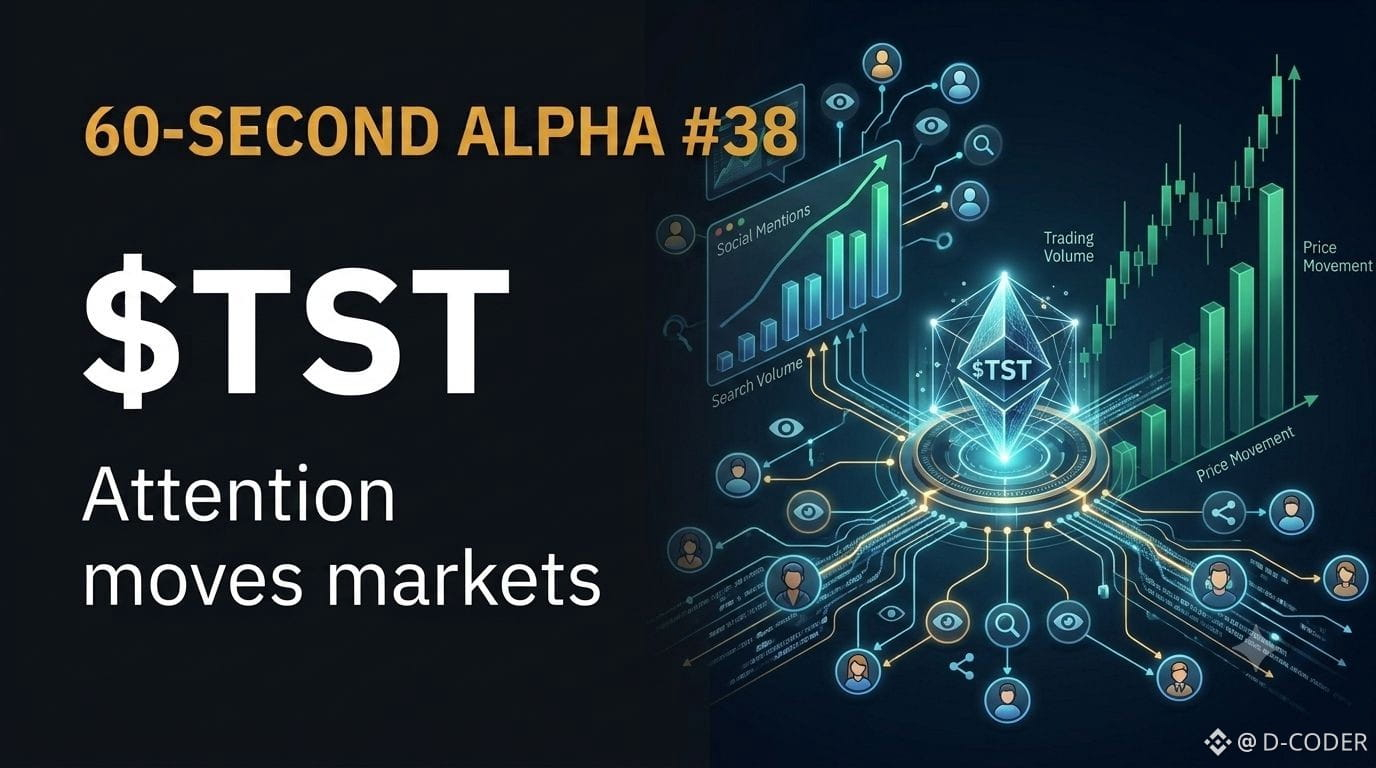
60-SECOND ALPHA #38 | $TST
$TST is a useful example of how a token can become heavily influenced by community attention and short-term speculation. When that attention increases, volume can expand rapidly and price can move far beyond its previous range.
Alpha: A viral token can gain attention in minutes. Keeping that attention is much harder.
{future}(TSTUSDT)
60-SECOND ALPHA #38 | $TST
$TST is a useful example of how a token can become heavily influenced by community attention and short-term speculation. When that attention increases, volume can expand rapidly and price can move far beyond its previous range.
Alpha: A viral token can gain attention in minutes. Keeping that attention is much harder.
$TST is a useful example of how a token can become heavily influenced by community attention and short-term speculation. When that attention increases, volume can expand rapidly and price can move far beyond its previous range.
Alpha: A viral token can gain attention in minutes. Keeping that attention is much harder.
186
·
--
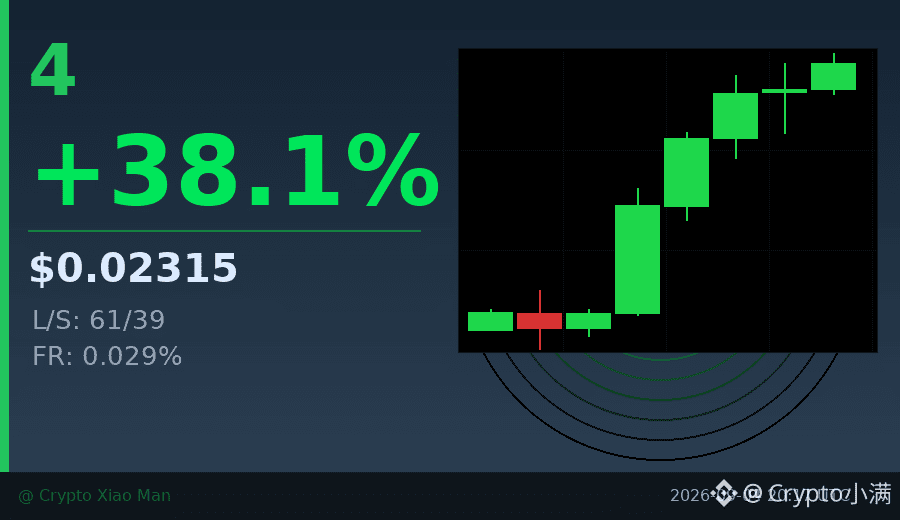
38% gain, but longs only make up 61%—this pace is kind of interesting.
$4’s trading volume surged to 50 million U today, and the hourly chart printed three consecutive bullish candles pushing upward.
The price climbed from around 0.015 all the way to 0.023, with strong buying pressure.
The key point is that the position structure still hasn’t reached a crazy level.
A 61% long ratio suggests there’s still room, and it’s not the kind of crowded trade with 80%+ longs.
The funding rate of 0.029% is also fairly mild.
This isn’t a move being propped up by extreme funding rates.
$4 #强势突破 #38%
Click the card below to quickly check the market👇
38% gain, but longs only make up 61%—this pace is kind of interesting.
$4’s trading volume surged to 50 million U today, and the hourly chart printed three consecutive bullish candles pushing upward.
The price climbed from around 0.015 all the way to 0.023, with strong buying pressure.
The key point is that the position structure still hasn’t reached a crazy level.
A 61% long ratio suggests there’s still room, and it’s not the kind of crowded trade with 80%+ longs.
The funding rate of 0.029% is also fairly mild.
This isn’t a move being propped up by extreme funding rates.
$4 #强势突破 #38%
Click the card below to quickly check the market👇
$4’s trading volume surged to 50 million U today, and the hourly chart printed three consecutive bullish candles pushing upward.
The price climbed from around 0.015 all the way to 0.023, with strong buying pressure.
The key point is that the position structure still hasn’t reached a crazy level.
A 61% long ratio suggests there’s still room, and it’s not the kind of crowded trade with 80%+ longs.
The funding rate of 0.029% is also fairly mild.
This isn’t a move being propped up by extreme funding rates.
$4 #强势突破 #38%
Click the card below to quickly check the market👇
55
·
--
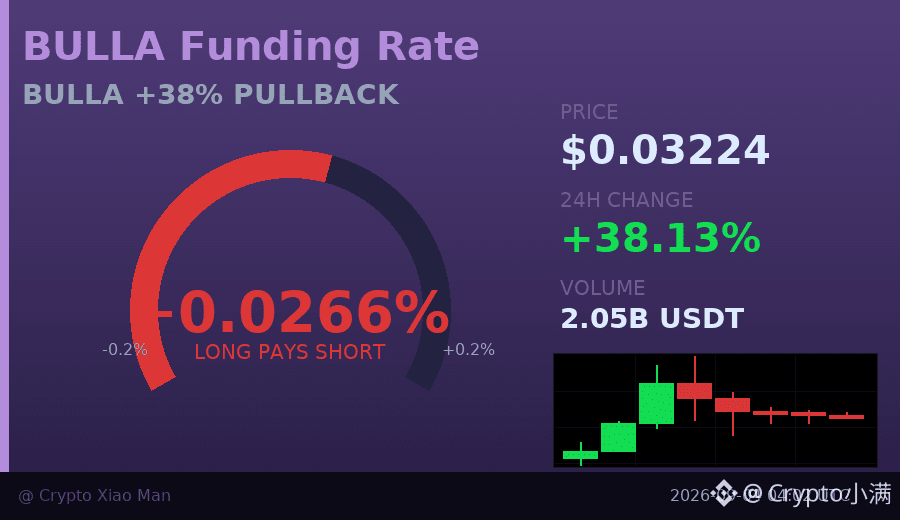
Up 38% in a day, but in the past three 1-hour candlesticks it has quietly started to pull back.
BULLA is indeed strong today: volume surged to over 200 million U, and the price jumped from 0.022 up to 0.044 before dipping back to 0.032.
This kind of走势 (price action) is typical: after an early-session spike, profit-taking kicks in and the hourly chart keeps closing bearish.
57% are going long and 43% are going short—no extreme disagreement between bulls and bears.
The funding rate is 0.026%, which suggests the longs are still paying the shorts, but the pressure isn’t heavy.
The key is whether it can hold around 0.031 over the next 1–2 hours.
If it holds, it could be a healthy pullback; if it doesn’t, the short-term may keep revisiting 0.028.
$BULLA #强势回调 #38%
Tap the small card below to quickly check the行情👇
Up 38% in a day, but in the past three 1-hour candlesticks it has quietly started to pull back.
BULLA is indeed strong today: volume surged to over 200 million U, and the price jumped from 0.022 up to 0.044 before dipping back to 0.032.
This kind of走势 (price action) is typical: after an early-session spike, profit-taking kicks in and the hourly chart keeps closing bearish.
57% are going long and 43% are going short—no extreme disagreement between bulls and bears.
The funding rate is 0.026%, which suggests the longs are still paying the shorts, but the pressure isn’t heavy.
The key is whether it can hold around 0.031 over the next 1–2 hours.
If it holds, it could be a healthy pullback; if it doesn’t, the short-term may keep revisiting 0.028.
$BULLA #强势回调 #38%
Tap the small card below to quickly check the行情👇
BULLA is indeed strong today: volume surged to over 200 million U, and the price jumped from 0.022 up to 0.044 before dipping back to 0.032.
This kind of走势 (price action) is typical: after an early-session spike, profit-taking kicks in and the hourly chart keeps closing bearish.
57% are going long and 43% are going short—no extreme disagreement between bulls and bears.
The funding rate is 0.026%, which suggests the longs are still paying the shorts, but the pressure isn’t heavy.
The key is whether it can hold around 0.031 over the next 1–2 hours.
If it holds, it could be a healthy pullback; if it doesn’t, the short-term may keep revisiting 0.028.
$BULLA #强势回调 #38%
Tap the small card below to quickly check the行情👇
14
·
--
$HEMI This 15m draw has a bit of strength 👀
The price broke through the top of the near-20x 5m K-line range. A 1.85% gain doesn’t look huge at first glance, but with the volume at 1.39x and the volatility Z value at 1.98, it actually already has the “building momentum” vibe. The key is OI—on the 15m contract, +0.25% looks mild, but the notional change directly jumped to 446K (+2.15%). On the 1h dimension it’s even 659K (+3.21%). This doesn’t look like short-covering; it looks more like newly added leveraged longs are actively entering.
Active execution is down 15.8%, buy-to-sell ratio 1.37, and in terms of direction, longs are truly in control. The abnormal ranking in the whole pool is #38, and the notional change has climbed to #12. The money isn’t randomly buying—it’s hitting the boundary of the range.
With this kind of capital structure on the 15-minute timeframe, short-term momentum may continue. However, since OI is rising so quickly, if volume can’t keep up, pullbacks will come fast too. Keep an eye on it—don’t chase the price.
$HEMI This 15m draw has a bit of strength 👀
The price broke through the top of the near-20x 5m K-line range. A 1.85% gain doesn’t look huge at first glance, but with the volume at 1.39x and the volatility Z value at 1.98, it actually already has the “building momentum” vibe. The key is OI—on the 15m contract, +0.25% looks mild, but the notional change directly jumped to 446K (+2.15%). On the 1h dimension it’s even 659K (+3.21%). This doesn’t look like short-covering; it looks more like newly added leveraged longs are actively entering.
Active execution is down 15.8%, buy-to-sell ratio 1.37, and in terms of direction, longs are truly in control. The abnormal ranking in the whole pool is #38, and the notional change has climbed to #12. The money isn’t randomly buying—it’s hitting the boundary of the range.
With this kind of capital structure on the 15-minute timeframe, short-term momentum may continue. However, since OI is rising so quickly, if volume can’t keep up, pullbacks will come fast too. Keep an eye on it—don’t chase the price.
The price broke through the top of the near-20x 5m K-line range. A 1.85% gain doesn’t look huge at first glance, but with the volume at 1.39x and the volatility Z value at 1.98, it actually already has the “building momentum” vibe. The key is OI—on the 15m contract, +0.25% looks mild, but the notional change directly jumped to 446K (+2.15%). On the 1h dimension it’s even 659K (+3.21%). This doesn’t look like short-covering; it looks more like newly added leveraged longs are actively entering.
Active execution is down 15.8%, buy-to-sell ratio 1.37, and in terms of direction, longs are truly in control. The abnormal ranking in the whole pool is #38, and the notional change has climbed to #12. The money isn’t randomly buying—it’s hitting the boundary of the range.
With this kind of capital structure on the 15-minute timeframe, short-term momentum may continue. However, since OI is rising so quickly, if volume can’t keep up, pullbacks will come fast too. Keep an eye on it—don’t chase the price.
85


·
--
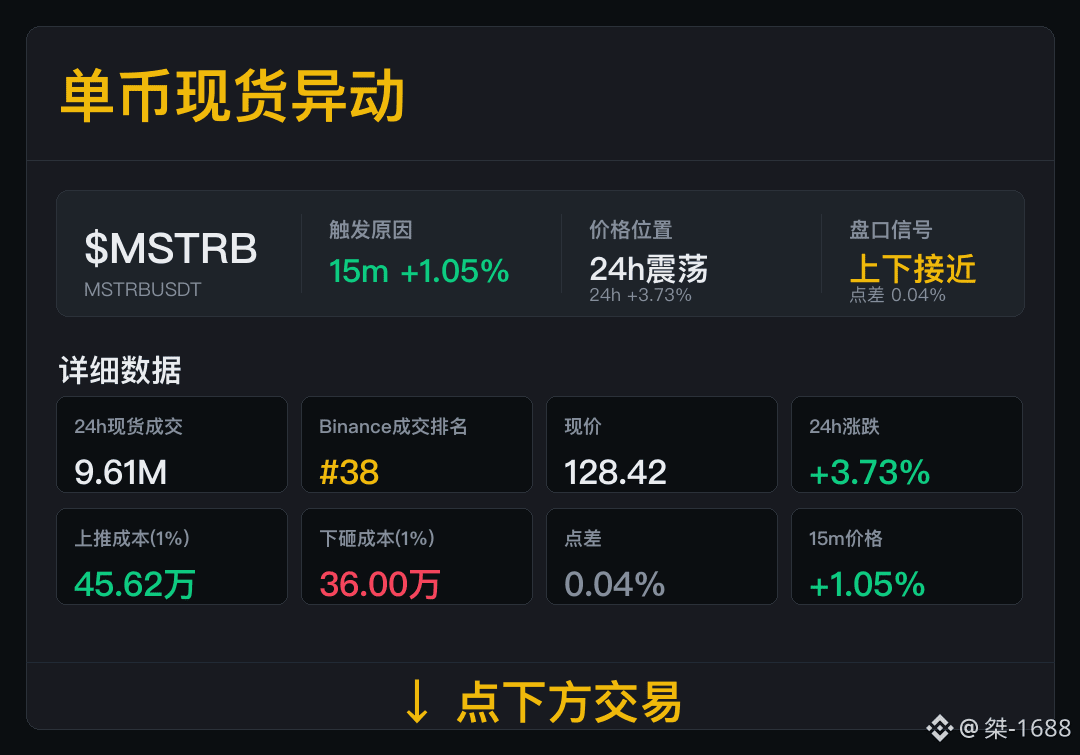
$MSTRB Intraday volatility amplification—trading volume and bid-ask spread need to be viewed together.
Spot volume: 9.61M; Binance trade ranking: #38. The positions within the list have been specified—check whether the volume continues into the next round.
Now: 24h change +3.73%; spread 0.04%. Pushing up costs: 456.2k; selling down costs: 360.0k. Order book costs reflect the difficulty of entering and exiting positions, and volume determines how far the market can move.
Going forward, don’t just look at the current price. If volume dries up or the spread widens, downgrade first.
$MSTRB Intraday volatility amplification—trading volume and bid-ask spread need to be viewed together.
Spot volume: 9.61M; Binance trade ranking: #38. The positions within the list have been specified—check whether the volume continues into the next round.
Now: 24h change +3.73%; spread 0.04%. Pushing up costs: 456.2k; selling down costs: 360.0k. Order book costs reflect the difficulty of entering and exiting positions, and volume determines how far the market can move.
Going forward, don’t just look at the current price. If volume dries up or the spread widens, downgrade first.
Spot volume: 9.61M; Binance trade ranking: #38. The positions within the list have been specified—check whether the volume continues into the next round.
Now: 24h change +3.73%; spread 0.04%. Pushing up costs: 456.2k; selling down costs: 360.0k. Order book costs reflect the difficulty of entering and exiting positions, and volume determines how far the market can move.
Going forward, don’t just look at the current price. If volume dries up or the spread widens, downgrade first.
112
·
--
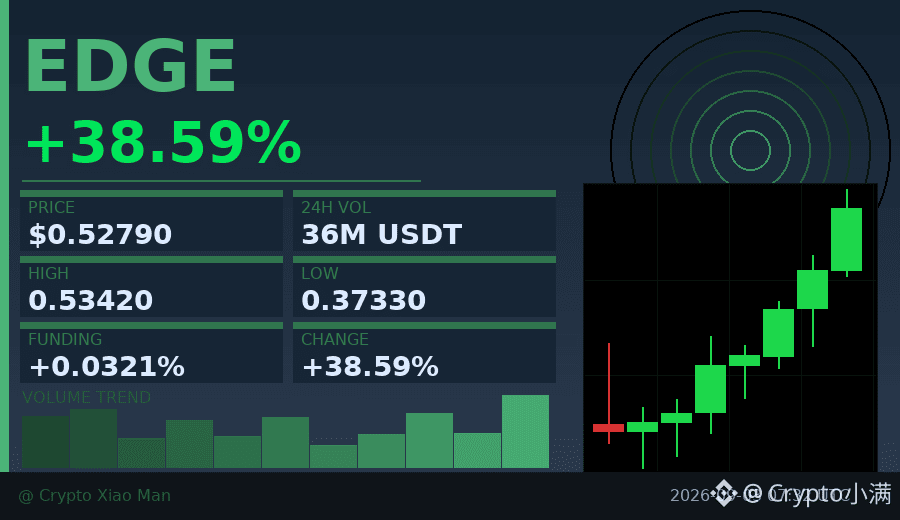
38% single-day gain, but the funding rate has quietly climbed to 0.032—longs are starting to pay a premium.
EDGE, this round of rally is a bit interesting: spot volume is 35.7 million USDT, long positions account for 64%, and yet the hourly chart has already closed green for three consecutive candles, suggesting the buying isn’t a one-off impulse—it’s sustained entry.
Low-priced coins often behave like this: once sentiment ignites, short-covering accelerates to the upside. But if the funding rate keeps rising, the short term may chop and “wash” for a bit.
I’m watching support at 0.50. If it breaks, I’ll trim; if it doesn’t, I’ll let the profits run.
$EDGE #低价币爆发 #38%
Click the small card below to quickly check the market👇
38% single-day gain, but the funding rate has quietly climbed to 0.032—longs are starting to pay a premium.
EDGE, this round of rally is a bit interesting: spot volume is 35.7 million USDT, long positions account for 64%, and yet the hourly chart has already closed green for three consecutive candles, suggesting the buying isn’t a one-off impulse—it’s sustained entry.
Low-priced coins often behave like this: once sentiment ignites, short-covering accelerates to the upside. But if the funding rate keeps rising, the short term may chop and “wash” for a bit.
I’m watching support at 0.50. If it breaks, I’ll trim; if it doesn’t, I’ll let the profits run.
$EDGE #低价币爆发 #38%
Click the small card below to quickly check the market👇
EDGE, this round of rally is a bit interesting: spot volume is 35.7 million USDT, long positions account for 64%, and yet the hourly chart has already closed green for three consecutive candles, suggesting the buying isn’t a one-off impulse—it’s sustained entry.
Low-priced coins often behave like this: once sentiment ignites, short-covering accelerates to the upside. But if the funding rate keeps rising, the short term may chop and “wash” for a bit.
I’m watching support at 0.50. If it breaks, I’ll trim; if it doesn’t, I’ll let the profits run.
$EDGE #低价币爆发 #38%
Click the small card below to quickly check the market👇
74
·
--
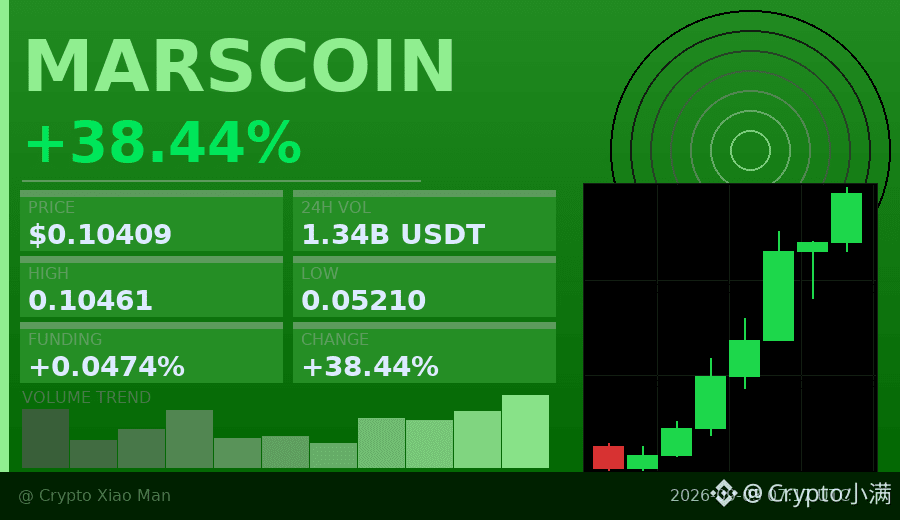
Behind the 38% surge, the trading volume has already climbed to 133 million USD.
MARSCOIN has risen from a low of 0.052 to the current 0.104; the hourly chart has been closing in bullish candles consecutively, and the buy-side demand has never stopped.
The long-to-short ratio is 48% to 52%, with neither side having an absolute advantage—indicating this isn’t a one-sided squeeze, but real capital is entering the market.
The funding rate is 0.047%, slightly positive but not extreme; leverage hasn’t reached a dangerous zone yet.
For this kind of breakout with expanding volume, the key is whether it can hold the 0.095 level next.
$MARSCOIN #放量突破 #38%
Click the small card below to quickly check the行情👇
Behind the 38% surge, the trading volume has already climbed to 133 million USD.
MARSCOIN has risen from a low of 0.052 to the current 0.104; the hourly chart has been closing in bullish candles consecutively, and the buy-side demand has never stopped.
The long-to-short ratio is 48% to 52%, with neither side having an absolute advantage—indicating this isn’t a one-sided squeeze, but real capital is entering the market.
The funding rate is 0.047%, slightly positive but not extreme; leverage hasn’t reached a dangerous zone yet.
For this kind of breakout with expanding volume, the key is whether it can hold the 0.095 level next.
$MARSCOIN #放量突破 #38%
Click the small card below to quickly check the行情👇
MARSCOIN has risen from a low of 0.052 to the current 0.104; the hourly chart has been closing in bullish candles consecutively, and the buy-side demand has never stopped.
The long-to-short ratio is 48% to 52%, with neither side having an absolute advantage—indicating this isn’t a one-sided squeeze, but real capital is entering the market.
The funding rate is 0.047%, slightly positive but not extreme; leverage hasn’t reached a dangerous zone yet.
For this kind of breakout with expanding volume, the key is whether it can hold the 0.095 level next.
$MARSCOIN #放量突破 #38%
Click the small card below to quickly check the行情👇
226
·
--
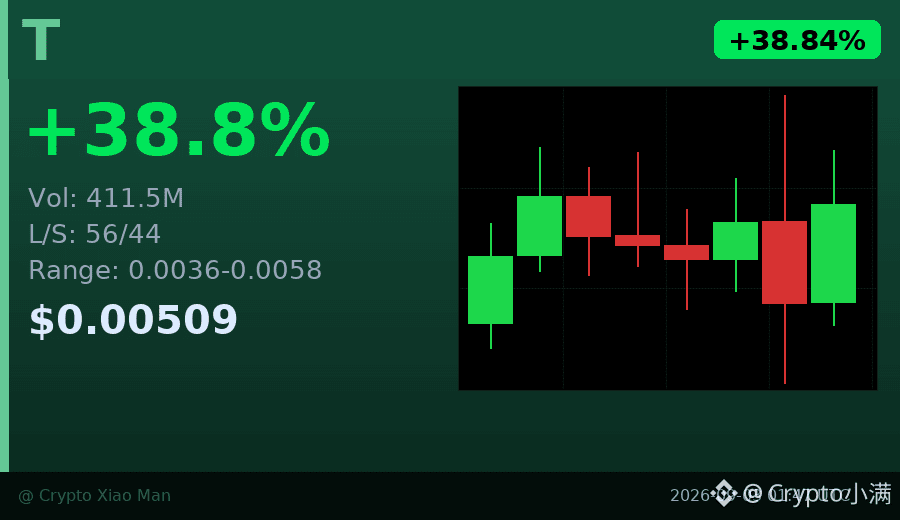
Behind the 38% surge, the funding rate is still -0.57%? That divergence is kind of interesting.
Today, trading volume for $T hit 410 million USD, with the price climbing from 0.0036 to 0.0058 before falling back to around 0.0051. The key point is: even after such a big rise, shorts are still paying longs.
So what does it mean? A lot of people don’t believe this rally. They think it’s a bull trap, so they keep opening shorts. But the more it rises, the more they lose—so the funding rate keeps becoming more negative. If it continues higher, these short positions will be forced to close, which actually pushes the price up.
However, the K-line shows short-term choppy consolidation—don’t rush to chase it. Wait until the direction becomes clear.
$T #资金费率背离 #38%
Click the small card below to quickly check the market 👇
Behind the 38% surge, the funding rate is still -0.57%? That divergence is kind of interesting.
Today, trading volume for $T hit 410 million USD, with the price climbing from 0.0036 to 0.0058 before falling back to around 0.0051. The key point is: even after such a big rise, shorts are still paying longs.
So what does it mean? A lot of people don’t believe this rally. They think it’s a bull trap, so they keep opening shorts. But the more it rises, the more they lose—so the funding rate keeps becoming more negative. If it continues higher, these short positions will be forced to close, which actually pushes the price up.
However, the K-line shows short-term choppy consolidation—don’t rush to chase it. Wait until the direction becomes clear.
$T #资金费率背离 #38%
Click the small card below to quickly check the market 👇
Today, trading volume for $T hit 410 million USD, with the price climbing from 0.0036 to 0.0058 before falling back to around 0.0051. The key point is: even after such a big rise, shorts are still paying longs.
So what does it mean? A lot of people don’t believe this rally. They think it’s a bull trap, so they keep opening shorts. But the more it rises, the more they lose—so the funding rate keeps becoming more negative. If it continues higher, these short positions will be forced to close, which actually pushes the price up.
However, the K-line shows short-term choppy consolidation—don’t rush to chase it. Wait until the direction becomes clear.
$T #资金费率背离 #38%
Click the small card below to quickly check the market 👇
1
42
Log in to explore more content
Join global crypto users on Binance Square
⚡️ Get latest and useful information about crypto.
💬 Trusted by the world’s largest crypto exchange.
👍 Discover real insights from verified creators.
Email / Phone number
Trending Topics
1
#HKCompletesFirstHKDStablecoinUseCase
4,594 views
230 Discussing
2
#VietnamPlansFirstCryptoLicensesIn2026
3,500 views
155 Discussing
3
#BTCBreaks80K
203,675 views
3,318 Discussing
4
#BitcoinMarketCapTopsTesla
20,244 views
550 Discussing
5
#SOLJumpsAbout10%
29,459 views
638 Discussing
6
#EthereumReclaims$2600
2,511 views
78 Discussing
7
#LineraShutsDownAfterFundraisingFallsShort
7,280 views
158 Discussing
8
#SECReceivesAmendedInjectiveETFFiling
18,800 views
423 Discussing
9
#SanDiskToJoinSP100OnSep21
14,137 views
269 Discussing
10
#PolygonToDeployContractBurning100MPOL
8,521 views
210 Discussing