

#30
30
74,035 views
181 Discussing
Hot
Latest

·
--
🚨 $CXT HITS $3.7T MARKET CAP, SECURES #30 GLOBAL RANKING! 💥
📊 A $3.7T valuation isn't just a number — it's the fingerprint of where global institutional capital is parking right now. Rising to 30th in the worldwide asset ranking puts Changxin Technology above dozens of long-established household names. 💡 That kind of structural repricing typically precedes a liquidity shift into adjacent markets.
🔍 For crypto traders, the takeaway is simpler: when public equity balloons, the search for alternative exposure tends to accelerate. 🌊 Watch for capital rotation into high-liquidity digital assets as this cycle matures. 💬 Do you think the $3.7T valuation is justified, or are we watching a classic liquidity bubble inflate? 👇
⚠️ Not financial advice. Always manage your risk. 🛡️
🏷️ #CXT #MarketCap #GlobalAssets #InstitutionalFlow #Crypto
🌊 💡
🚨 $CXT HITS $3.7T MARKET CAP, SECURES #30 GLOBAL RANKING! 💥
📊 A $3.7T valuation isn't just a number — it's the fingerprint of where global institutional capital is parking right now. Rising to 30th in the worldwide asset ranking puts Changxin Technology above dozens of long-established household names. 💡 That kind of structural repricing typically precedes a liquidity shift into adjacent markets.
🔍 For crypto traders, the takeaway is simpler: when public equity balloons, the search for alternative exposure tends to accelerate. 🌊 Watch for capital rotation into high-liquidity digital assets as this cycle matures. 💬 Do you think the $3.7T valuation is justified, or are we watching a classic liquidity bubble inflate? 👇
⚠️ Not financial advice. Always manage your risk. 🛡️
🏷️ #CXT #MarketCap #GlobalAssets #InstitutionalFlow #Crypto
🌊 💡
📊 A $3.7T valuation isn't just a number — it's the fingerprint of where global institutional capital is parking right now. Rising to 30th in the worldwide asset ranking puts Changxin Technology above dozens of long-established household names. 💡 That kind of structural repricing typically precedes a liquidity shift into adjacent markets.
🔍 For crypto traders, the takeaway is simpler: when public equity balloons, the search for alternative exposure tends to accelerate. 🌊 Watch for capital rotation into high-liquidity digital assets as this cycle matures. 💬 Do you think the $3.7T valuation is justified, or are we watching a classic liquidity bubble inflate? 👇
⚠️ Not financial advice. Always manage your risk. 🛡️
🏷️ #CXT #MarketCap #GlobalAssets #InstitutionalFlow #Crypto
🌊 💡
22


·
--
I just scanned CoinGecko’s latest trending board and my eyes lit up 🚀. The mix of low‑cap gems and established projects gave me a quick pulse on where the market is heading.
1. Hyperliquid (HYPE) +9% – #11, strong DeFi demand.
2. NEAR Protocol (NEAR) +6% – climbing toward top‑20.
3. Sui (SUI) +5% – solid momentum at #30.
4. Pudgy Penguins (PENGU) -3% – mild dip at #117.
5. Pearl (PEARL) +4% – catching eyes in NFT.
6. Dacity Coin (DACITY) +2% – quietly rising.
7. evmzone (EVMZONE) -1% – small correction.
I'm keeping a close eye on Hyperliquid and NEAR, and I might add Pearl to my short‑term list 😊.
$T, $STG, $APR
I just scanned CoinGecko’s latest trending board and my eyes lit up 🚀. The mix of low‑cap gems and established projects gave me a quick pulse on where the market is heading.
1. Hyperliquid (HYPE) +9% – #11, strong DeFi demand.
2. NEAR Protocol (NEAR) +6% – climbing toward top‑20.
3. Sui (SUI) +5% – solid momentum at #30.
4. Pudgy Penguins (PENGU) -3% – mild dip at #117.
5. Pearl (PEARL) +4% – catching eyes in NFT.
6. Dacity Coin (DACITY) +2% – quietly rising.
7. evmzone (EVMZONE) -1% – small correction.
I'm keeping a close eye on Hyperliquid and NEAR, and I might add Pearl to my short‑term list 😊.
$T , $STG, $APR
1. Hyperliquid (HYPE) +9% – #11, strong DeFi demand.
2. NEAR Protocol (NEAR) +6% – climbing toward top‑20.
3. Sui (SUI) +5% – solid momentum at #30.
4. Pudgy Penguins (PENGU) -3% – mild dip at #117.
5. Pearl (PEARL) +4% – catching eyes in NFT.
6. Dacity Coin (DACITY) +2% – quietly rising.
7. evmzone (EVMZONE) -1% – small correction.
I'm keeping a close eye on Hyperliquid and NEAR, and I might add Pearl to my short‑term list 😊.
$T , $STG, $APR
549

·
--
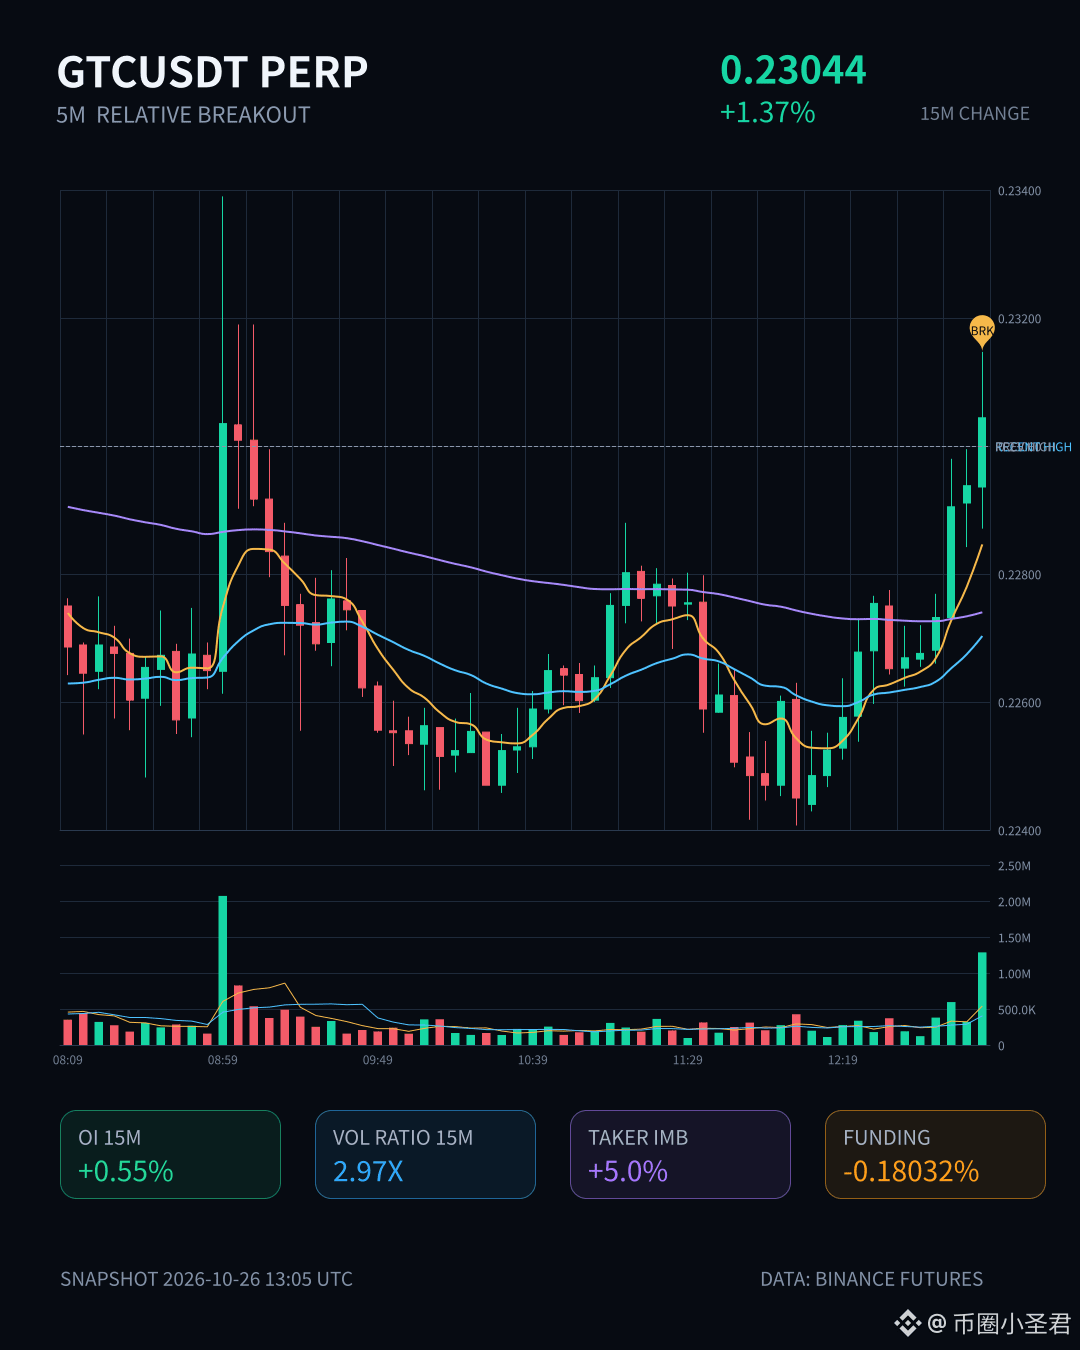
$GTC This 15m move has something to it—the volume surged to 2.97x normal, price climbed 1.37%, and the close pushed above the range high of the last 20 5m candles. Key OI is rising in tandem too: +0.55% over 15m and +0.26% over 1h, with notional changes around 100K U. Its anomaly percentile is 83.3%, ranking #30 across the whole pool. This price-up + OI-up combination looks more like new leveraged longs entering than shorts covering. The aggressive trade imbalance is 5%, and the buy/sell ratio is 1.11, so short-term buying is in the lead. However, 24h trading volume is only 28M, so the pool isn't very deep; if you follow, watch out for slippage and false breakouts. First, let's see if price can hold above this 5m range high.
$GTC This 15m move has something to it—the volume surged to 2.97x normal, price climbed 1.37%, and the close pushed above the range high of the last 20 5m candles. Key OI is rising in tandem too: +0.55% over 15m and +0.26% over 1h, with notional changes around 100K U. Its anomaly percentile is 83.3%, ranking #30 across the whole pool. This price-up + OI-up combination looks more like new leveraged longs entering than shorts covering. The aggressive trade imbalance is 5%, and the buy/sell ratio is 1.11, so short-term buying is in the lead. However, 24h trading volume is only 28M, so the pool isn't very deep; if you follow, watch out for slippage and false breakouts. First, let's see if price can hold above this 5m range high.
3

·
--
$PHA is down 1.48% over this 15m period—not a particularly sharp drop. But the structure shows price and OI both falling, suggesting longs are deleveraging and exiting via stop-losses, rather than new shorts driving the sell-off. Volume is up 2.41x, and the buy/sell ratio is 0.54, indicating clear aggressive selling pressure. Price has already broken below the lower end of the range from the last 20 5m candles. Its notional change ranks #30 across the entire pool, with an anomaly percentile of 82.7%, putting it among the more notable movers. For now, watch whether OI continues to contract. Only consider stabilization if the decline slows on lower volume; don't rush to buy if the drop continues on rising volume.
$PHA is down 1.48% over this 15m period—not a particularly sharp drop. But the structure shows price and OI both falling, suggesting longs are deleveraging and exiting via stop-losses, rather than new shorts driving the sell-off. Volume is up 2.41x, and the buy/sell ratio is 0.54, indicating clear aggressive selling pressure. Price has already broken below the lower end of the range from the last 20 5m candles. Its notional change ranks #30 across the entire pool, with an anomaly percentile of 82.7%, putting it among the more notable movers. For now, watch whether OI continues to contract. Only consider stabilization if the decline slows on lower volume; don't rush to buy if the drop continues on rising volume.
57

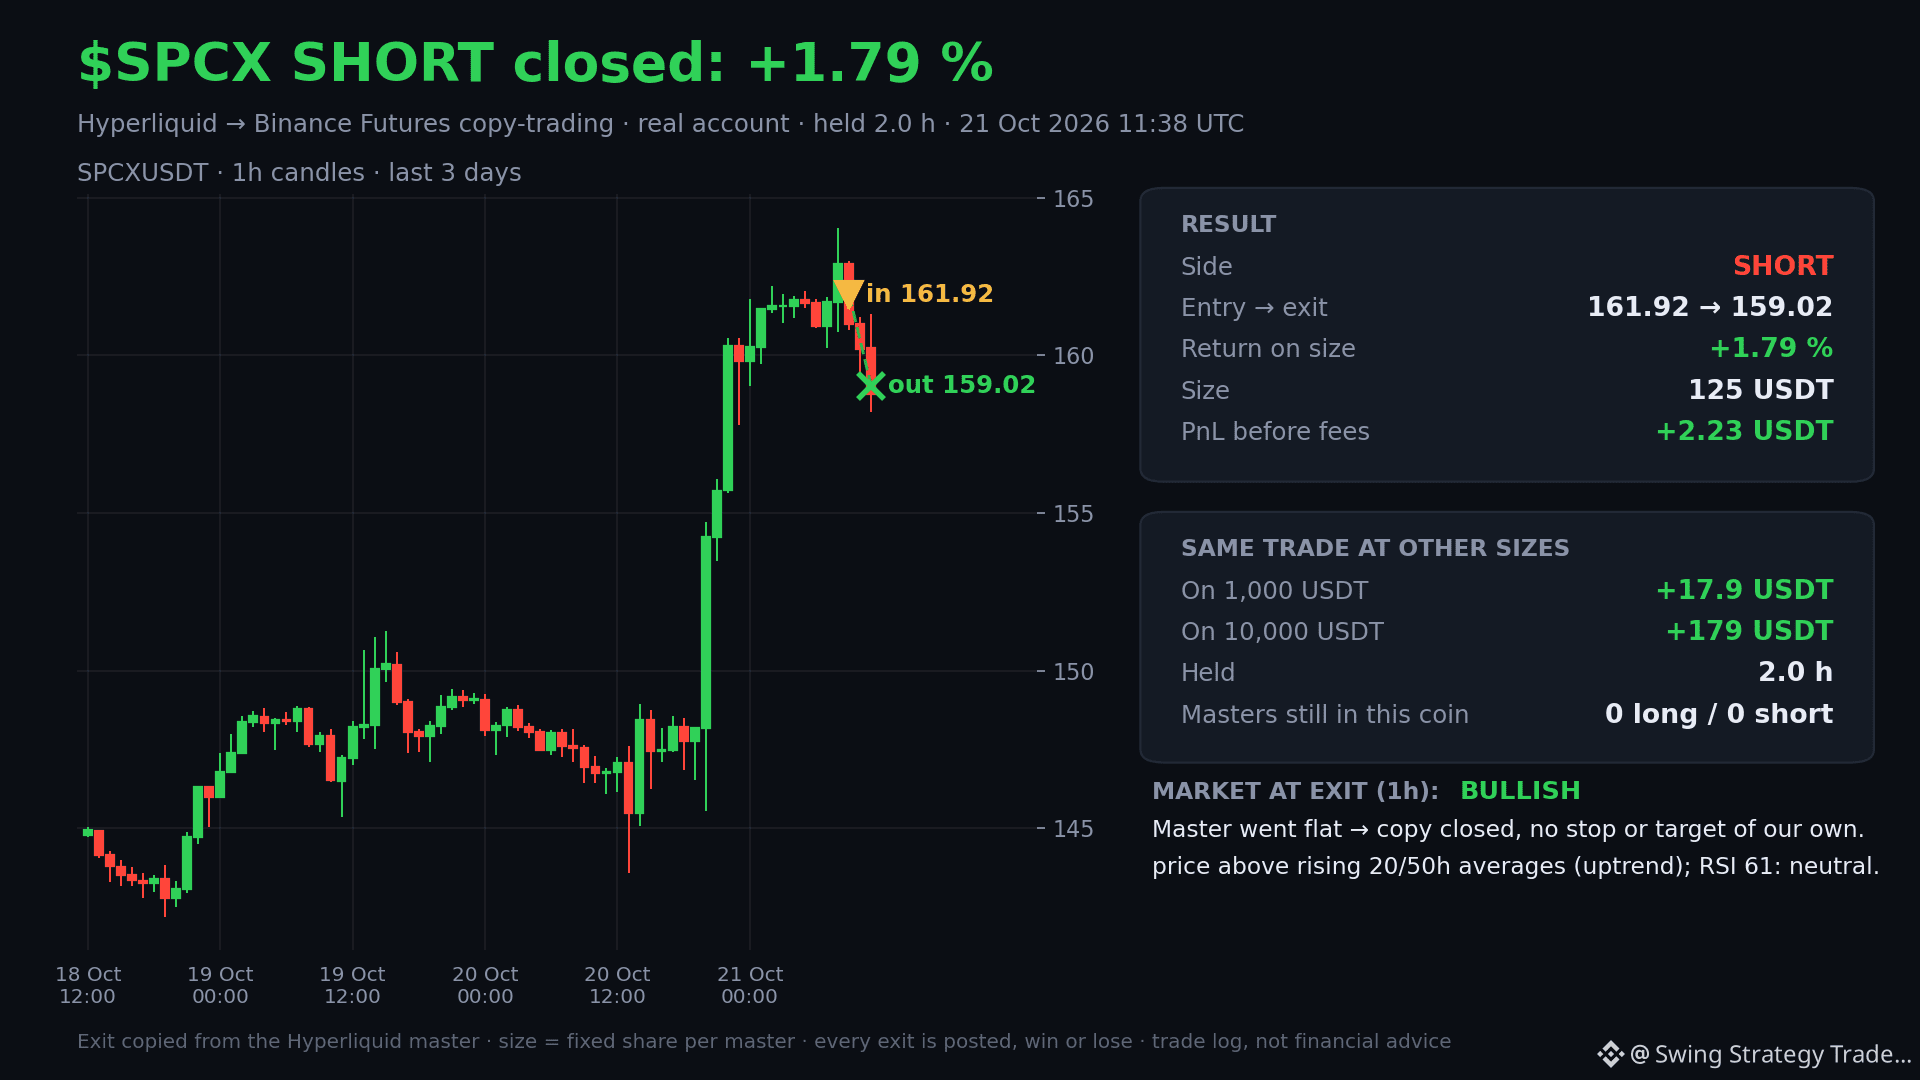
✅ Closed: SHORT $SPCX +1.79 % in 2.0 h (entry 161.92 → exit 159.02) · +2.23 USDT on 125
Numbers, not adjectives: +2.23 USDT before fees, about 0.12 USDT of taker fees for the round trip, 2.0 hours held. Master #30 went flat on Hyperliquid; our exit is his exit, mirrored.
Market at the exit: bullish — price above rising 20/50h averages (uptrend); RSI 61: neutral.
Where to verify: the daily account update shows the wallet, unrealized and fees straight from the exchange. This trade is in there.
Every exit is posted, win or lose.
#copytrading #hyperliquid #binancefutures $SPCX
Same trades, same rules, in a Binance group for people who copy by API or trade them by hand: https://app.binance.com/uni-qr/DpuA7yYD
✅ Closed: SHORT $SPCX +1.79 % in 2.0 h (entry 161.92 → exit 159.02) · +2.23 USDT on 125
Numbers, not adjectives: +2.23 USDT before fees, about 0.12 USDT of taker fees for the round trip, 2.0 hours held. Master #30 went flat on Hyperliquid; our exit is his exit, mirrored.
Market at the exit: bullish — price above rising 20/50h averages (uptrend); RSI 61: neutral.
Where to verify: the daily account update shows the wallet, unrealized and fees straight from the exchange. This trade is in there.
Every exit is posted, win or lose.
#copytrading #hyperliquid #binancefutures $SPCX
Same trades, same rules, in a Binance group for people who copy by API or trade them by hand: https://app.binance.com/uni-qr/DpuA7yYD
Numbers, not adjectives: +2.23 USDT before fees, about 0.12 USDT of taker fees for the round trip, 2.0 hours held. Master #30 went flat on Hyperliquid; our exit is his exit, mirrored.
Market at the exit: bullish — price above rising 20/50h averages (uptrend); RSI 61: neutral.
Where to verify: the daily account update shows the wallet, unrealized and fees straight from the exchange. This trade is in there.
Every exit is posted, win or lose.
#copytrading #hyperliquid #binancefutures $SPCX
Same trades, same rules, in a Binance group for people who copy by API or trade them by hand: https://app.binance.com/uni-qr/DpuA7yYD
120
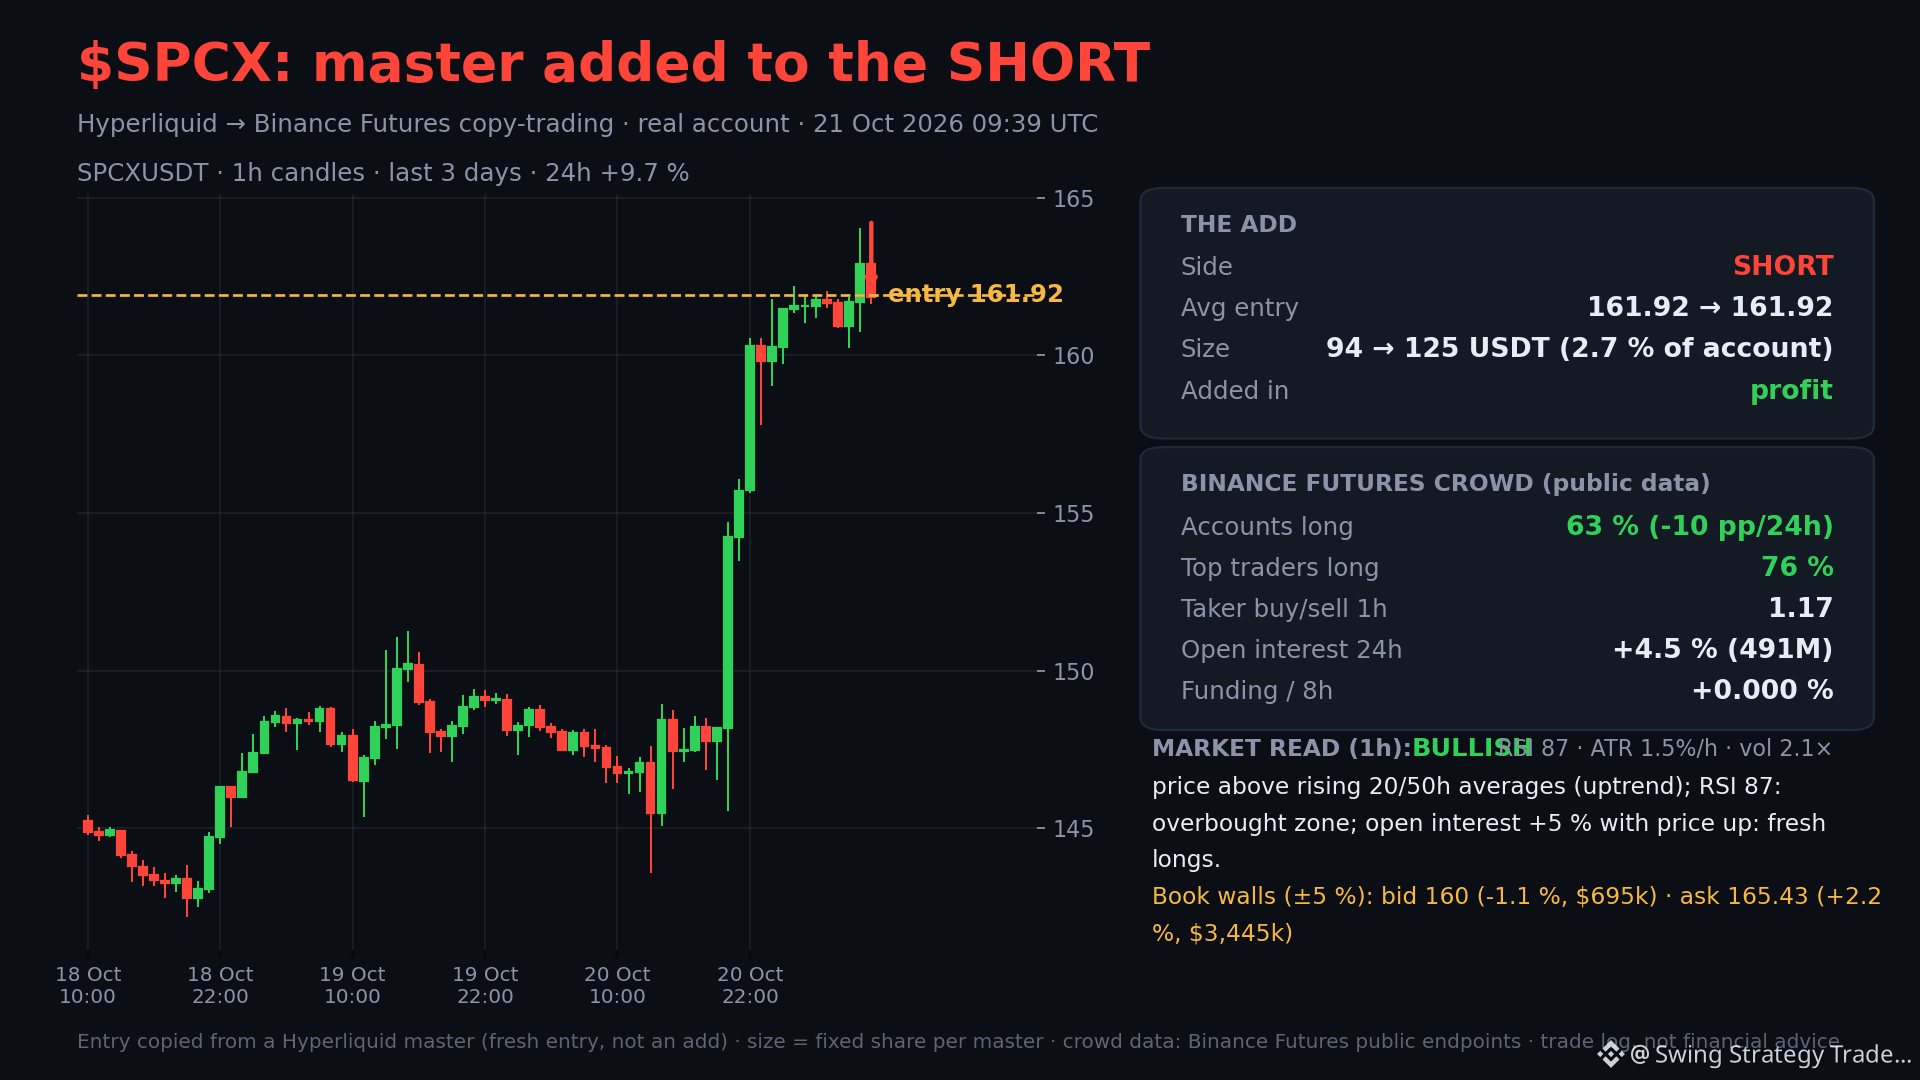
🔴 Master #30 added to the SHORT $SPCX: 94 → 125 USDT on our side (2.7 % of the account), average entry 161.92 → 161.92.
The add came in profit. Our rule: adds are copied only inside legs we already hold; we never join a master's existing losing position from outside.
Same trades, same rules, in a Binance group for people who copy by API or trade them by hand: https://app.binance.com/uni-qr/DpuA7yYD
🔴 Master #30 added to the SHORT $SPCX : 94 → 125 USDT on our side (2.7 % of the account), average entry 161.92 → 161.92.
The add came in profit. Our rule: adds are copied only inside legs we already hold; we never join a master's existing losing position from outside.
Same trades, same rules, in a Binance group for people who copy by API or trade them by hand: https://app.binance.com/uni-qr/DpuA7yYD
The add came in profit. Our rule: adds are copied only inside legs we already hold; we never join a master's existing losing position from outside.
Same trades, same rules, in a Binance group for people who copy by API or trade them by hand: https://app.binance.com/uni-qr/DpuA7yYD
1

·
--
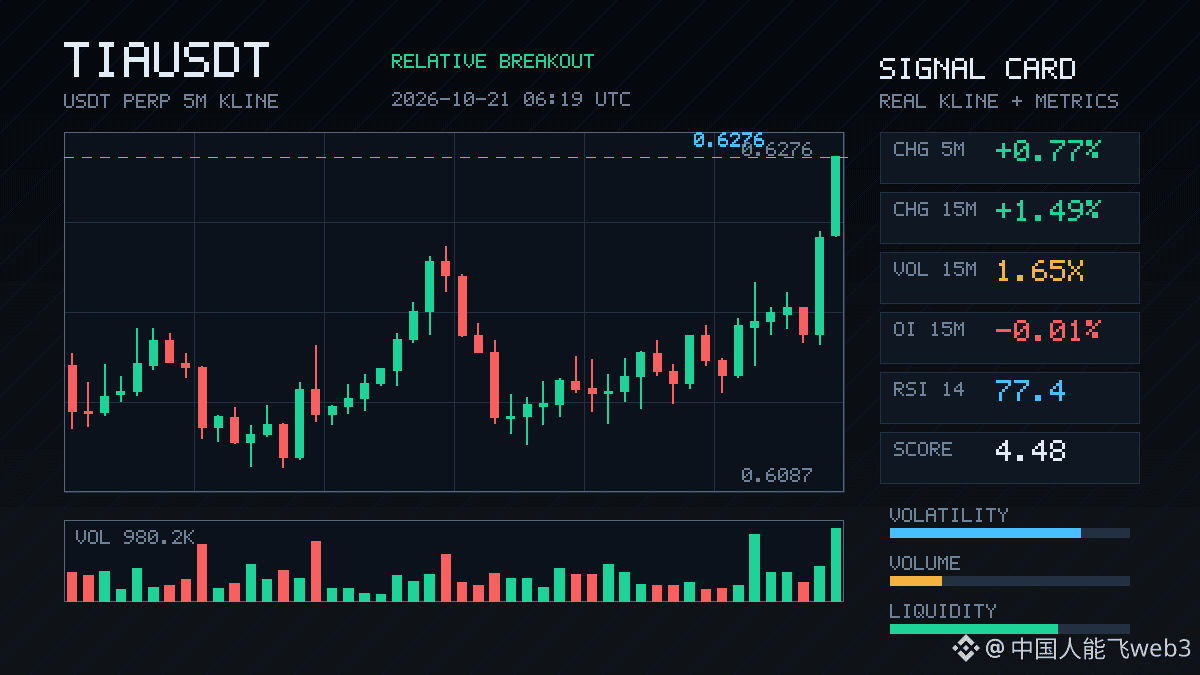
TIA’s move is looking interesting: it’s up 1.49% on the 15m, with volume surging to 1.65x, and the close is still above the highs of nearly 20 recent 5m candles.
But looking closely at OI: 15m futures OI is actually down 0.01%, while 1h OI is up just 0.77%. The change in notional value isn’t that significant either. Price is moving up, but open interest isn’t following—this looks more like short covering or existing positions driving the move than a big influx of new longs.
The aggressive trade imbalance is 4.5%, and the buy/sell ratio is 1.09, so buyers do have the edge. It ranks #30 for anomalies across the entire pool and #22 for notional change, which suggests this isn’t just a small move in TIA—it’s relatively noticeable within the pool.
My take: the short-term breakout is real, but OI isn’t confirming it. If you’re chasing, stay cautious and watch whether price can hold this upper end of the range on a pullback.
TIA’s move is looking interesting: it’s up 1.49% on the 15m, with volume surging to 1.65x, and the close is still above the highs of nearly 20 recent 5m candles.
But looking closely at OI: 15m futures OI is actually down 0.01%, while 1h OI is up just 0.77%. The change in notional value isn’t that significant either. Price is moving up, but open interest isn’t following—this looks more like short covering or existing positions driving the move than a big influx of new longs.
The aggressive trade imbalance is 4.5%, and the buy/sell ratio is 1.09, so buyers do have the edge. It ranks #30 for anomalies across the entire pool and #22 for notional change, which suggests this isn’t just a small move in TIA—it’s relatively noticeable within the pool.
My take: the short-term breakout is real, but OI isn’t confirming it. If you’re chasing, stay cautious and watch whether price can hold this upper end of the range on a pullback.
But looking closely at OI: 15m futures OI is actually down 0.01%, while 1h OI is up just 0.77%. The change in notional value isn’t that significant either. Price is moving up, but open interest isn’t following—this looks more like short covering or existing positions driving the move than a big influx of new longs.
The aggressive trade imbalance is 4.5%, and the buy/sell ratio is 1.09, so buyers do have the edge. It ranks #30 for anomalies across the entire pool and #22 for notional change, which suggests this isn’t just a small move in TIA—it’s relatively noticeable within the pool.
My take: the short-term breakout is real, but OI isn’t confirming it. If you’re chasing, stay cautious and watch whether price can hold this upper end of the range on a pullback.
4
·
--
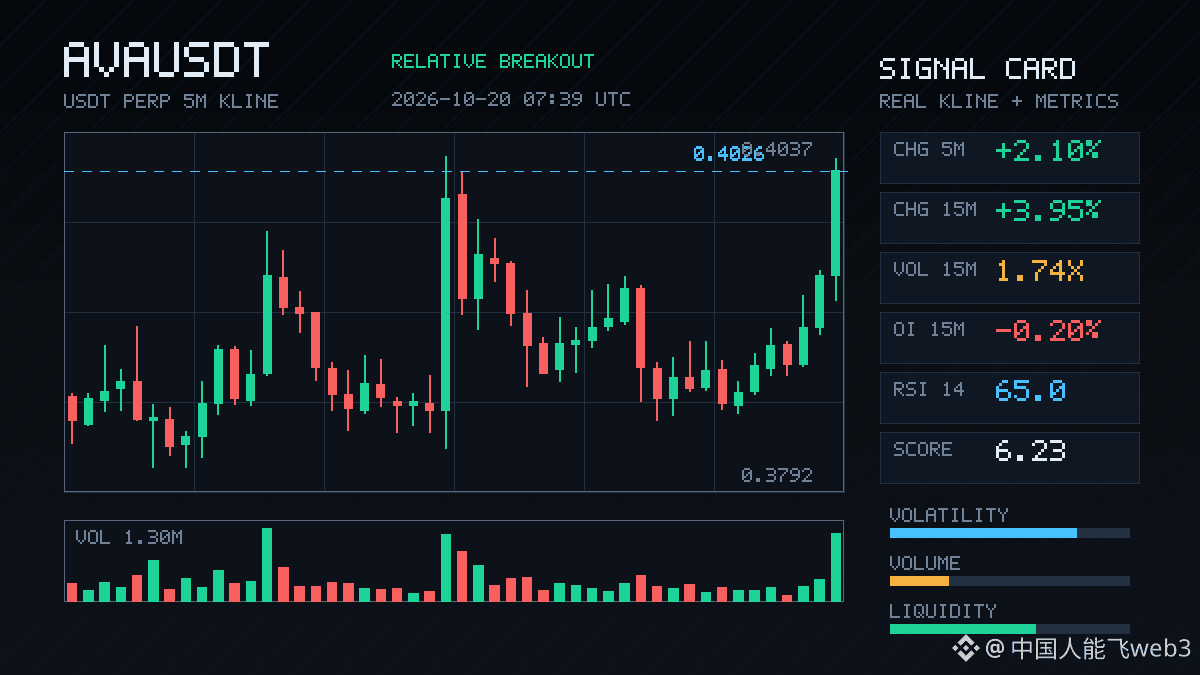
$AVA made a pretty decisive move over the past 15 minutes, up 3.95%, with volume picking up too. At 1.74x, it’s not a huge volume spike, but it’s enough to confirm the move. What’s interesting is that OI is falling—down 0.20% over 15m and 0.85% over 1h. Price is rising while positions are shrinking, a classic short-covering move, not a push from new longs entering.
The closing price broke above the top of the recent 20-candle 5m range. The taker buy-sell imbalance was 26.1%, and the buy-sell ratio was 1.71, so buyers really are driving the move. But the OI anomaly percentile is 89.5%, ranking #19 across the pool, which means this move is among the more notable ones in the pool. The notional change ranks only #30, though, so the overall size isn’t that large.
A breakout driven by short covering—whether to chase it is up to you. I’d rather wait for OI to turn positive; otherwise, this could just be a short squeeze that fizzles out.
$AVA made a pretty decisive move over the past 15 minutes, up 3.95%, with volume picking up too. At 1.74x, it’s not a huge volume spike, but it’s enough to confirm the move. What’s interesting is that OI is falling—down 0.20% over 15m and 0.85% over 1h. Price is rising while positions are shrinking, a classic short-covering move, not a push from new longs entering.
The closing price broke above the top of the recent 20-candle 5m range. The taker buy-sell imbalance was 26.1%, and the buy-sell ratio was 1.71, so buyers really are driving the move. But the OI anomaly percentile is 89.5%, ranking #19 across the pool, which means this move is among the more notable ones in the pool. The notional change ranks only #30, though, so the overall size isn’t that large.
A breakout driven by short covering—whether to chase it is up to you. I’d rather wait for OI to turn positive; otherwise, this could just be a short squeeze that fizzles out.
The closing price broke above the top of the recent 20-candle 5m range. The taker buy-sell imbalance was 26.1%, and the buy-sell ratio was 1.71, so buyers really are driving the move. But the OI anomaly percentile is 89.5%, ranking #19 across the pool, which means this move is among the more notable ones in the pool. The notional change ranks only #30, though, so the overall size isn’t that large.
A breakout driven by short covering—whether to chase it is up to you. I’d rather wait for OI to turn positive; otherwise, this could just be a short squeeze that fizzles out.
3
·
--
$A fell 1.37% over this 15-minute stretch, with volume rising to 2.63x. Price broke below the lower end of the last 20 five-minute candles, and aggressive sell orders are dominating. The market looks like longs are being liquidated.
OI is down 0.91% over 15 minutes, with notional down 135K (-2.45%), but 1-hour OI is still up 0.59%. Price down + OI down looks more like long deleveraging and stop-losses than fresh short entries.
Volatility Z: 1.60; abnormality percentile: 88.9%; #15 across the whole pool; notional change: #30; 24-hour volume: 37.99M. There’s plenty of activity, but don’t rush to buy the dip—first see whether this wave of deleveraging has run its course.
$A fell 1.37% over this 15-minute stretch, with volume rising to 2.63x. Price broke below the lower end of the last 20 five-minute candles, and aggressive sell orders are dominating. The market looks like longs are being liquidated.
OI is down 0.91% over 15 minutes, with notional down 135K (-2.45%), but 1-hour OI is still up 0.59%. Price down + OI down looks more like long deleveraging and stop-losses than fresh short entries.
Volatility Z: 1.60; abnormality percentile: 88.9%; #15 across the whole pool; notional change: #30; 24-hour volume: 37.99M. There’s plenty of activity, but don’t rush to buy the dip—first see whether this wave of deleveraging has run its course.
OI is down 0.91% over 15 minutes, with notional down 135K (-2.45%), but 1-hour OI is still up 0.59%. Price down + OI down looks more like long deleveraging and stop-losses than fresh short entries.
Volatility Z: 1.60; abnormality percentile: 88.9%; #15 across the whole pool; notional change: #30; 24-hour volume: 37.99M. There’s plenty of activity, but don’t rush to buy the dip—first see whether this wave of deleveraging has run its course.
60

·
--
$NEAR This dip is interesting.
A 1.42% drop over 15m isn’t much, but price broke below the lower end of the past 20 5m ranges. The aggressive trade imbalance was -14.4%, and the buy/sell ratio was 0.75, so the selling pressure is real. Volume was 1.58x, with volatility Z at 2.97, which suggests this wasn’t just a random wick.
The key is how OI reacted. 15m futures OI fell 0.20%, or 1.83M in notional terms; 1h notional OI fell 2.96M, or 1.13%. Price down + OI down is a classic case of longs deleveraging—stops being triggered and positions being cut, rather than fresh shorts piling in to drive the price down.
Funding rates are still in a high percentile relative to recent levels, which suggests longs had been pretty crowded. At this point, it looks more like forced position reduction than active shorting. It ranks #30 for anomalies across the entire pool and #4 for notional change, making NEAR one of the more conspicuous assets in the pool tonight.
The key is whether price can reclaim the range low after breaking below it. If this is just a deleveraging-driven pullback, once OI has contracted and funding rates have cooled, it could actually leave room for a subsequent move. But if aggressive trading continues to skew toward selling, that lower boundary will turn into resistance.
For now, watch how far OI contracts before it bottoms.
$NEAR This dip is interesting.
A 1.42% drop over 15m isn’t much, but price broke below the lower end of the past 20 5m ranges. The aggressive trade imbalance was -14.4%, and the buy/sell ratio was 0.75, so the selling pressure is real. Volume was 1.58x, with volatility Z at 2.97, which suggests this wasn’t just a random wick.
The key is how OI reacted. 15m futures OI fell 0.20%, or 1.83M in notional terms; 1h notional OI fell 2.96M, or 1.13%. Price down + OI down is a classic case of longs deleveraging—stops being triggered and positions being cut, rather than fresh shorts piling in to drive the price down.
Funding rates are still in a high percentile relative to recent levels, which suggests longs had been pretty crowded. At this point, it looks more like forced position reduction than active shorting. It ranks #30 for anomalies across the entire pool and #4 for notional change, making NEAR one of the more conspicuous assets in the pool tonight.
The key is whether price can reclaim the range low after breaking below it. If this is just a deleveraging-driven pullback, once OI has contracted and funding rates have cooled, it could actually leave room for a subsequent move. But if aggressive trading continues to skew toward selling, that lower boundary will turn into resistance.
For now, watch how far OI contracts before it bottoms.
A 1.42% drop over 15m isn’t much, but price broke below the lower end of the past 20 5m ranges. The aggressive trade imbalance was -14.4%, and the buy/sell ratio was 0.75, so the selling pressure is real. Volume was 1.58x, with volatility Z at 2.97, which suggests this wasn’t just a random wick.
The key is how OI reacted. 15m futures OI fell 0.20%, or 1.83M in notional terms; 1h notional OI fell 2.96M, or 1.13%. Price down + OI down is a classic case of longs deleveraging—stops being triggered and positions being cut, rather than fresh shorts piling in to drive the price down.
Funding rates are still in a high percentile relative to recent levels, which suggests longs had been pretty crowded. At this point, it looks more like forced position reduction than active shorting. It ranks #30 for anomalies across the entire pool and #4 for notional change, making NEAR one of the more conspicuous assets in the pool tonight.
The key is whether price can reclaim the range low after breaking below it. If this is just a deleveraging-driven pullback, once OI has contracted and funding rates have cooled, it could actually leave room for a subsequent move. But if aggressive trading continues to skew toward selling, that lower boundary will turn into resistance.
For now, watch how far OI contracts before it bottoms.
73
·
--
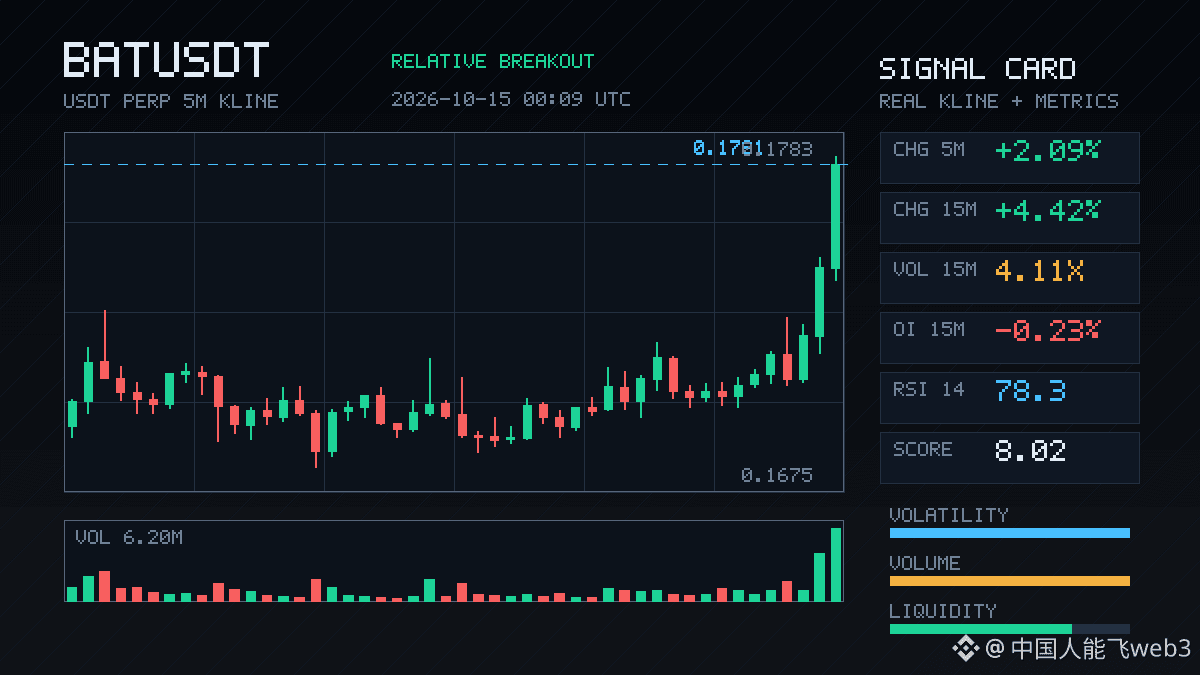
$BAT 15m surged suddenly, up 4.42%, but OI is falling, already down 1.94% over 1h. Price is rising while open interest is declining—a classic short squeeze, not new longs entering.
Trading volume is 4.11 times normal, with a clear skew toward aggressive buying; the buy/sell ratio is 1.44, and the close broke straight above the upper bound of the last 20 5m candles. This move looks more driven by short covering than by genuine new positions being added.
24h trading volume is nearing 185 million, and its nominal change among the pools ranks #30. The rally is quite sharp, but without OI confirmation, be cautious about chasing it—you don't want to get caught by a sudden reversal.
$BAT 15m surged suddenly, up 4.42%, but OI is falling, already down 1.94% over 1h. Price is rising while open interest is declining—a classic short squeeze, not new longs entering.
Trading volume is 4.11 times normal, with a clear skew toward aggressive buying; the buy/sell ratio is 1.44, and the close broke straight above the upper bound of the last 20 5m candles. This move looks more driven by short covering than by genuine new positions being added.
24h trading volume is nearing 185 million, and its nominal change among the pools ranks #30. The rally is quite sharp, but without OI confirmation, be cautious about chasing it—you don't want to get caught by a sudden reversal.
Trading volume is 4.11 times normal, with a clear skew toward aggressive buying; the buy/sell ratio is 1.44, and the close broke straight above the upper bound of the last 20 5m candles. This move looks more driven by short covering than by genuine new positions being added.
24h trading volume is nearing 185 million, and its nominal change among the pools ranks #30. The rally is quite sharp, but without OI confirmation, be cautious about chasing it—you don't want to get caught by a sudden reversal.
87
·
--
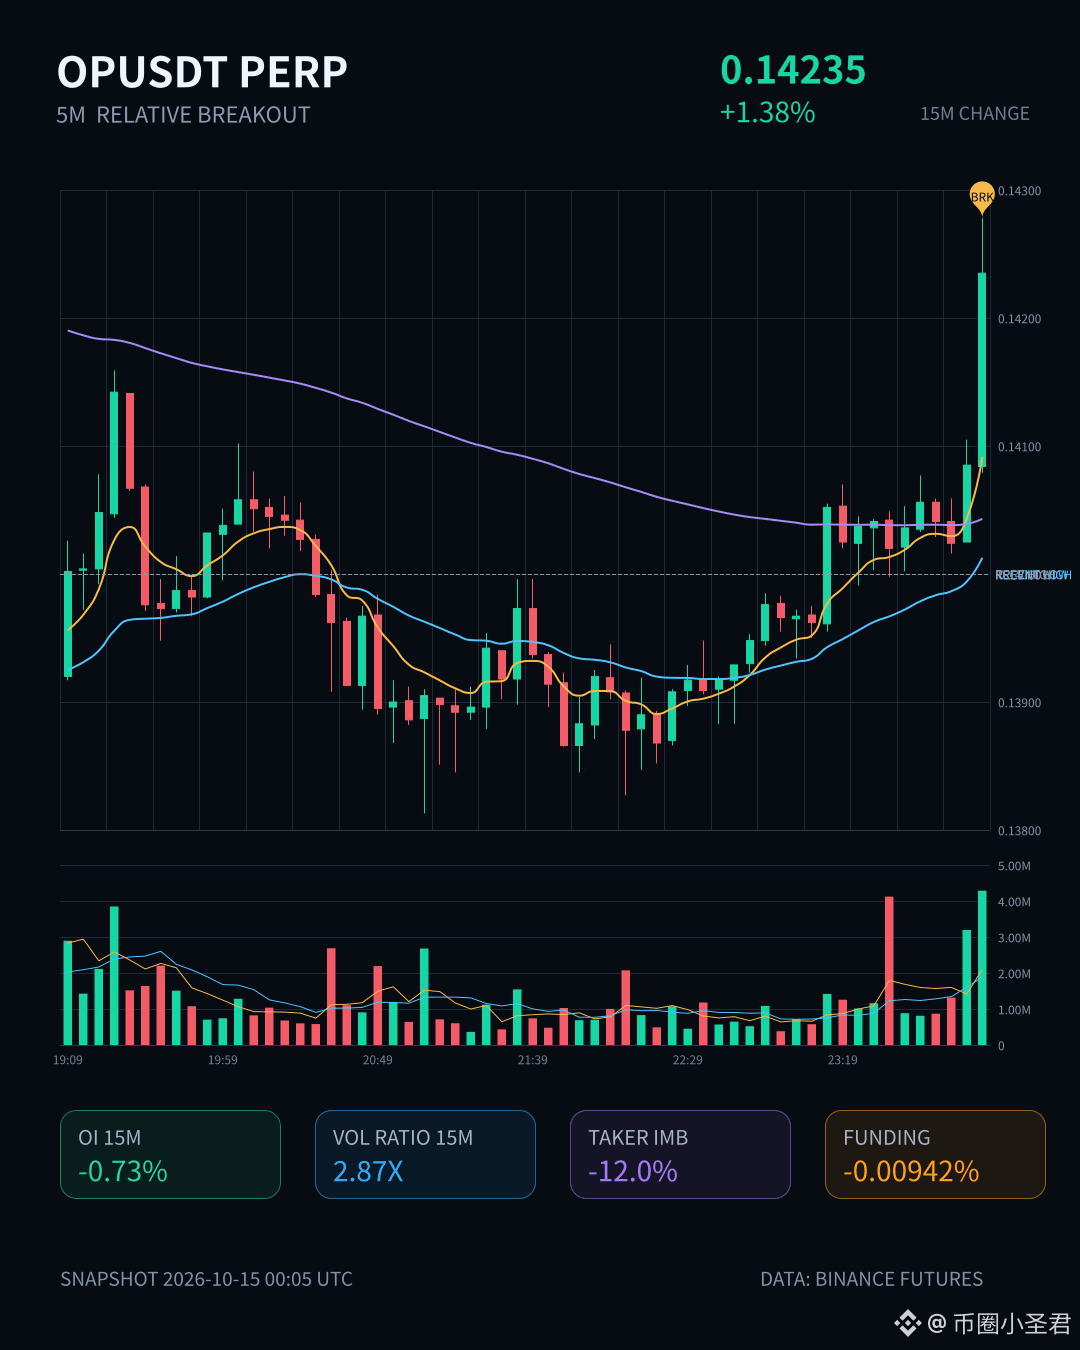
This OP rally looks a little flimsy.
It’s up 1.38% over 15m, with volume hitting 2.87x and a Z-score of 3.49. Price has also clearly broken above the highs of nearly 20 recent 5m candles, so it looks convincing at first glance. But OI has been falling during this period: -0.73% over 15m and -1.21% over 1h, with notional open interest down by over a hundred thousand U.
Price up, OI down—that’s a classic short squeeze, not fresh longs coming in.
More concerning, taker flow is negative at -12%, and the buy/sell ratio is 0.79, with buyers clearly not keeping up. Price has rallied, but it looks more like forced liquidations are driving it than buyers actively chasing.
I generally wouldn’t feel comfortable chasing this kind of setup. Without new positions stepping in, the breakout’s staying power is questionable. 24h trading volume is 183M, and its notional change ranks #30 in the pool. There’s interest, but interest and direction are two different things.
Watch to see whether OI can pick up. If it doesn’t, there’s a good chance price will give back this breakout.
This OP rally looks a little flimsy.
It’s up 1.38% over 15m, with volume hitting 2.87x and a Z-score of 3.49. Price has also clearly broken above the highs of nearly 20 recent 5m candles, so it looks convincing at first glance. But OI has been falling during this period: -0.73% over 15m and -1.21% over 1h, with notional open interest down by over a hundred thousand U.
Price up, OI down—that’s a classic short squeeze, not fresh longs coming in.
More concerning, taker flow is negative at -12%, and the buy/sell ratio is 0.79, with buyers clearly not keeping up. Price has rallied, but it looks more like forced liquidations are driving it than buyers actively chasing.
I generally wouldn’t feel comfortable chasing this kind of setup. Without new positions stepping in, the breakout’s staying power is questionable. 24h trading volume is 183M, and its notional change ranks #30 in the pool. There’s interest, but interest and direction are two different things.
Watch to see whether OI can pick up. If it doesn’t, there’s a good chance price will give back this breakout.
It’s up 1.38% over 15m, with volume hitting 2.87x and a Z-score of 3.49. Price has also clearly broken above the highs of nearly 20 recent 5m candles, so it looks convincing at first glance. But OI has been falling during this period: -0.73% over 15m and -1.21% over 1h, with notional open interest down by over a hundred thousand U.
Price up, OI down—that’s a classic short squeeze, not fresh longs coming in.
More concerning, taker flow is negative at -12%, and the buy/sell ratio is 0.79, with buyers clearly not keeping up. Price has rallied, but it looks more like forced liquidations are driving it than buyers actively chasing.
I generally wouldn’t feel comfortable chasing this kind of setup. Without new positions stepping in, the breakout’s staying power is questionable. 24h trading volume is 183M, and its notional change ranks #30 in the pool. There’s interest, but interest and direction are two different things.
Watch to see whether OI can pick up. If it doesn’t, there’s a good chance price will give back this breakout.
84
·
--
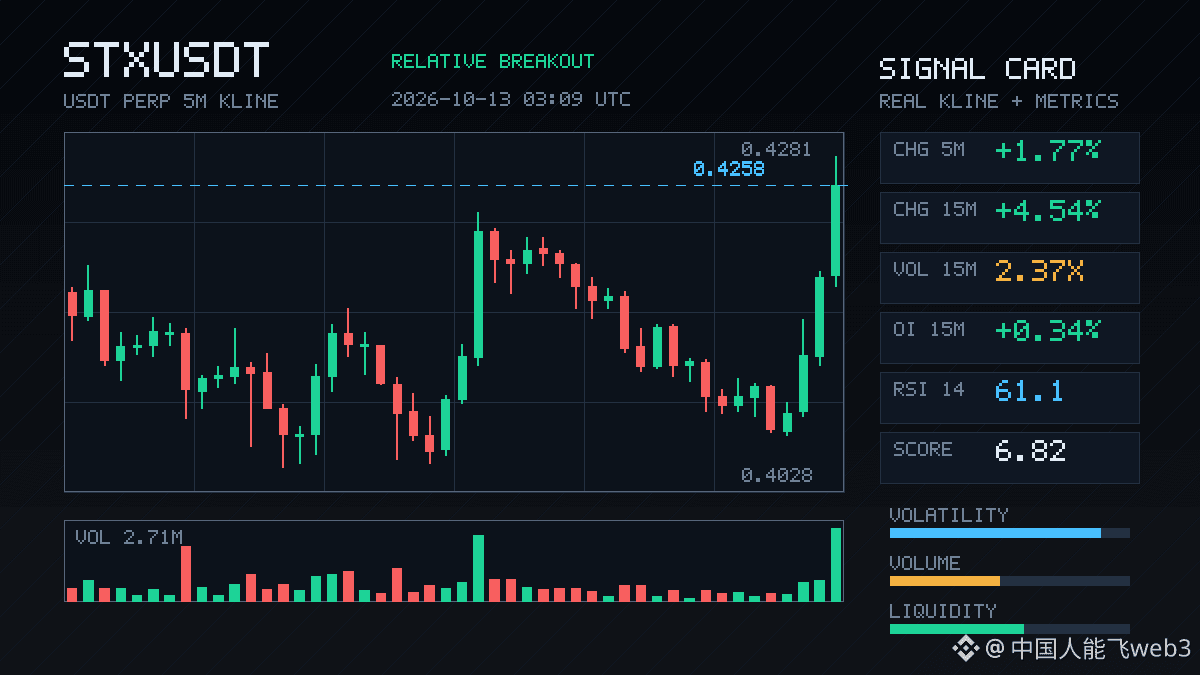
$STX This move is getting interesting.
It jumped 4.54% in 15 minutes, with volume reaching 2.37 times normal and a Z-score of 3.51—not exactly a sleepy market. The key is OI: perpetuals are up 0.34% over 15 minutes and 0.44% over 1 hour, rising in sync. Price up + OI up—that’s a classic sign of leveraged longs entering, not the hollow kind of move driven by short covering.
Its OI anomaly percentile is 96.6%, ranking 6th across the entire pool, while its notional change ranks #30. This combination suggests it isn’t just one coin moving on its own—it’s among the most unusual movers in the pool.
Price has closed near the top of the last 20 five-minute candles. The taker volume imbalance is 24.9%, and the buy/sell ratio is 1.66, with buyers firmly in control. 24-hour trading volume is 46.72M, so there’s enough depth.
Now it’s all about whether price can hold above the top of this range. If it’s a false breakout, OI will pull back first; with a genuine breakout, OI usually keeps building. Keep an eye on it.
$STX This move is getting interesting.
It jumped 4.54% in 15 minutes, with volume reaching 2.37 times normal and a Z-score of 3.51—not exactly a sleepy market. The key is OI: perpetuals are up 0.34% over 15 minutes and 0.44% over 1 hour, rising in sync. Price up + OI up—that’s a classic sign of leveraged longs entering, not the hollow kind of move driven by short covering.
Its OI anomaly percentile is 96.6%, ranking 6th across the entire pool, while its notional change ranks #30. This combination suggests it isn’t just one coin moving on its own—it’s among the most unusual movers in the pool.
Price has closed near the top of the last 20 five-minute candles. The taker volume imbalance is 24.9%, and the buy/sell ratio is 1.66, with buyers firmly in control. 24-hour trading volume is 46.72M, so there’s enough depth.
Now it’s all about whether price can hold above the top of this range. If it’s a false breakout, OI will pull back first; with a genuine breakout, OI usually keeps building. Keep an eye on it.
It jumped 4.54% in 15 minutes, with volume reaching 2.37 times normal and a Z-score of 3.51—not exactly a sleepy market. The key is OI: perpetuals are up 0.34% over 15 minutes and 0.44% over 1 hour, rising in sync. Price up + OI up—that’s a classic sign of leveraged longs entering, not the hollow kind of move driven by short covering.
Its OI anomaly percentile is 96.6%, ranking 6th across the entire pool, while its notional change ranks #30. This combination suggests it isn’t just one coin moving on its own—it’s among the most unusual movers in the pool.
Price has closed near the top of the last 20 five-minute candles. The taker volume imbalance is 24.9%, and the buy/sell ratio is 1.66, with buyers firmly in control. 24-hour trading volume is 46.72M, so there’s enough depth.
Now it’s all about whether price can hold above the top of this range. If it’s a false breakout, OI will pull back first; with a genuine breakout, OI usually keeps building. Keep an eye on it.

·
--
$US took a pretty sharp tumble here.
It plunged 10.81% in 15 minutes, with volume reaching 9.44 times normal levels and volatility Z spiking to 5.52. The closing price broke below the lows of the last 20 five-minute candles. Net aggressive volume was -17.7%, and the buy/sell ratio was 0.70—selling pressure is very real.
But the interesting part is OI: 15-minute contract OI fell 0.50%, with notional down 468K; 1-hour contract OI fell 0.29%, with notional down 448K. Price down + OI down suggests this isn’t a selloff driven by new shorts entering. It looks more like longs getting flushed out—stop-loss cascades or active position cuts. The OI anomaly percentile is 94.8%, ranking #38 across the pool; notional change ranks #30. This has persisted for several consecutive periods, and there’s enough depth.
24-hour trading volume is 115M, so liquidity isn’t bad. But this kind of deleveraging-driven drop often hurts more than a short-led attack—because it’s your own side trampling itself.
Now it’s all about whether this level can hold. If OI keeps shrinking and the price keeps drifting lower, there may be a second leg down. Don’t rush to buy the dip; wait for the structure to form.
$US took a pretty sharp tumble here.
It plunged 10.81% in 15 minutes, with volume reaching 9.44 times normal levels and volatility Z spiking to 5.52. The closing price broke below the lows of the last 20 five-minute candles. Net aggressive volume was -17.7%, and the buy/sell ratio was 0.70—selling pressure is very real.
But the interesting part is OI: 15-minute contract OI fell 0.50%, with notional down 468K; 1-hour contract OI fell 0.29%, with notional down 448K. Price down + OI down suggests this isn’t a selloff driven by new shorts entering. It looks more like longs getting flushed out—stop-loss cascades or active position cuts. The OI anomaly percentile is 94.8%, ranking #38 across the pool; notional change ranks #30. This has persisted for several consecutive periods, and there’s enough depth.
24-hour trading volume is 115M, so liquidity isn’t bad. But this kind of deleveraging-driven drop often hurts more than a short-led attack—because it’s your own side trampling itself.
Now it’s all about whether this level can hold. If OI keeps shrinking and the price keeps drifting lower, there may be a second leg down. Don’t rush to buy the dip; wait for the structure to form.
It plunged 10.81% in 15 minutes, with volume reaching 9.44 times normal levels and volatility Z spiking to 5.52. The closing price broke below the lows of the last 20 five-minute candles. Net aggressive volume was -17.7%, and the buy/sell ratio was 0.70—selling pressure is very real.
But the interesting part is OI: 15-minute contract OI fell 0.50%, with notional down 468K; 1-hour contract OI fell 0.29%, with notional down 448K. Price down + OI down suggests this isn’t a selloff driven by new shorts entering. It looks more like longs getting flushed out—stop-loss cascades or active position cuts. The OI anomaly percentile is 94.8%, ranking #38 across the pool; notional change ranks #30. This has persisted for several consecutive periods, and there’s enough depth.
24-hour trading volume is 115M, so liquidity isn’t bad. But this kind of deleveraging-driven drop often hurts more than a short-led attack—because it’s your own side trampling itself.
Now it’s all about whether this level can hold. If OI keeps shrinking and the price keeps drifting lower, there may be a second leg down. Don’t rush to buy the dip; wait for the structure to form.
49
·
--
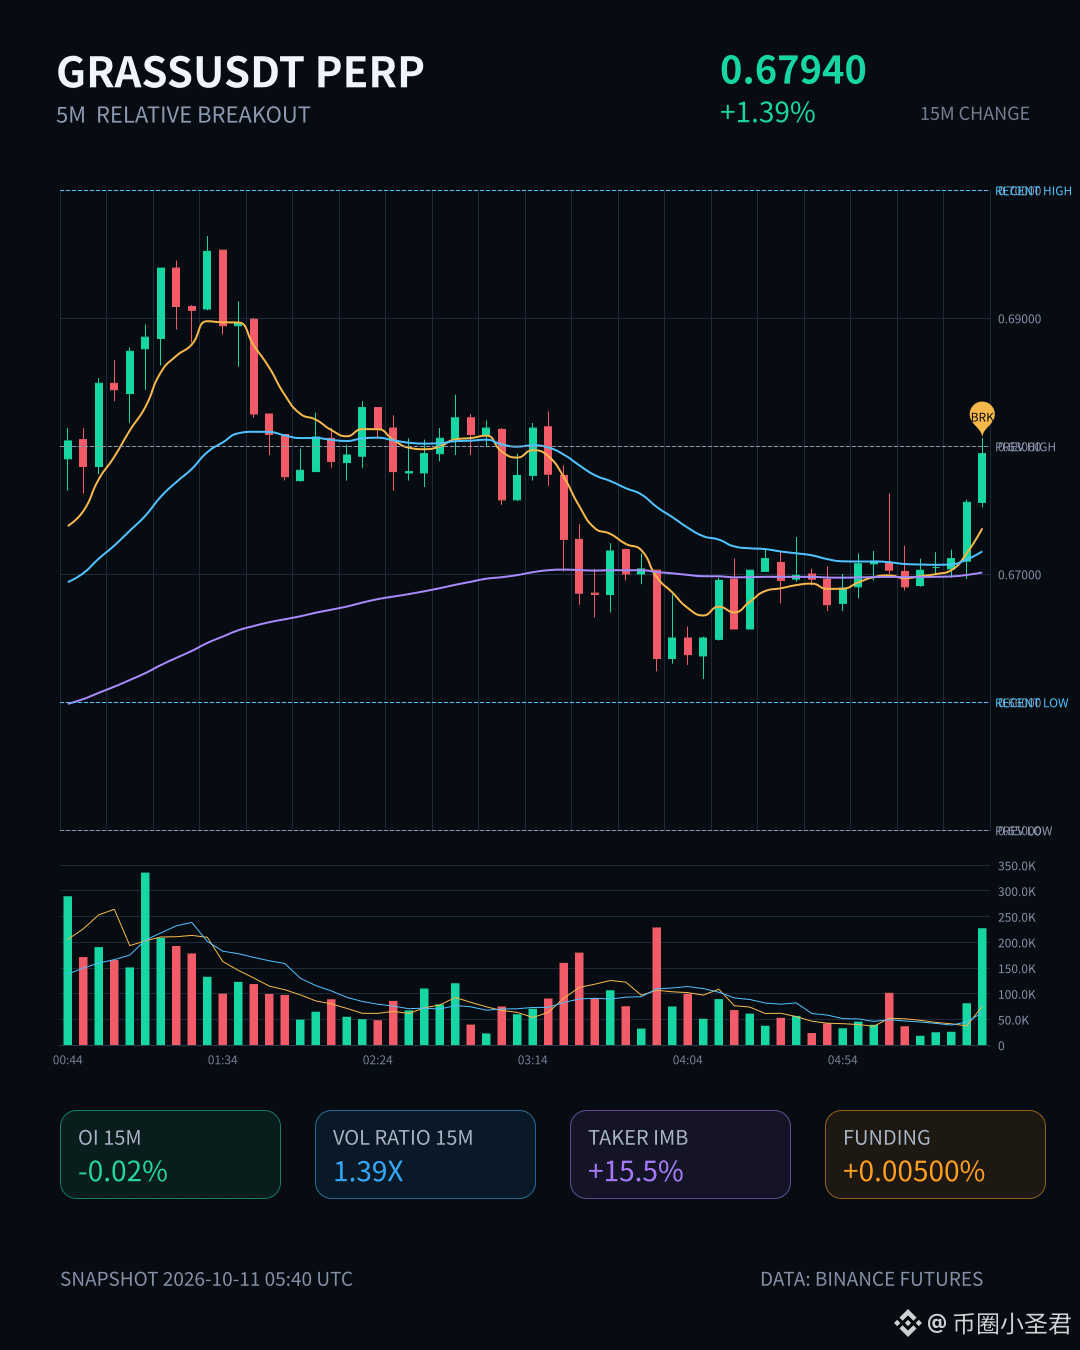
$GRASS Just now, the 5m candle closed above the upper bound of the range formed by nearly 20 candles. Aggressive buying is clearly dominant, with a buy/sell ratio of 1.37—capital is driving the move.
One detail is worth watching: OI is falling rather than rising, down 0.02% on 15m contracts and 0.03% on 1h contracts. Price is rising while open interest is falling, a combination that looks more like a short-covering rally than fresh longs entering and building positions.
The anomaly percentile across the entire pool is #79.6, and the notional change is #30. These aren’t top-tier signals, but given the breakout structure, it’s worth watching in the short term to see whether volume follows through.
If OI continues to lag, the sustainability of this short-covering rally is questionable.
$GRASS Just now, the 5m candle closed above the upper bound of the range formed by nearly 20 candles. Aggressive buying is clearly dominant, with a buy/sell ratio of 1.37—capital is driving the move.
One detail is worth watching: OI is falling rather than rising, down 0.02% on 15m contracts and 0.03% on 1h contracts. Price is rising while open interest is falling, a combination that looks more like a short-covering rally than fresh longs entering and building positions.
The anomaly percentile across the entire pool is #79.6, and the notional change is #30. These aren’t top-tier signals, but given the breakout structure, it’s worth watching in the short term to see whether volume follows through.
If OI continues to lag, the sustainability of this short-covering rally is questionable.
One detail is worth watching: OI is falling rather than rising, down 0.02% on 15m contracts and 0.03% on 1h contracts. Price is rising while open interest is falling, a combination that looks more like a short-covering rally than fresh longs entering and building positions.
The anomaly percentile across the entire pool is #79.6, and the notional change is #30. These aren’t top-tier signals, but given the breakout structure, it’s worth watching in the short term to see whether volume follows through.
If OI continues to lag, the sustainability of this short-covering rally is questionable.
8
·
--
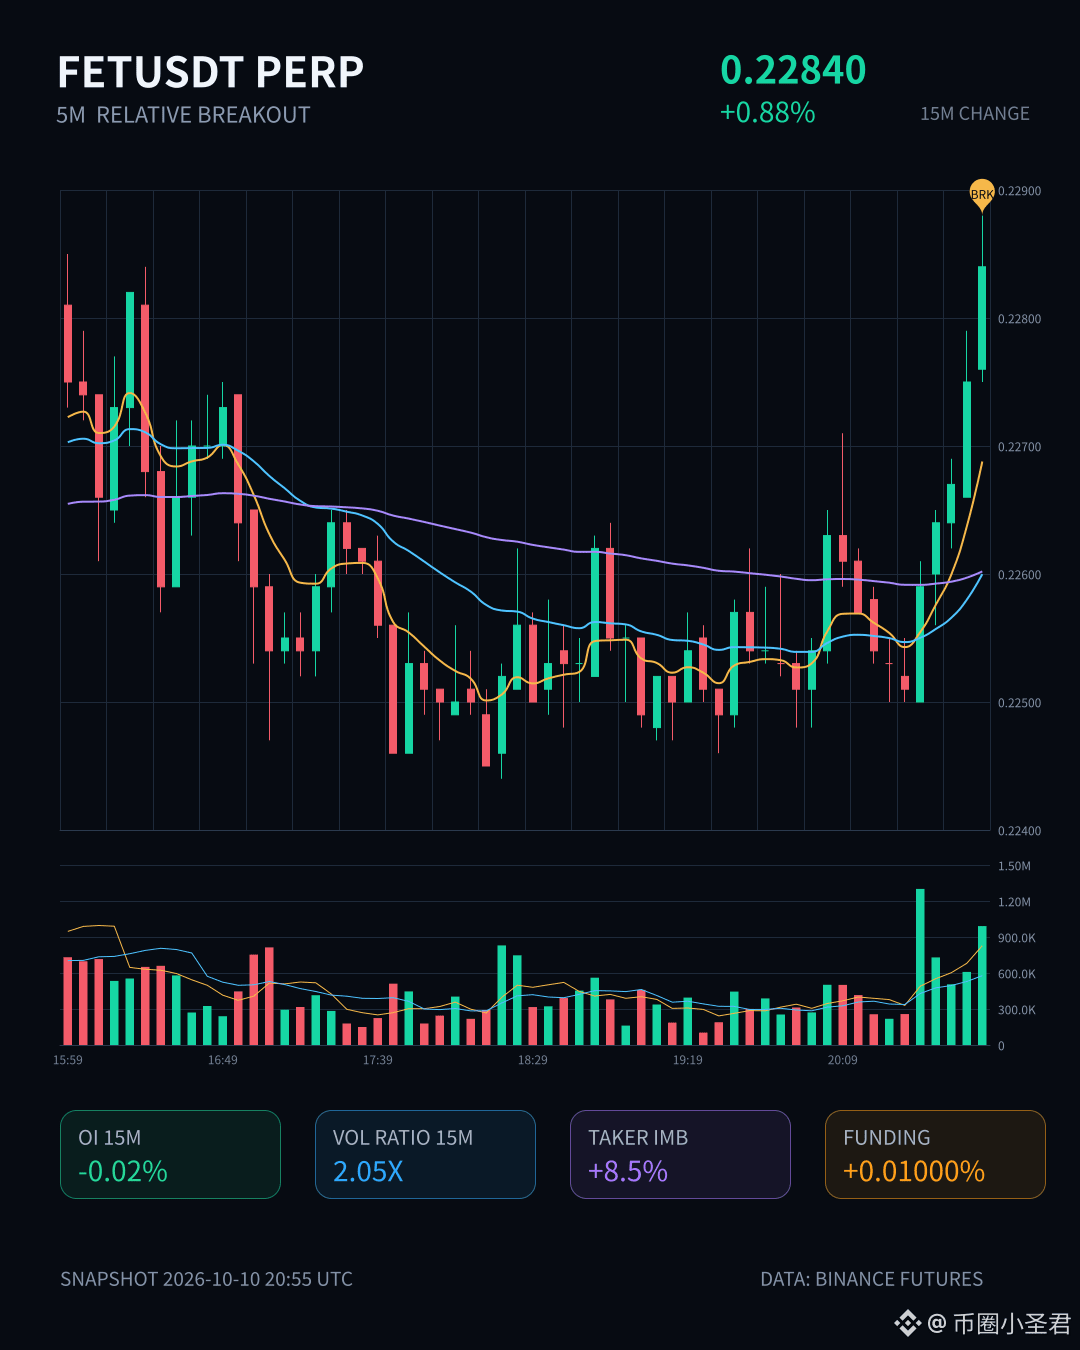
$FET This 15m move is interesting: price rose 0.88%, volume jumped to 2.05x, and the Z-score hit 2.52. The close also broke above the highs of nearly 20 recent 5m candles. But OI didn't follow—in fact, 15m futures OI slipped 0.02%, while 1h OI managed only a modest +0.67%. This is a classic short-covering setup, not fresh longs entering; shorts are getting squeezed.
The taker flow imbalance is 8.5%, with a buy/sell ratio of 1.19—buy-leaning, but not aggressive. The anomaly percentile across the full pool is 82.3%; nominal change ranks #30 and anomaly ranks #19. It's stayed elevated for several consecutive periods, and that persistence is more credible than a one-off spike.
24h trading volume is 54.87M, so liquidity is sufficient. The key is whether OI can shift from covering to genuine position opening. Otherwise, this could be a one-and-done move. Keep an eye on it.
$FET This 15m move is interesting: price rose 0.88%, volume jumped to 2.05x, and the Z-score hit 2.52. The close also broke above the highs of nearly 20 recent 5m candles. But OI didn't follow—in fact, 15m futures OI slipped 0.02%, while 1h OI managed only a modest +0.67%. This is a classic short-covering setup, not fresh longs entering; shorts are getting squeezed.
The taker flow imbalance is 8.5%, with a buy/sell ratio of 1.19—buy-leaning, but not aggressive. The anomaly percentile across the full pool is 82.3%; nominal change ranks #30 and anomaly ranks #19. It's stayed elevated for several consecutive periods, and that persistence is more credible than a one-off spike.
24h trading volume is 54.87M, so liquidity is sufficient. The key is whether OI can shift from covering to genuine position opening. Otherwise, this could be a one-and-done move. Keep an eye on it.
The taker flow imbalance is 8.5%, with a buy/sell ratio of 1.19—buy-leaning, but not aggressive. The anomaly percentile across the full pool is 82.3%; nominal change ranks #30 and anomaly ranks #19. It's stayed elevated for several consecutive periods, and that persistence is more credible than a one-off spike.
24h trading volume is 54.87M, so liquidity is sufficient. The key is whether OI can shift from covering to genuine position opening. Otherwise, this could be a one-and-done move. Keep an eye on it.
12
·
--
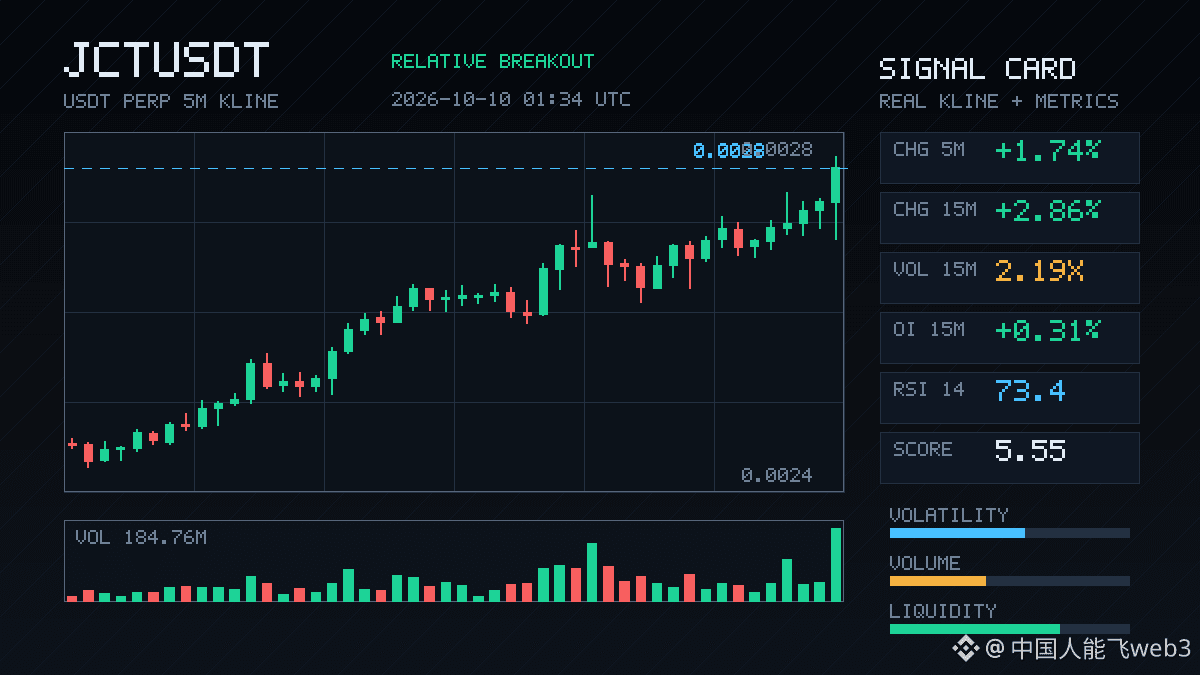
JCT’s 15m move up was pretty decisive. A 2.86% gain isn’t outrageous, but volume jumped straight to 2.19x, with price and OI moving up together.
There are clear signs of new leveraged longs joining in—not the kind of move where spot buying pushes the price up and then nobody follows through. Its notional change ranks #30 across the whole pool, with an anomaly percentile of 73%. 24h trading volume is 132M, and liquidity is sufficient.
A 5m candle just closed above the upper boundary of the past 20 candles’ range. Aggressive trade delta is +9.5%, and the buy/sell ratio is 1.21, giving buyers a slight short-term edge. If this structure keeps moving up, the key is whether a pullback can hold the range boundary it just broke through. If it’s a false breakout, OI will fall along with it.
Keep an eye on it, but don’t chase.
JCT’s 15m move up was pretty decisive. A 2.86% gain isn’t outrageous, but volume jumped straight to 2.19x, with price and OI moving up together.
There are clear signs of new leveraged longs joining in—not the kind of move where spot buying pushes the price up and then nobody follows through. Its notional change ranks #30 across the whole pool, with an anomaly percentile of 73%. 24h trading volume is 132M, and liquidity is sufficient.
A 5m candle just closed above the upper boundary of the past 20 candles’ range. Aggressive trade delta is +9.5%, and the buy/sell ratio is 1.21, giving buyers a slight short-term edge. If this structure keeps moving up, the key is whether a pullback can hold the range boundary it just broke through. If it’s a false breakout, OI will fall along with it.
Keep an eye on it, but don’t chase.
There are clear signs of new leveraged longs joining in—not the kind of move where spot buying pushes the price up and then nobody follows through. Its notional change ranks #30 across the whole pool, with an anomaly percentile of 73%. 24h trading volume is 132M, and liquidity is sufficient.
A 5m candle just closed above the upper boundary of the past 20 candles’ range. Aggressive trade delta is +9.5%, and the buy/sell ratio is 1.21, giving buyers a slight short-term edge. If this structure keeps moving up, the key is whether a pullback can hold the range boundary it just broke through. If it’s a false breakout, OI will fall along with it.
Keep an eye on it, but don’t chase.
57
·
--
$MUBARAK This move is interesting.
Down 1.12% over 15m, with volume up to 1.89x and volatility Z jumping straight to 2.42—this isn't a slow bleed; someone is actively selling at this level. More importantly, OI hasn't fallen, and even edged up 0.03% over 1h. Price down, open interest up: a classic sign of new short positions entering, not a cascade of longs closing out.
The close has already broken below the lower bound of the last 20 5m candles. Aggressive trade delta is -22.8%, the buy/sell ratio is 0.63, and sellers are keeping up the pressure. 24h trading volume is 36.98M, so liquidity is sufficient. But an all-pool anomaly ranked #26 and a notional change ranking of #30 suggest this isn't an isolated event—capital is moving through the pool.
An OI anomaly percentile of 69.2% isn't extreme, but combined with the high-volume breakdown, there could be another leg down in the short term if this range's lower boundary doesn't hold. Don't rush to buy the dip; wait for the aggressive buy/sell ratio to turn back up.
$MUBARAK This move is interesting.
Down 1.12% over 15m, with volume up to 1.89x and volatility Z jumping straight to 2.42—this isn't a slow bleed; someone is actively selling at this level. More importantly, OI hasn't fallen, and even edged up 0.03% over 1h. Price down, open interest up: a classic sign of new short positions entering, not a cascade of longs closing out.
The close has already broken below the lower bound of the last 20 5m candles. Aggressive trade delta is -22.8%, the buy/sell ratio is 0.63, and sellers are keeping up the pressure. 24h trading volume is 36.98M, so liquidity is sufficient. But an all-pool anomaly ranked #26 and a notional change ranking of #30 suggest this isn't an isolated event—capital is moving through the pool.
An OI anomaly percentile of 69.2% isn't extreme, but combined with the high-volume breakdown, there could be another leg down in the short term if this range's lower boundary doesn't hold. Don't rush to buy the dip; wait for the aggressive buy/sell ratio to turn back up.
Down 1.12% over 15m, with volume up to 1.89x and volatility Z jumping straight to 2.42—this isn't a slow bleed; someone is actively selling at this level. More importantly, OI hasn't fallen, and even edged up 0.03% over 1h. Price down, open interest up: a classic sign of new short positions entering, not a cascade of longs closing out.
The close has already broken below the lower bound of the last 20 5m candles. Aggressive trade delta is -22.8%, the buy/sell ratio is 0.63, and sellers are keeping up the pressure. 24h trading volume is 36.98M, so liquidity is sufficient. But an all-pool anomaly ranked #26 and a notional change ranking of #30 suggest this isn't an isolated event—capital is moving through the pool.
An OI anomaly percentile of 69.2% isn't extreme, but combined with the high-volume breakdown, there could be another leg down in the short term if this range's lower boundary doesn't hold. Don't rush to buy the dip; wait for the aggressive buy/sell ratio to turn back up.
44

·
--
$SUI The most twisted part isn’t that it dropped 8.36%—it’s that it used just one month to pull from 0.70 to 1.21, and then in two days it pushed the people who chased in back down to 1.03. The ones who missed the move are afraid this is only a pullback; the ones who chased in are afraid that the volume spike at 1.19 is a short-term top. Both 30 days +25.35% and one year -71.14% are true at the same time, which suggests this move is more like a repair after oversold, not a confirmation of a new cycle. Its market cap ranks at #30, and 24-hour trading volume of 886 million isn’t small—but on down days it saw higher volume, so don’t rush to read it as just a washout.
What I really care about is the level at 1.00. The 24-hour low is 0.9986, already right up against the psychological line. If it next holds there with reduced volume, the earlier high turnover can still be explained as a redistribution of positions. But if it breaks down on higher volume, the drop from 1.21 to now looks even more like a failed attempt at an “alpha” reversion. From the ATH, it’s still down -80.79%—the room to move is about the narrative, not a safety cushion.
Now it’s a choice: A, wait for the price to stabilize near 1.00 on lower volume; B, wait until it reclaims above 1.15 on higher volume before considering anything; C, give up directly and wait for the 30-day trend to lift again. Which one do you pick?
$SUI The most twisted part isn’t that it dropped 8.36%—it’s that it used just one month to pull from 0.70 to 1.21, and then in two days it pushed the people who chased in back down to 1.03. The ones who missed the move are afraid this is only a pullback; the ones who chased in are afraid that the volume spike at 1.19 is a short-term top. Both 30 days +25.35% and one year -71.14% are true at the same time, which suggests this move is more like a repair after oversold, not a confirmation of a new cycle. Its market cap ranks at #30, and 24-hour trading volume of 886 million isn’t small—but on down days it saw higher volume, so don’t rush to read it as just a washout.
What I really care about is the level at 1.00. The 24-hour low is 0.9986, already right up against the psychological line. If it next holds there with reduced volume, the earlier high turnover can still be explained as a redistribution of positions. But if it breaks down on higher volume, the drop from 1.21 to now looks even more like a failed attempt at an “alpha” reversion. From the ATH, it’s still down -80.79%—the room to move is about the narrative, not a safety cushion.
Now it’s a choice: A, wait for the price to stabilize near 1.00 on lower volume; B, wait until it reclaims above 1.15 on higher volume before considering anything; C, give up directly and wait for the 30-day trend to lift again. Which one do you pick?
What I really care about is the level at 1.00. The 24-hour low is 0.9986, already right up against the psychological line. If it next holds there with reduced volume, the earlier high turnover can still be explained as a redistribution of positions. But if it breaks down on higher volume, the drop from 1.21 to now looks even more like a failed attempt at an “alpha” reversion. From the ATH, it’s still down -80.79%—the room to move is about the narrative, not a safety cushion.
Now it’s a choice: A, wait for the price to stabilize near 1.00 on lower volume; B, wait until it reclaims above 1.15 on higher volume before considering anything; C, give up directly and wait for the 30-day trend to lift again. Which one do you pick?
19
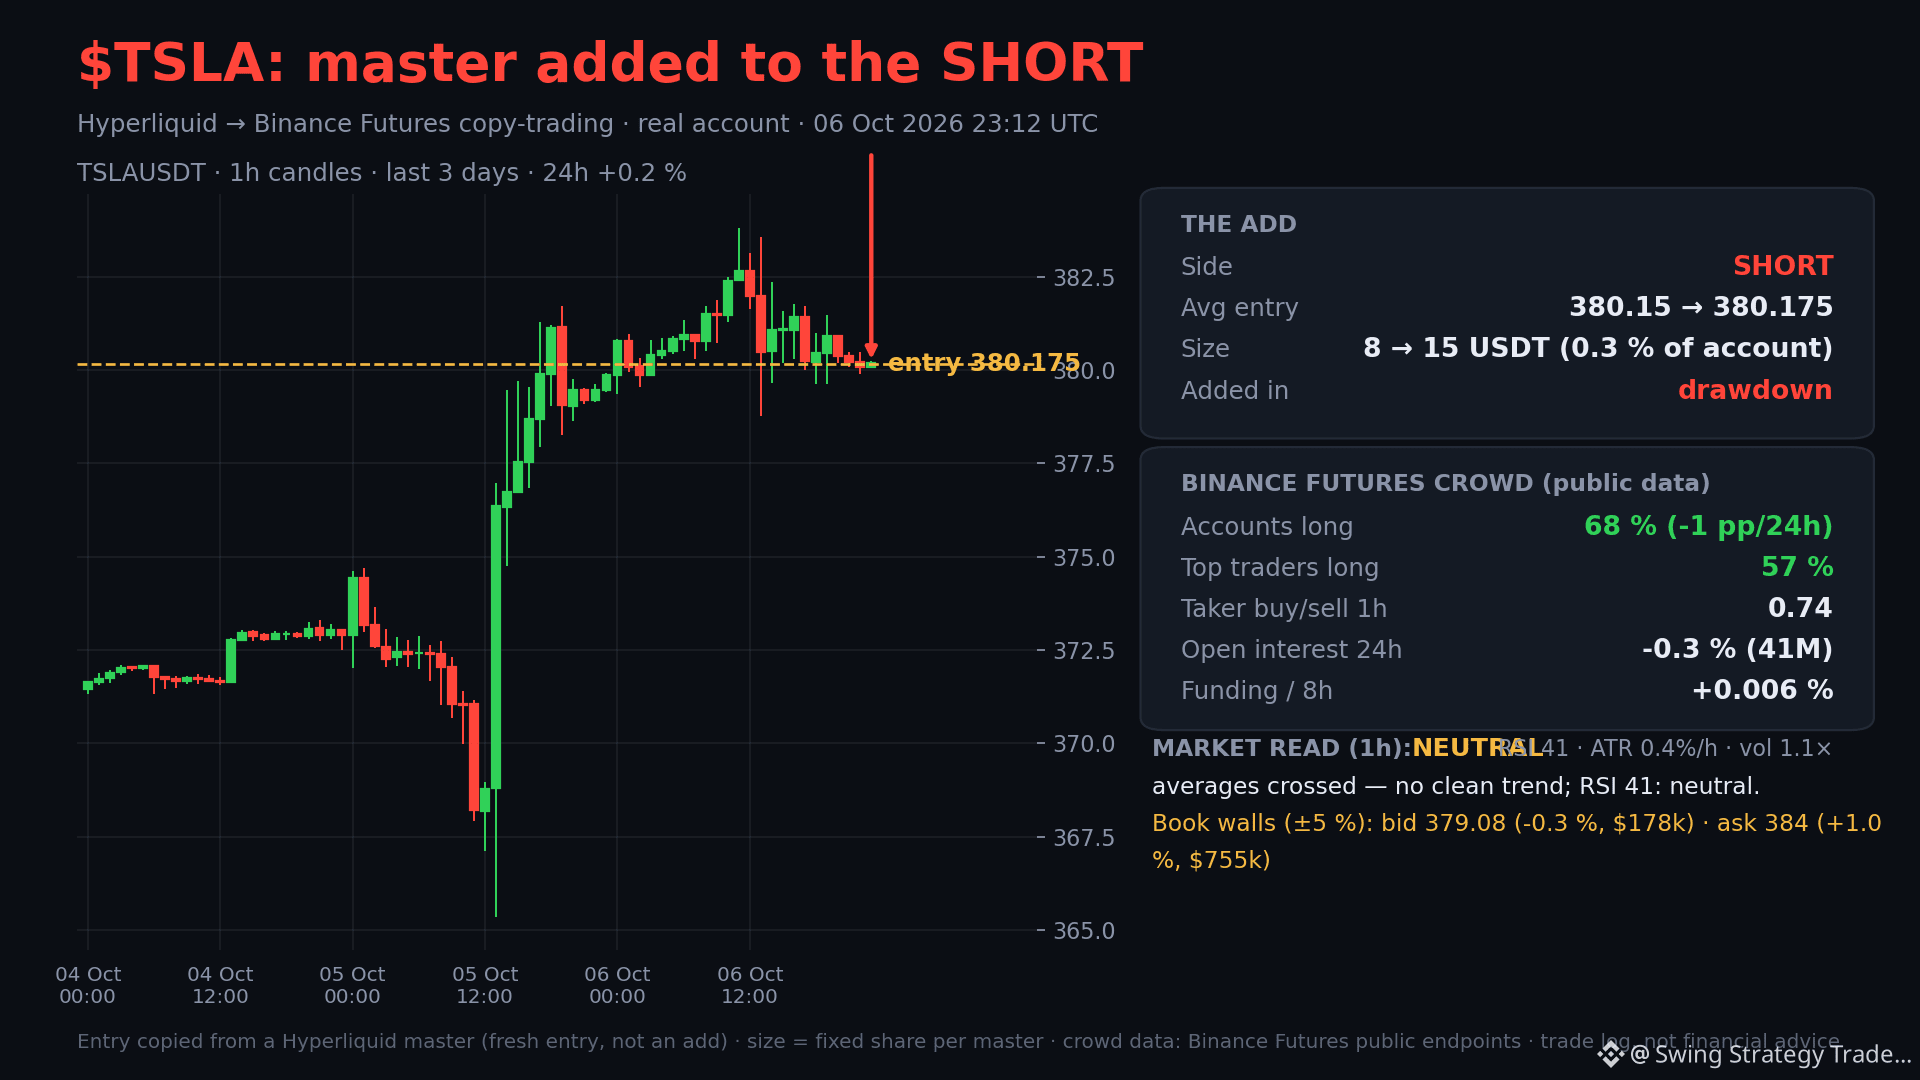
🔴 Master #30 added to the SHORT $TSLA: 8 → 15 USDT on our side (0.3 % of the account), average entry 380.15 → 380.175.
The add came in drawdown. Our rule: adds are copied only inside legs we already hold; we never join a master's existing losing position from outside.
If you copy by API like we do, or just want these entries and exits as they happen, we keep a small group on Binance: https://app.binance.com/uni-qr/DpuA7yYD
🔴 Master #30 added to the SHORT $TSLA : 8 → 15 USDT on our side (0.3 % of the account), average entry 380.15 → 380.175.
The add came in drawdown. Our rule: adds are copied only inside legs we already hold; we never join a master's existing losing position from outside.
If you copy by API like we do, or just want these entries and exits as they happen, we keep a small group on Binance: https://app.binance.com/uni-qr/DpuA7yYD
The add came in drawdown. Our rule: adds are copied only inside legs we already hold; we never join a master's existing losing position from outside.
If you copy by API like we do, or just want these entries and exits as they happen, we keep a small group on Binance: https://app.binance.com/uni-qr/DpuA7yYD
37
Log in to explore more content
Join global crypto users on Binance Square
⚡️ Get latest and useful information about crypto.
💬 Trusted by the world’s largest crypto exchange.
👍 Discover real insights from verified creators.
Email / Phone number
Trending Topics
1
#FedWatch
16.4M views
39,835 Discussing
2
#EarningsSeason
6.5M views
32,533 Discussing
3
#USMidtermElections
67,265 views
835 Discussing
4
#StrategySTRCReaches$99.95ForFirstTimeIn165Days
76 views
5 Discussing
5
#BinanceWillListPredictPREDICT
2,206 views
104 Discussing
6
#SwitzerlandFirstSpotBitcoinETFExpectedToTradeInNovember
210 views
17 Discussing
7
#StrategyReports$21BQ3OperatingProfit
93 views
7 Discussing
8
#TwoAddressesHoldingAbout1.28BUSDTFrozen
39 views
17 Discussing
9
#FirstDigitalBlacklistsAttackerAddressHoldingAbout3.4MFDUSD
66 views
5 Discussing
10
#BitcoinDropsBelow$80K
46,564 views
145 Discussing